Does height and foot length correlate?

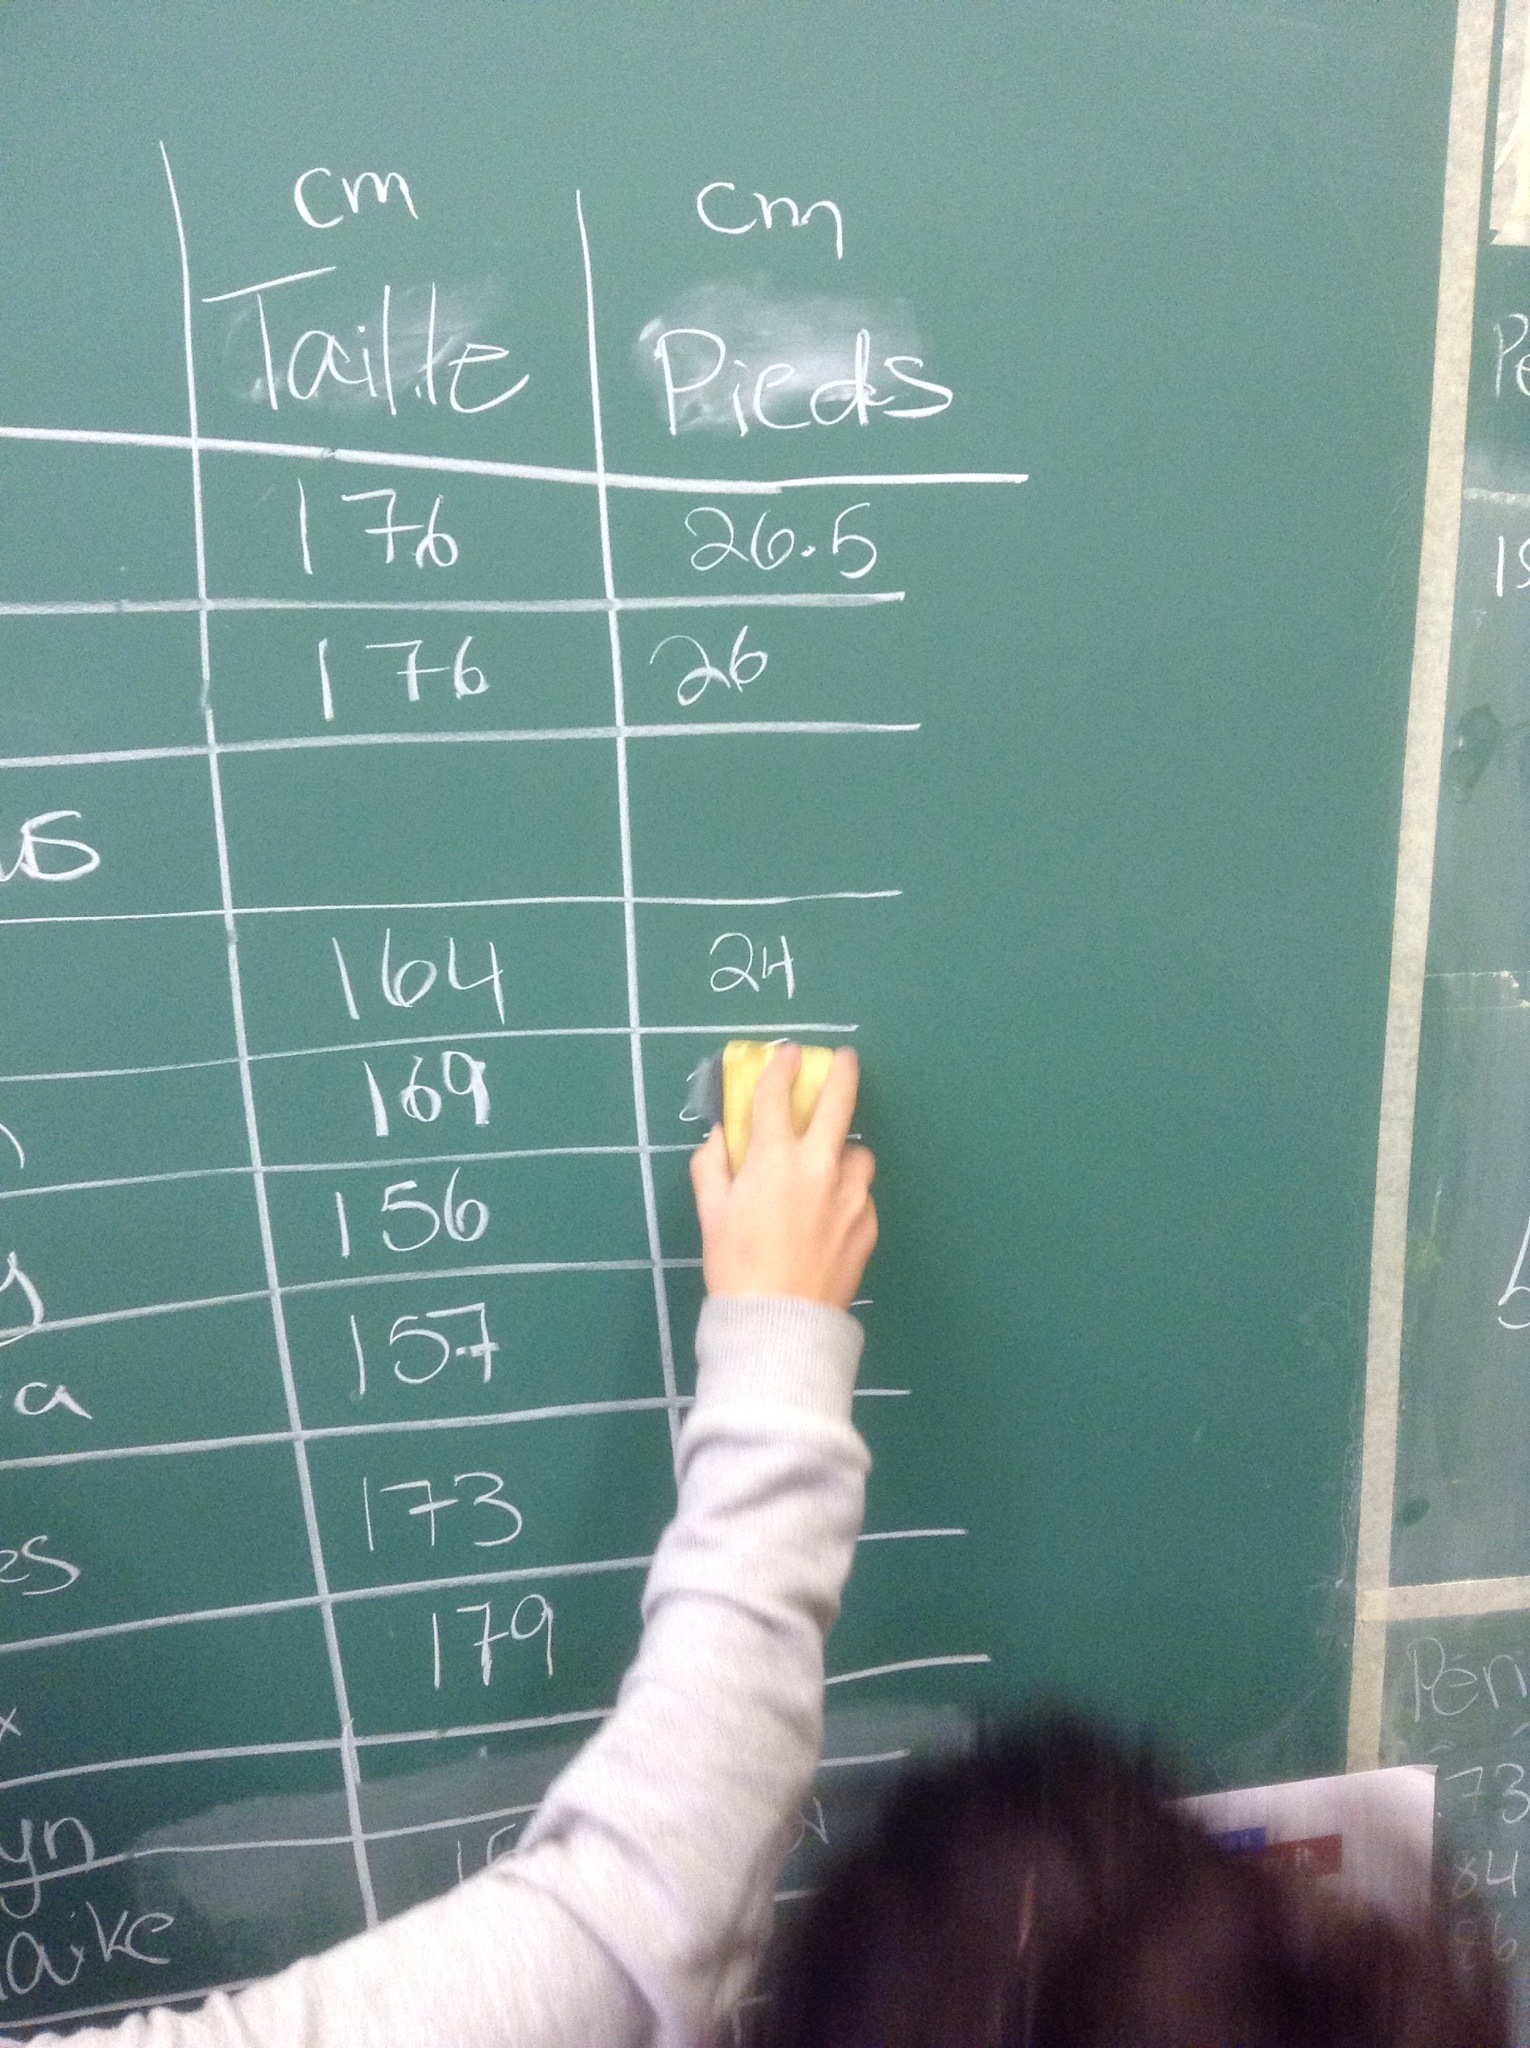
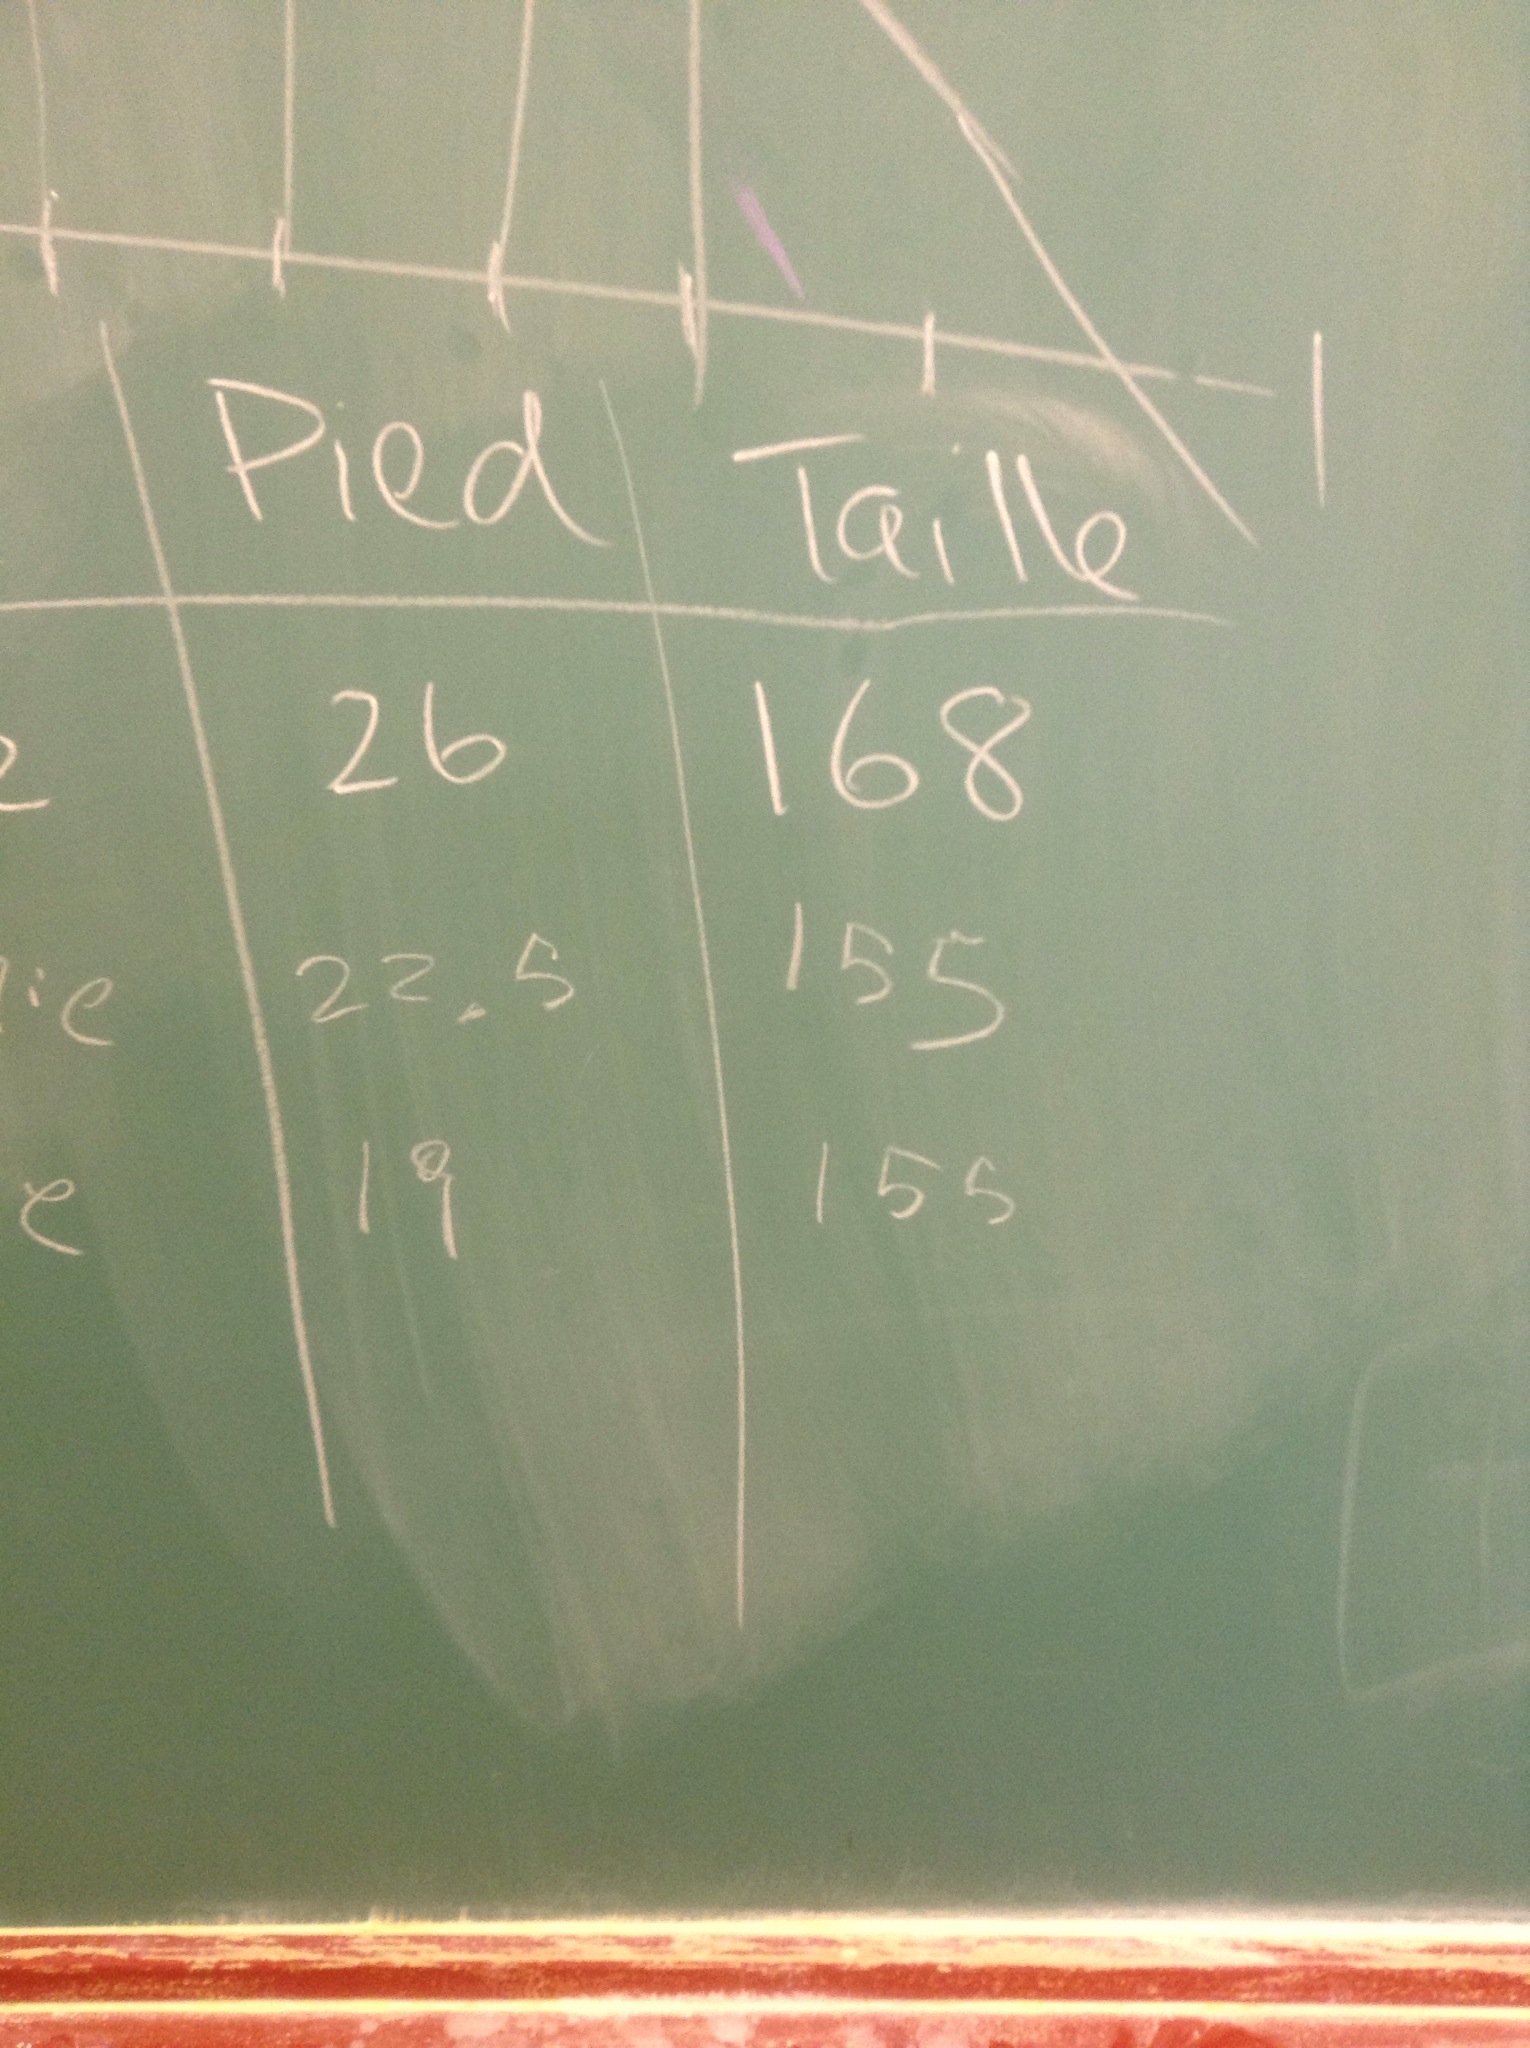
We measured our heights, and the length of our feet.

And made a table of data.
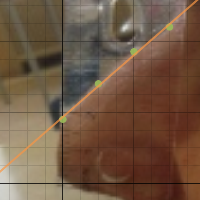
We graphed our data and found the equation for the line of best fit.
We’re getting faster at analyzing the data we are collecting, and we’re getting better at making predictions from graphs and from equations.
Desmos per. c


Nose math
Desmos does Regressions!
When you have data to graph in a scatter plot, it is now possible to get the equation of the best fit line using desmos.com (free software/app). You will see the best fit line with equation on the side bar.

Here’s the data set for the grade 9 math candle investigation. It’s possible to make the equations of the lines of best fit by calculating the slope and y intercept, but it’s also possible to use desmos to help you check your work.
The nitty gritty:
You need to enter your data in a table first. The headers of the columns will be x1 and y1.
To do a regression create an expression and type in y1~mx1+b and the line of best fit will appear. It is a new feature of desmos, and a very useful one too!
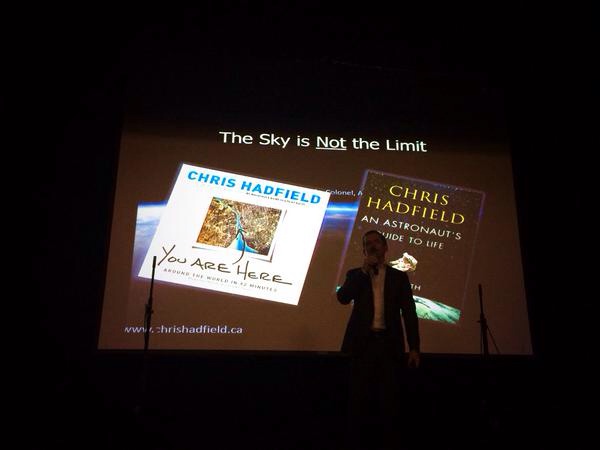
Some Days Are Pretty Special
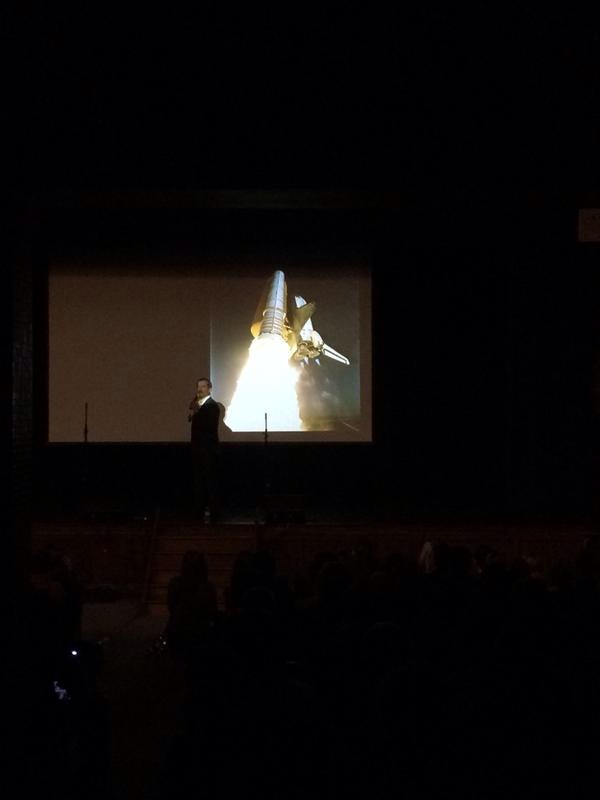
Today we had Cmdr. Chris Hadfield come speak at our school.

It was a full house as we gathered in the auditorium to hear his story of being in space, and how he made the choices he did to lead him to such a remarkable career.
 (no photos were taken during the presentation…this is the “before” shot)
Here are pictures from the @limestonedsb twitter feed documenting the presentation.

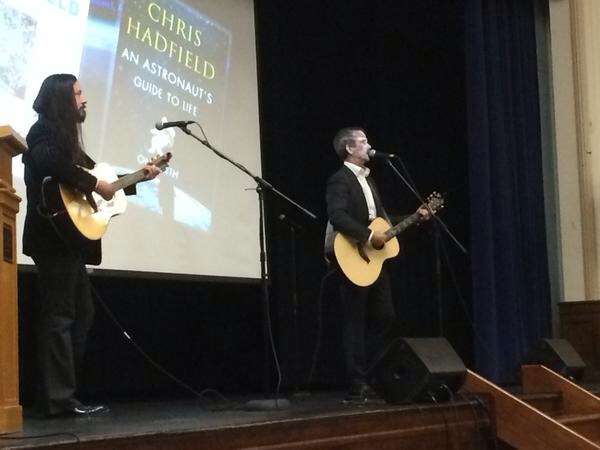
He was joined on stage by Rob Baker of the Tragically Hip as they performed his song “Space Oddity”
Here’s how the @limestonedsb saw it.
For all who have not yet done so, follow him on Facebook and Twitter and see the collection of inspiring photos he took while in space.
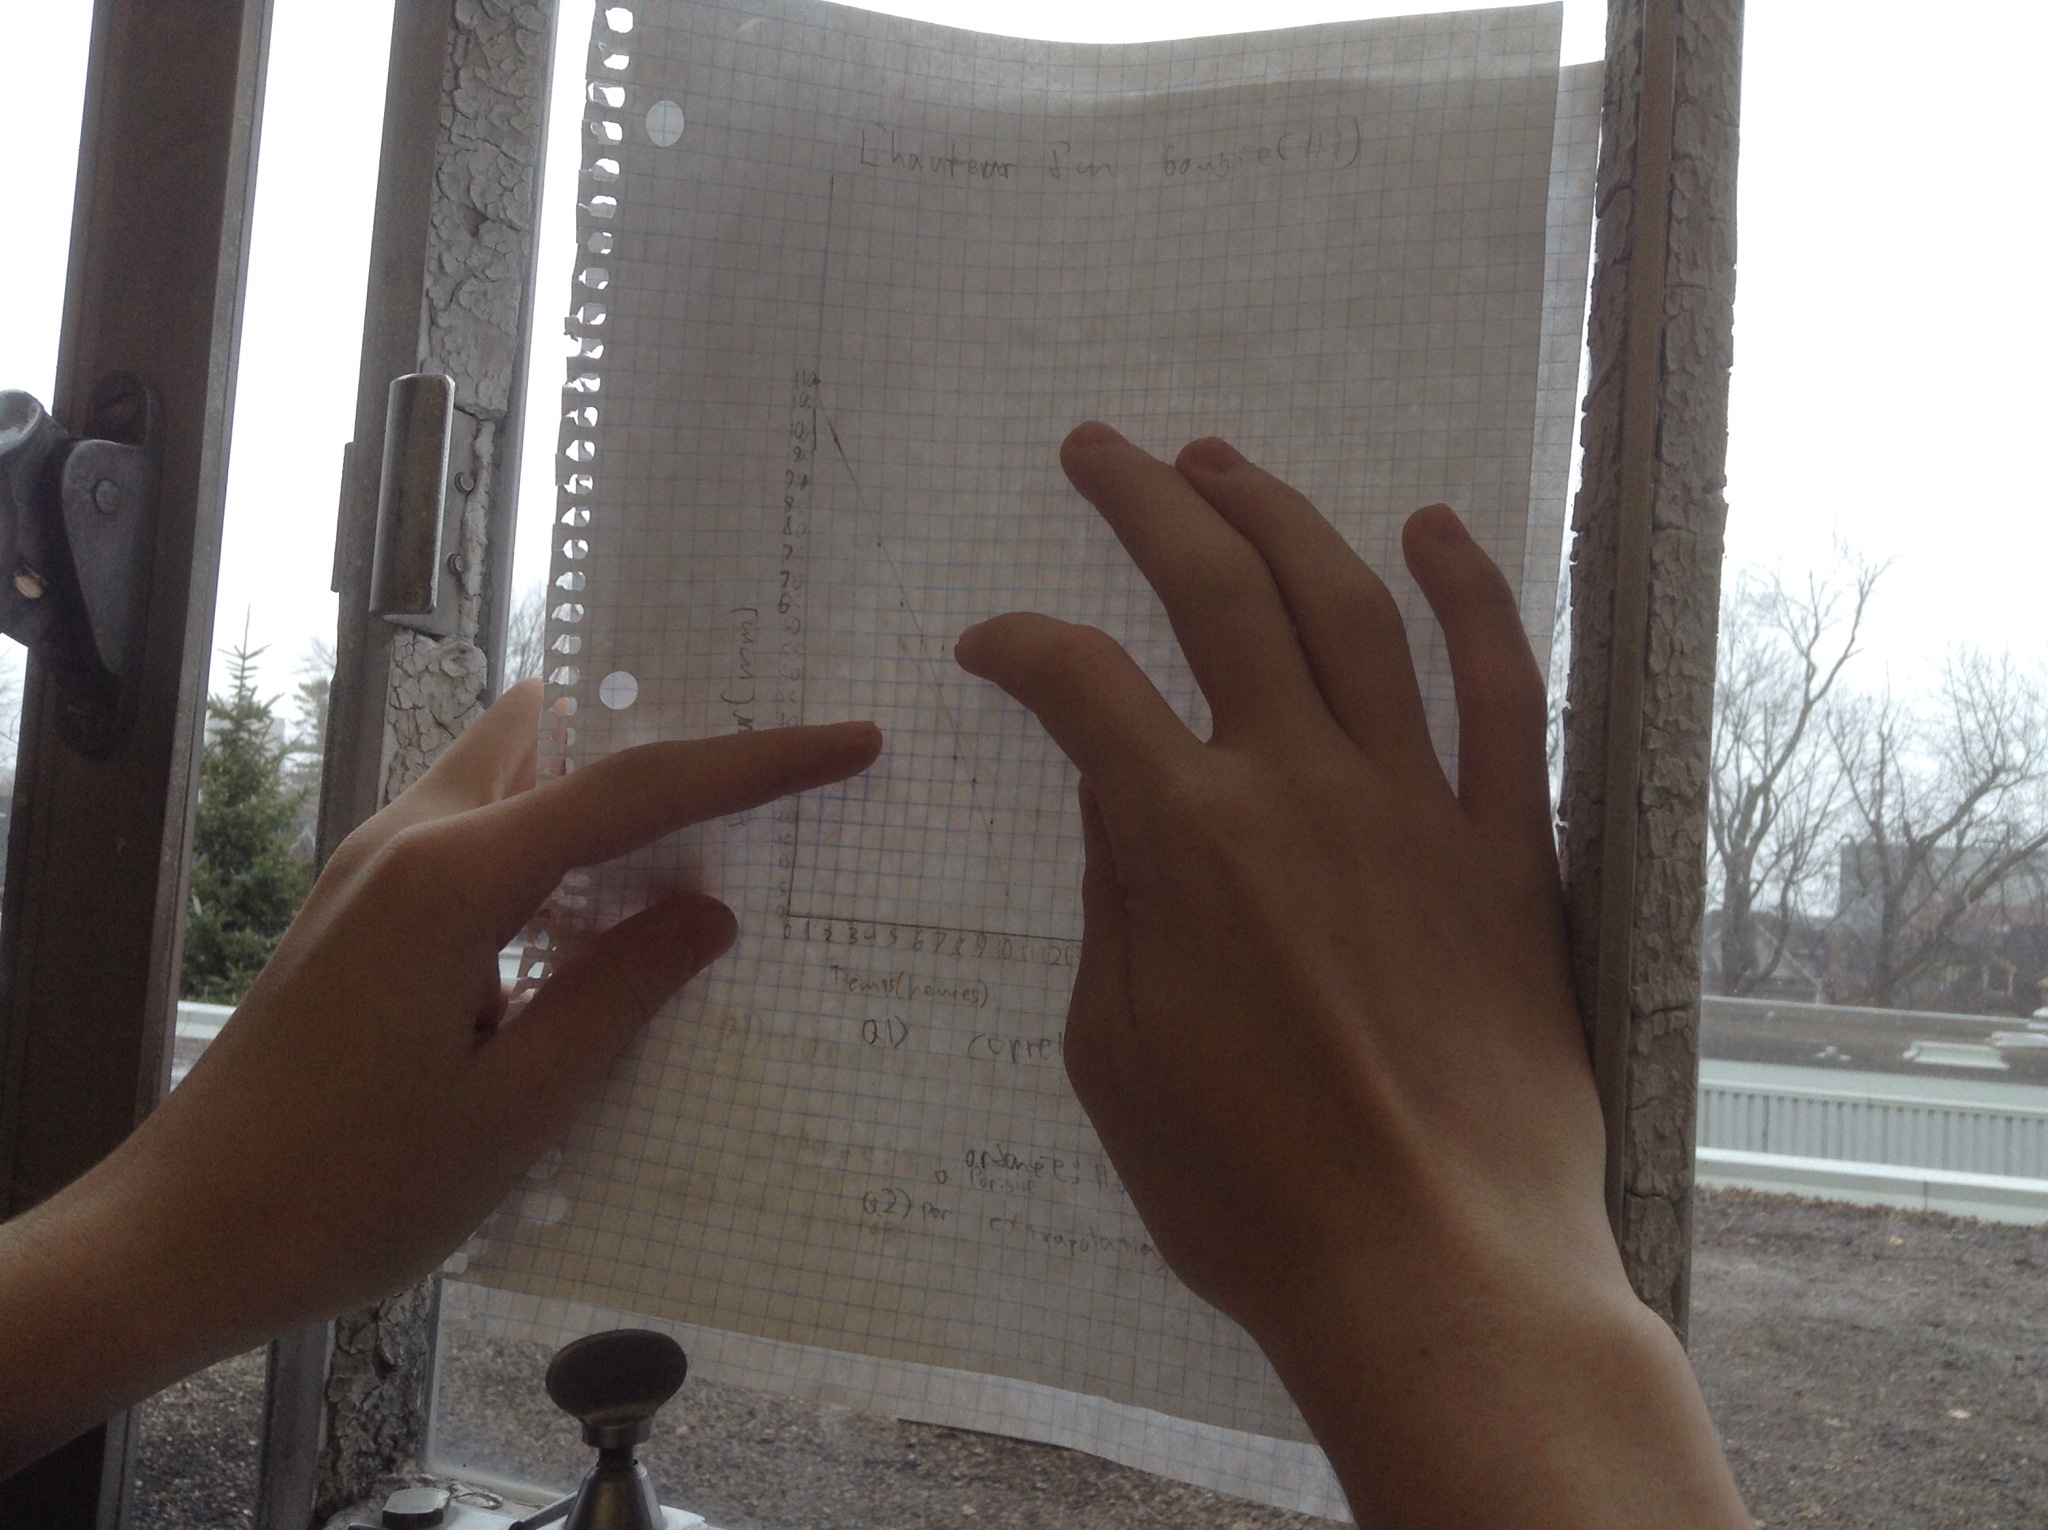
Fnding the Point of Intersection
Sometimes we want to compare two graphs, but don’t want to spend the time to recopy all the data again. If the axes are scaled in the same way, we can superimpose the two graphs at the window!
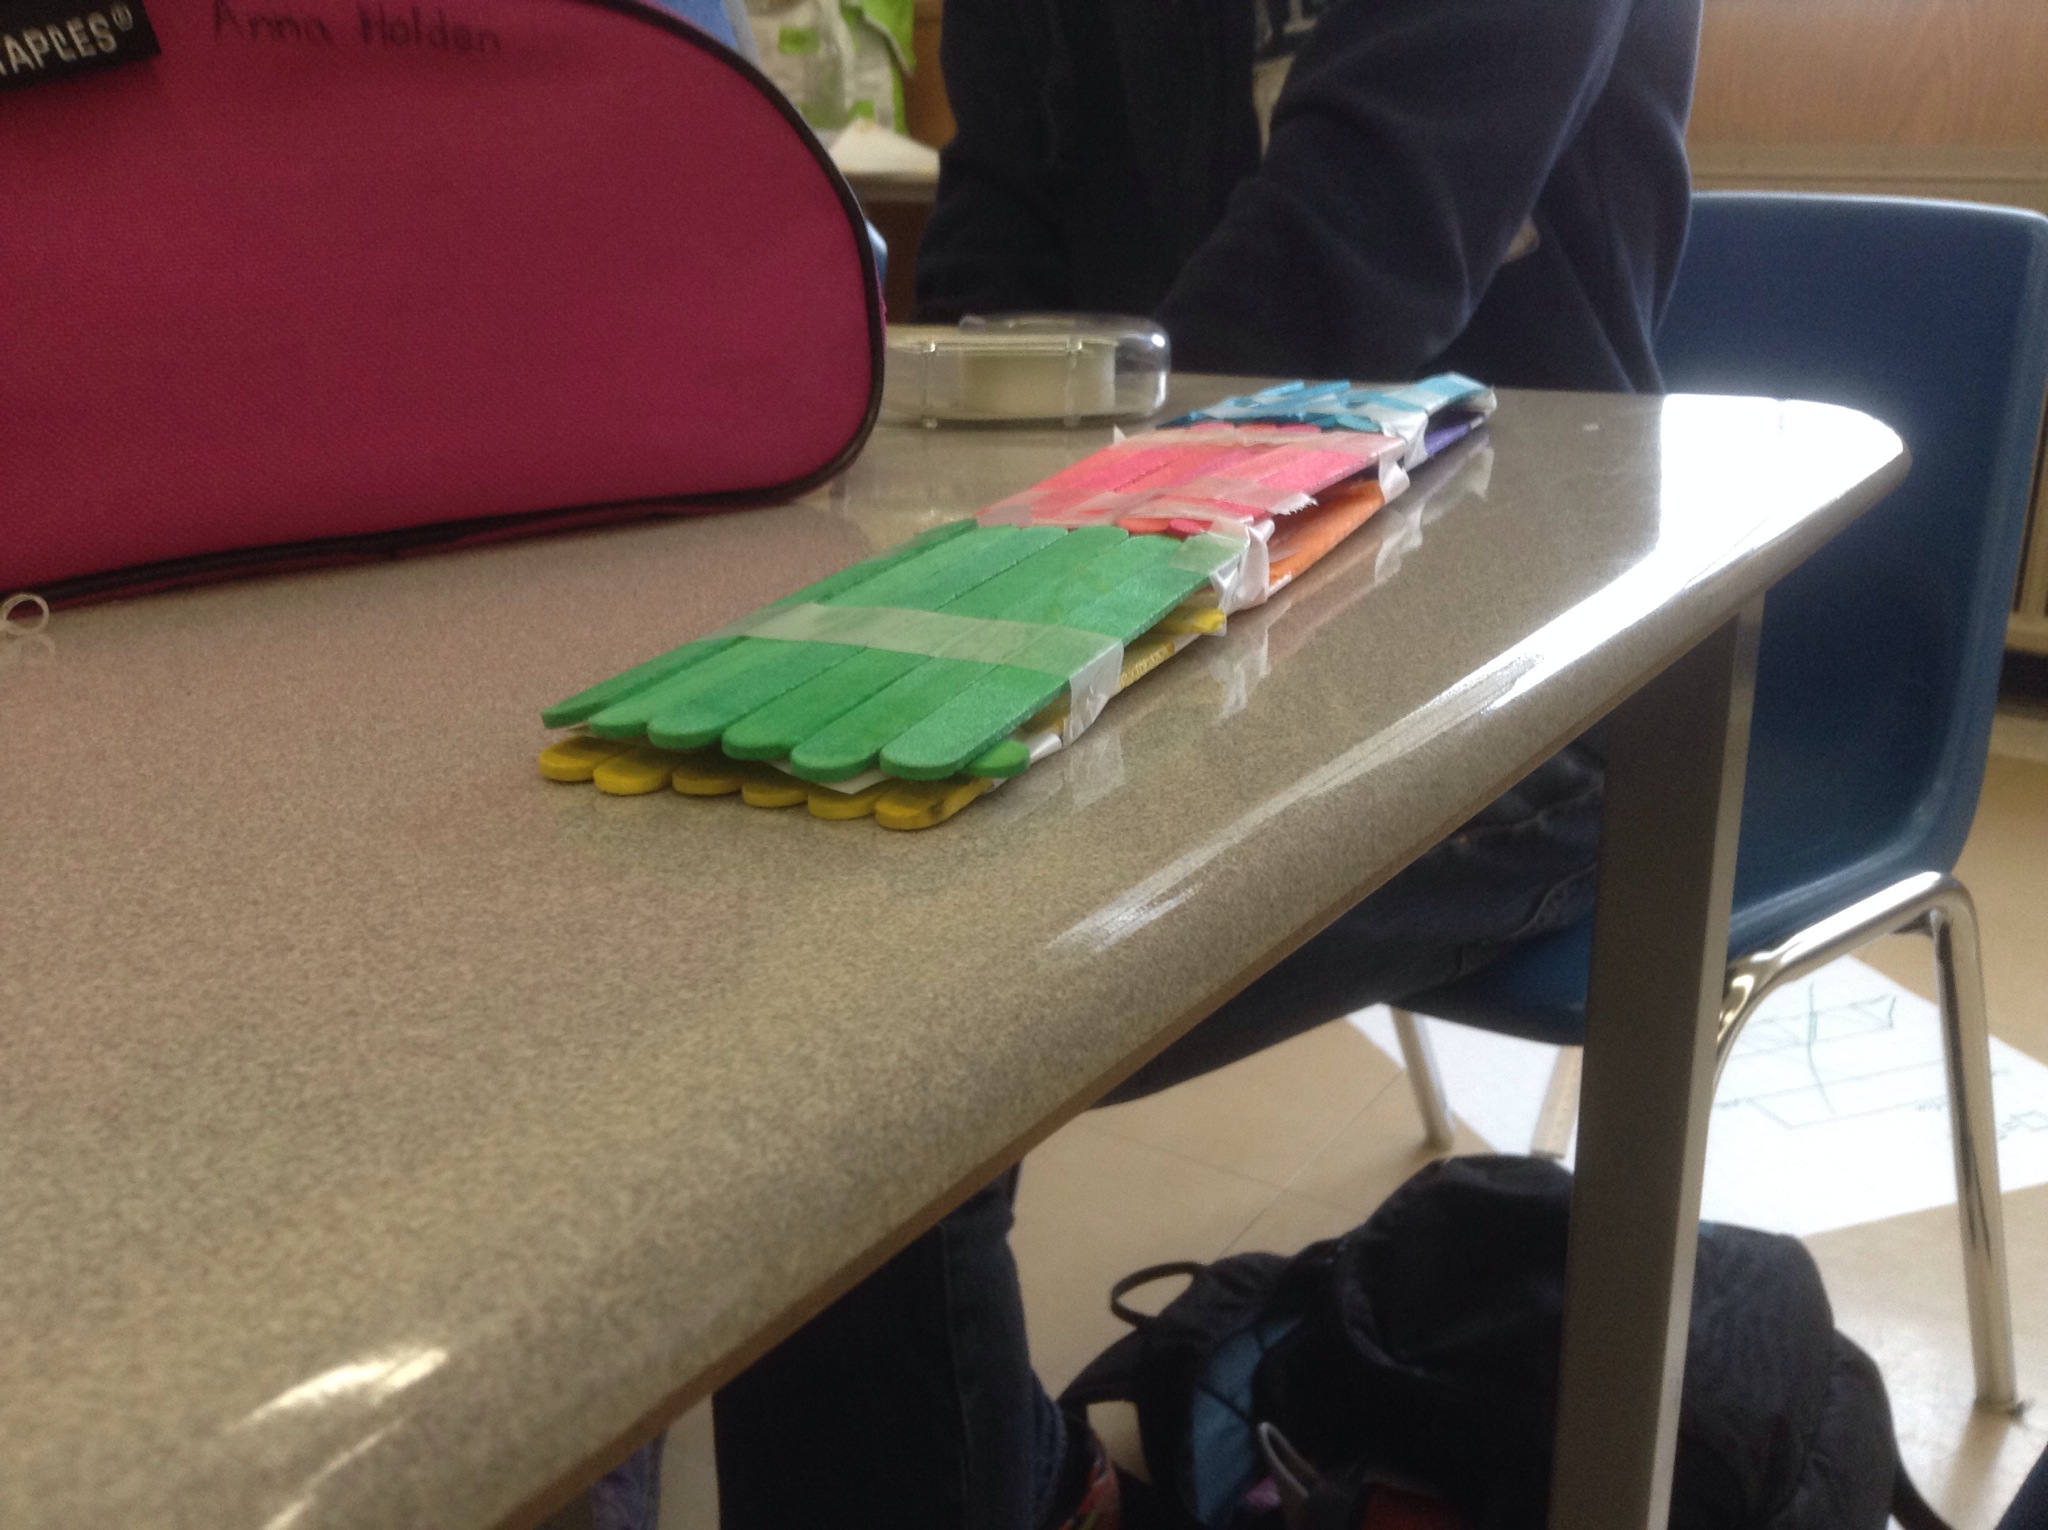
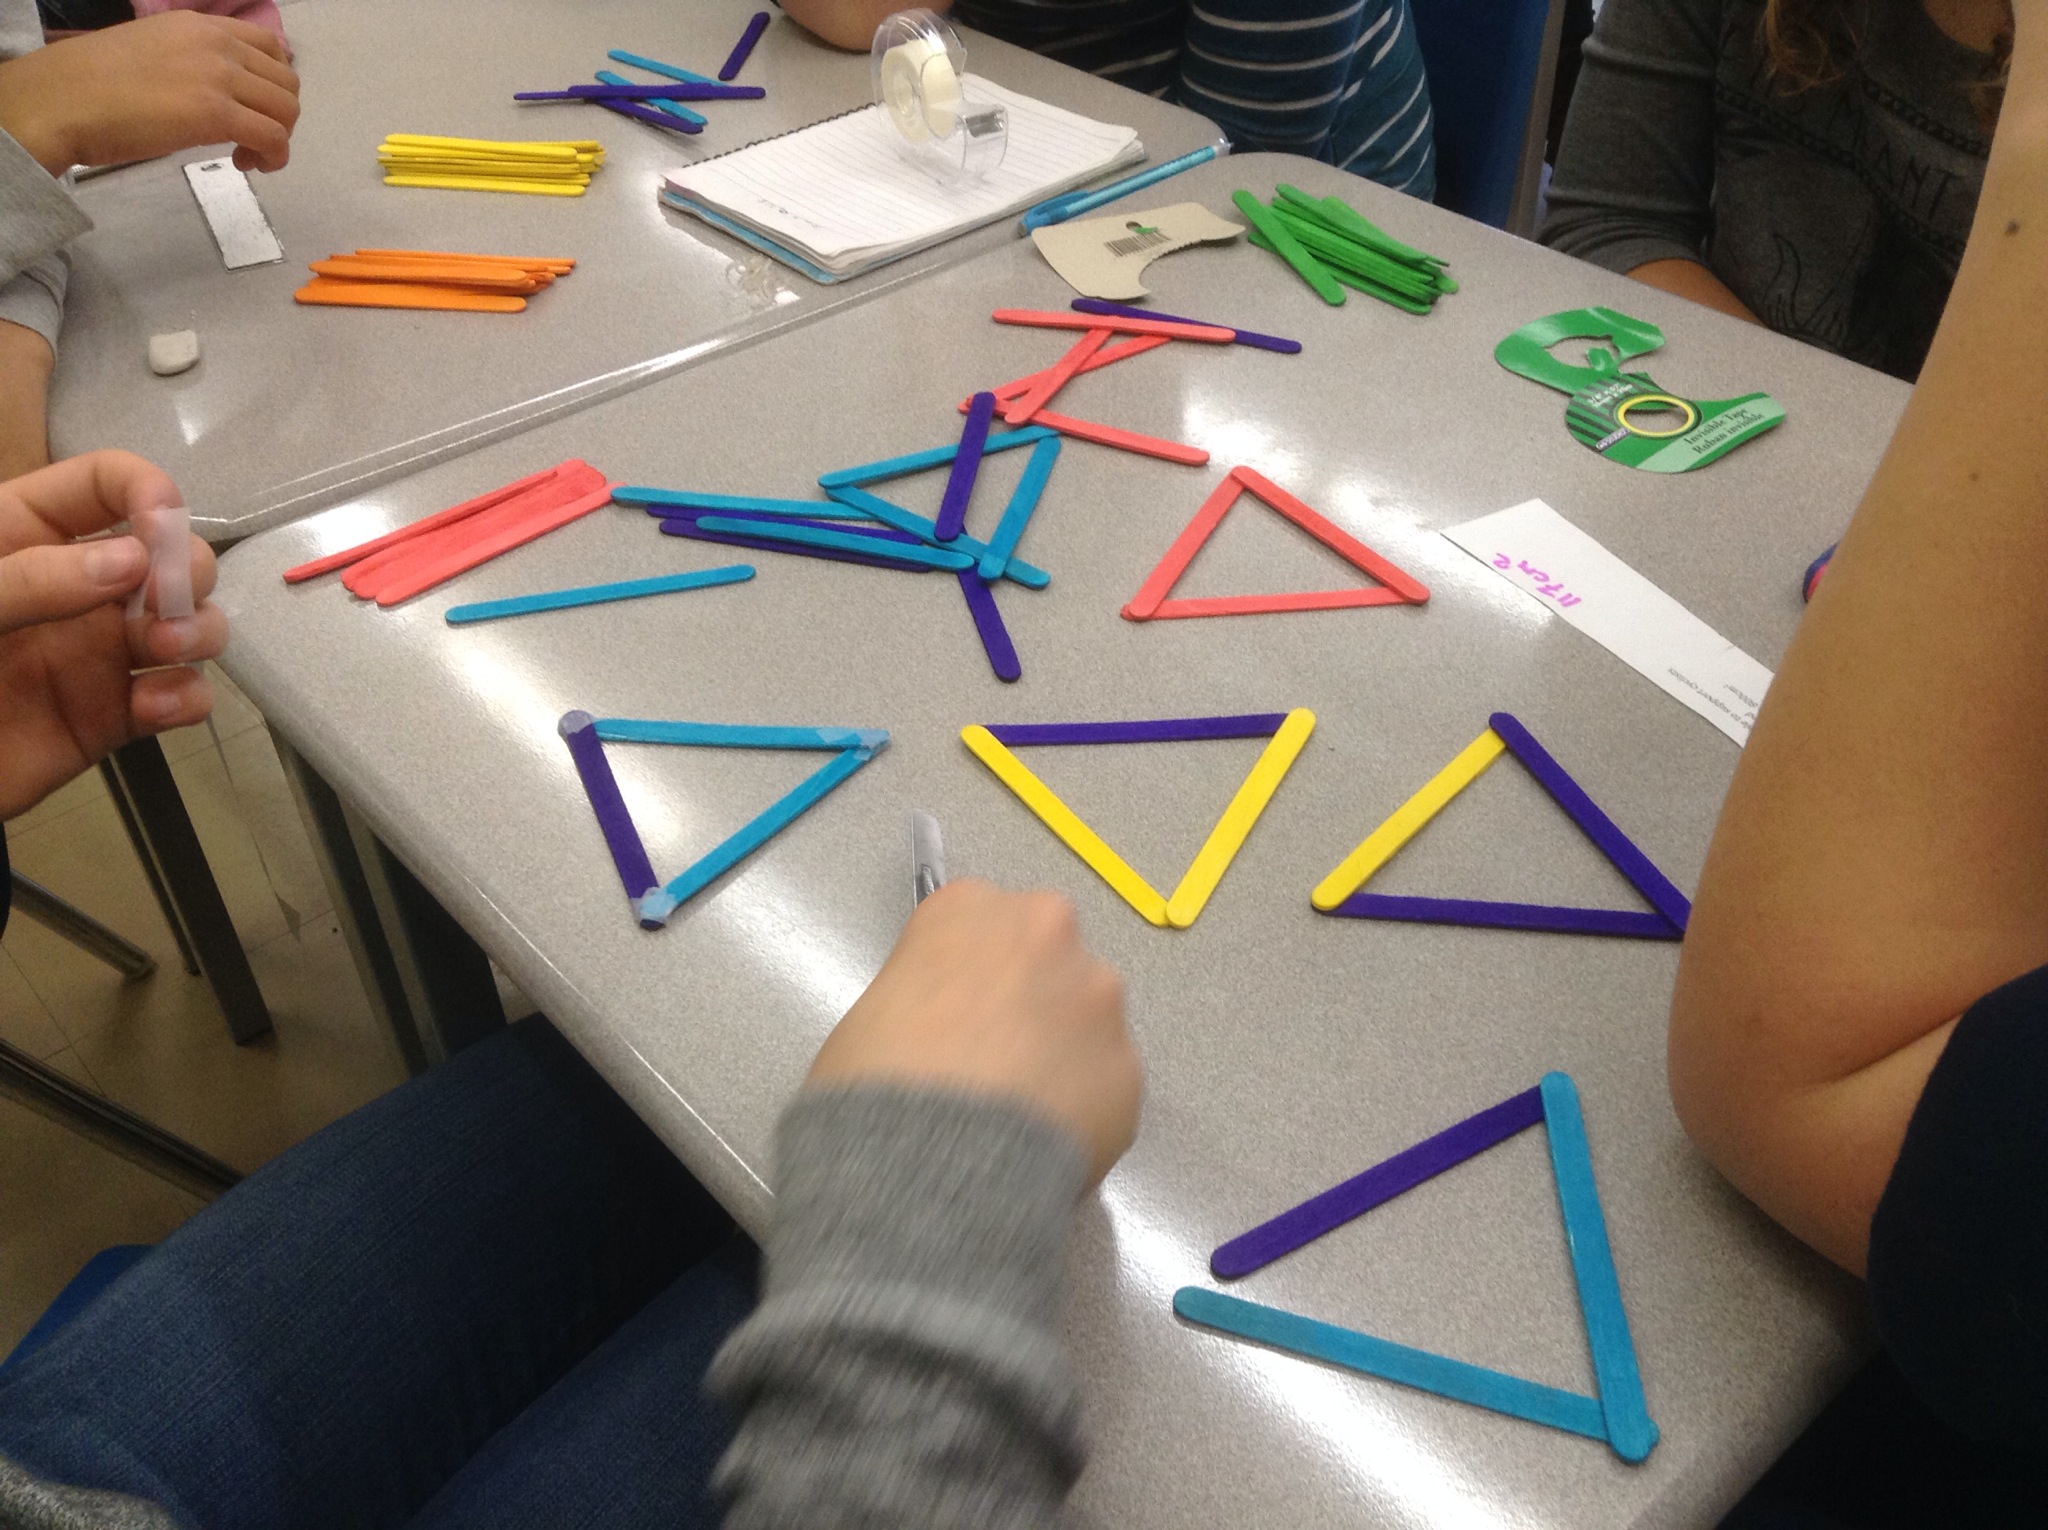
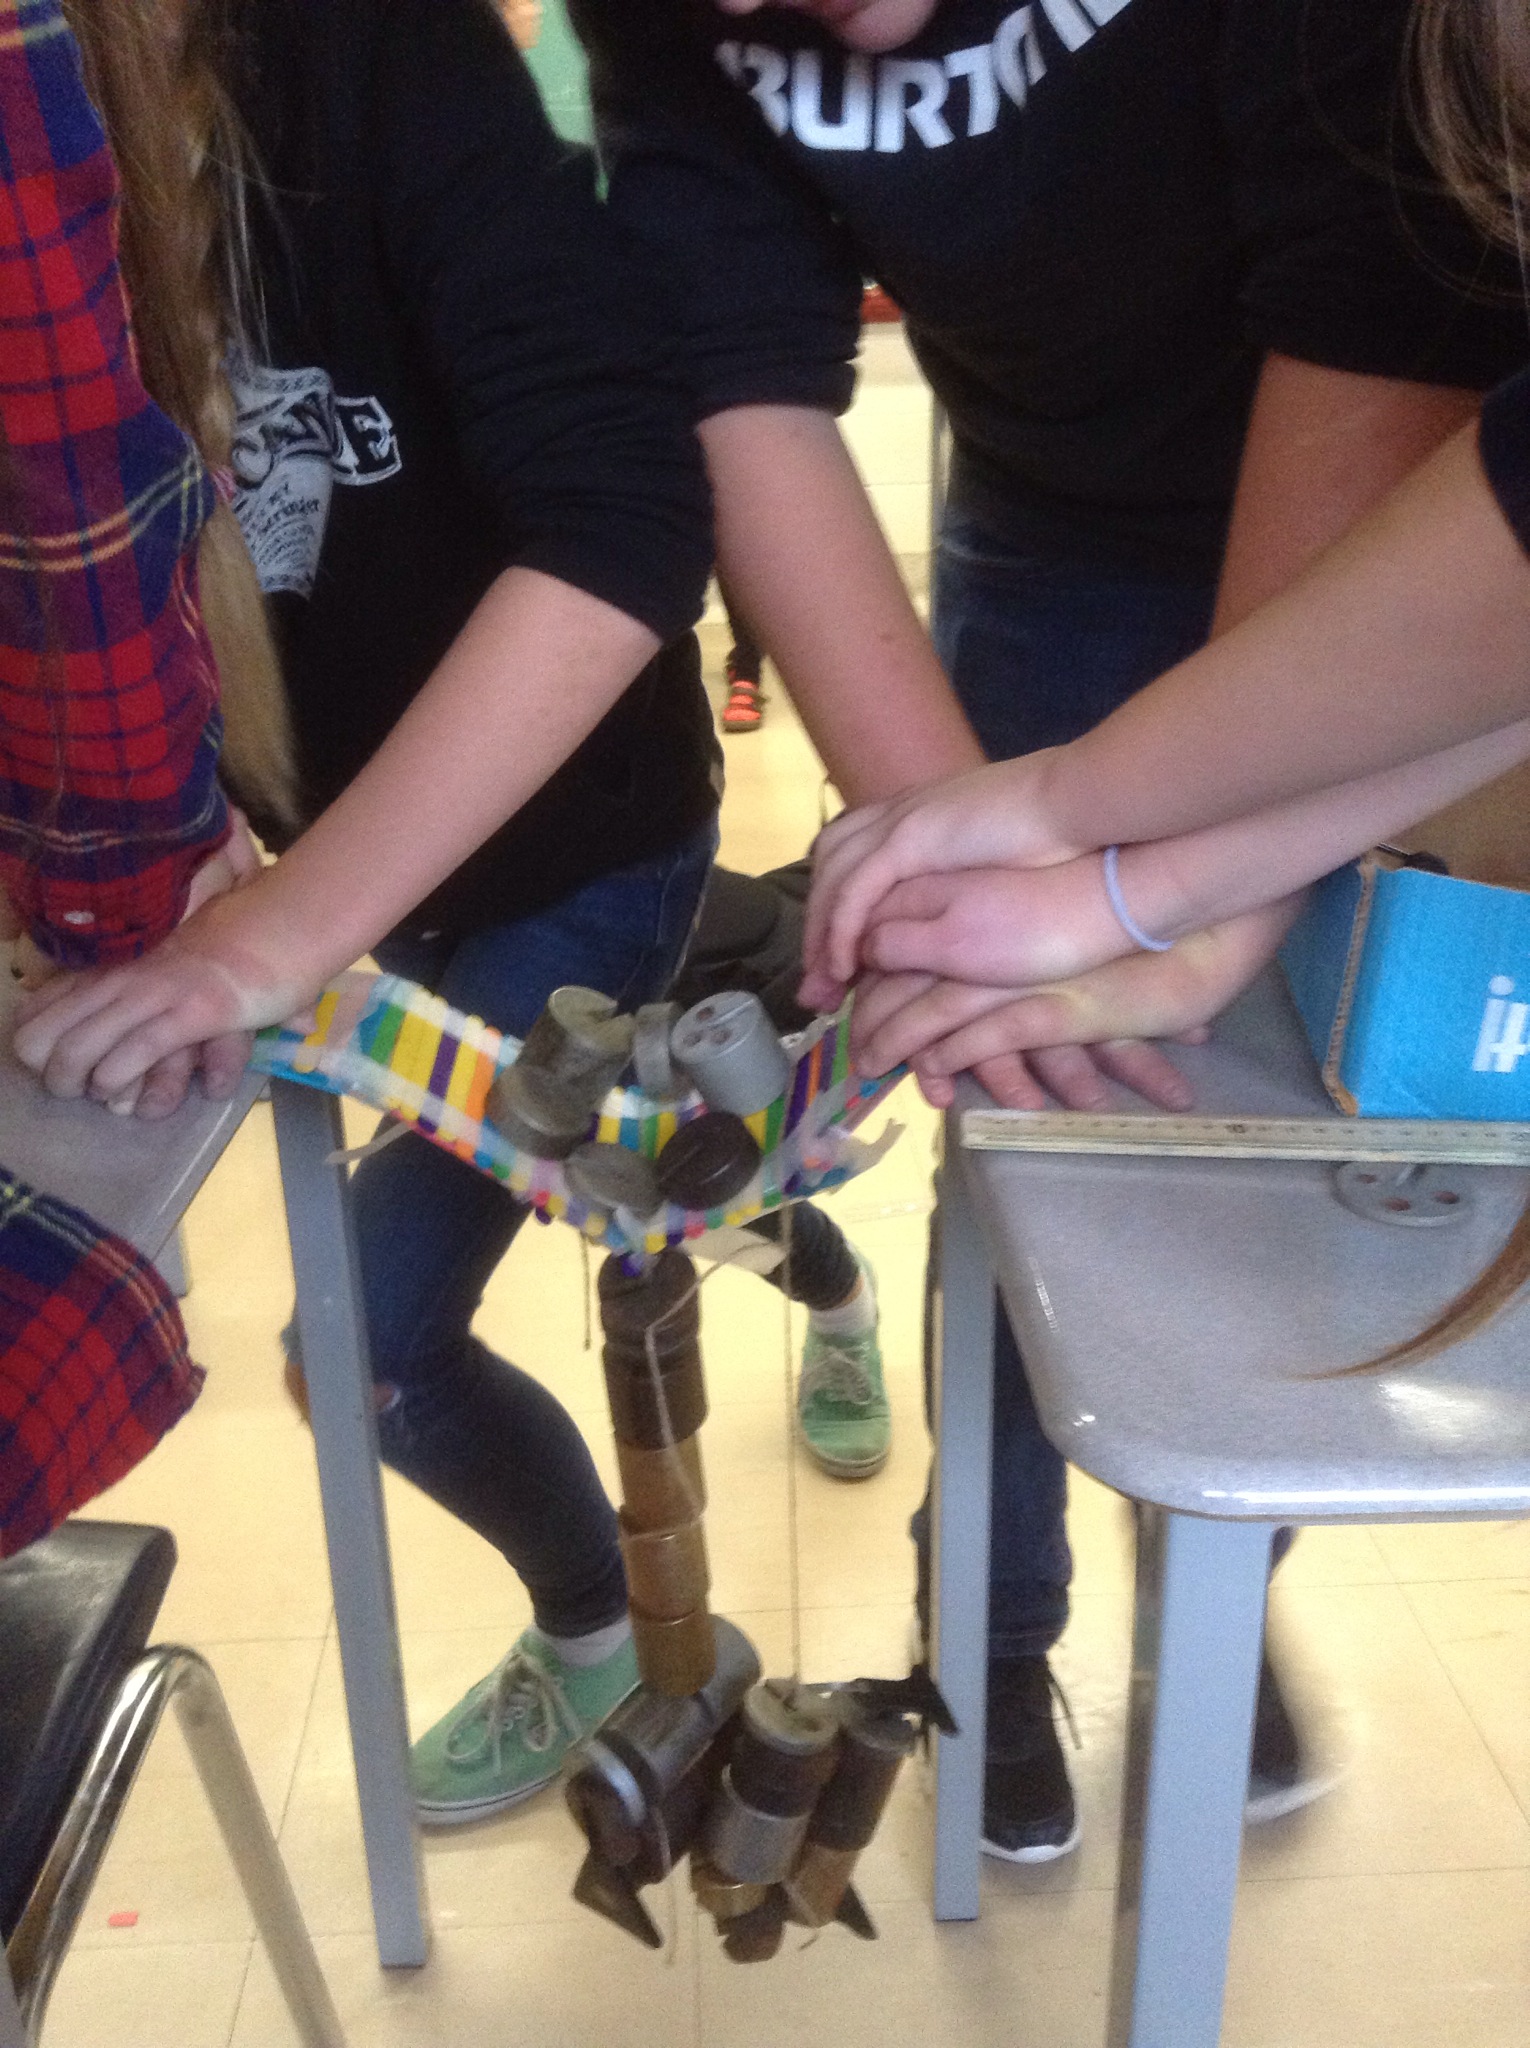
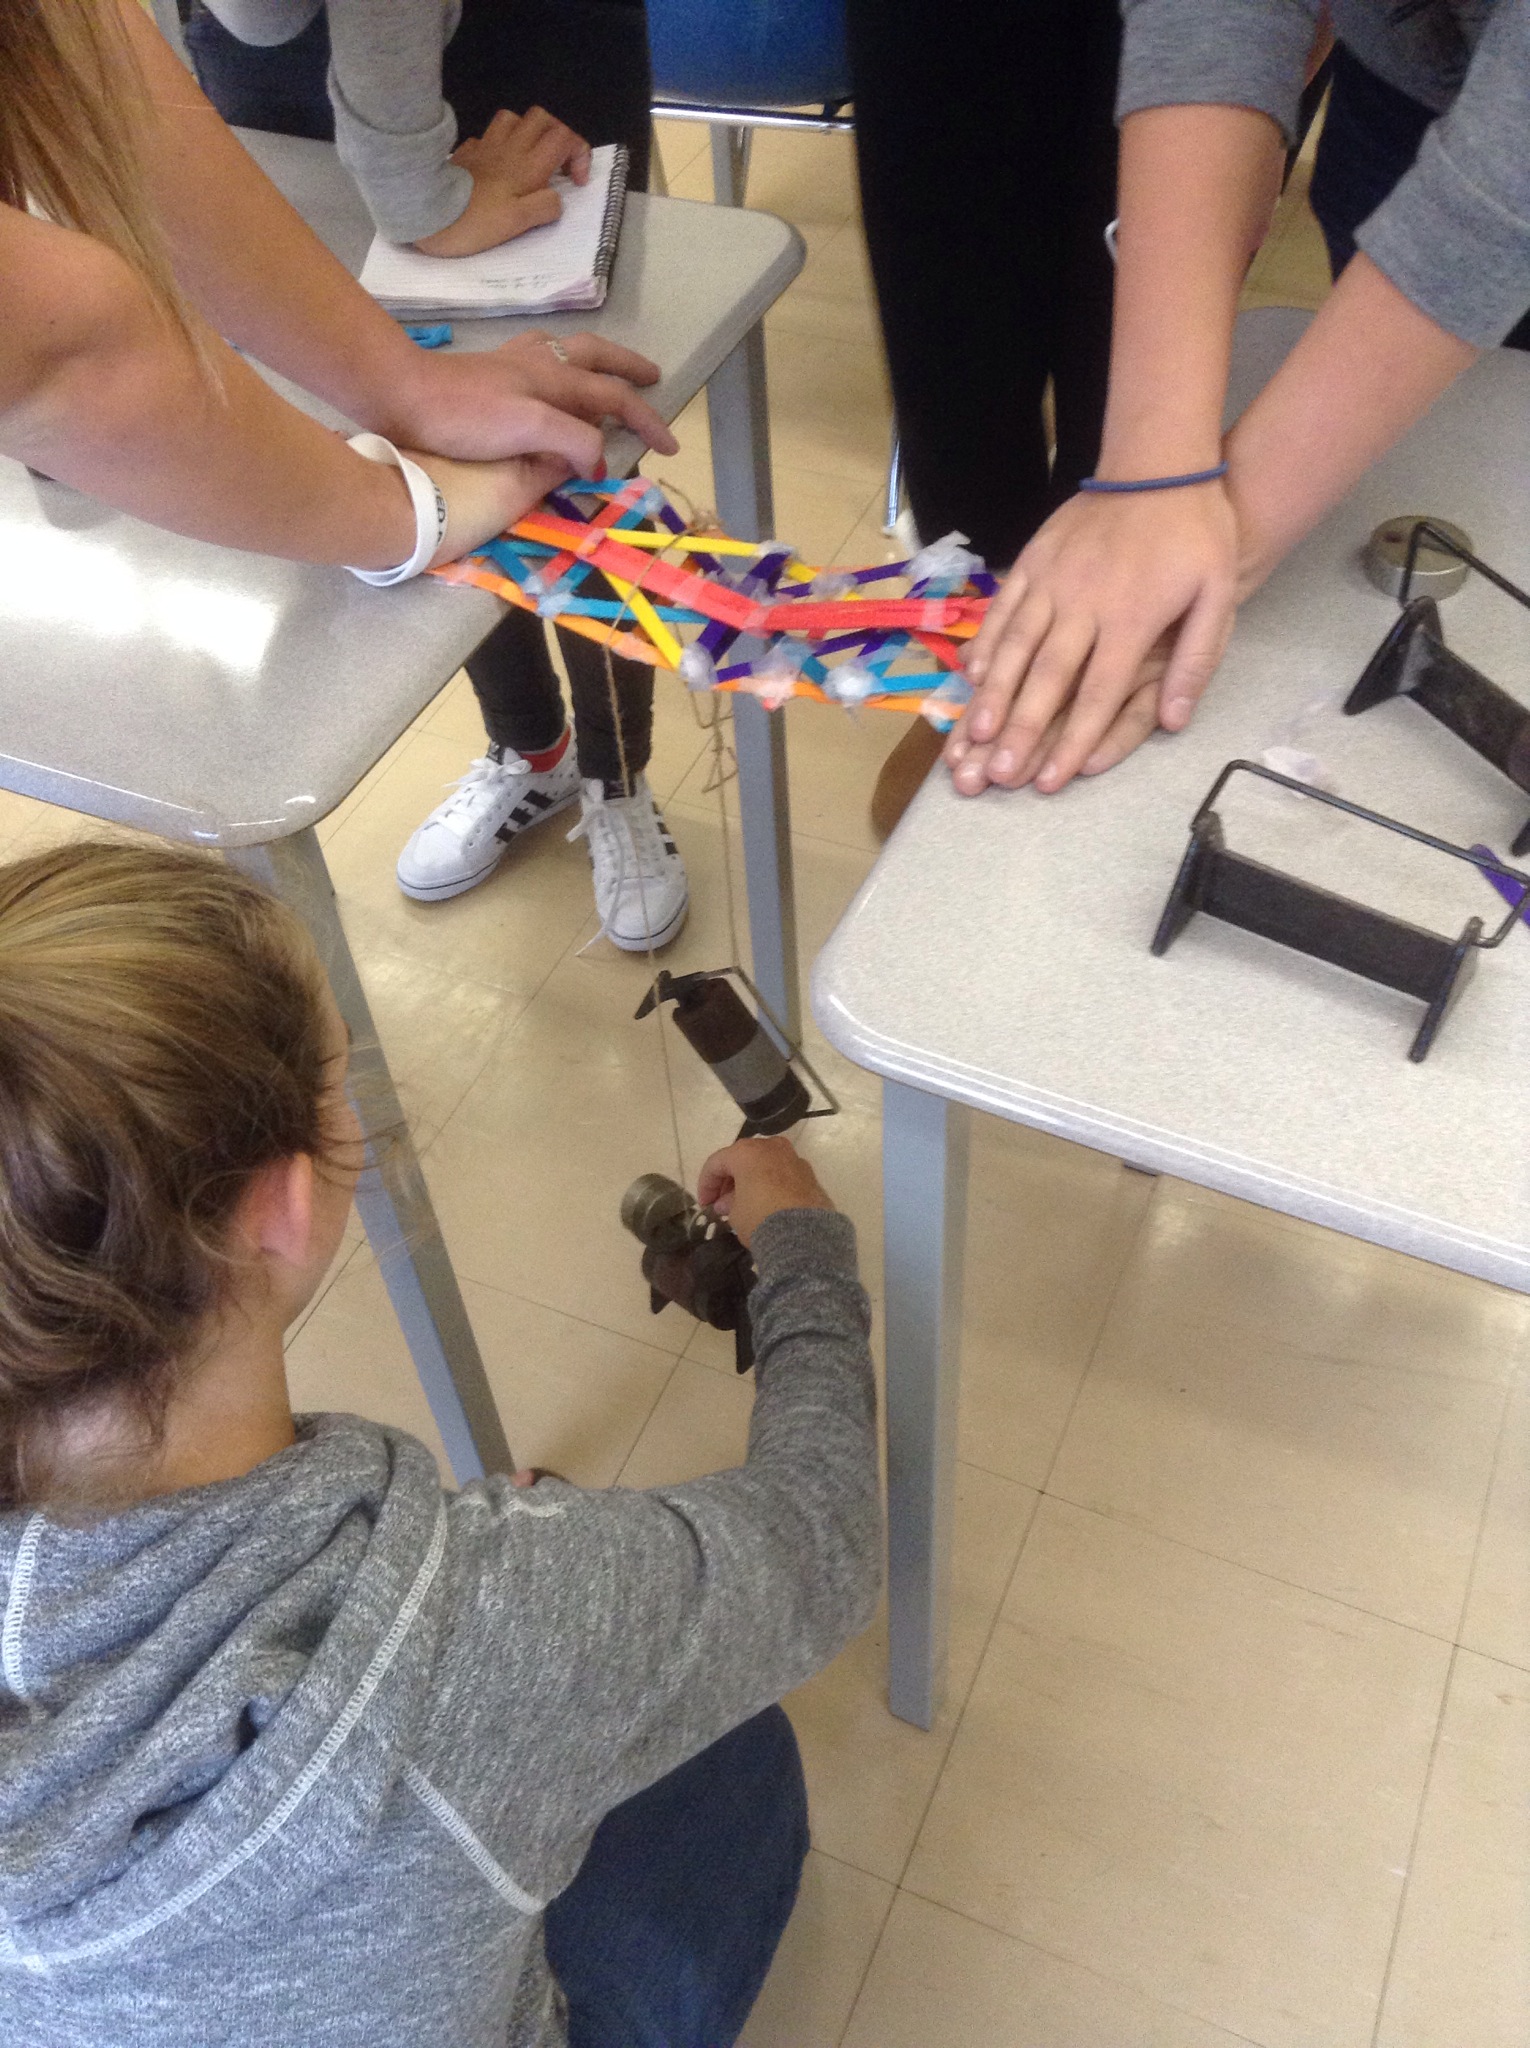
Building Bridges
We were glad to have our “Engineer in the classroom” again today. We spent the class designing and building popsicle stick bridges and then testing them to destruction.


Goodbyes are tough
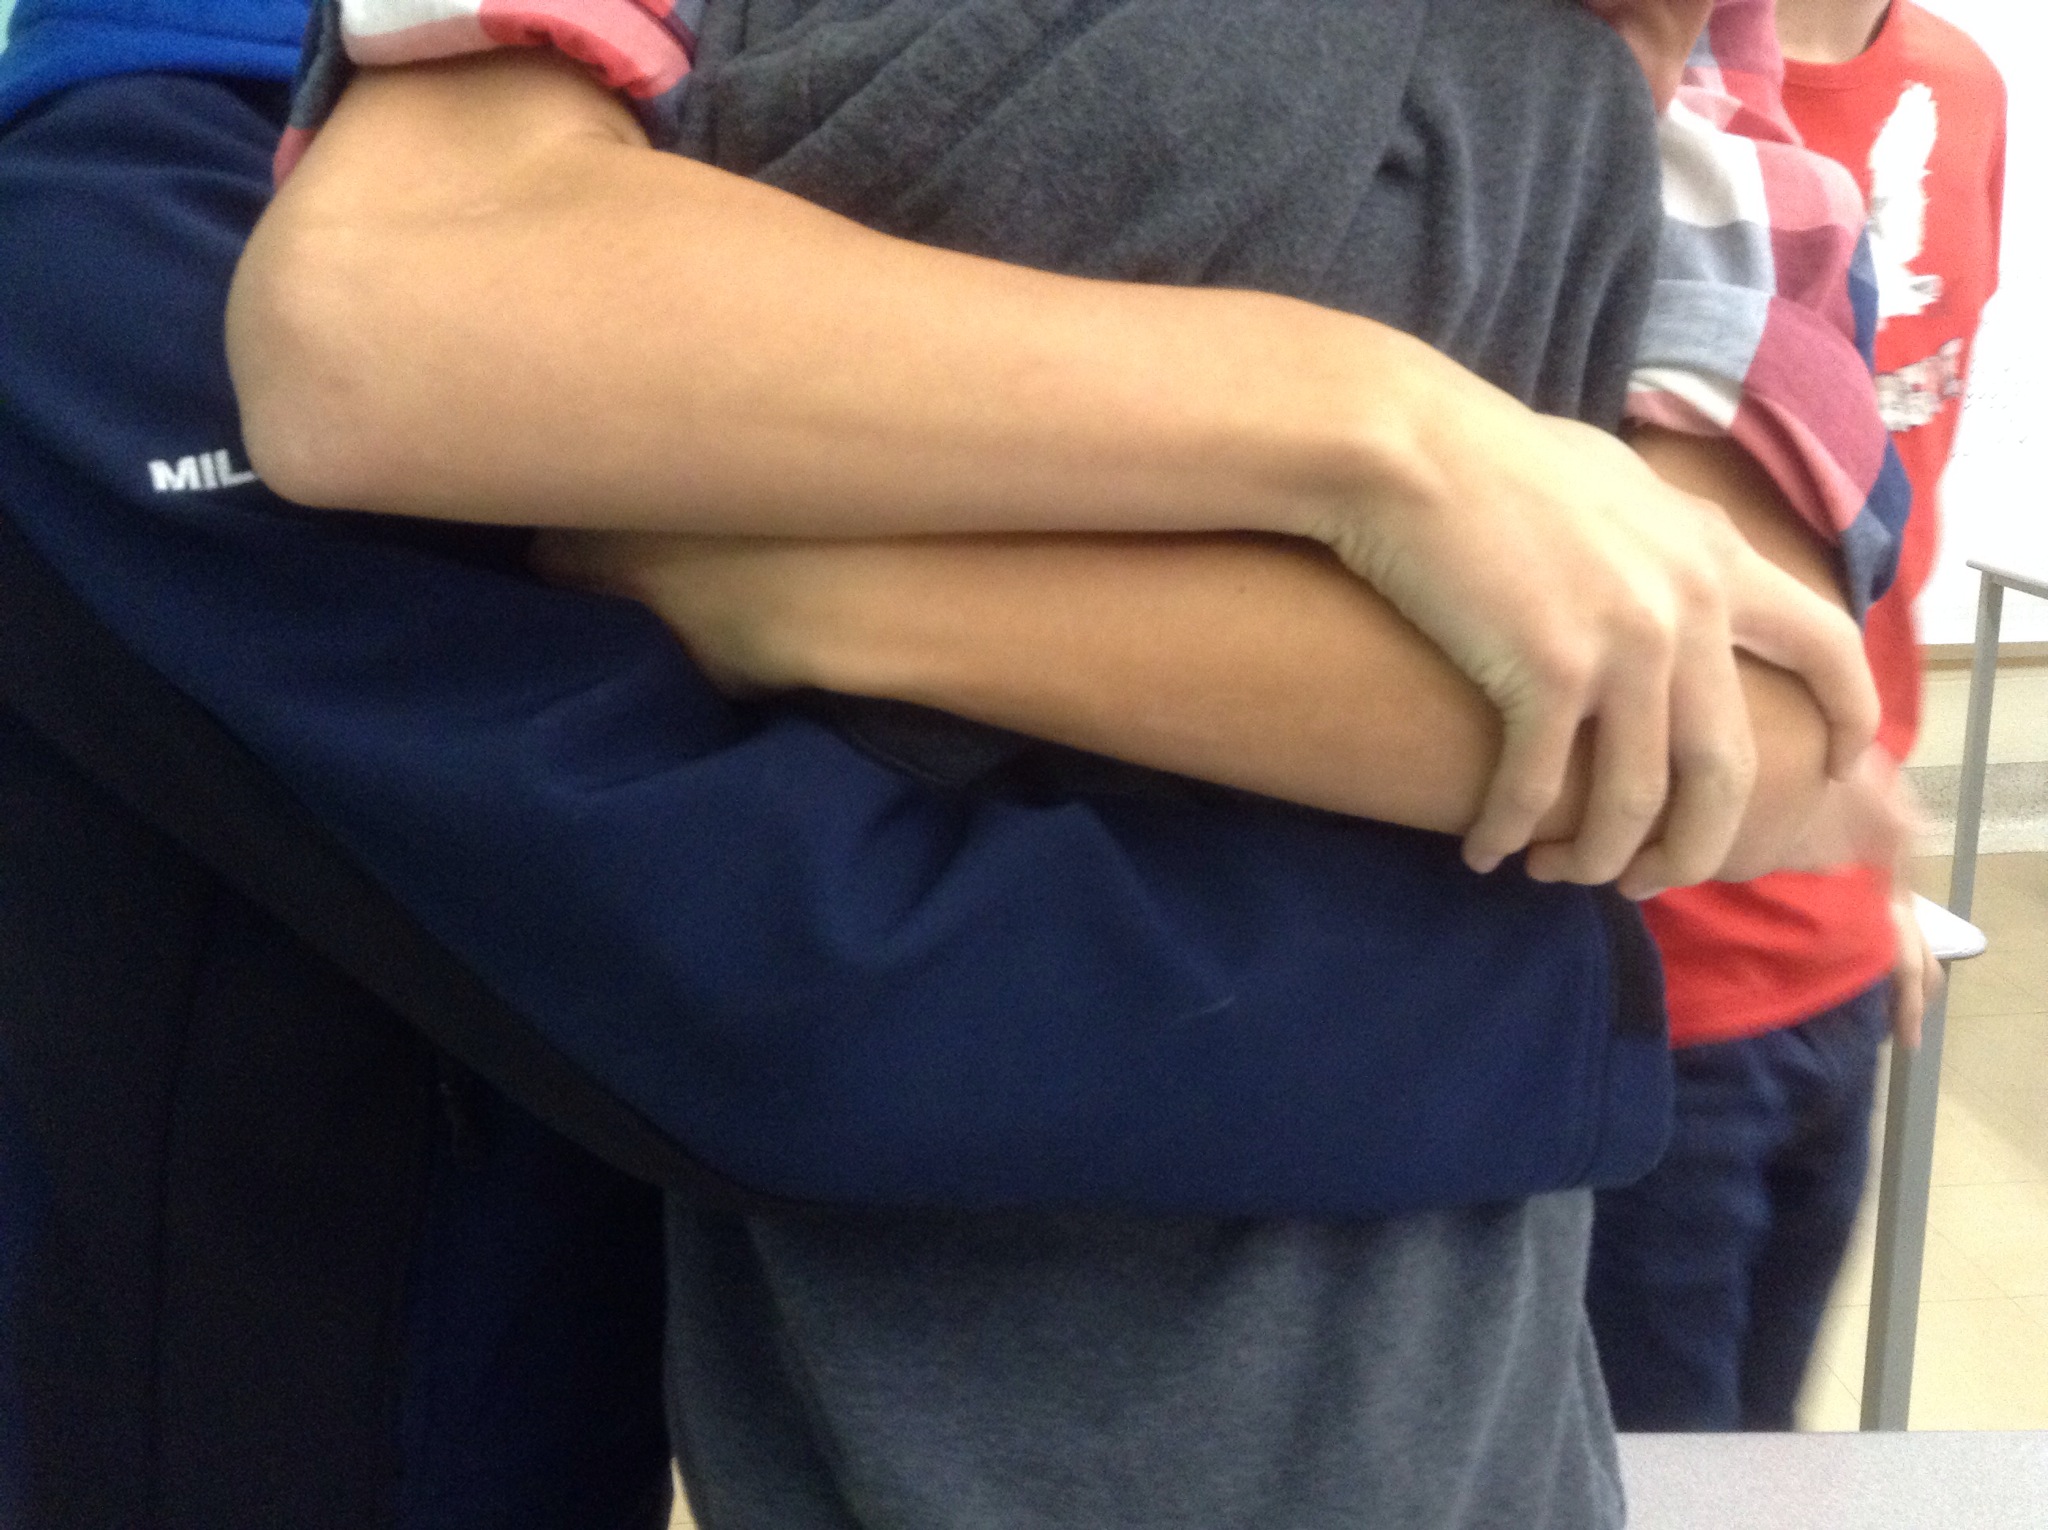
One of the members of our period D math family is transferring schools tomorrow. We had a little farewell party, and lots of hugs.
You’re Never Too Old For Story Time

We have read a few of these books about Sir Cumference. They introduce good math concepts, and have lots of math puns. This particular book was about Perimeter and Area.
Afterwards we made tables of values to compare side length and perimeter, and side length and area, for squares. We graphed the data to see if it’s linear or not, and then modelled the data with equations.
It’s fun when geometry, data analysis, graphing, and equations all come together. In grade 9 we are finding out that the strands are not so separate as they were in elementary school.
Engineer for the year
Period C is in for a treat. We have an engineering student, Ali, who will be in our class every 2 weeks showing us some of the connections between math and engineering.
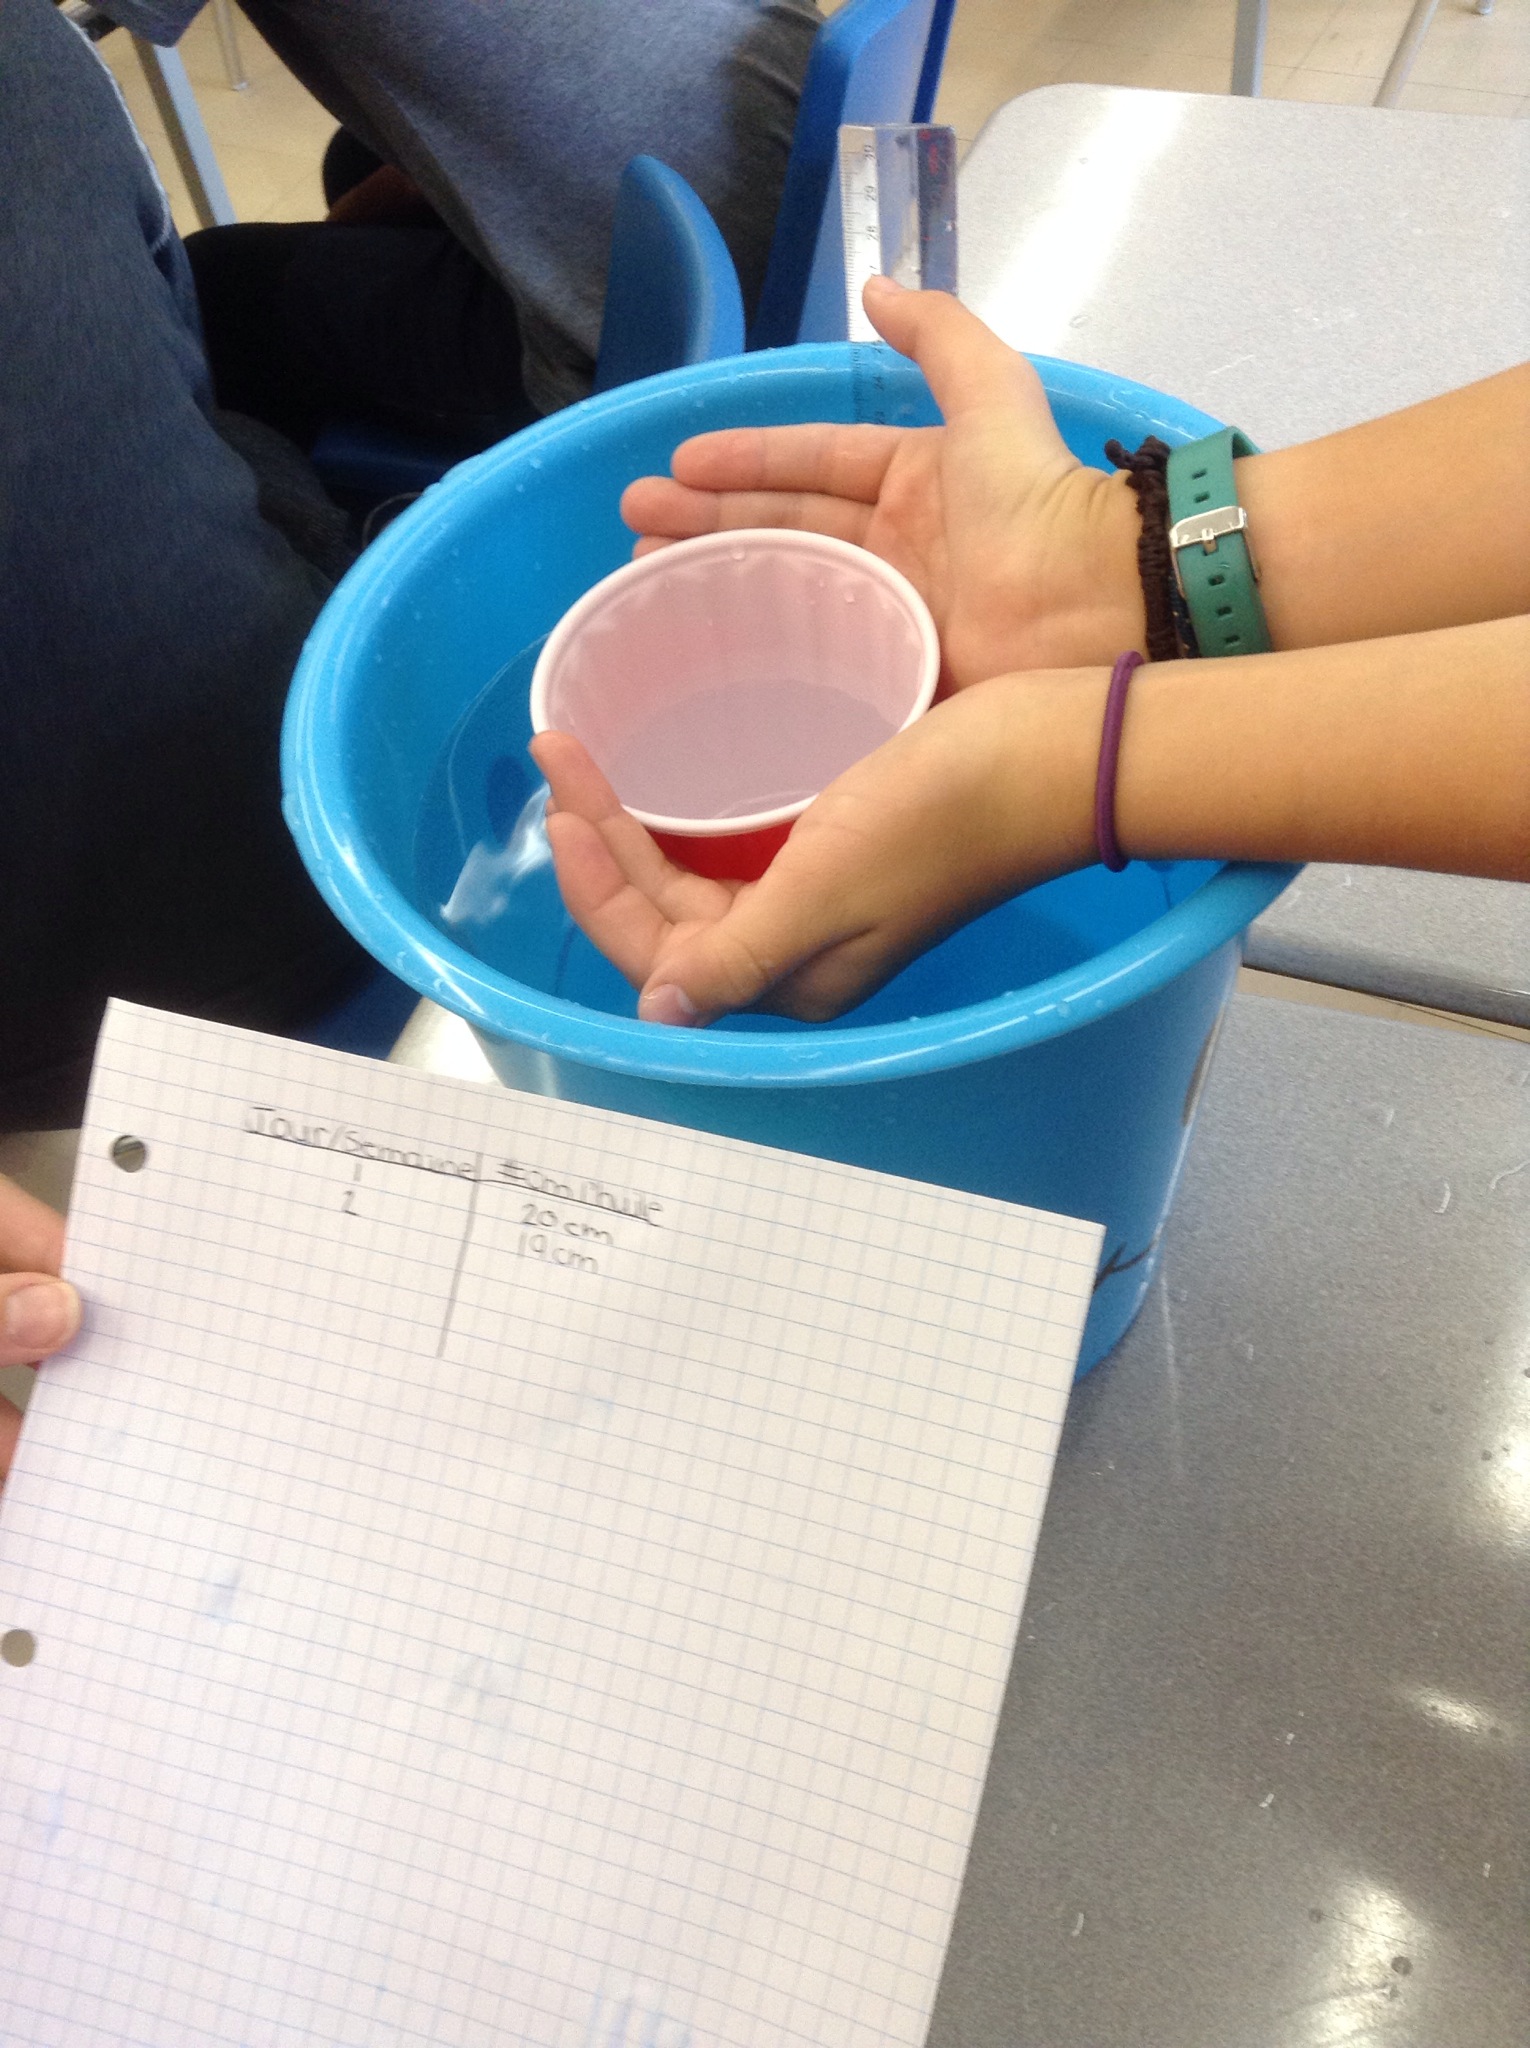
This week we modelled an oil problem by using buckets as “oil wells” and cups as our “machines”.

Each group was hired to get all of the oil from their well in 6 months.
Groups had to measure the initial height of the “oil” in their “well”. Each “month” (several minutes) the “machine” could be used 4 times. Each “month” the height of the “oil” was measured and recorded, and the data put on the graph.
At the end of the 4th month we looked at the graphs to see if we were likely to meet the 6th month deadline.
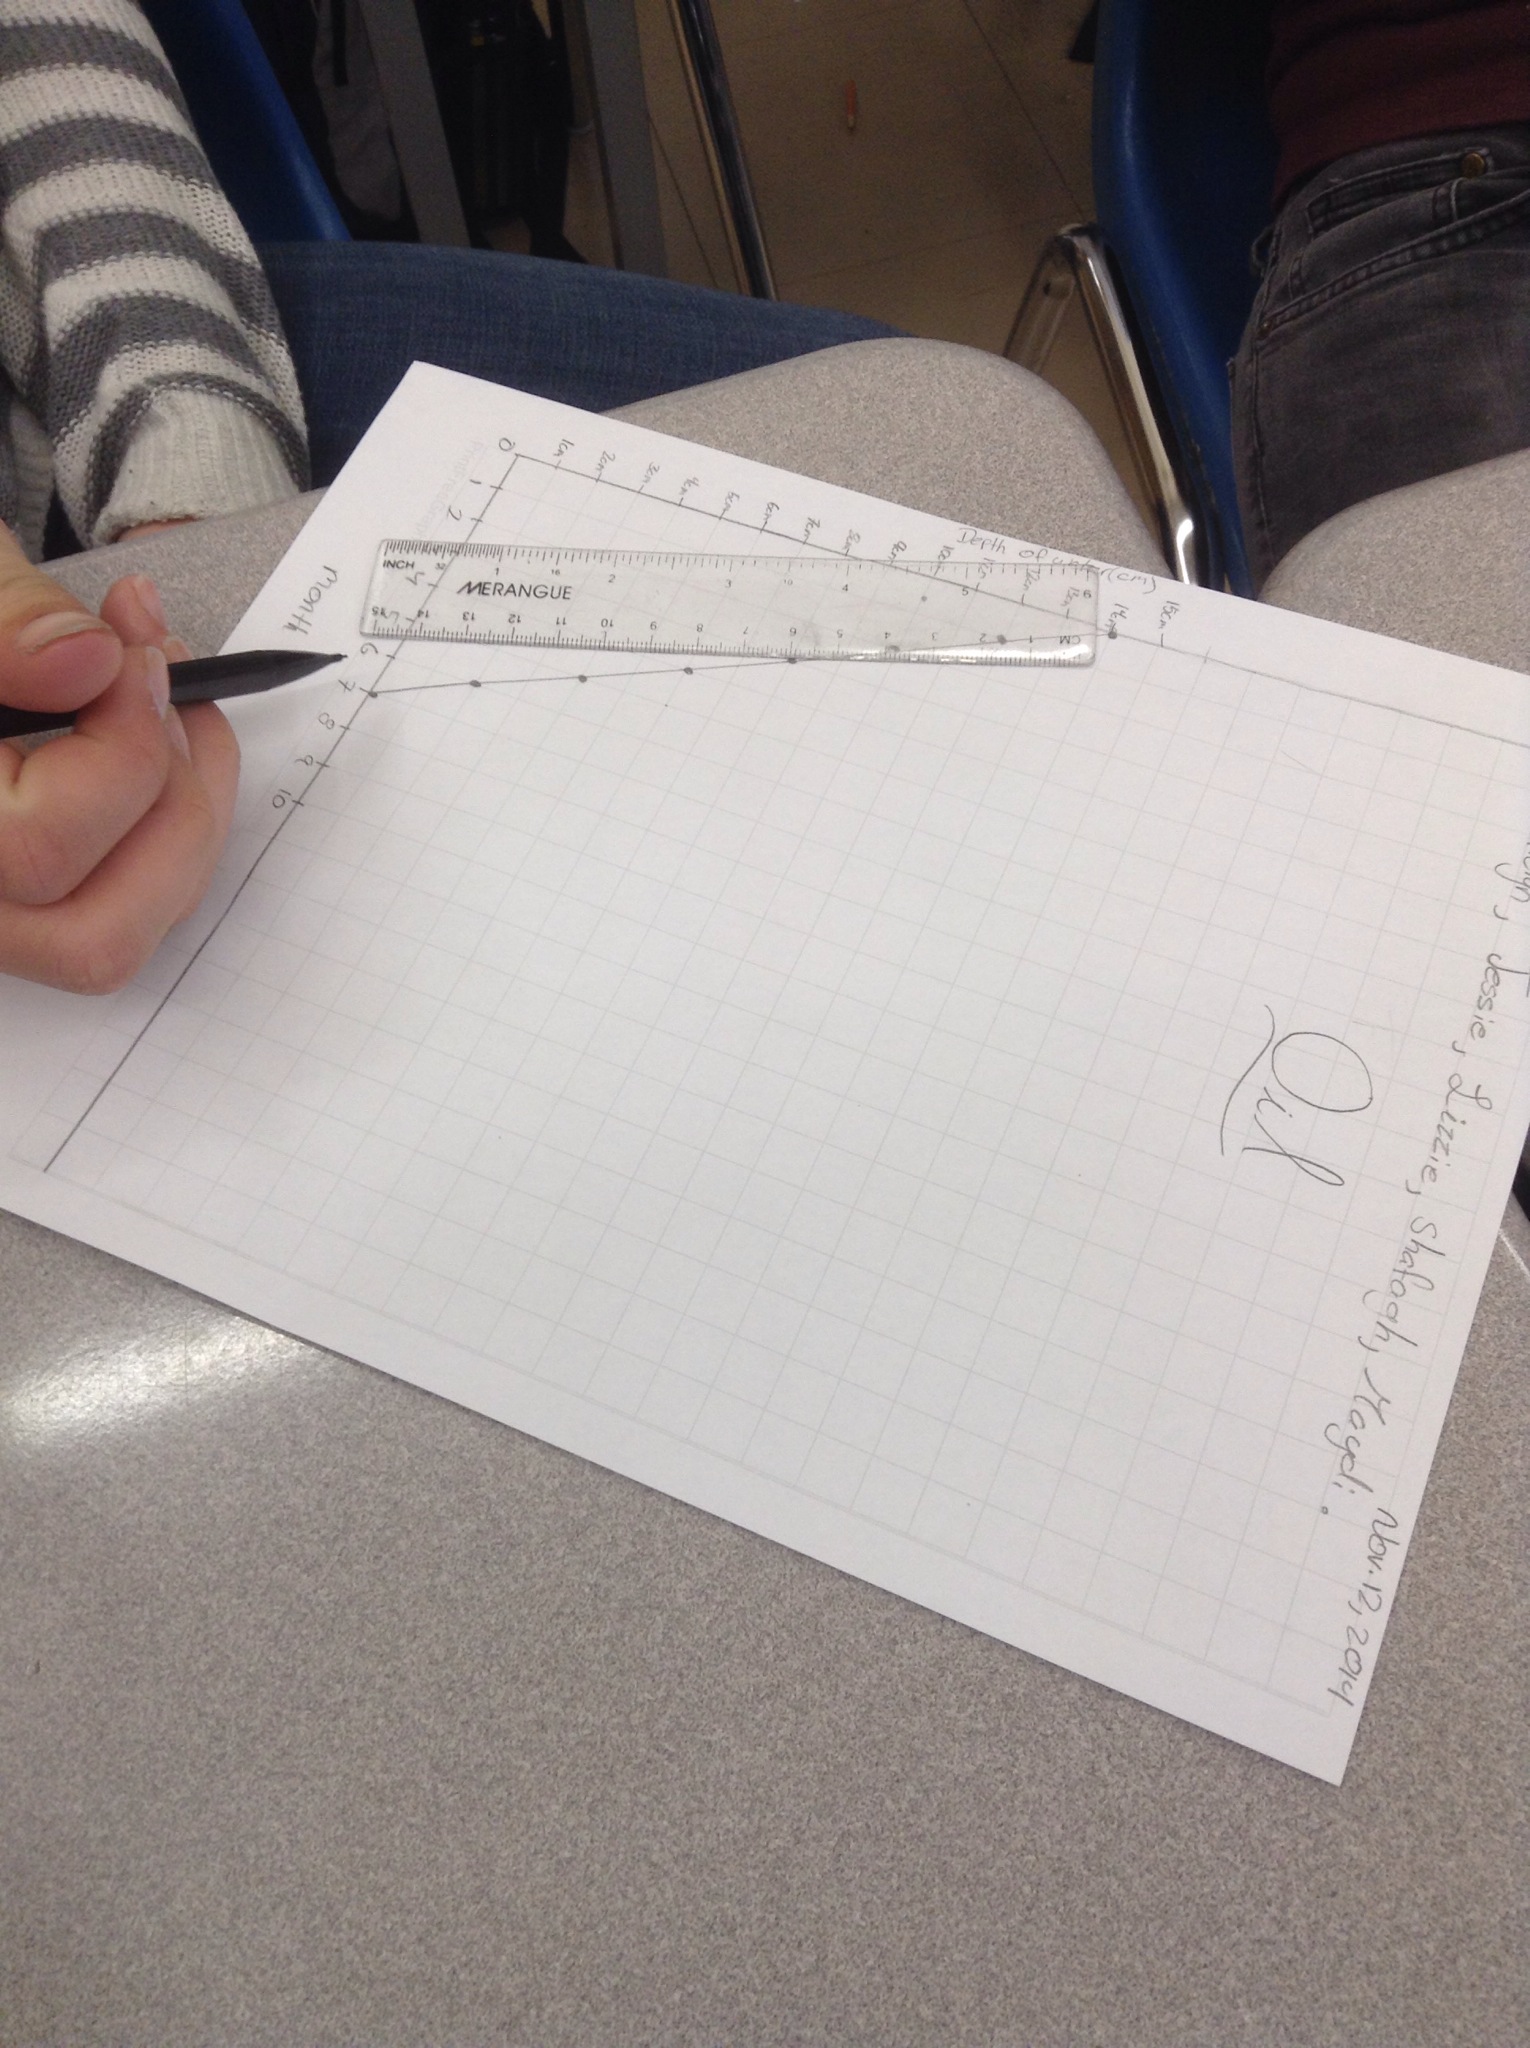
We drew lines of best fit, and discussed whether the data was linear or not, what the slope was and what it represents. We talked about the x and y intercepts and what they represent.
Each group was given a challenge to come up with ways to change the machine or the process to drain the “oil well” faster. After brainstorming a list of ways to change the process, each group used their knowledge of 3D shapes to design a better “machine” (cup) to scoop out the “oil”.
Groups presented their designs to the class.
Ali shared with us how our activity related to engineering, design and problem solving. She also told us of some interesting ways companies have solved problems by thinking outside the box.
It was great to have Ali as a part of our class. We look forward to more activities with her in 2 weeks.
