From Visual Patterns to Graphs
Today we made some visual patterns using our square tiles.
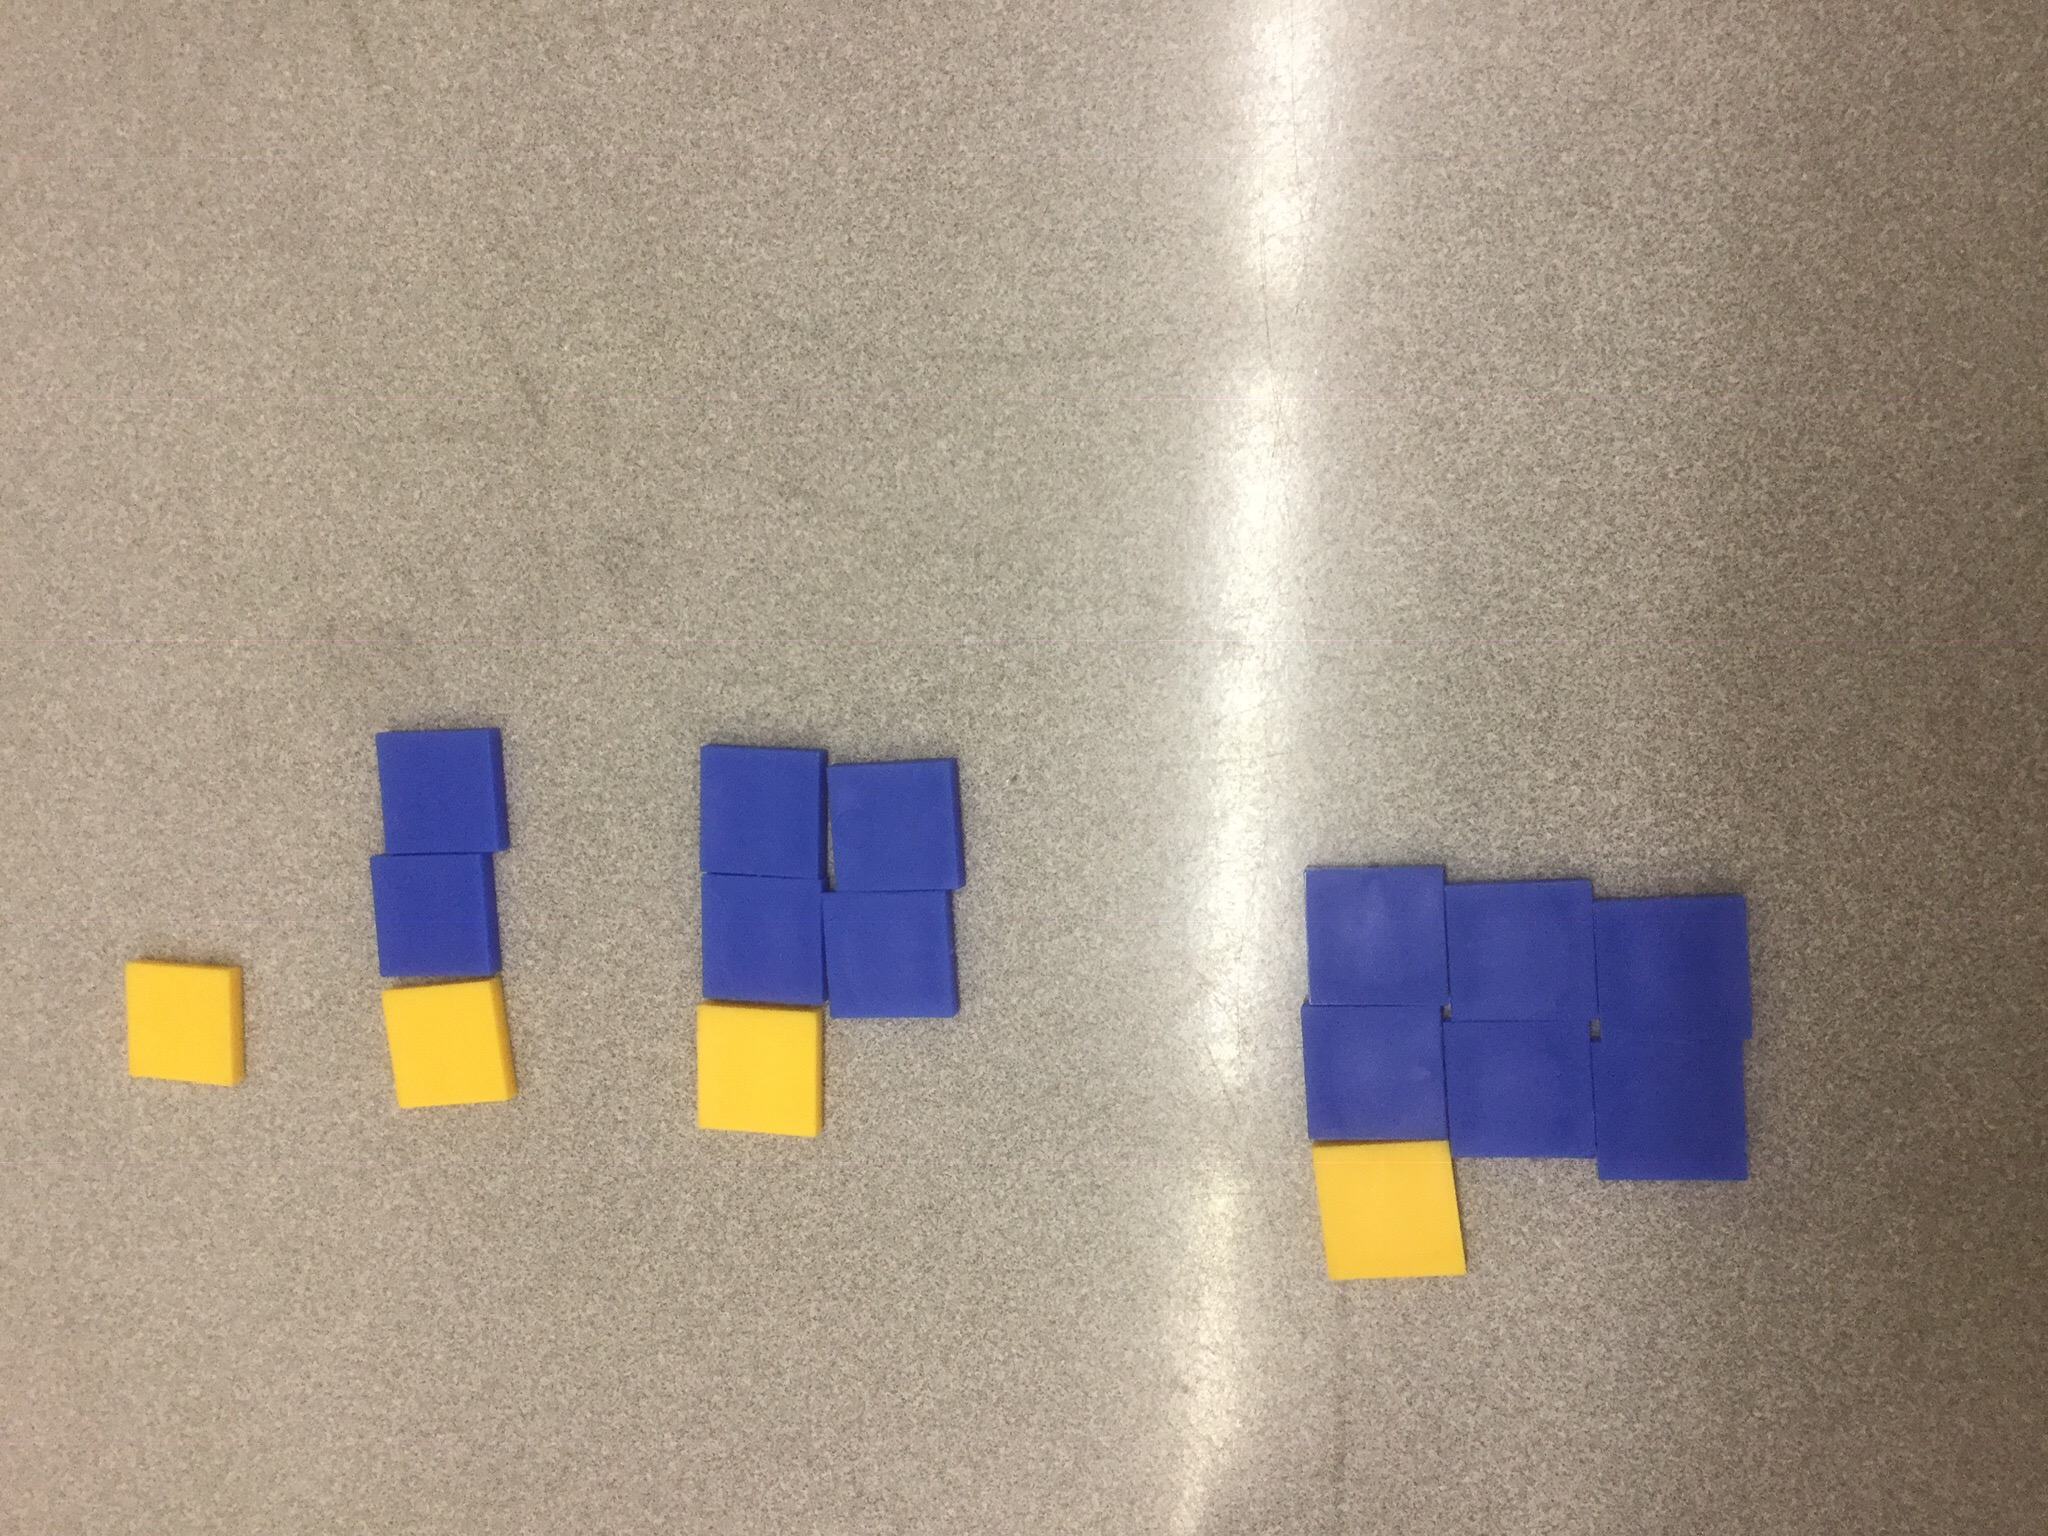
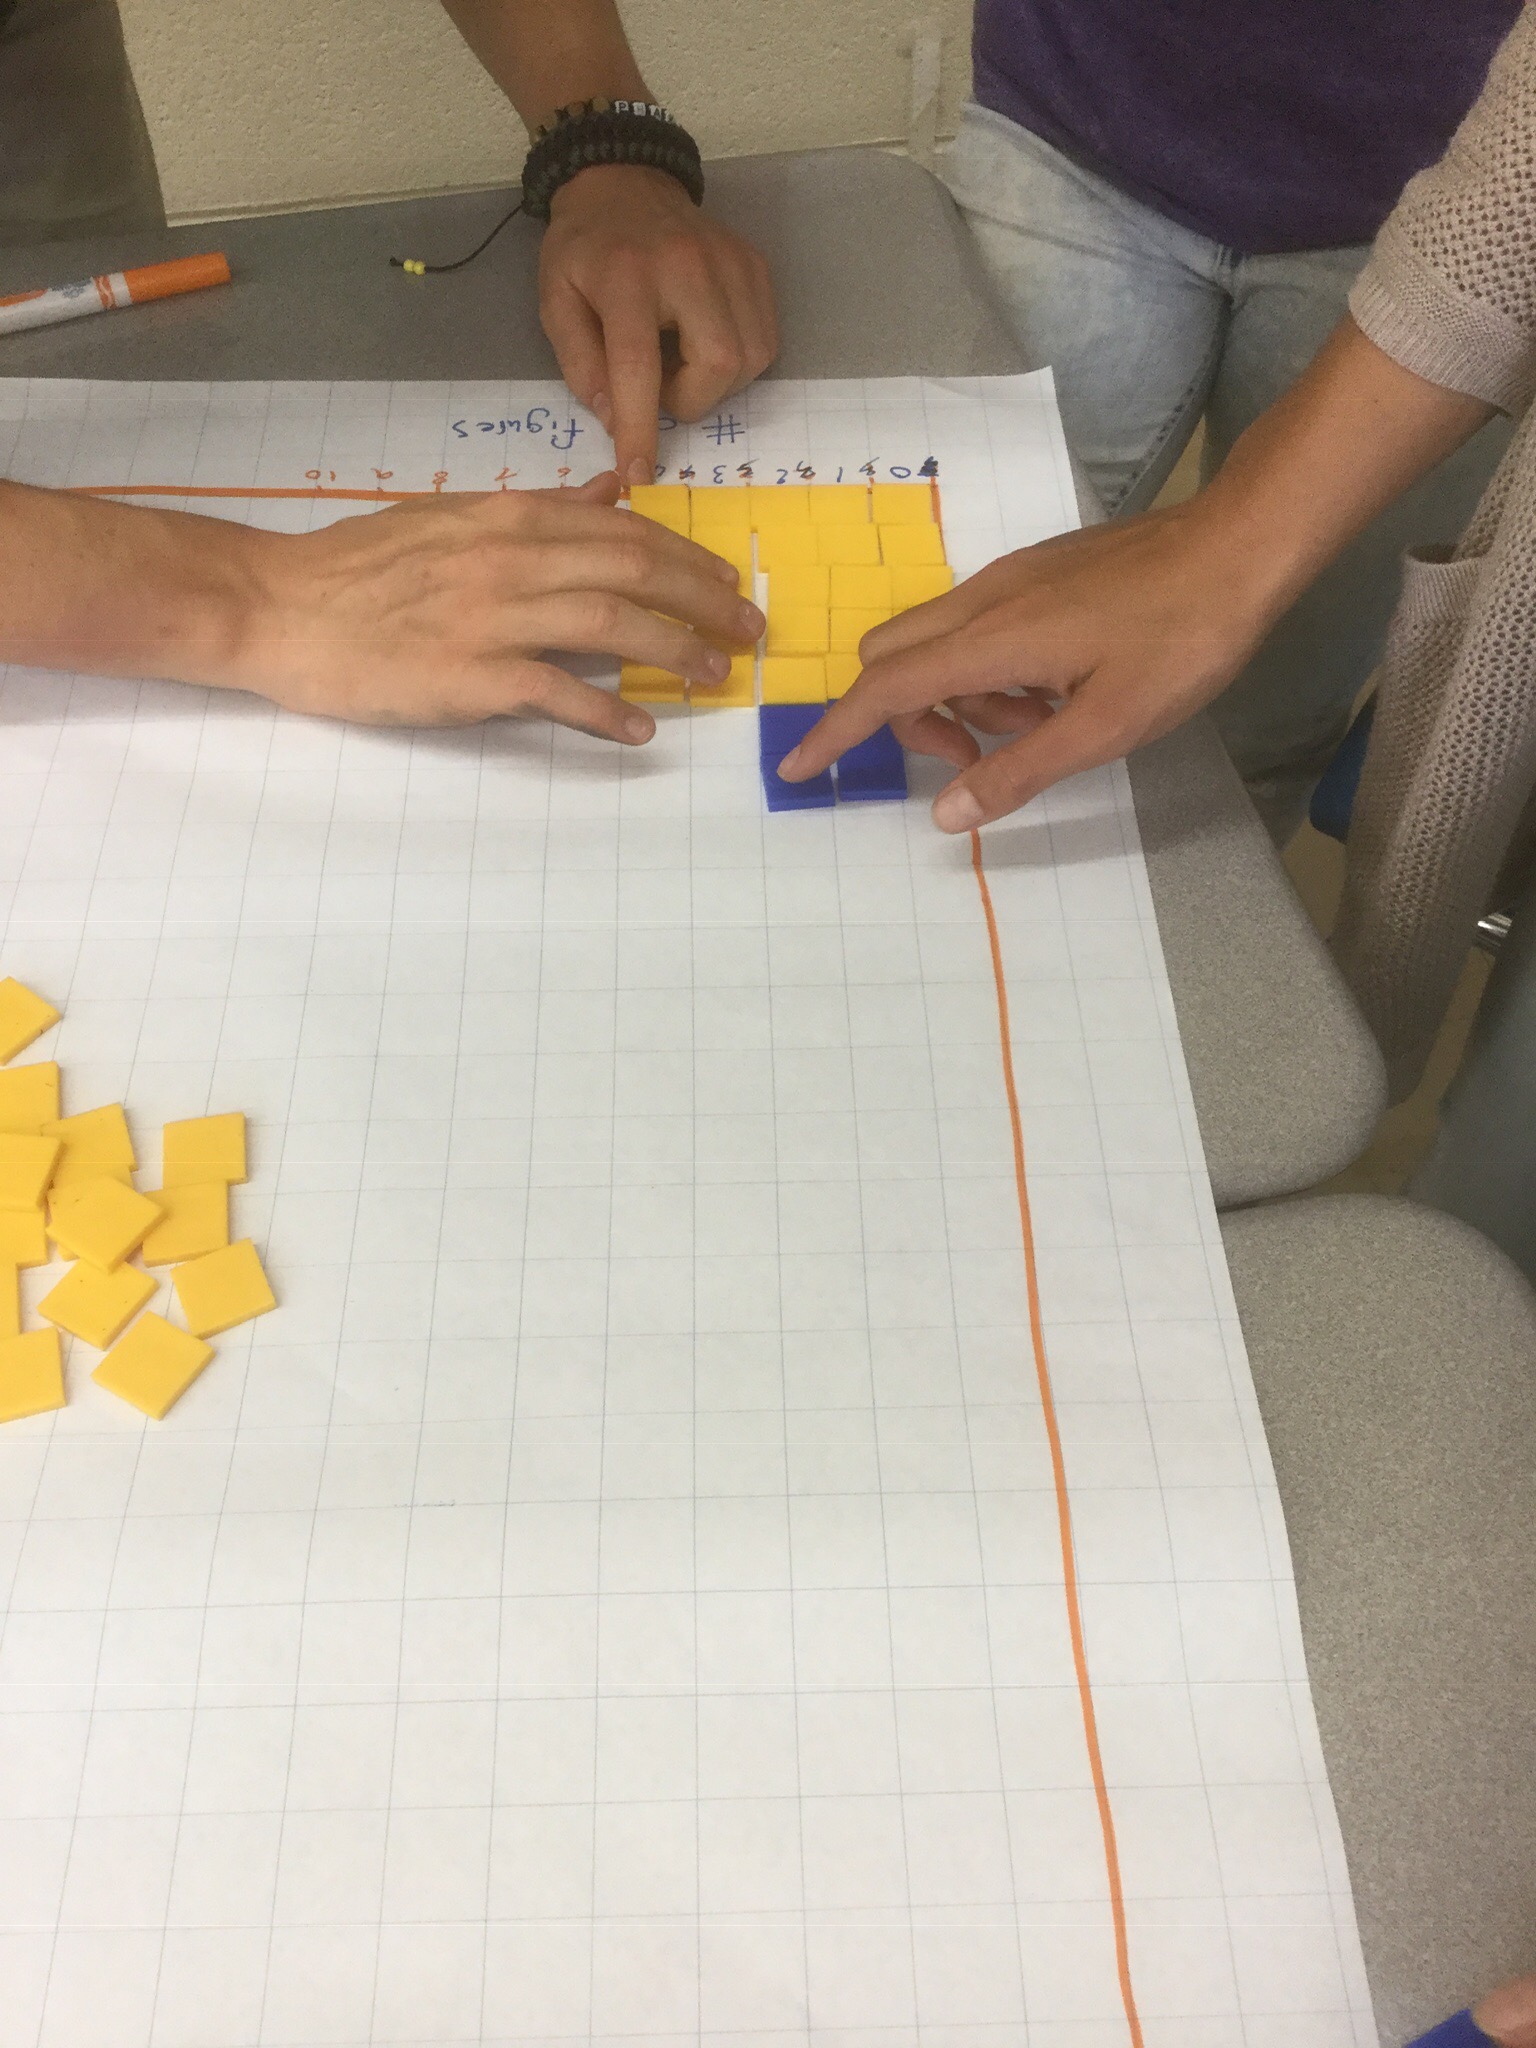
Here’s an example of 2n+1. We see the 1 is a constant term, always there (the yellow square). We are looking for groups of n when we look at the blue. See them? Horizontally we have 2 groups of n (when n is 1 we have 2 rows of 1, when n is 3 we have 2 rows of 3). We are using n to represent the figure number.
We experimented with what to do if the constant term is negative….how we can show that.
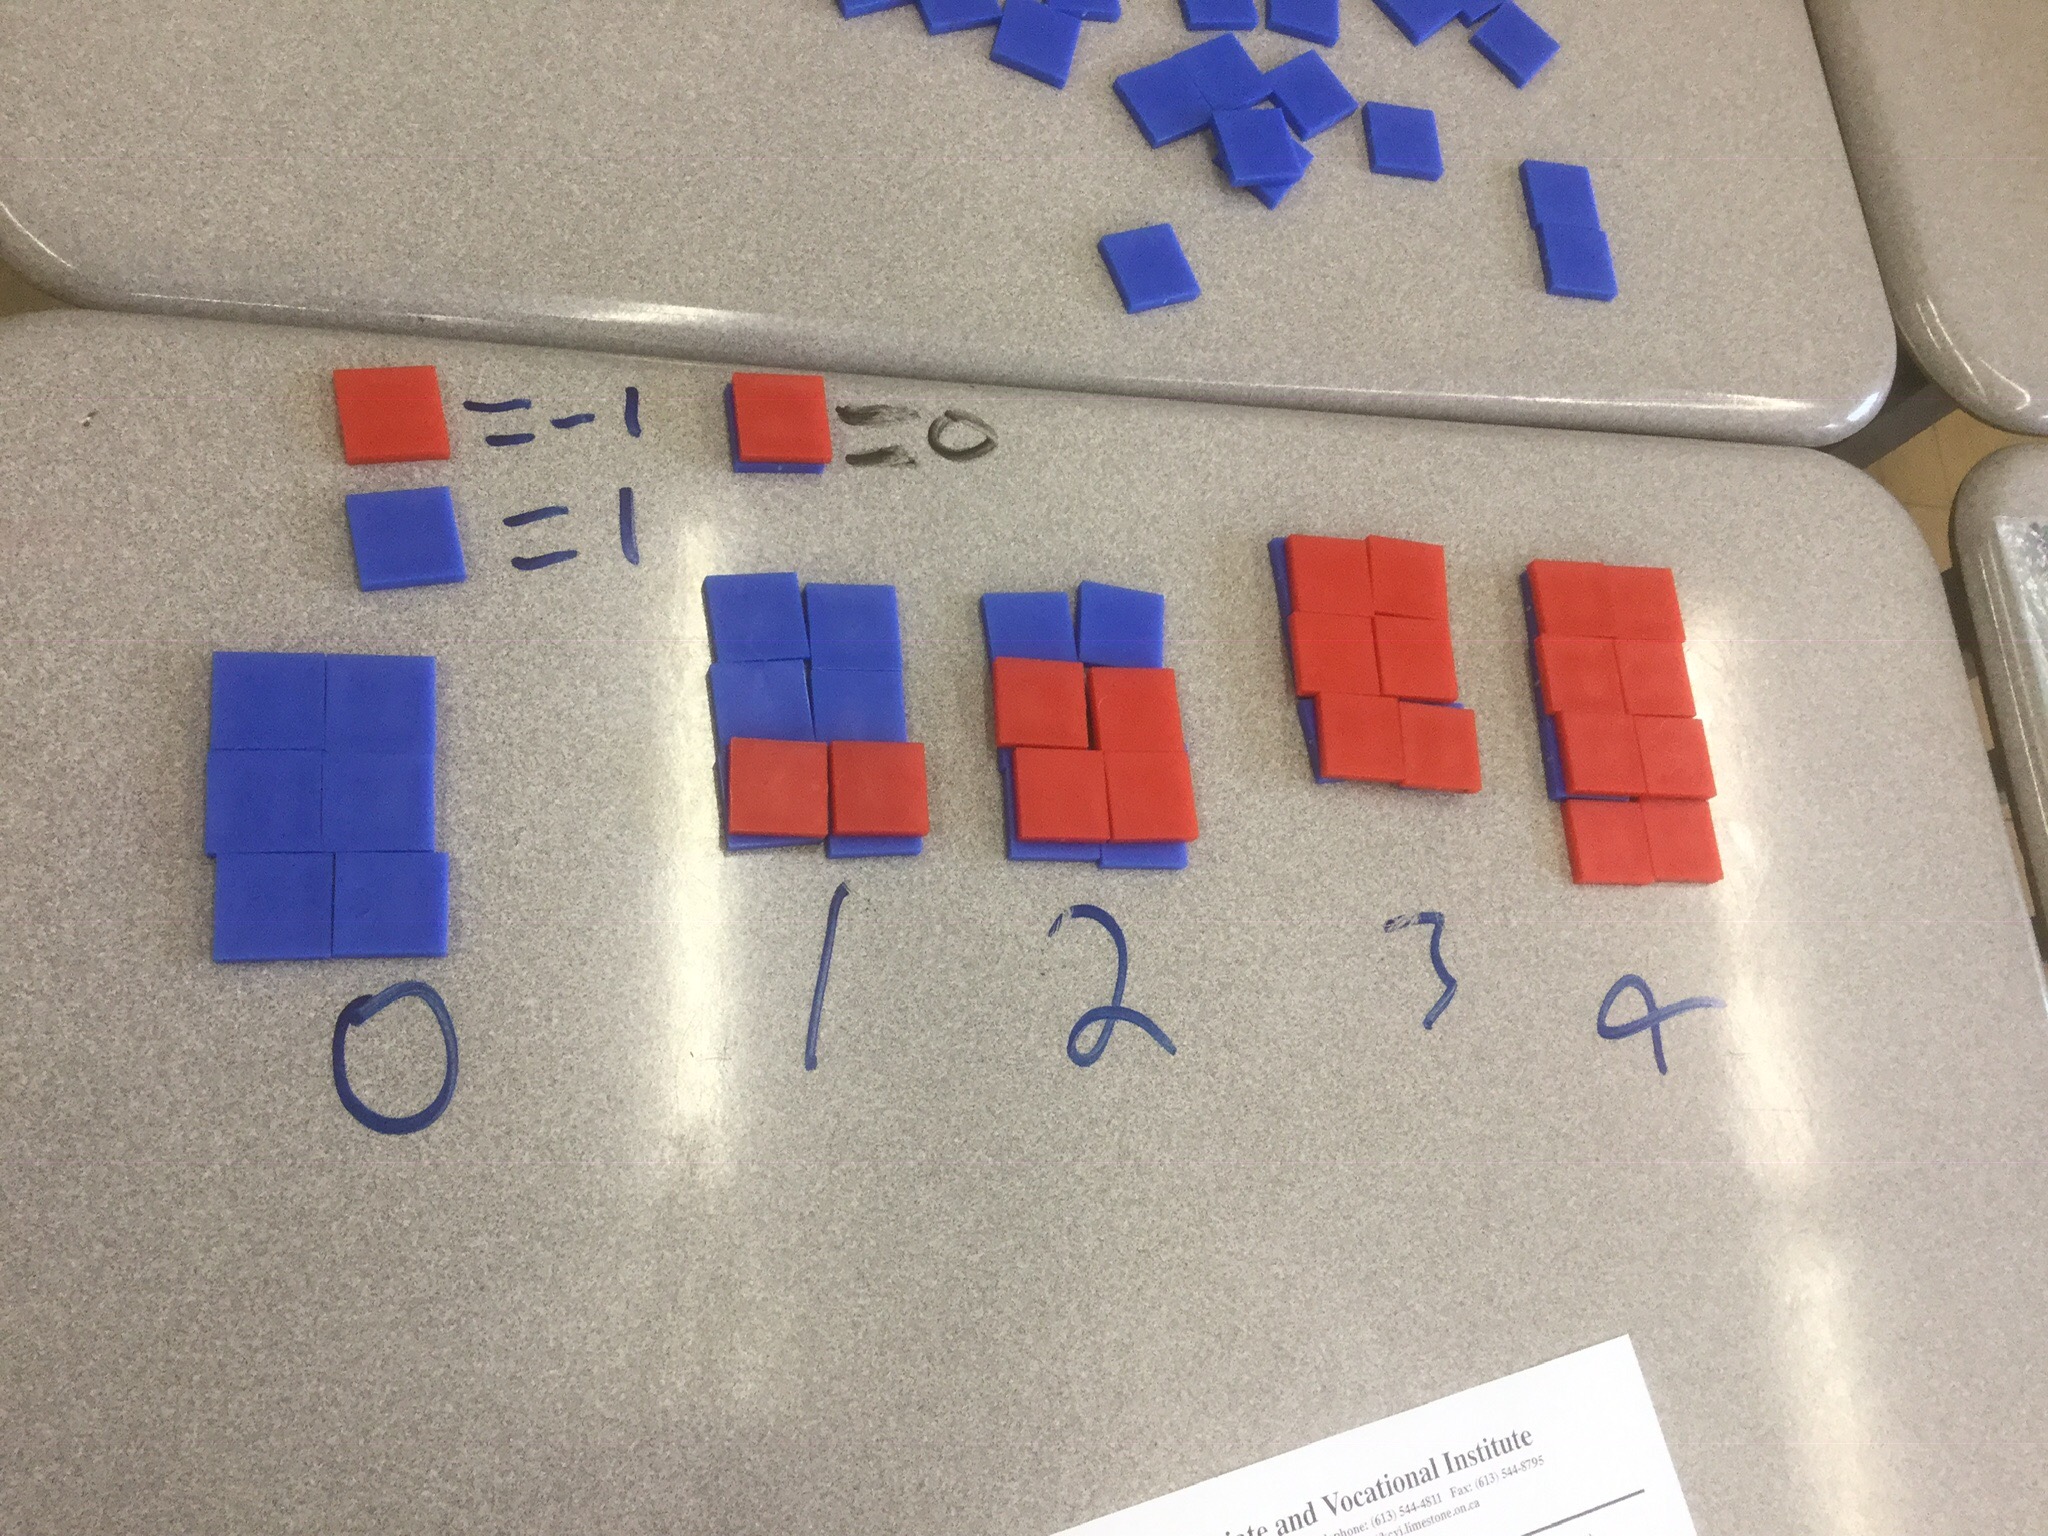
Our expression is 6-2n. We know that the constant is the number that isn’t beside the n. It is not dependent on n. It does not change…it is CONSTANT. In this image blue is representing positive, red represents negative and a sandwich of red on top of blue is equivalent to zero. We start with a constant of 6 blue tiles. And each figure number will have 2 groups of n that are negative (red) placed on the existing blue tiles. Figure 1 then is equivalent to 4, figure 2 is equivalent to 2 and figure 3 is 0 and figure 4 is negative 2.
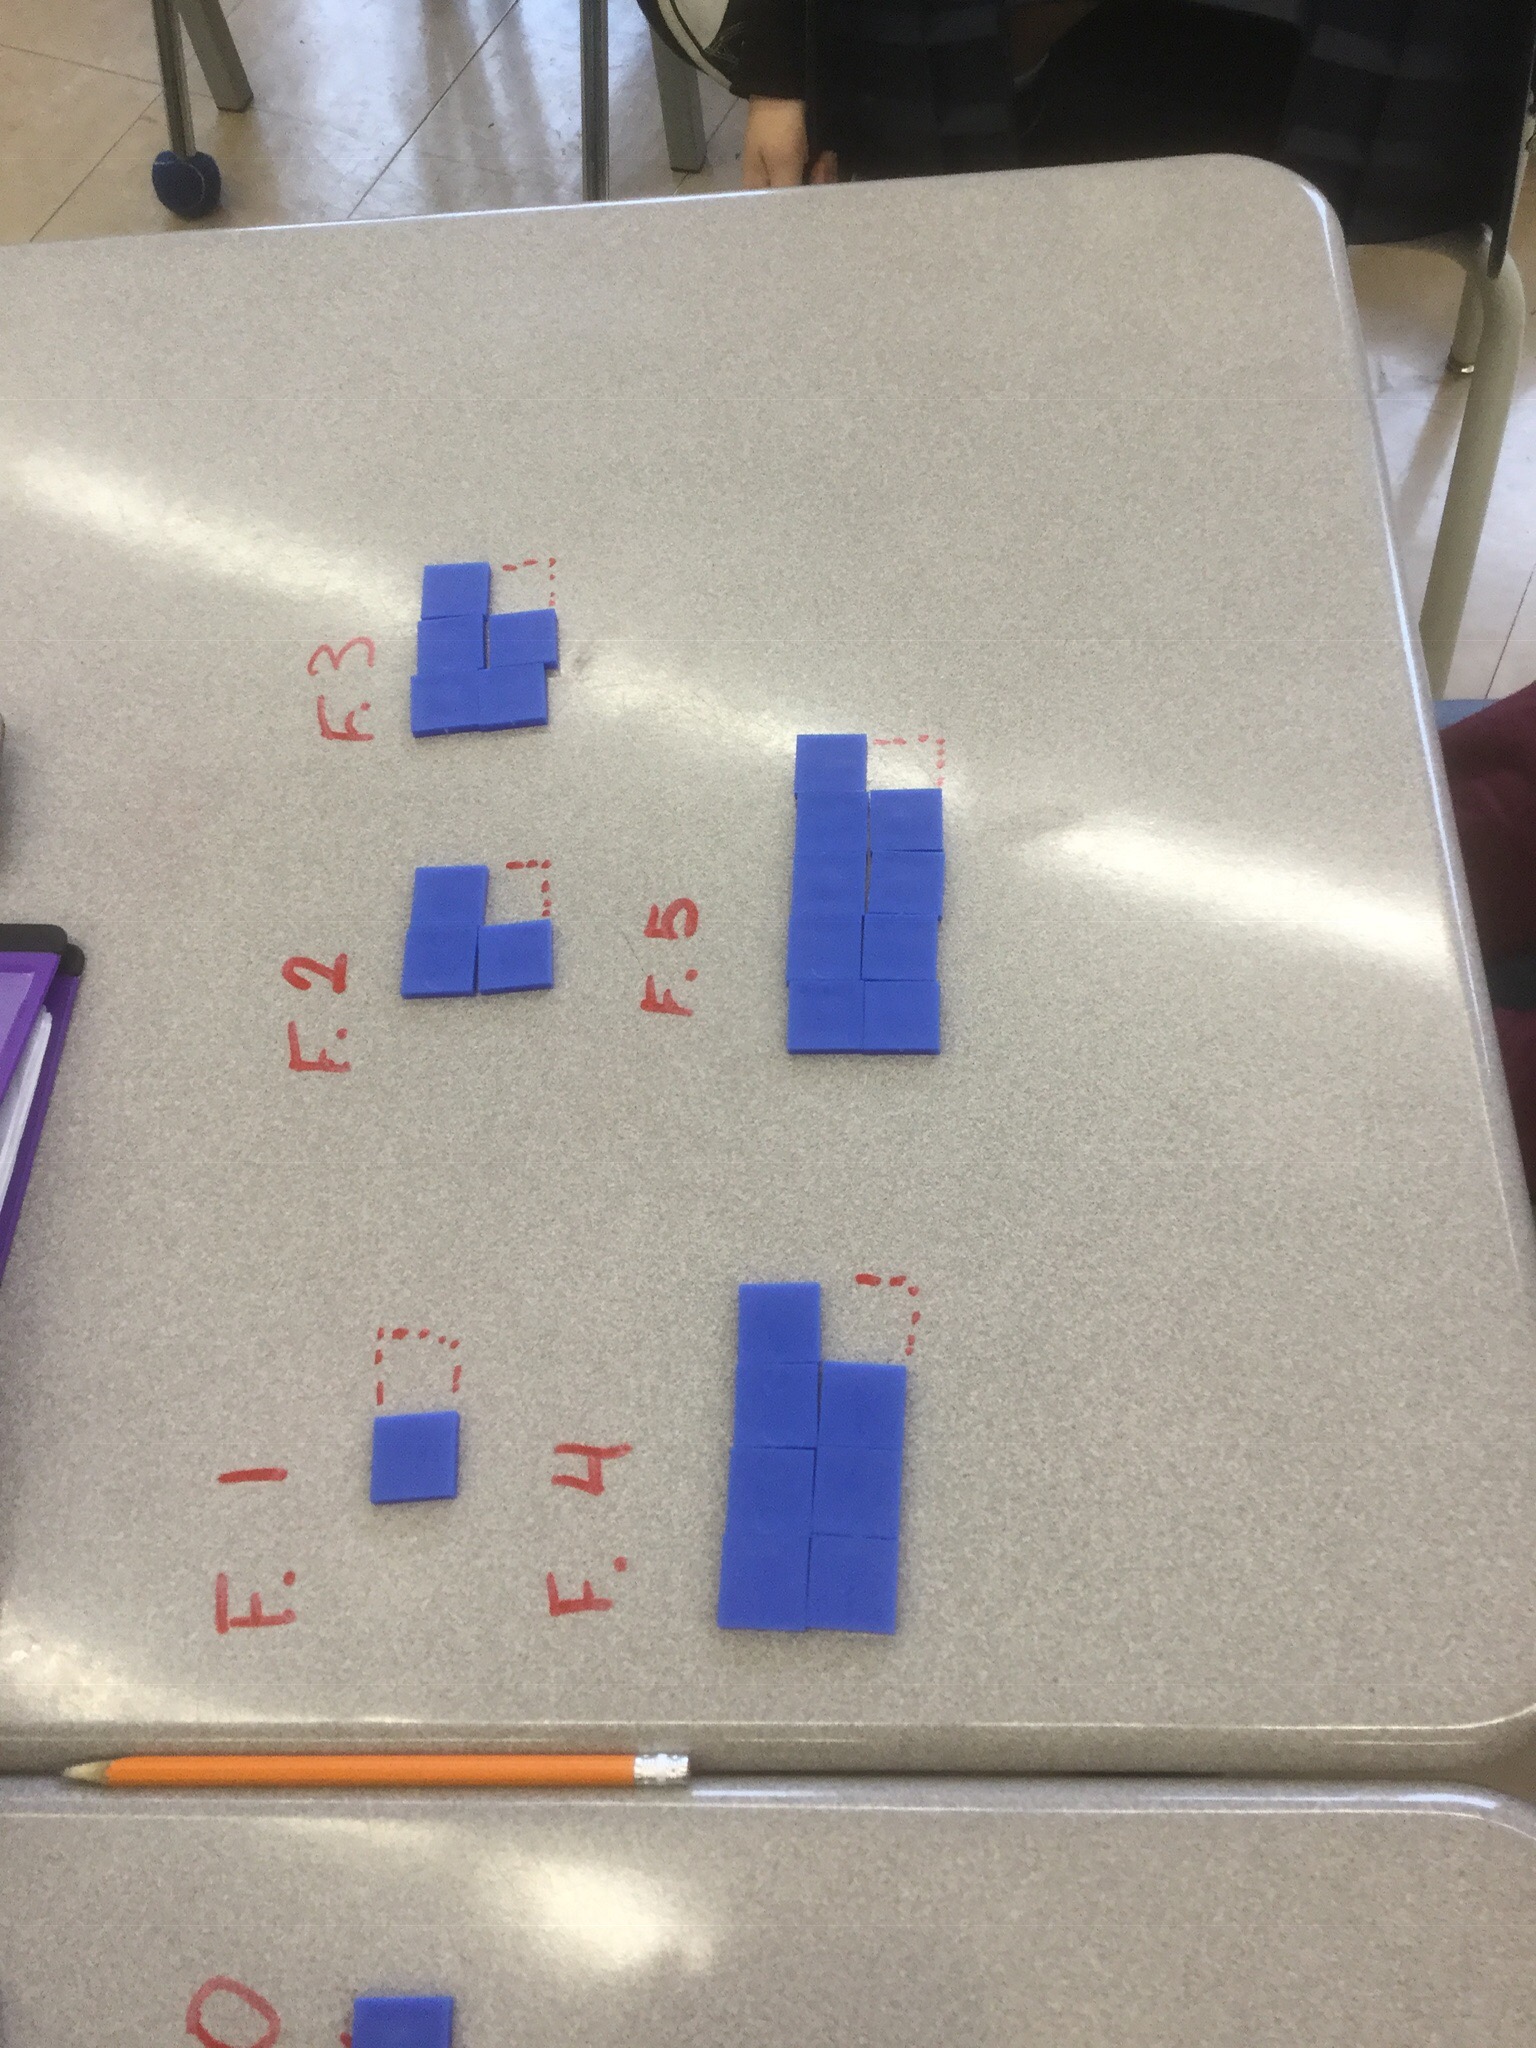
This is not the only way to see this…here’s another way to show negatives.
In this example the constant is -1 which can be interpreted as taking 1 away each time. This group shows 2 groups of n with one removed (dotted lines)
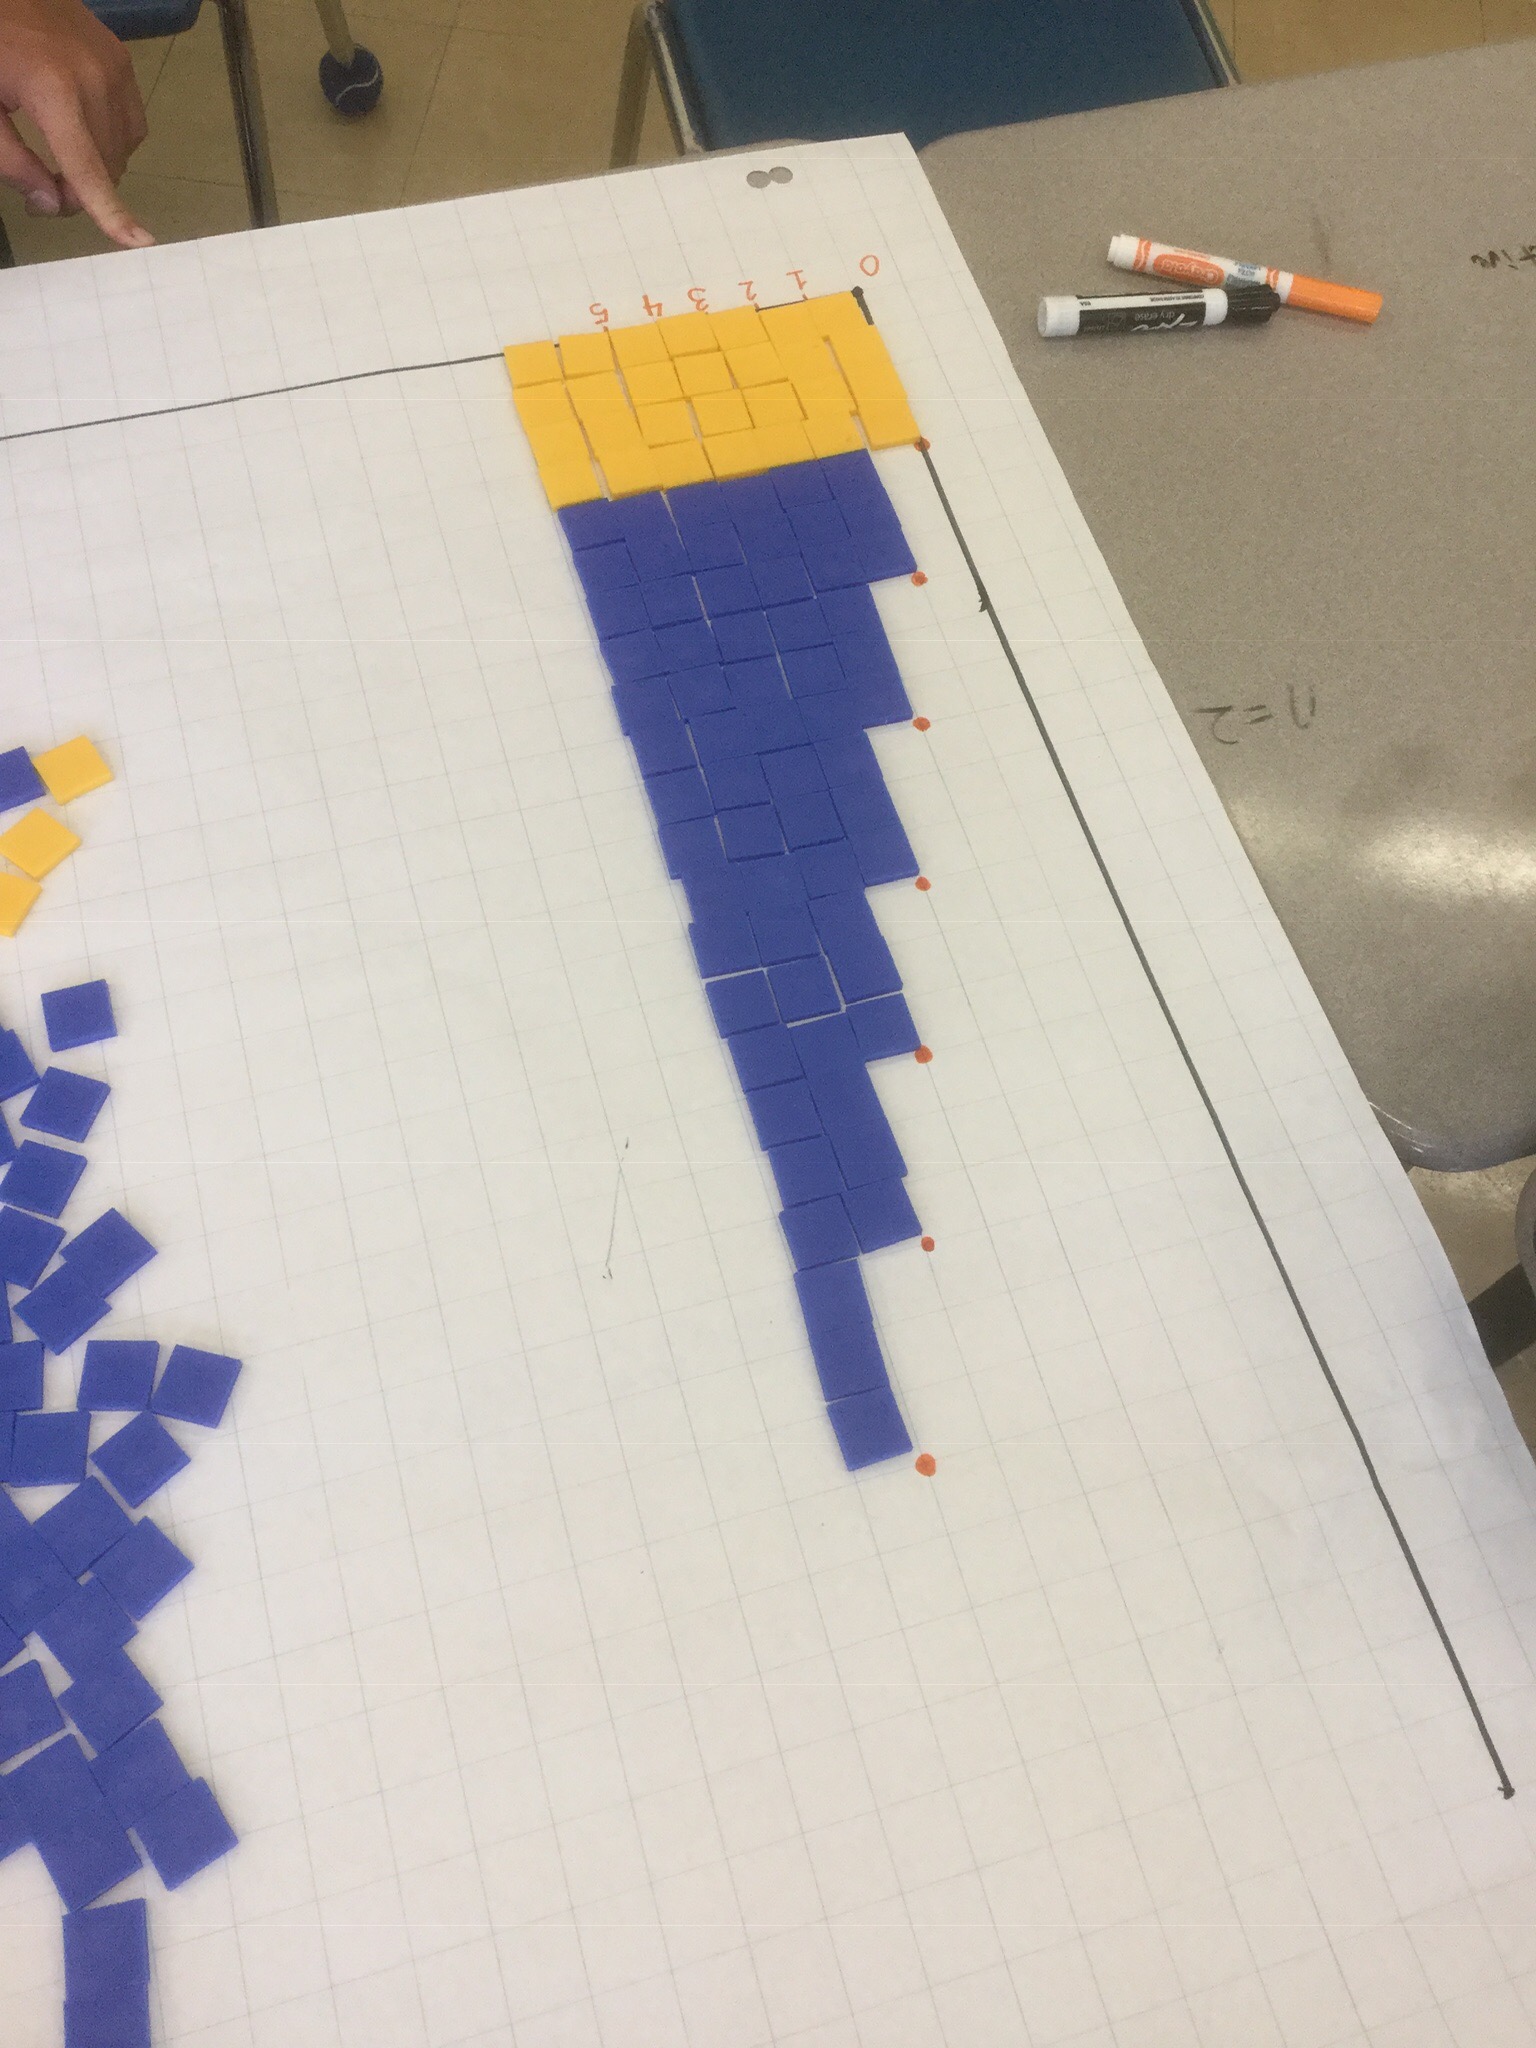
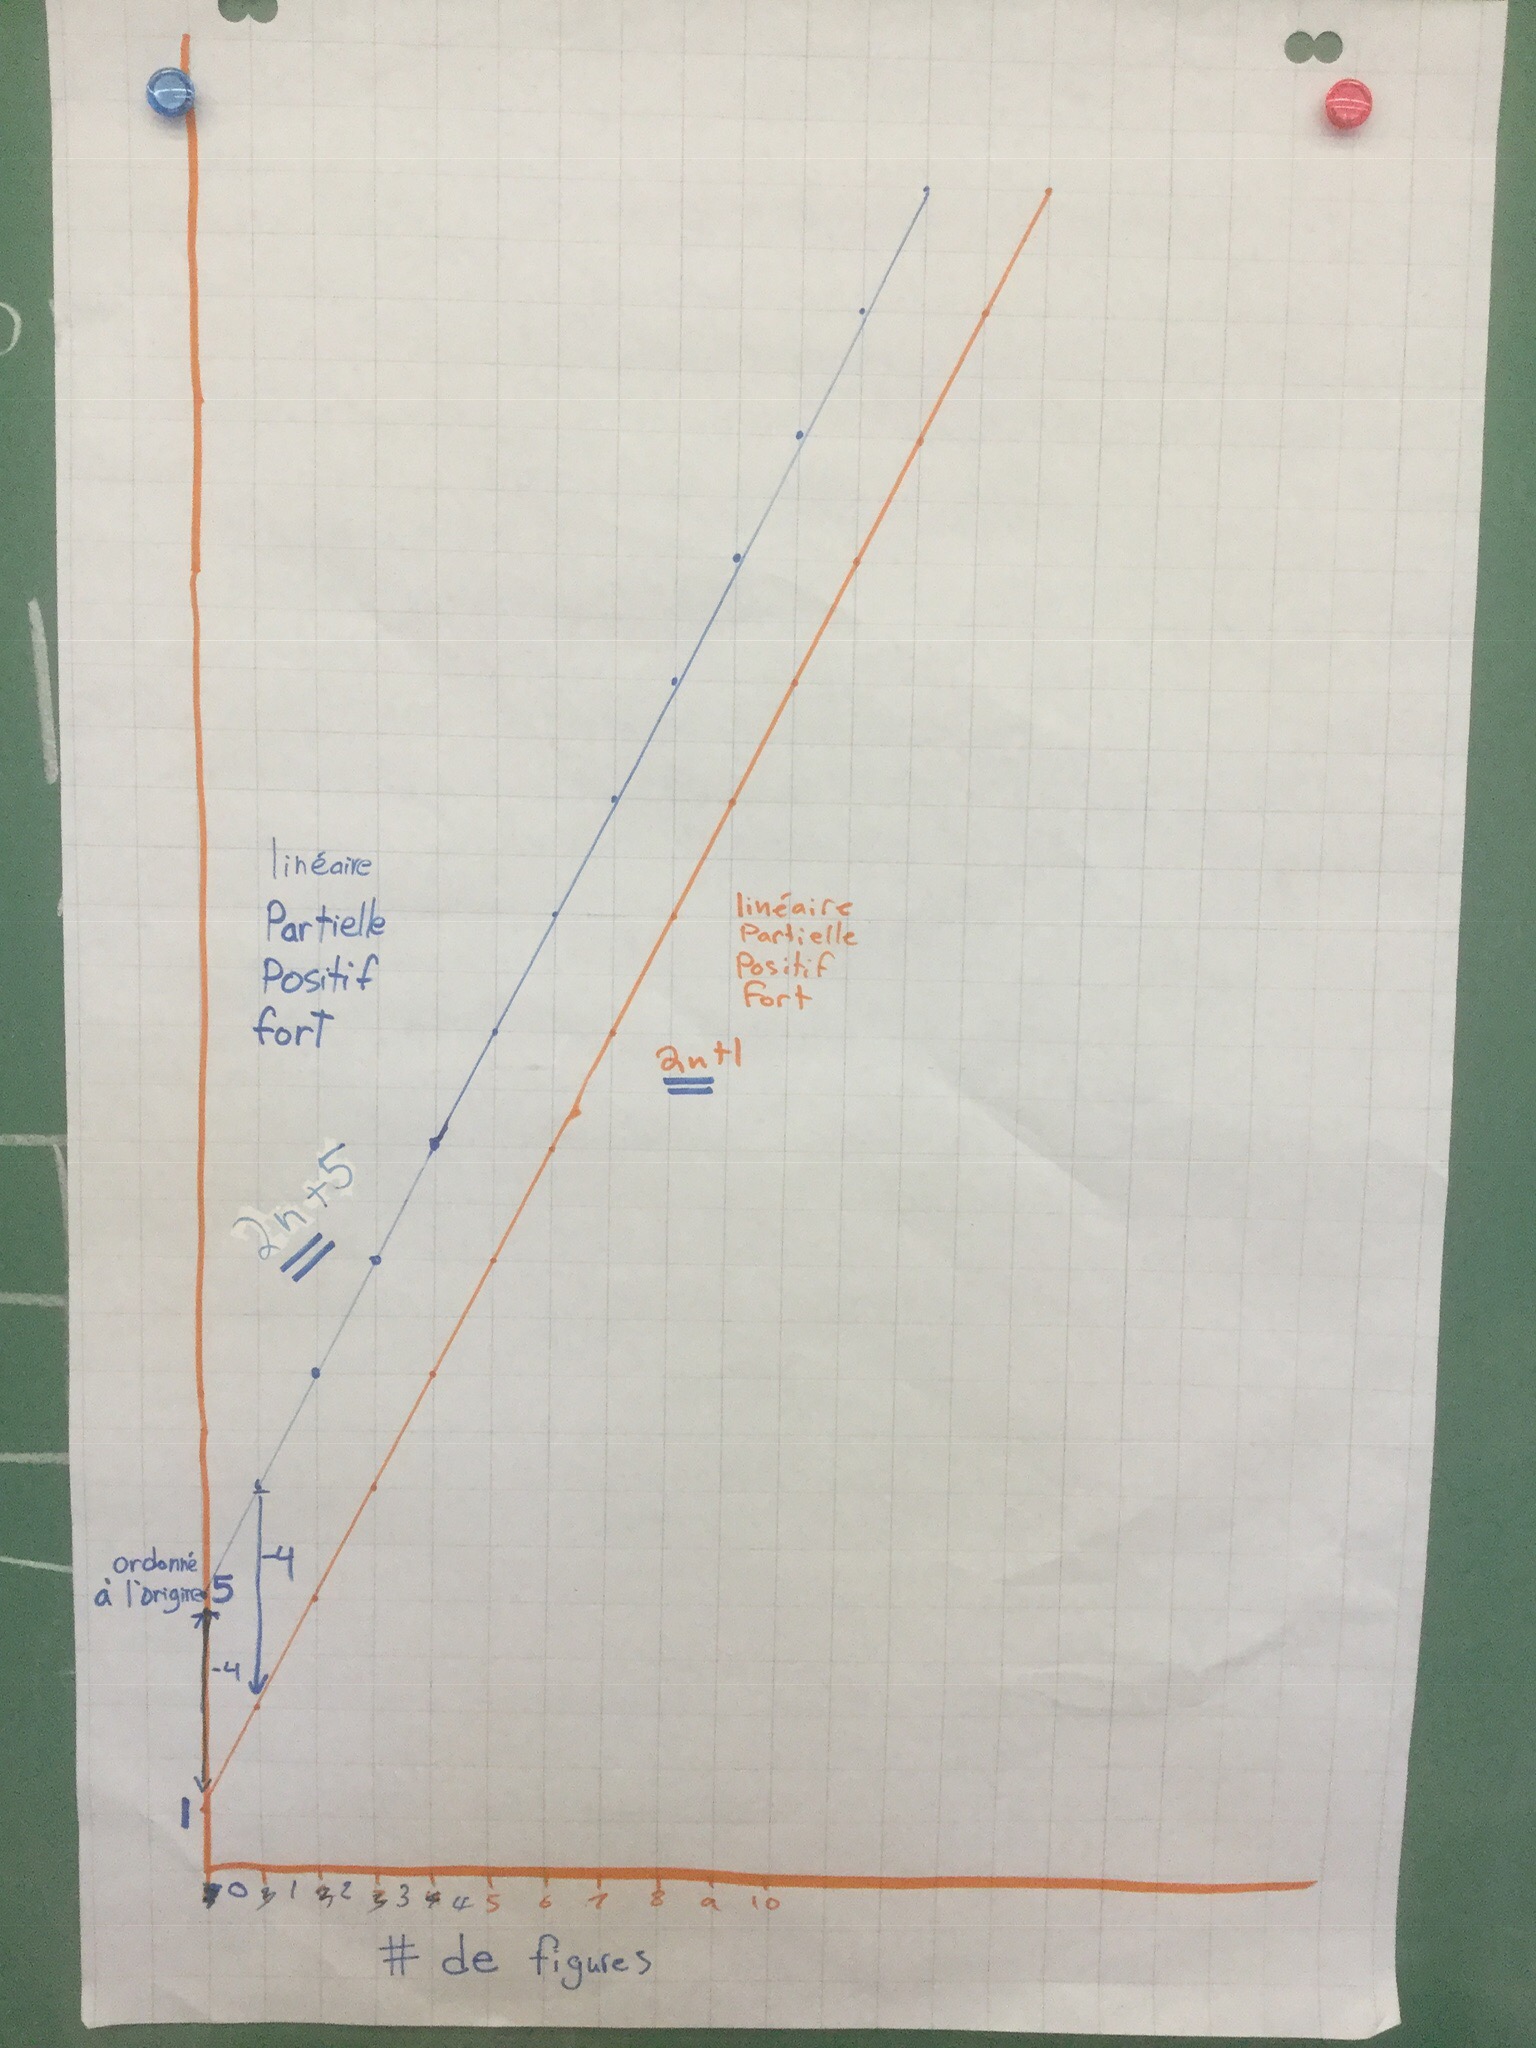
Each group was given 2 different expressions to build on their graph. We used the big chart paper because our tiles are the same as the squares. We lined up all the tiles from each figure vertically, and put a dot with marker on the top left corner of each column.
These dots (when the squares are removed) show the linear trend described in the expression. In this case it is 3n+4. The colours are being used to show the constant (yellow) and the growth. We are seeing 3 groups of n each time. We also noticed that the pattern looks like stairs, going up by 3 each time.
We posted all of our work up to admire and examine. We are really good at naming the trends we see in the graphs. We continued to use our new word “ordonnée à l’origine” (y intercept) and we connected that to the constant in the expression and the pattern. That is the same as figure zero.
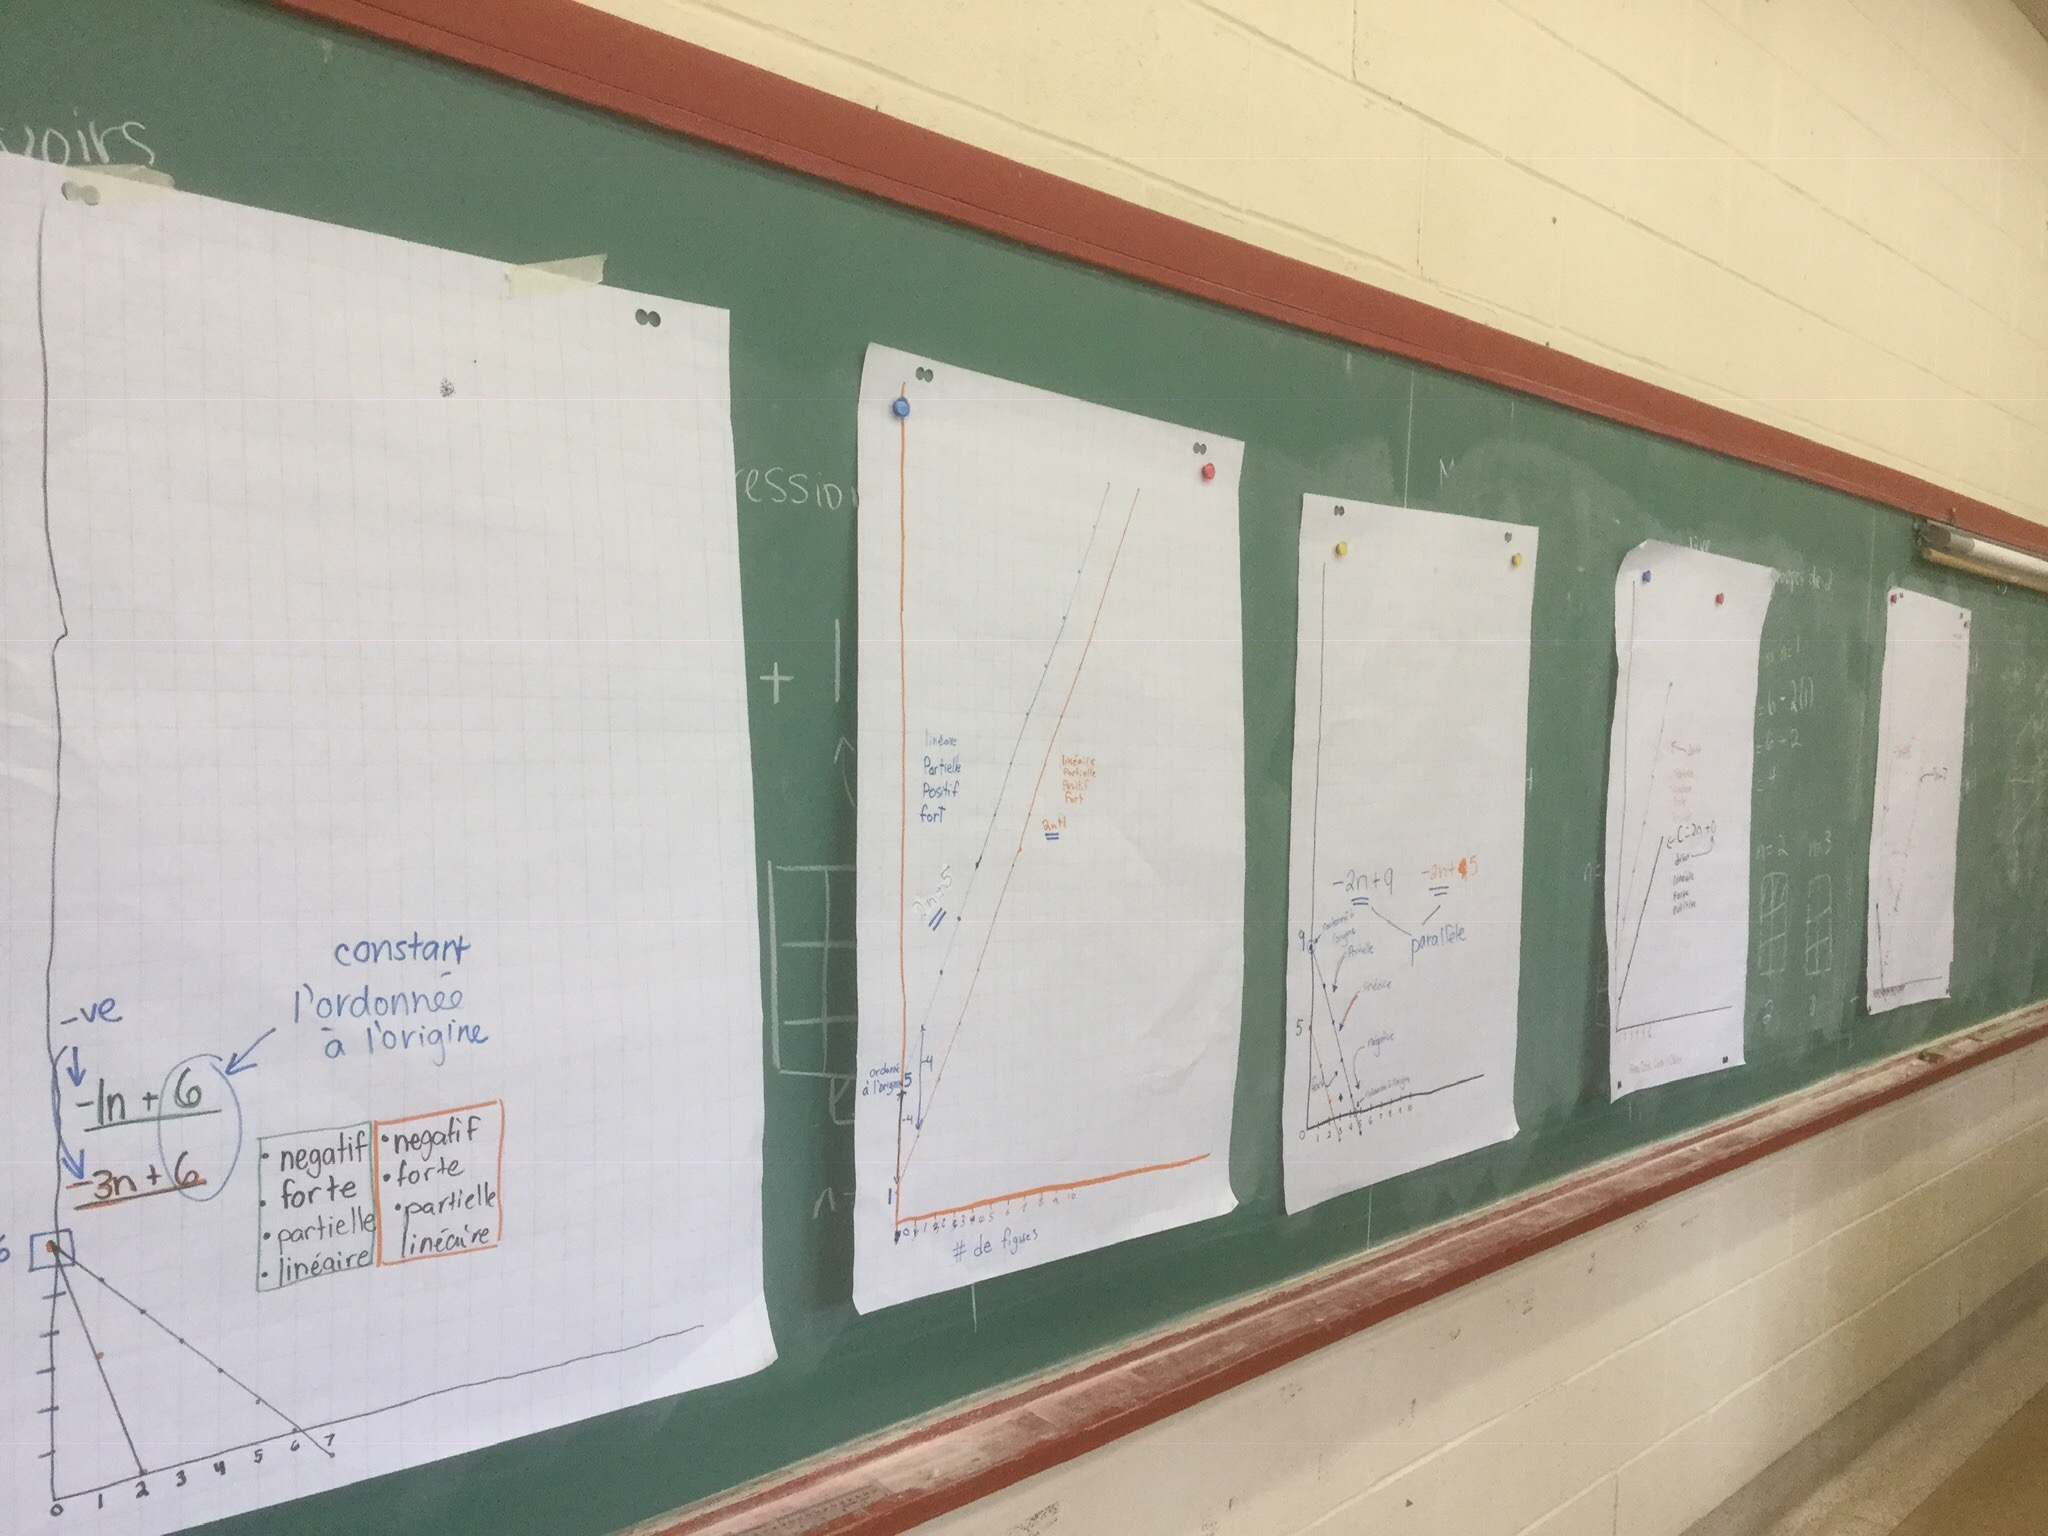
We looked at positive and negative trends, we looked at parallel lines…those have the same coefficient in the expression….the word we use for that is “taux” (rate)
We also noticed that the bigger the rate, the steeper the line, because the stairs are each higher.

We are now pretty comfortable working with visual patterns and extending our patterning to a graph. We’ll get to show what we know tomorrow on a quiz.
