Growth rate of our beans
Today we looked at our beans’ growth. We have made scatter plots (and remade scatter plots). We are sure our axes are the right way around….we are sure that we have left space for weekends (even though we weren’t here to measure we know the beans still grew). We have looked at drawing lines of best fit, or curves of best fit. We have extrapolated and interpolated using these lines and curves.
Today’s new bean graph task was to determine the initial growth rate of the beans.
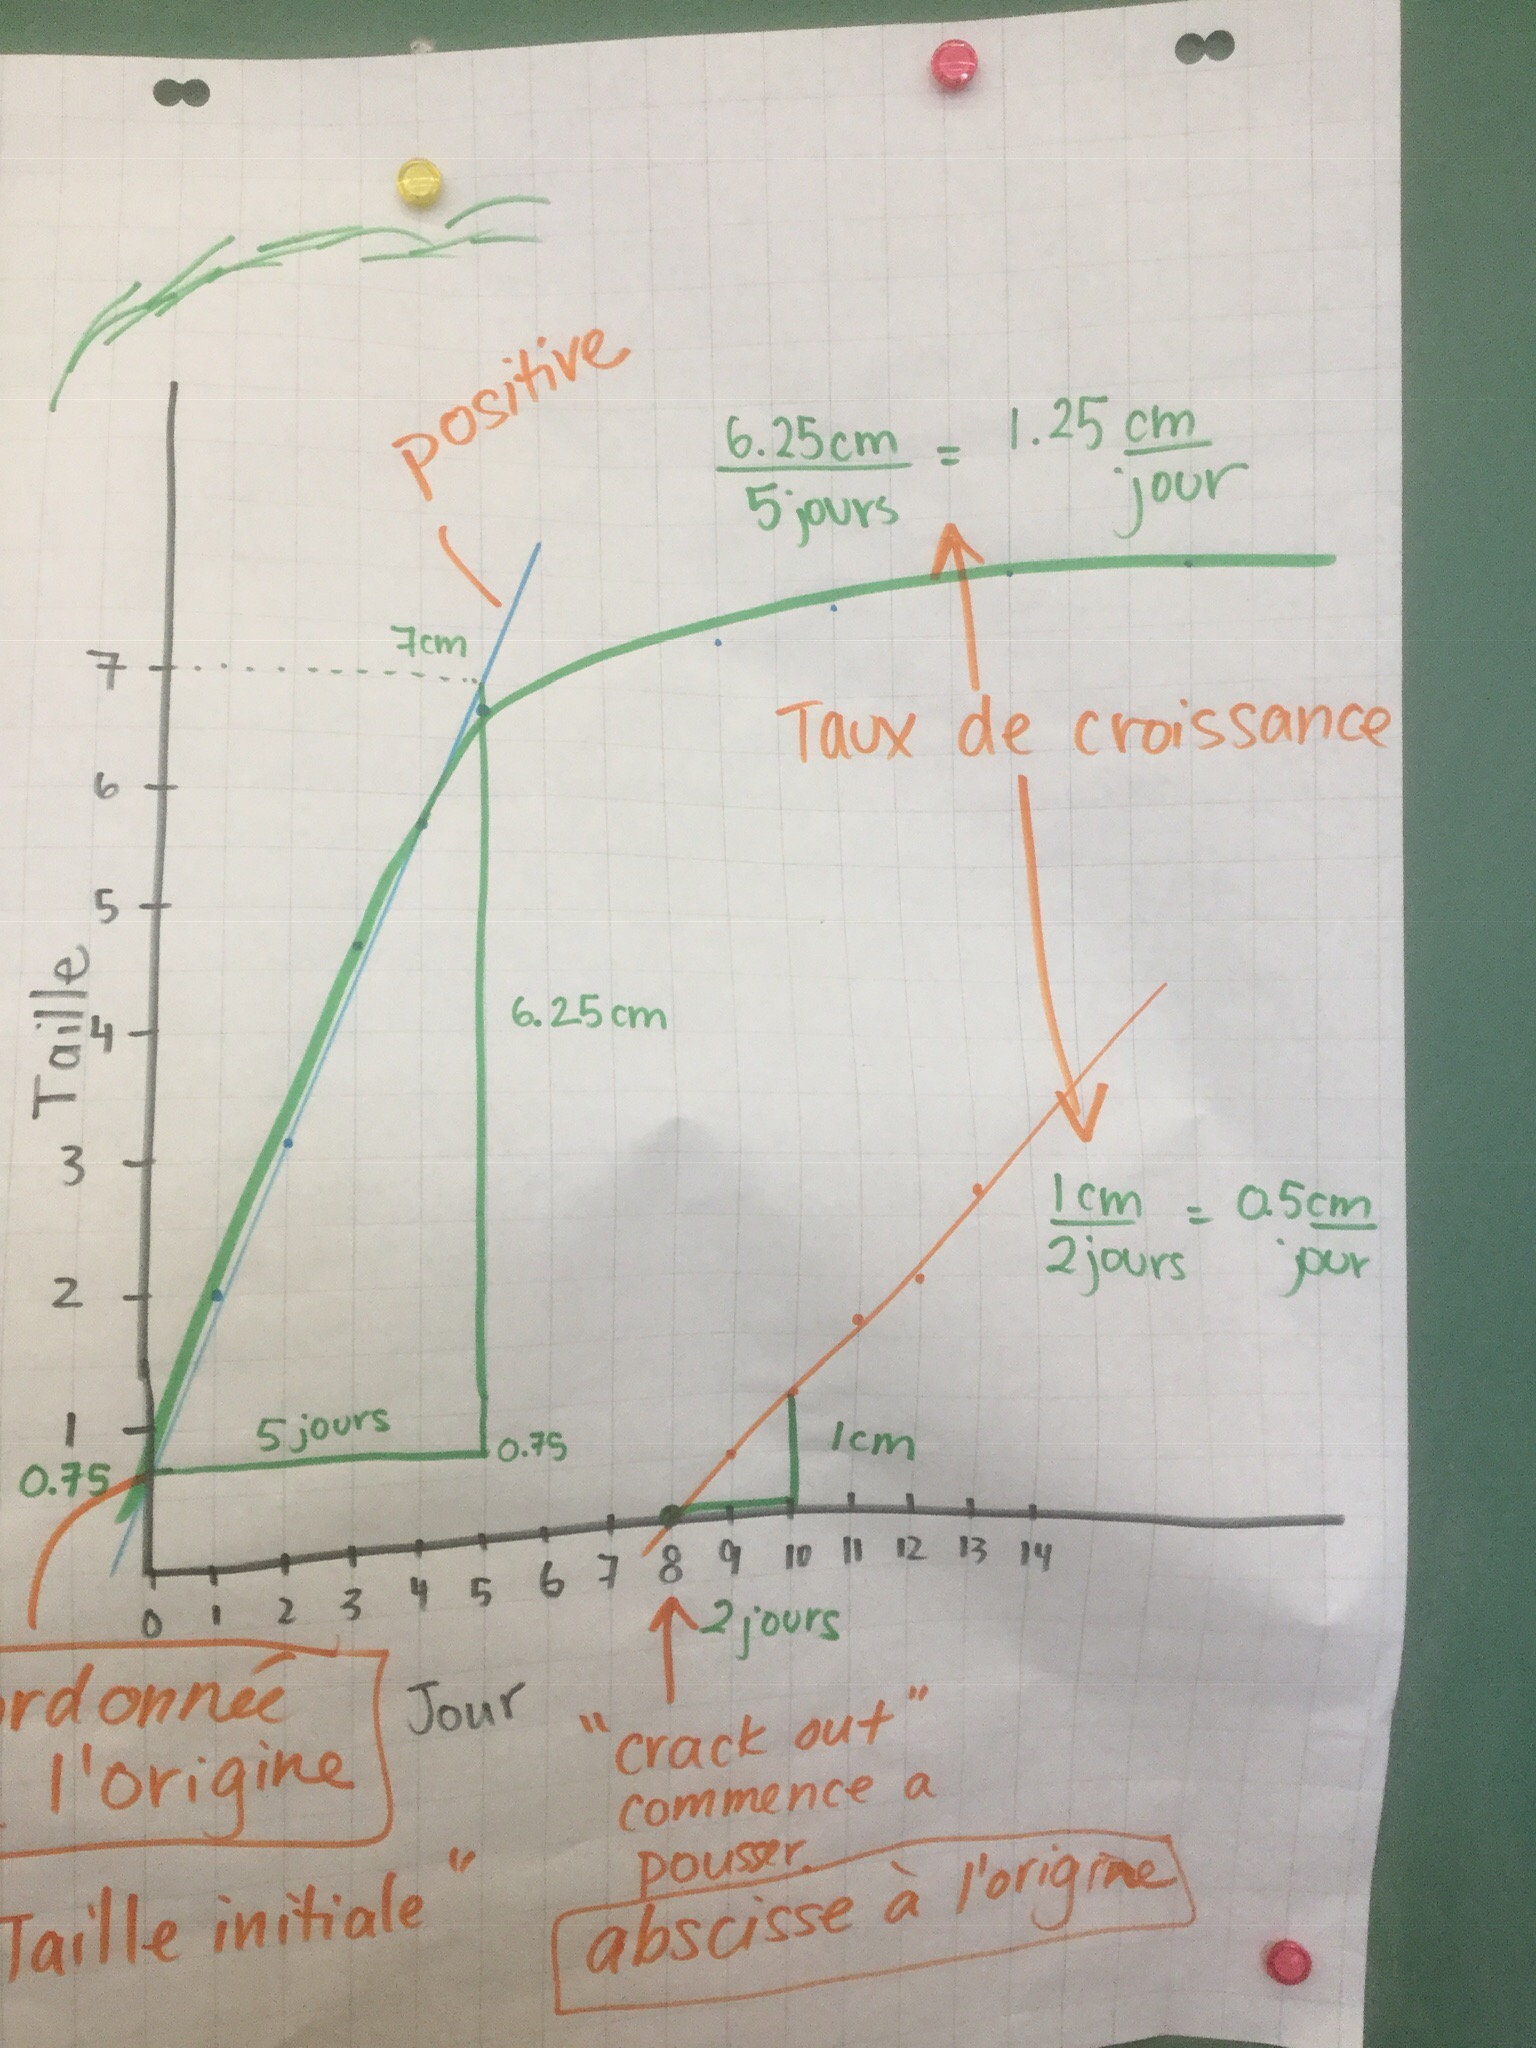
Here’s a graph we made to help us understand how to do that. We look at our line of best fit (or the best linear approximation of the curve at the start) and we pick 2 points on the line, and then make a right triangle. We look at the horizontal leg of the triangle to determine the number of days, and the vertical leg to determine the growth that happened. We make a fraction showing cm/day and then we divide the numerator by the denominator to determine the growth that happens in one day.
We also looked at steeper lines and saw that they have a higher growth rate, and less steel lines are growing, but not as fast.
We reviewed vocabulary for the intercepts. In this case the y intercept (l’ordonnée à l’origine) shows the initial height of the bean plant. In this case the x intercept (l’abscisse à l’origine) shows the first day that the bean cracks out of the soil and can be measured.
We have to be careful when we are using graphs that we read the numbers from the y axis, and not just count squares. Each square vertically on this graph represents 0.5cm.
