Grade 9s Intro to scatter plots, and use of formulae
February 19, 2019
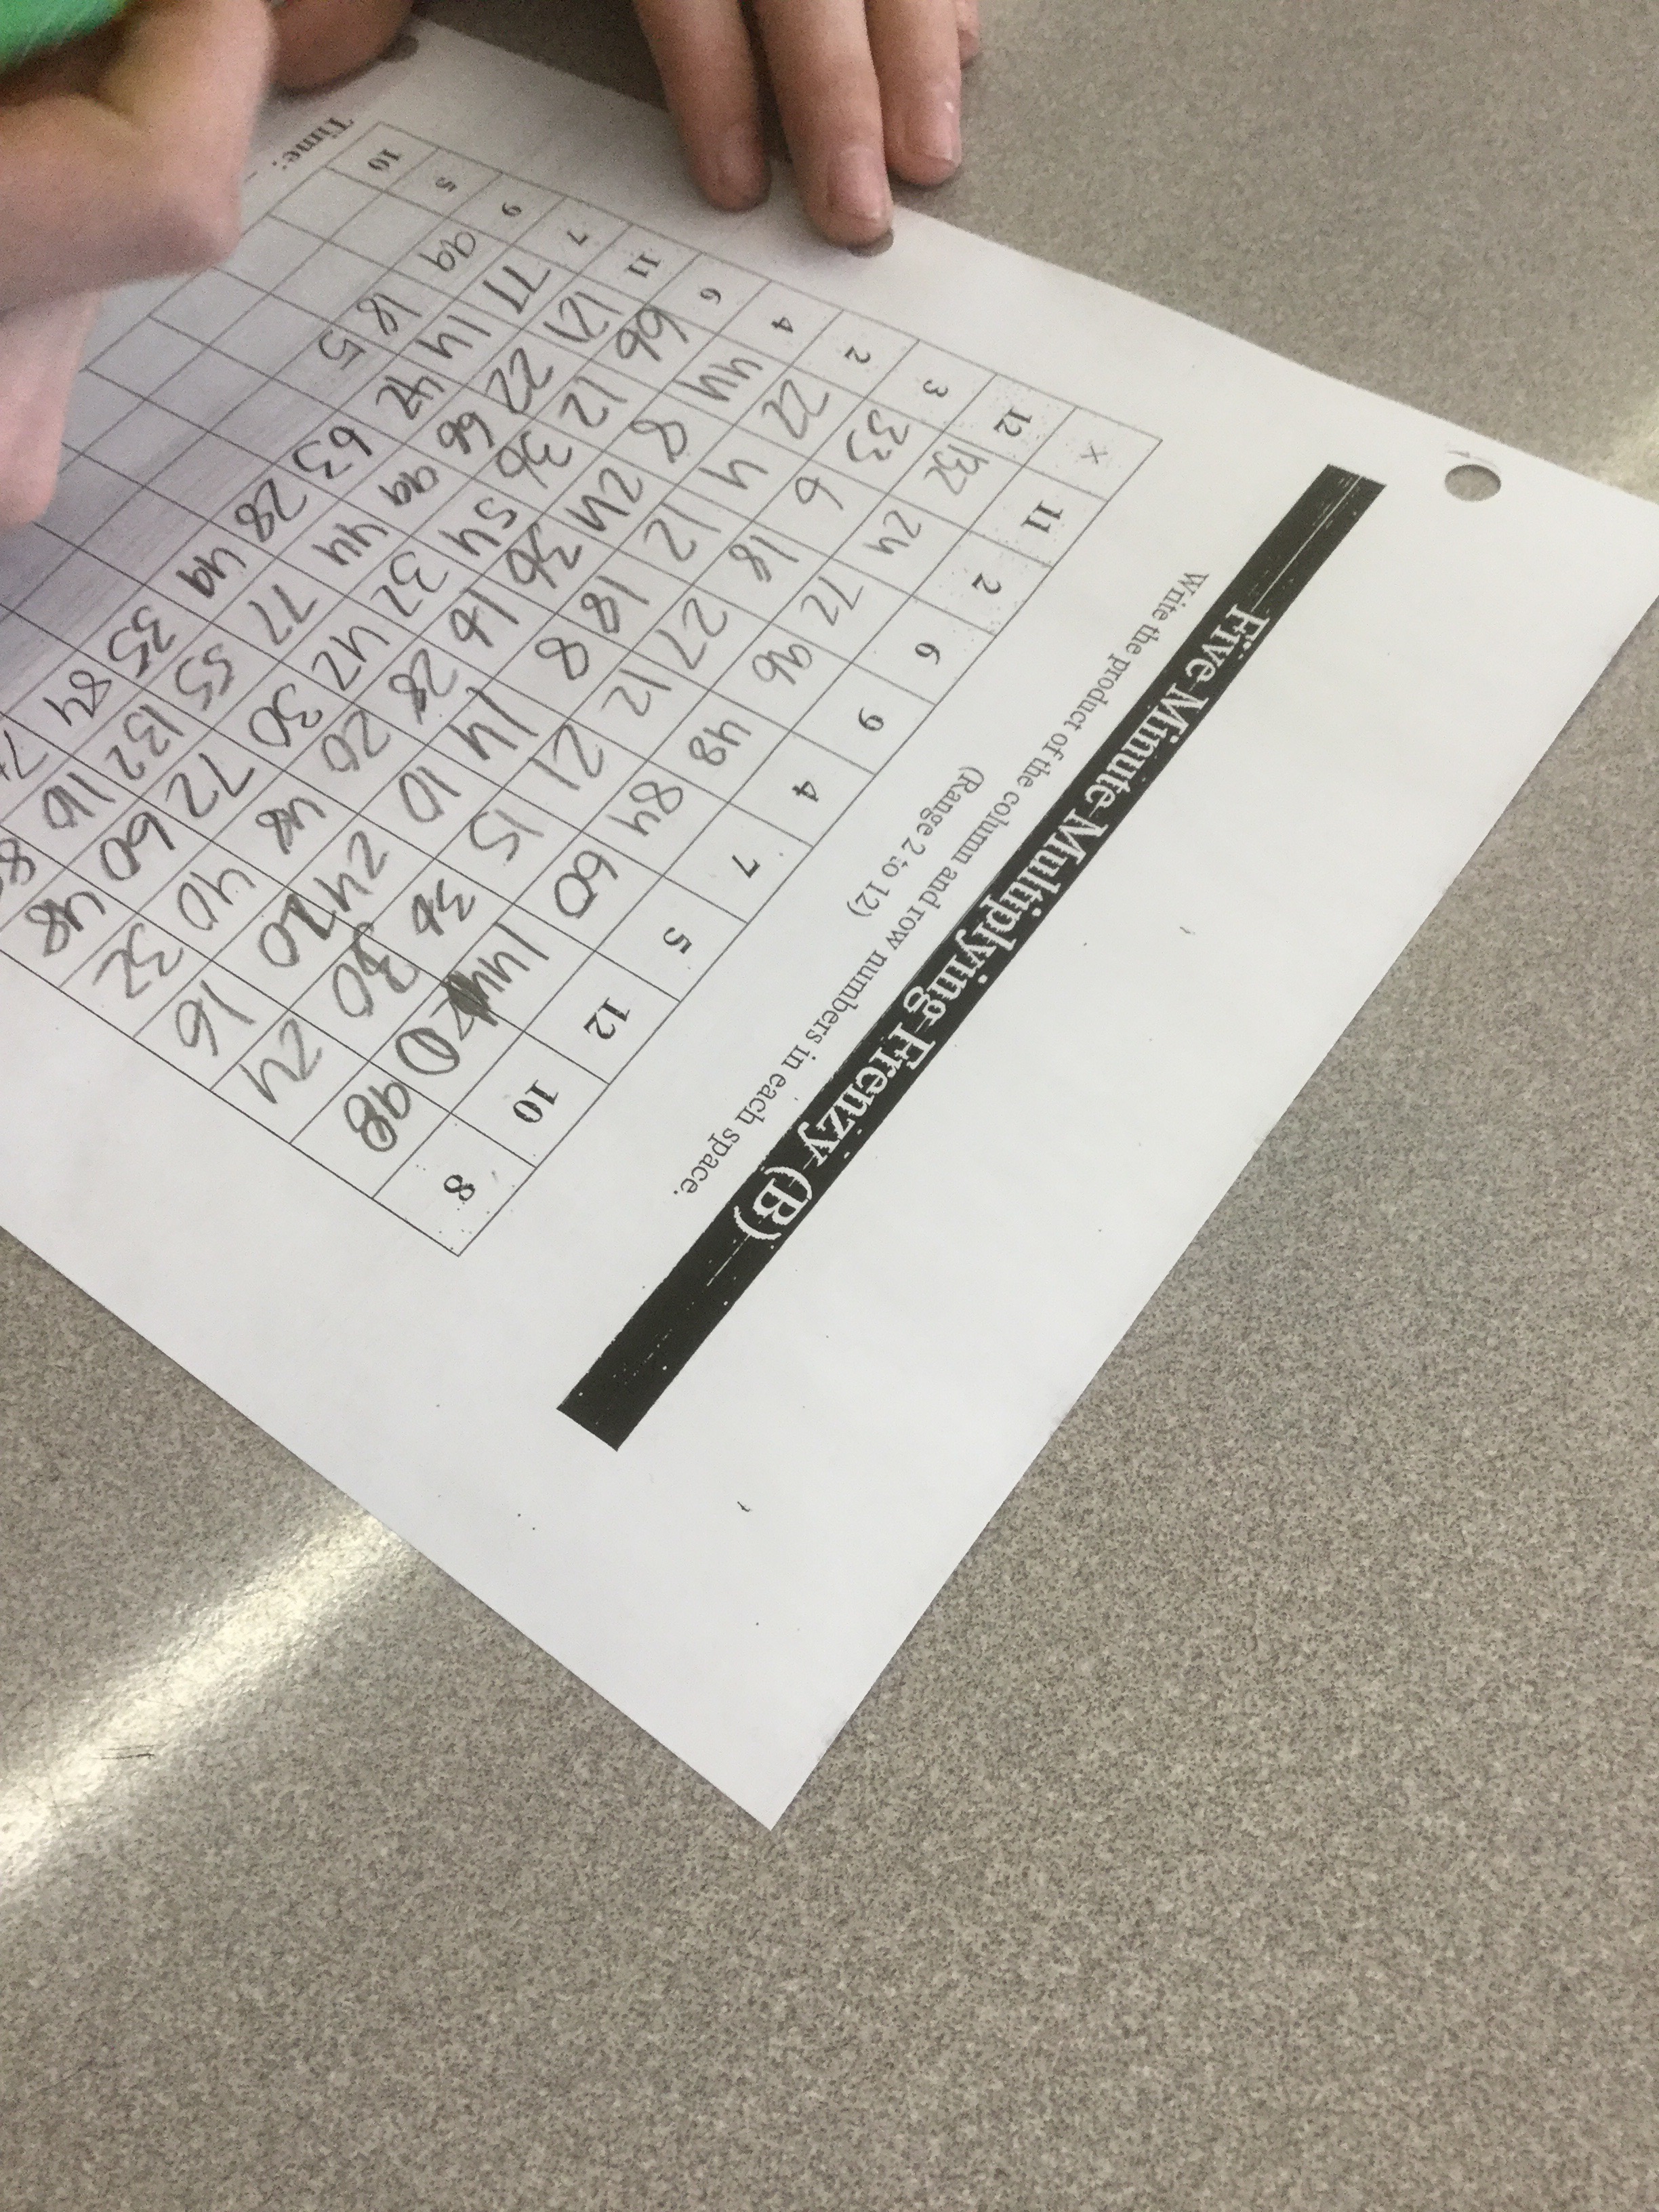
We started off by multiplying again to add more data to our chart. We will plot our data in a week or two.
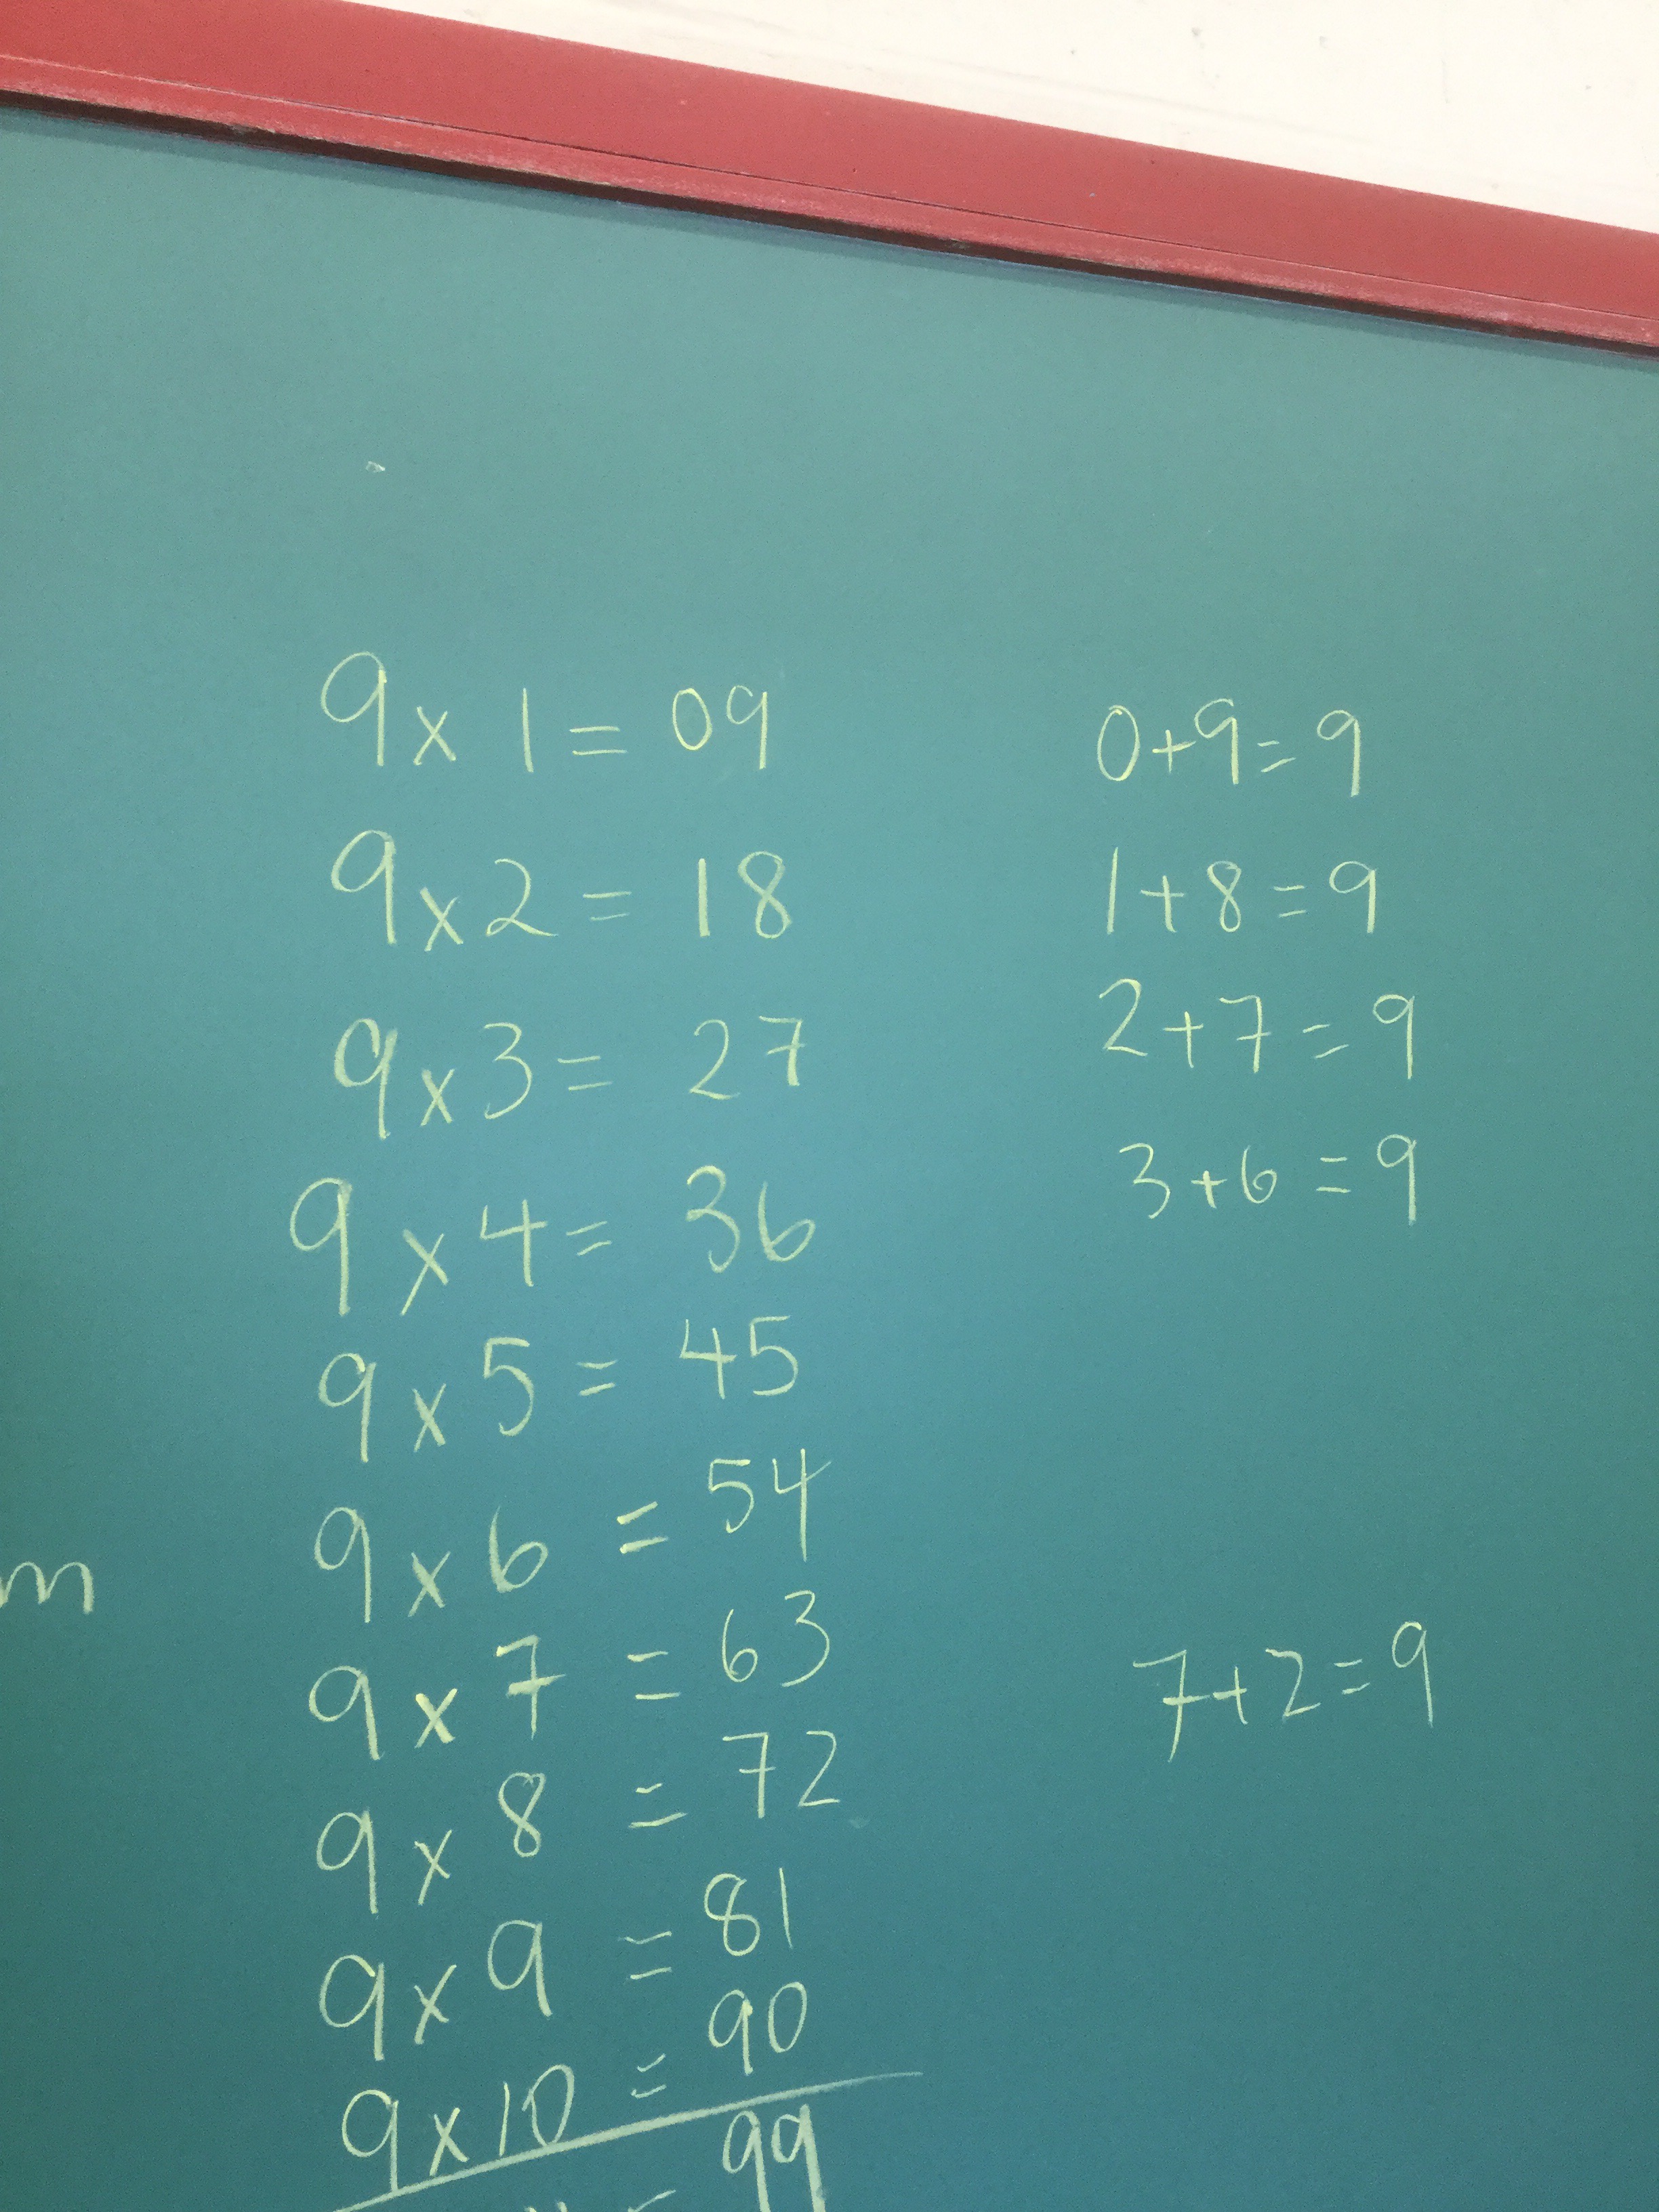
We have talked about a few strategies along the way, to make multiplying make sense in different ways. Today we talked about 9s.
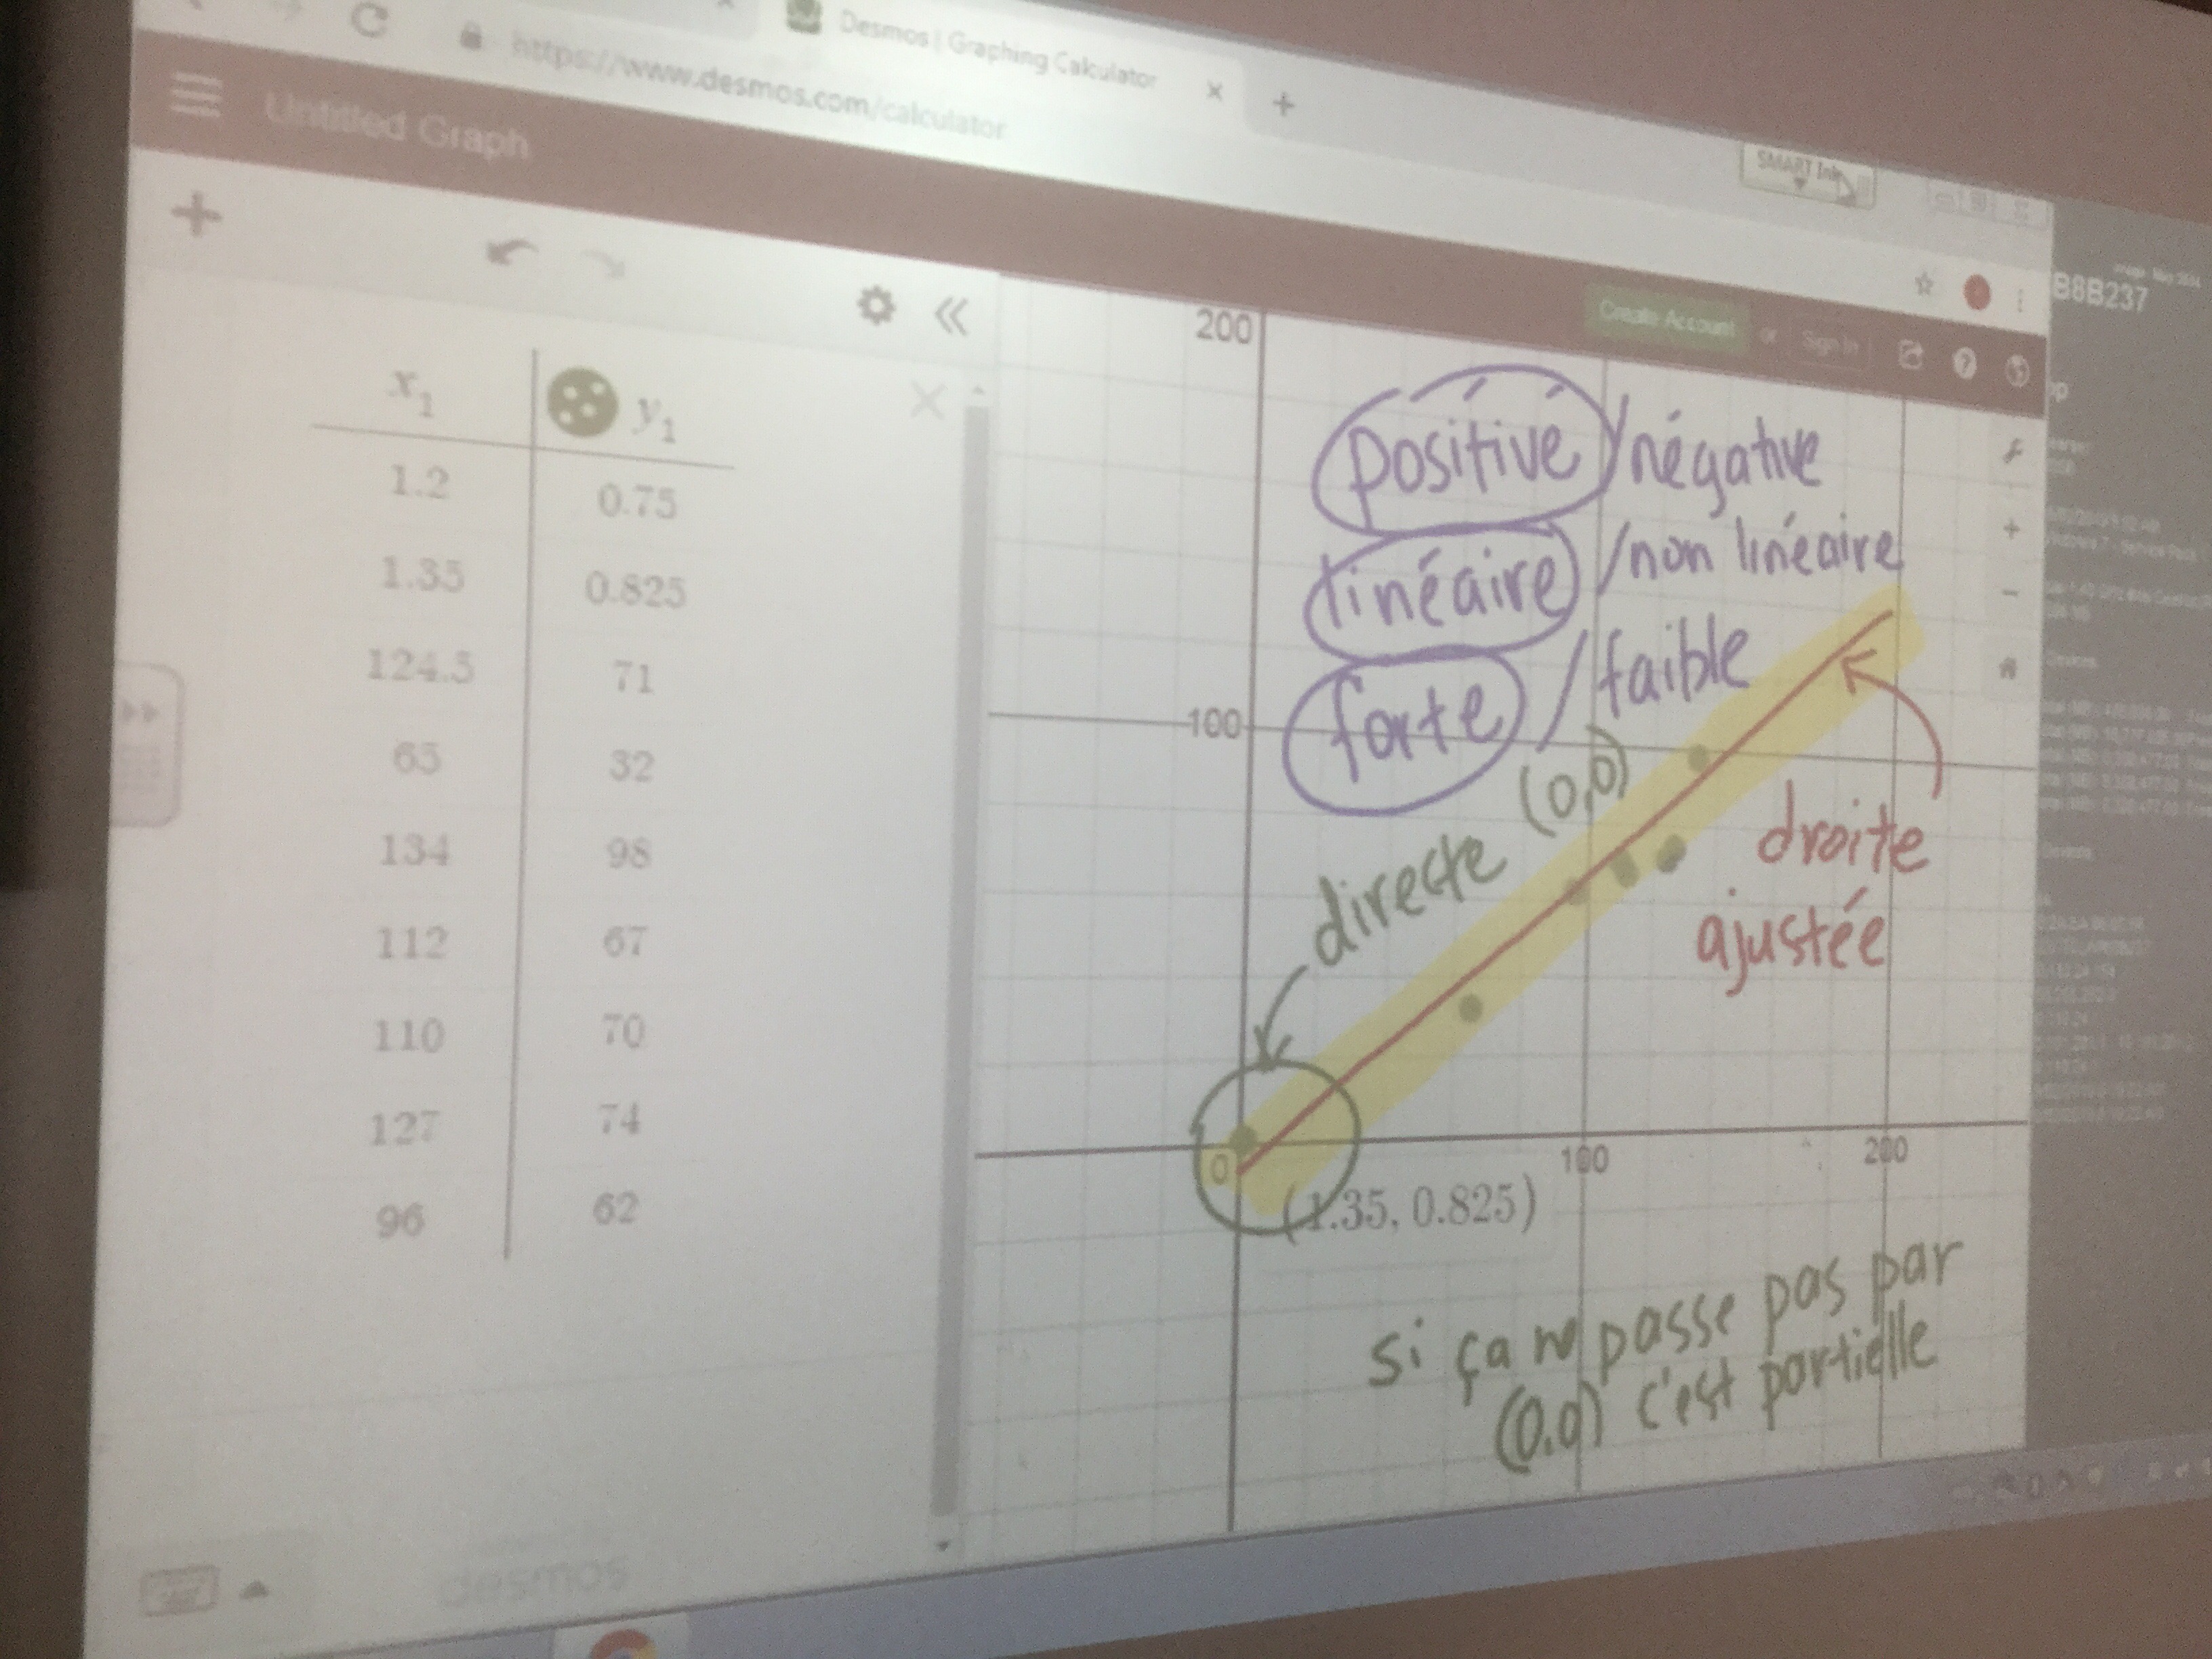
We also used desmos to make a graph of our tv lengths and widths that we measured. We introduced words to describe the trend we see. We have some homework to do tonight so we can practice these skills. Graphing with desmos is faster than by hand because the scale is set up for us automatically.
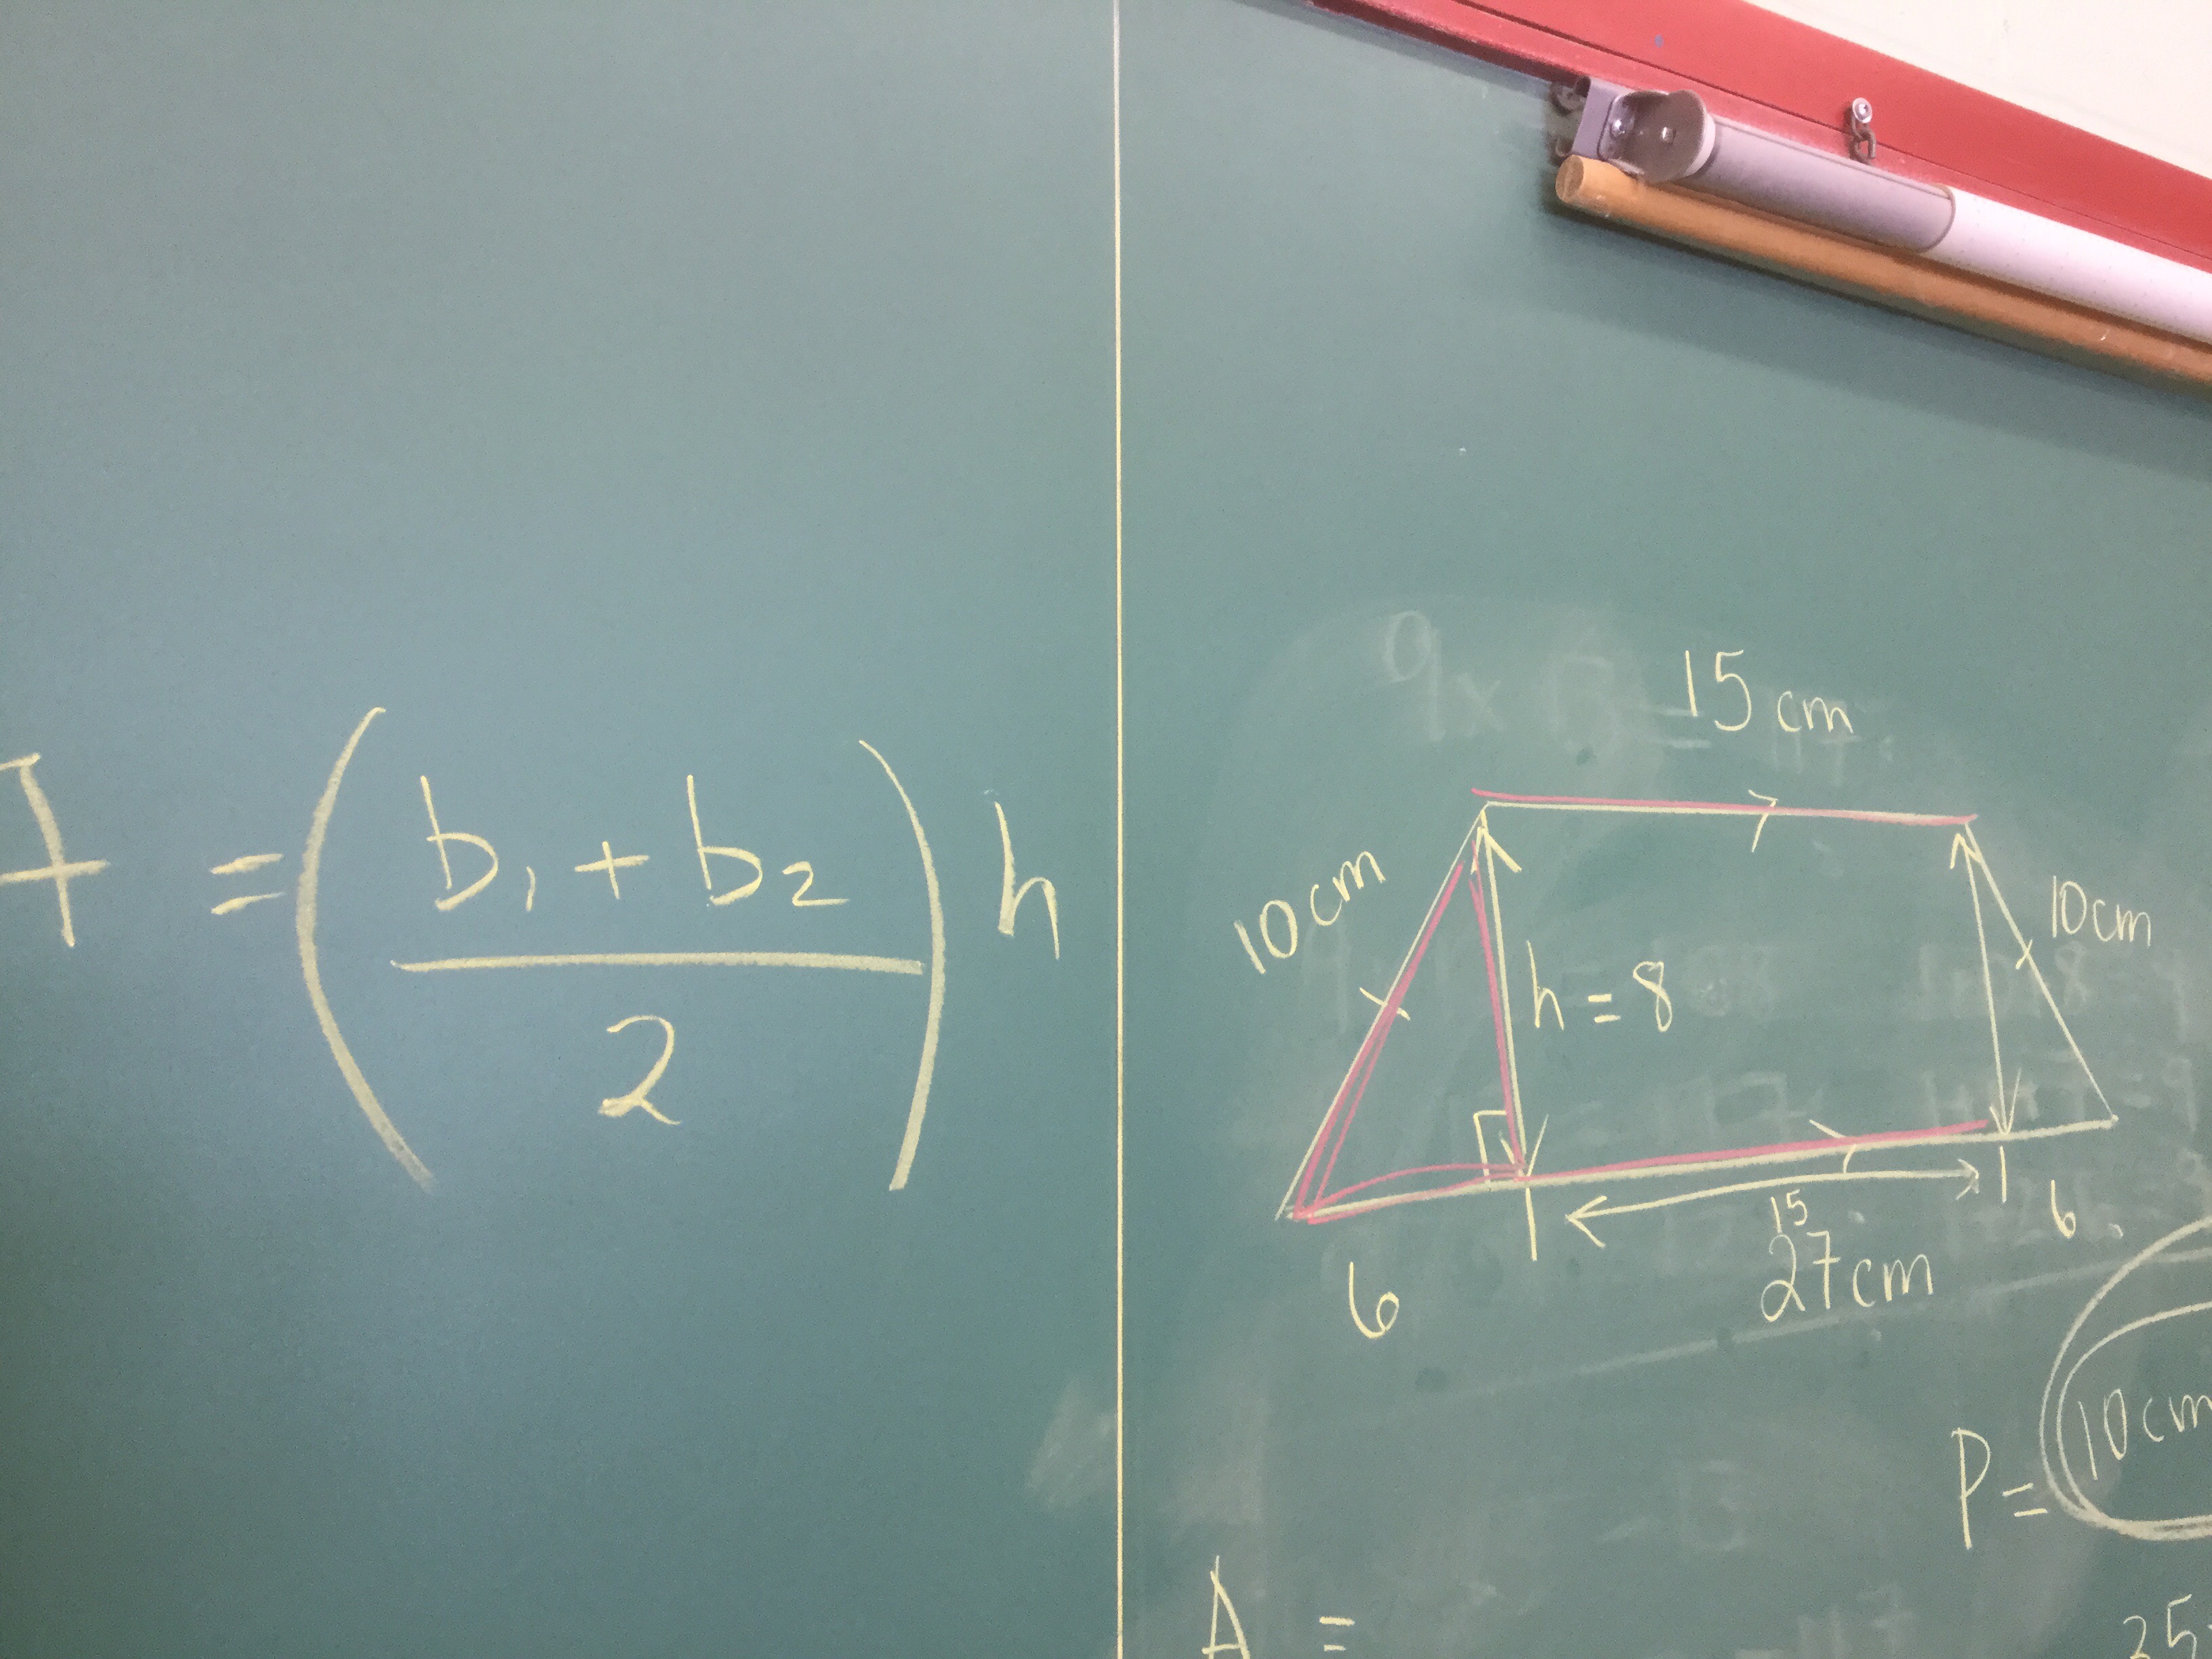
At the end of class we looked at how to use our formula sheets, and how to see the hidden right angle triangles in cones and pyramids. We sang a song for the area of a trapezoid.
We will practice more tomorrow.
No comments yet
