Cookie Towers
I was working with a colleague’s grade 9 class today, and the goal was to recall mean median mode and range, and to start looking at box and whisker plots.
I love to get kids hooked on data collection, and what’s more fun than a cookie tower competition?! We made rules of stacking one cookie on another, one at a time, using one hand only. Each group members took turns stacking towers until we had 12 data points in their charts.
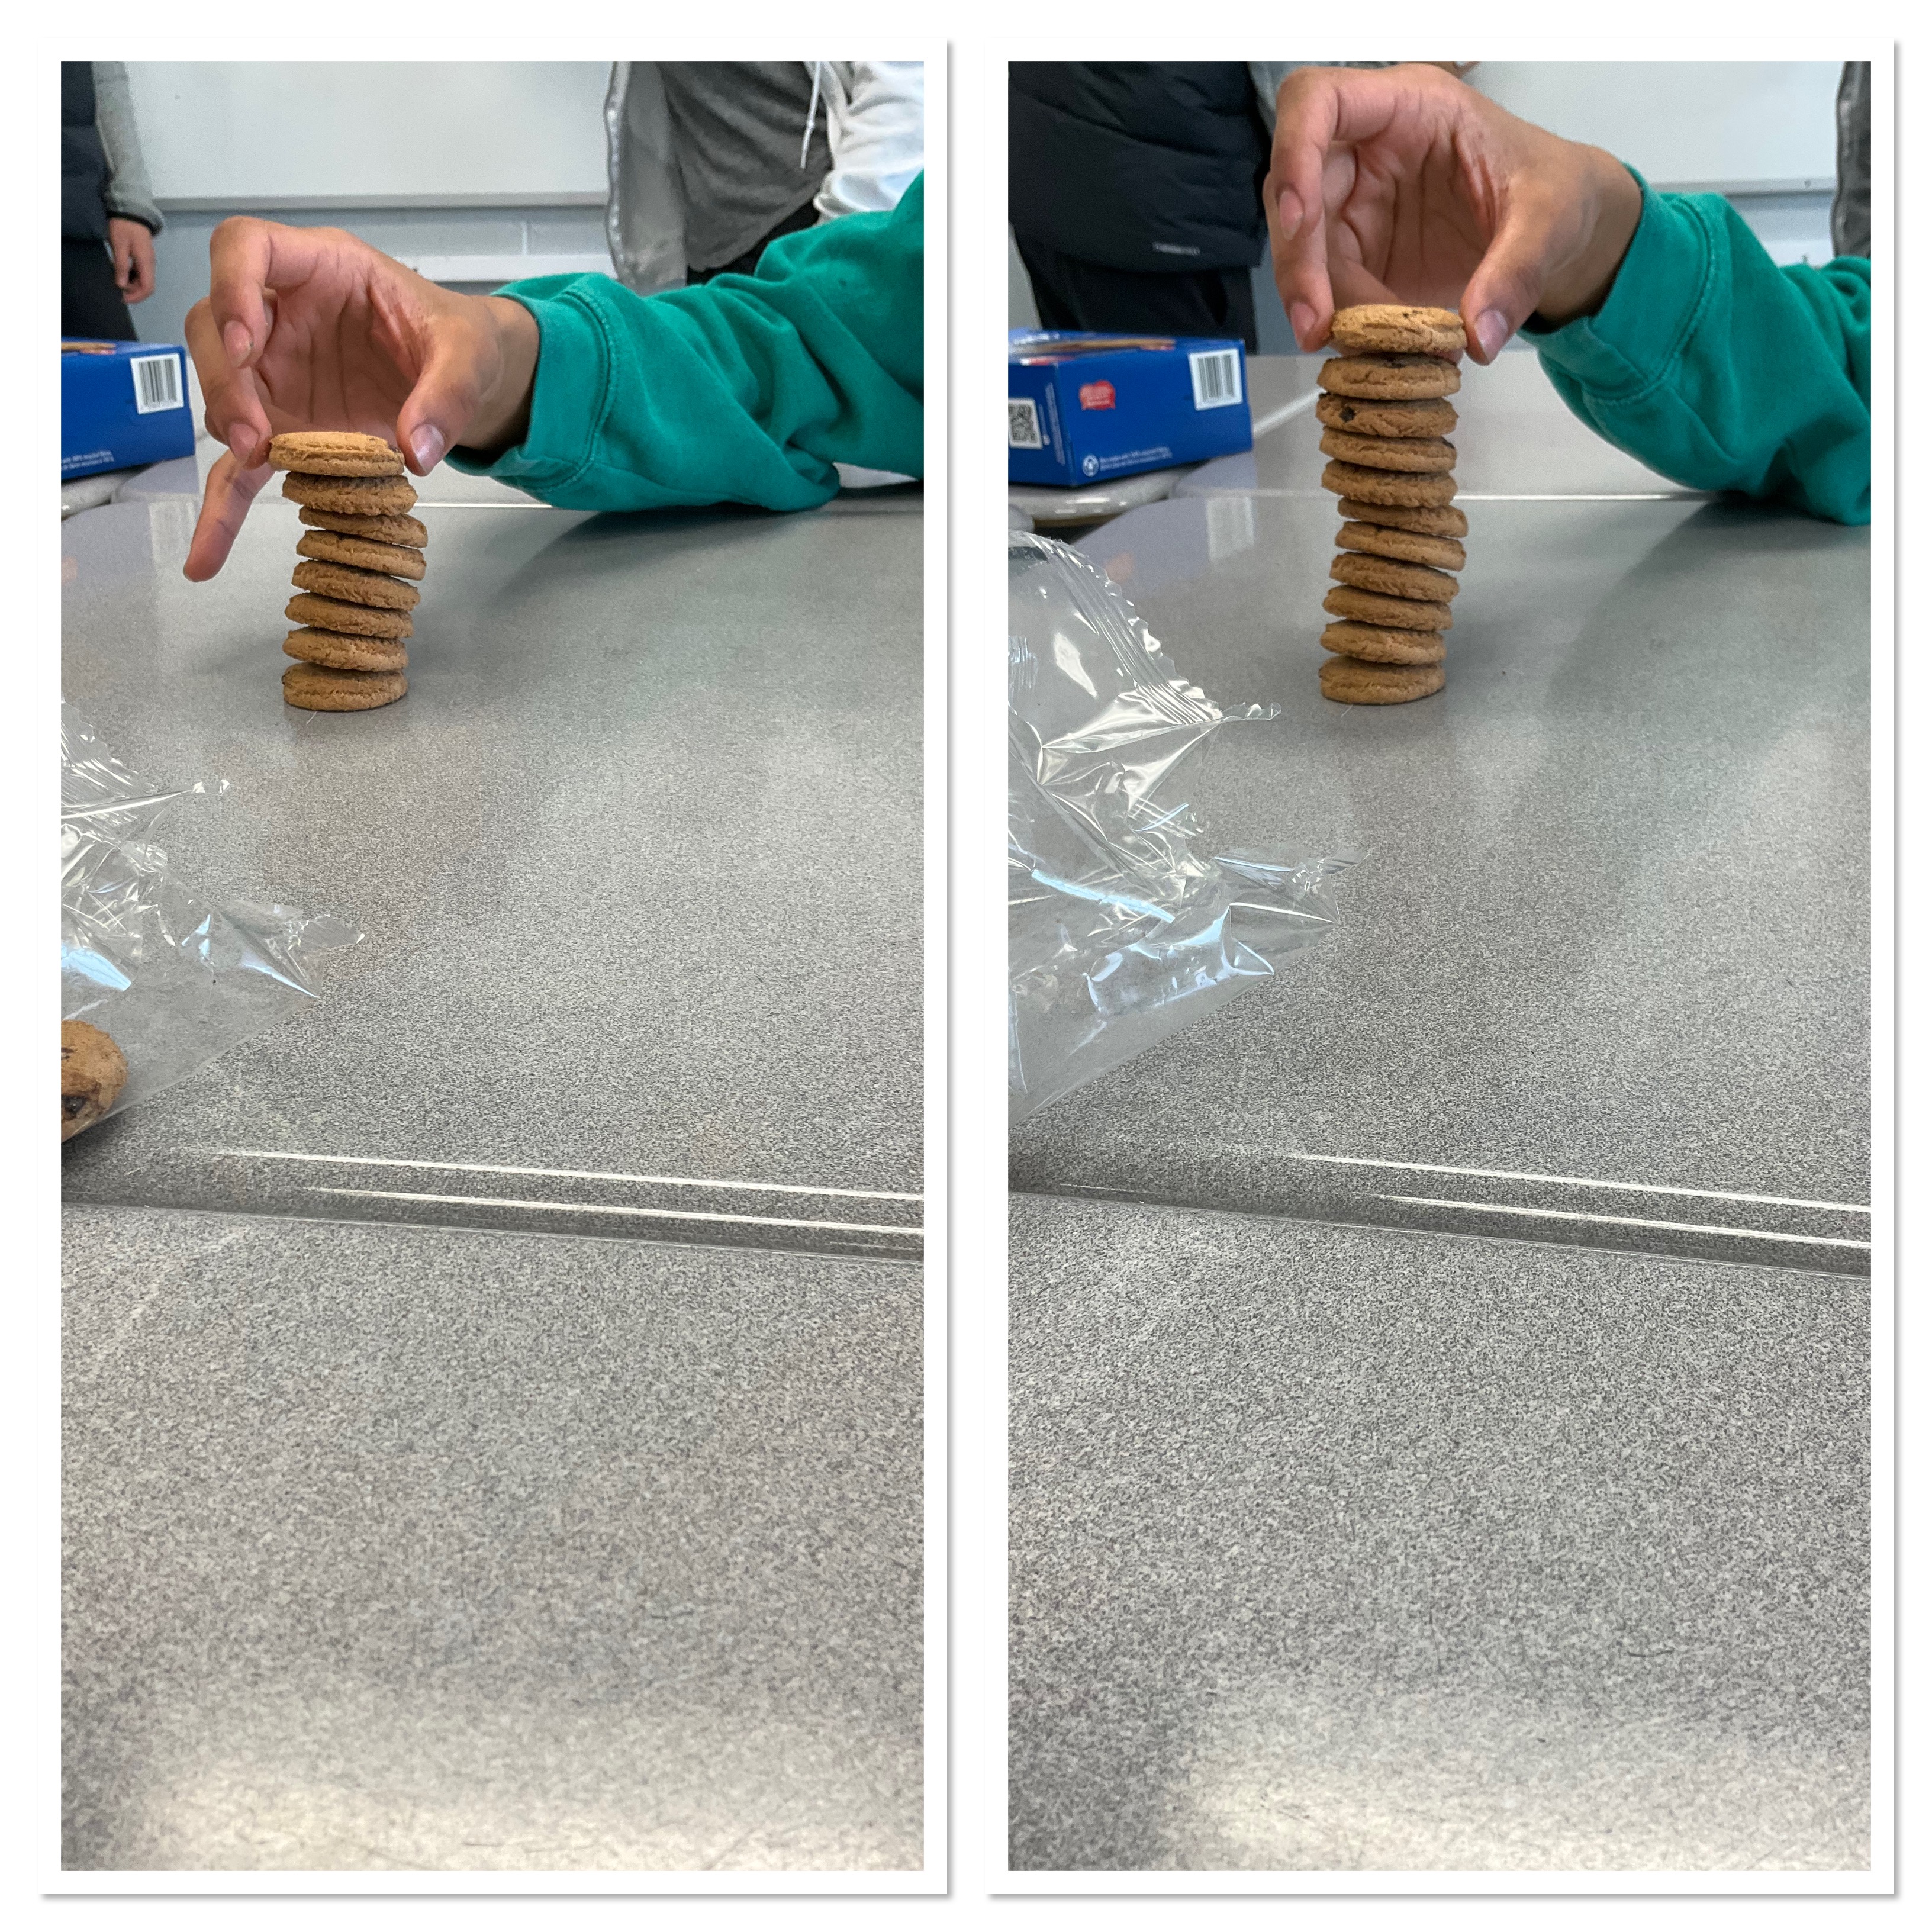
Groups were getting pretty keen, and a little competitive. Some started experimenting with how to stack the cookies, or even “sanding” down the cookies to make them flat.
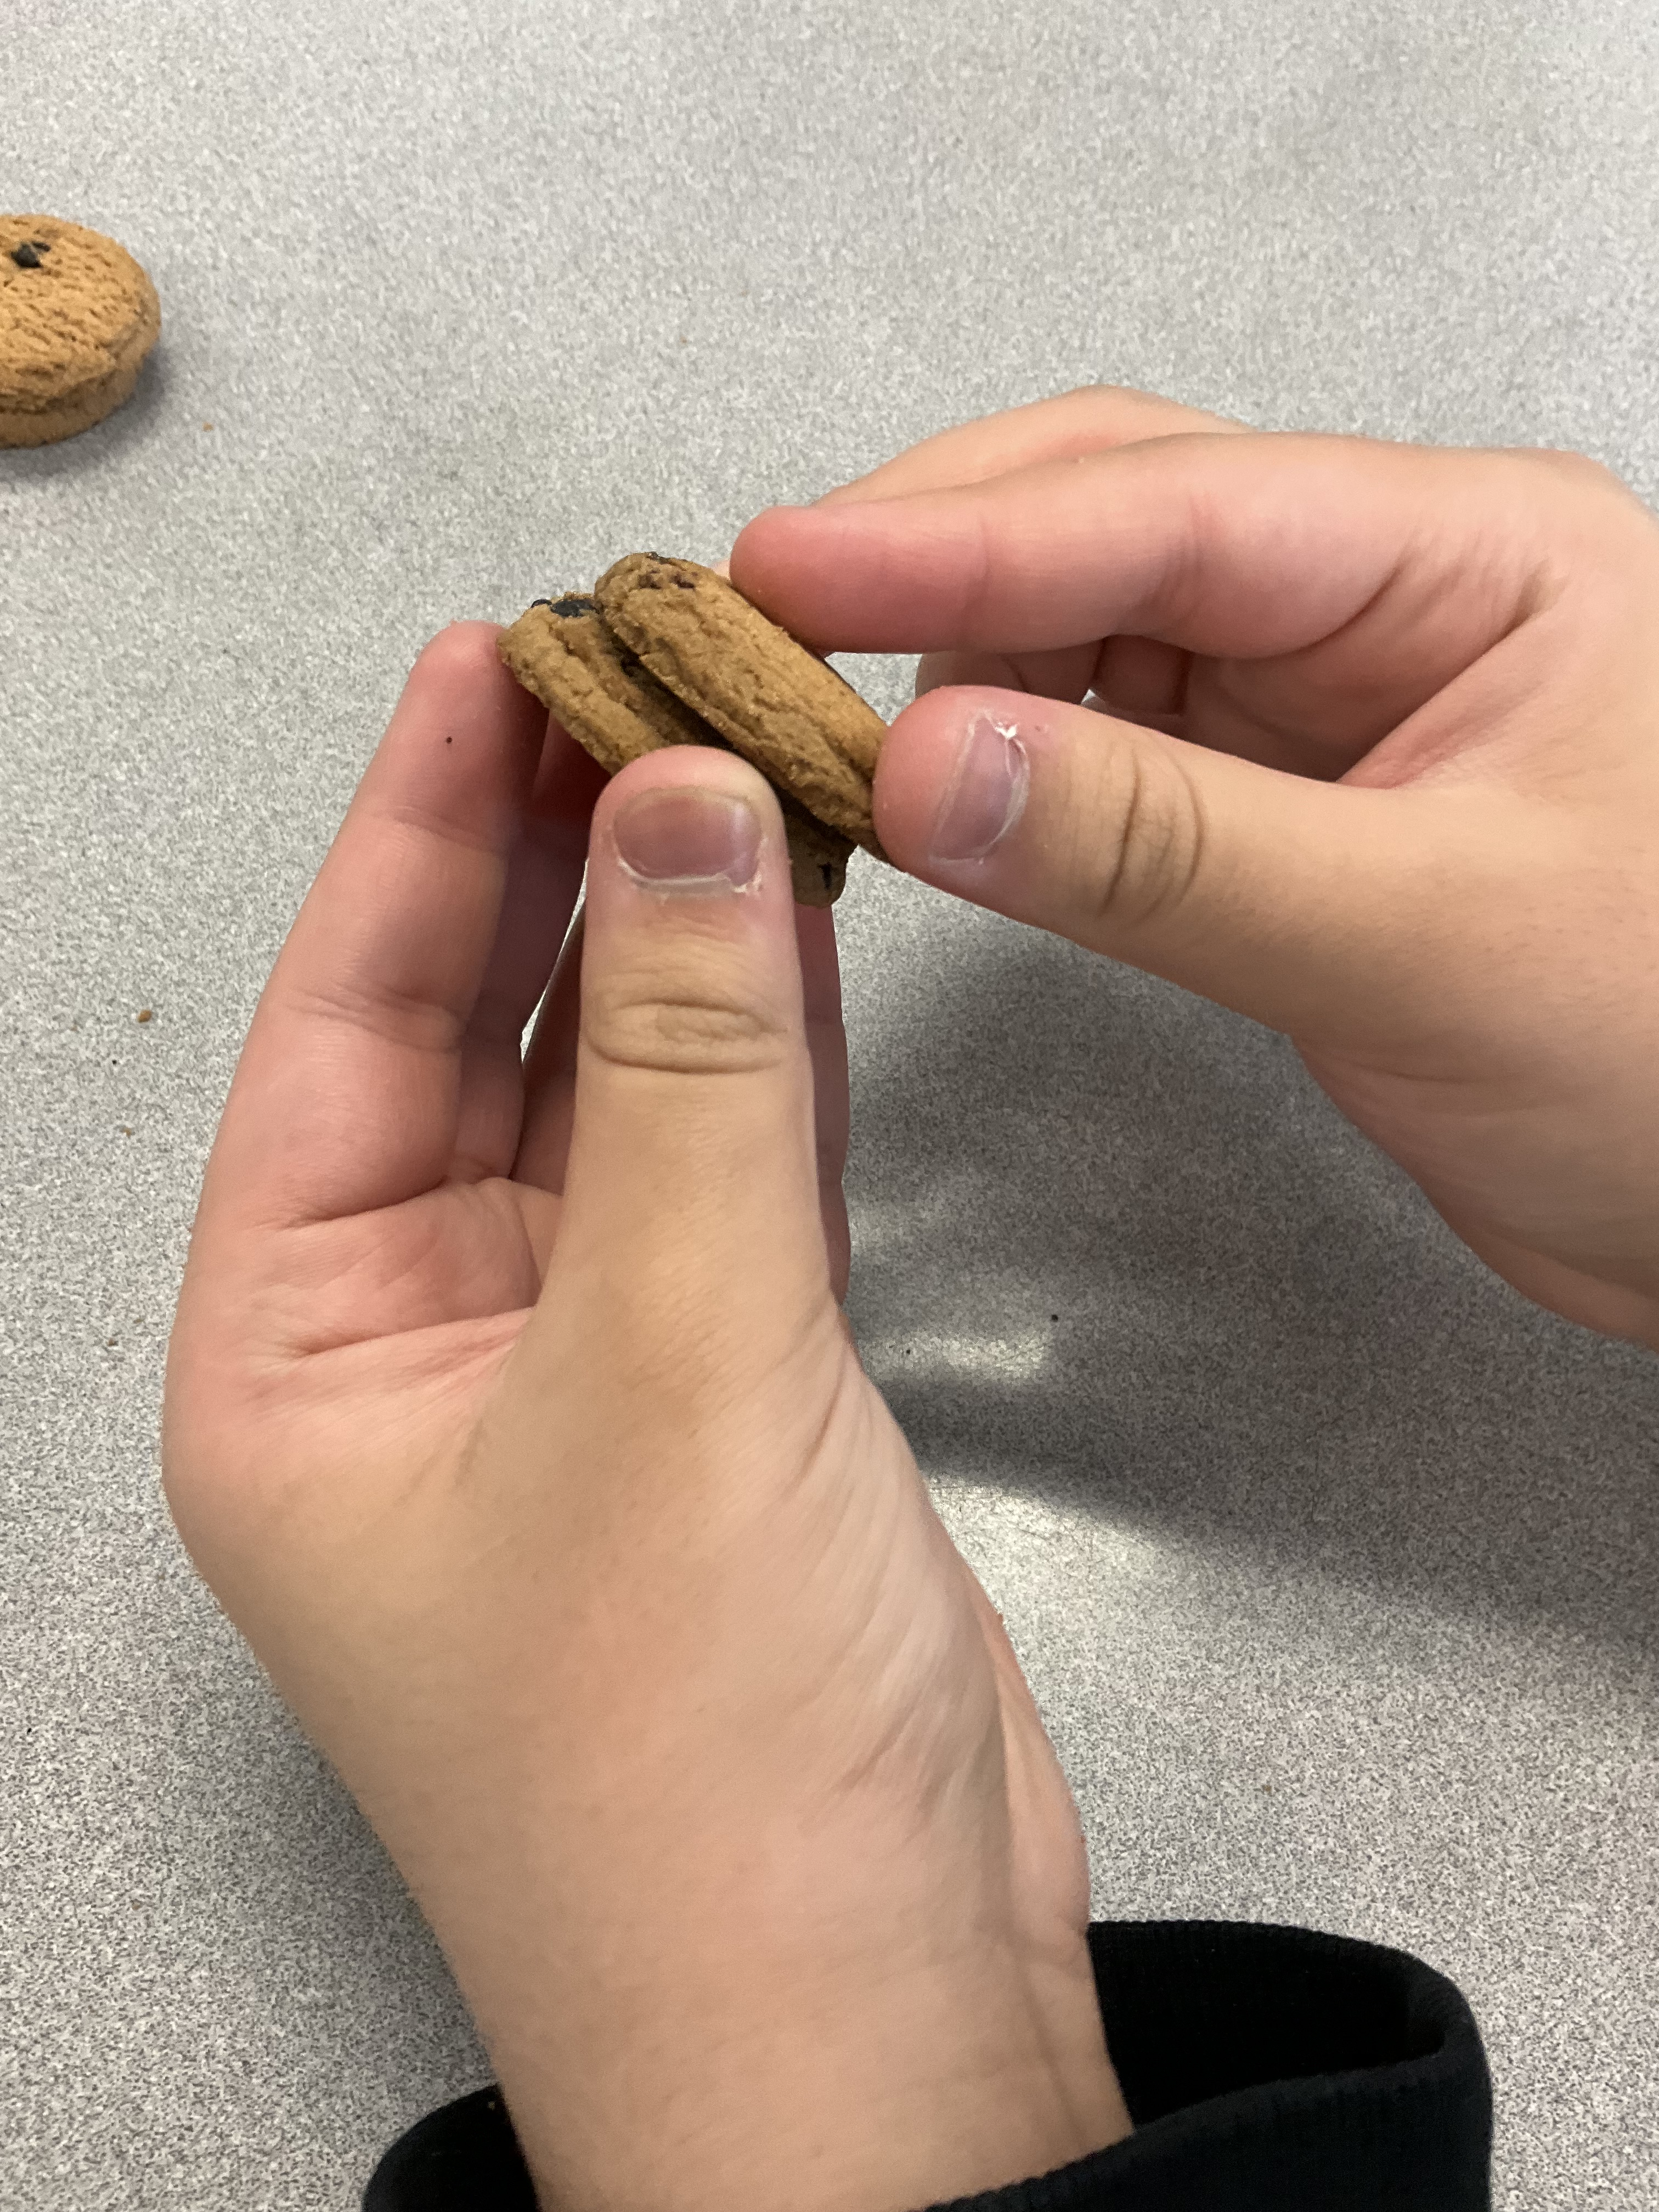
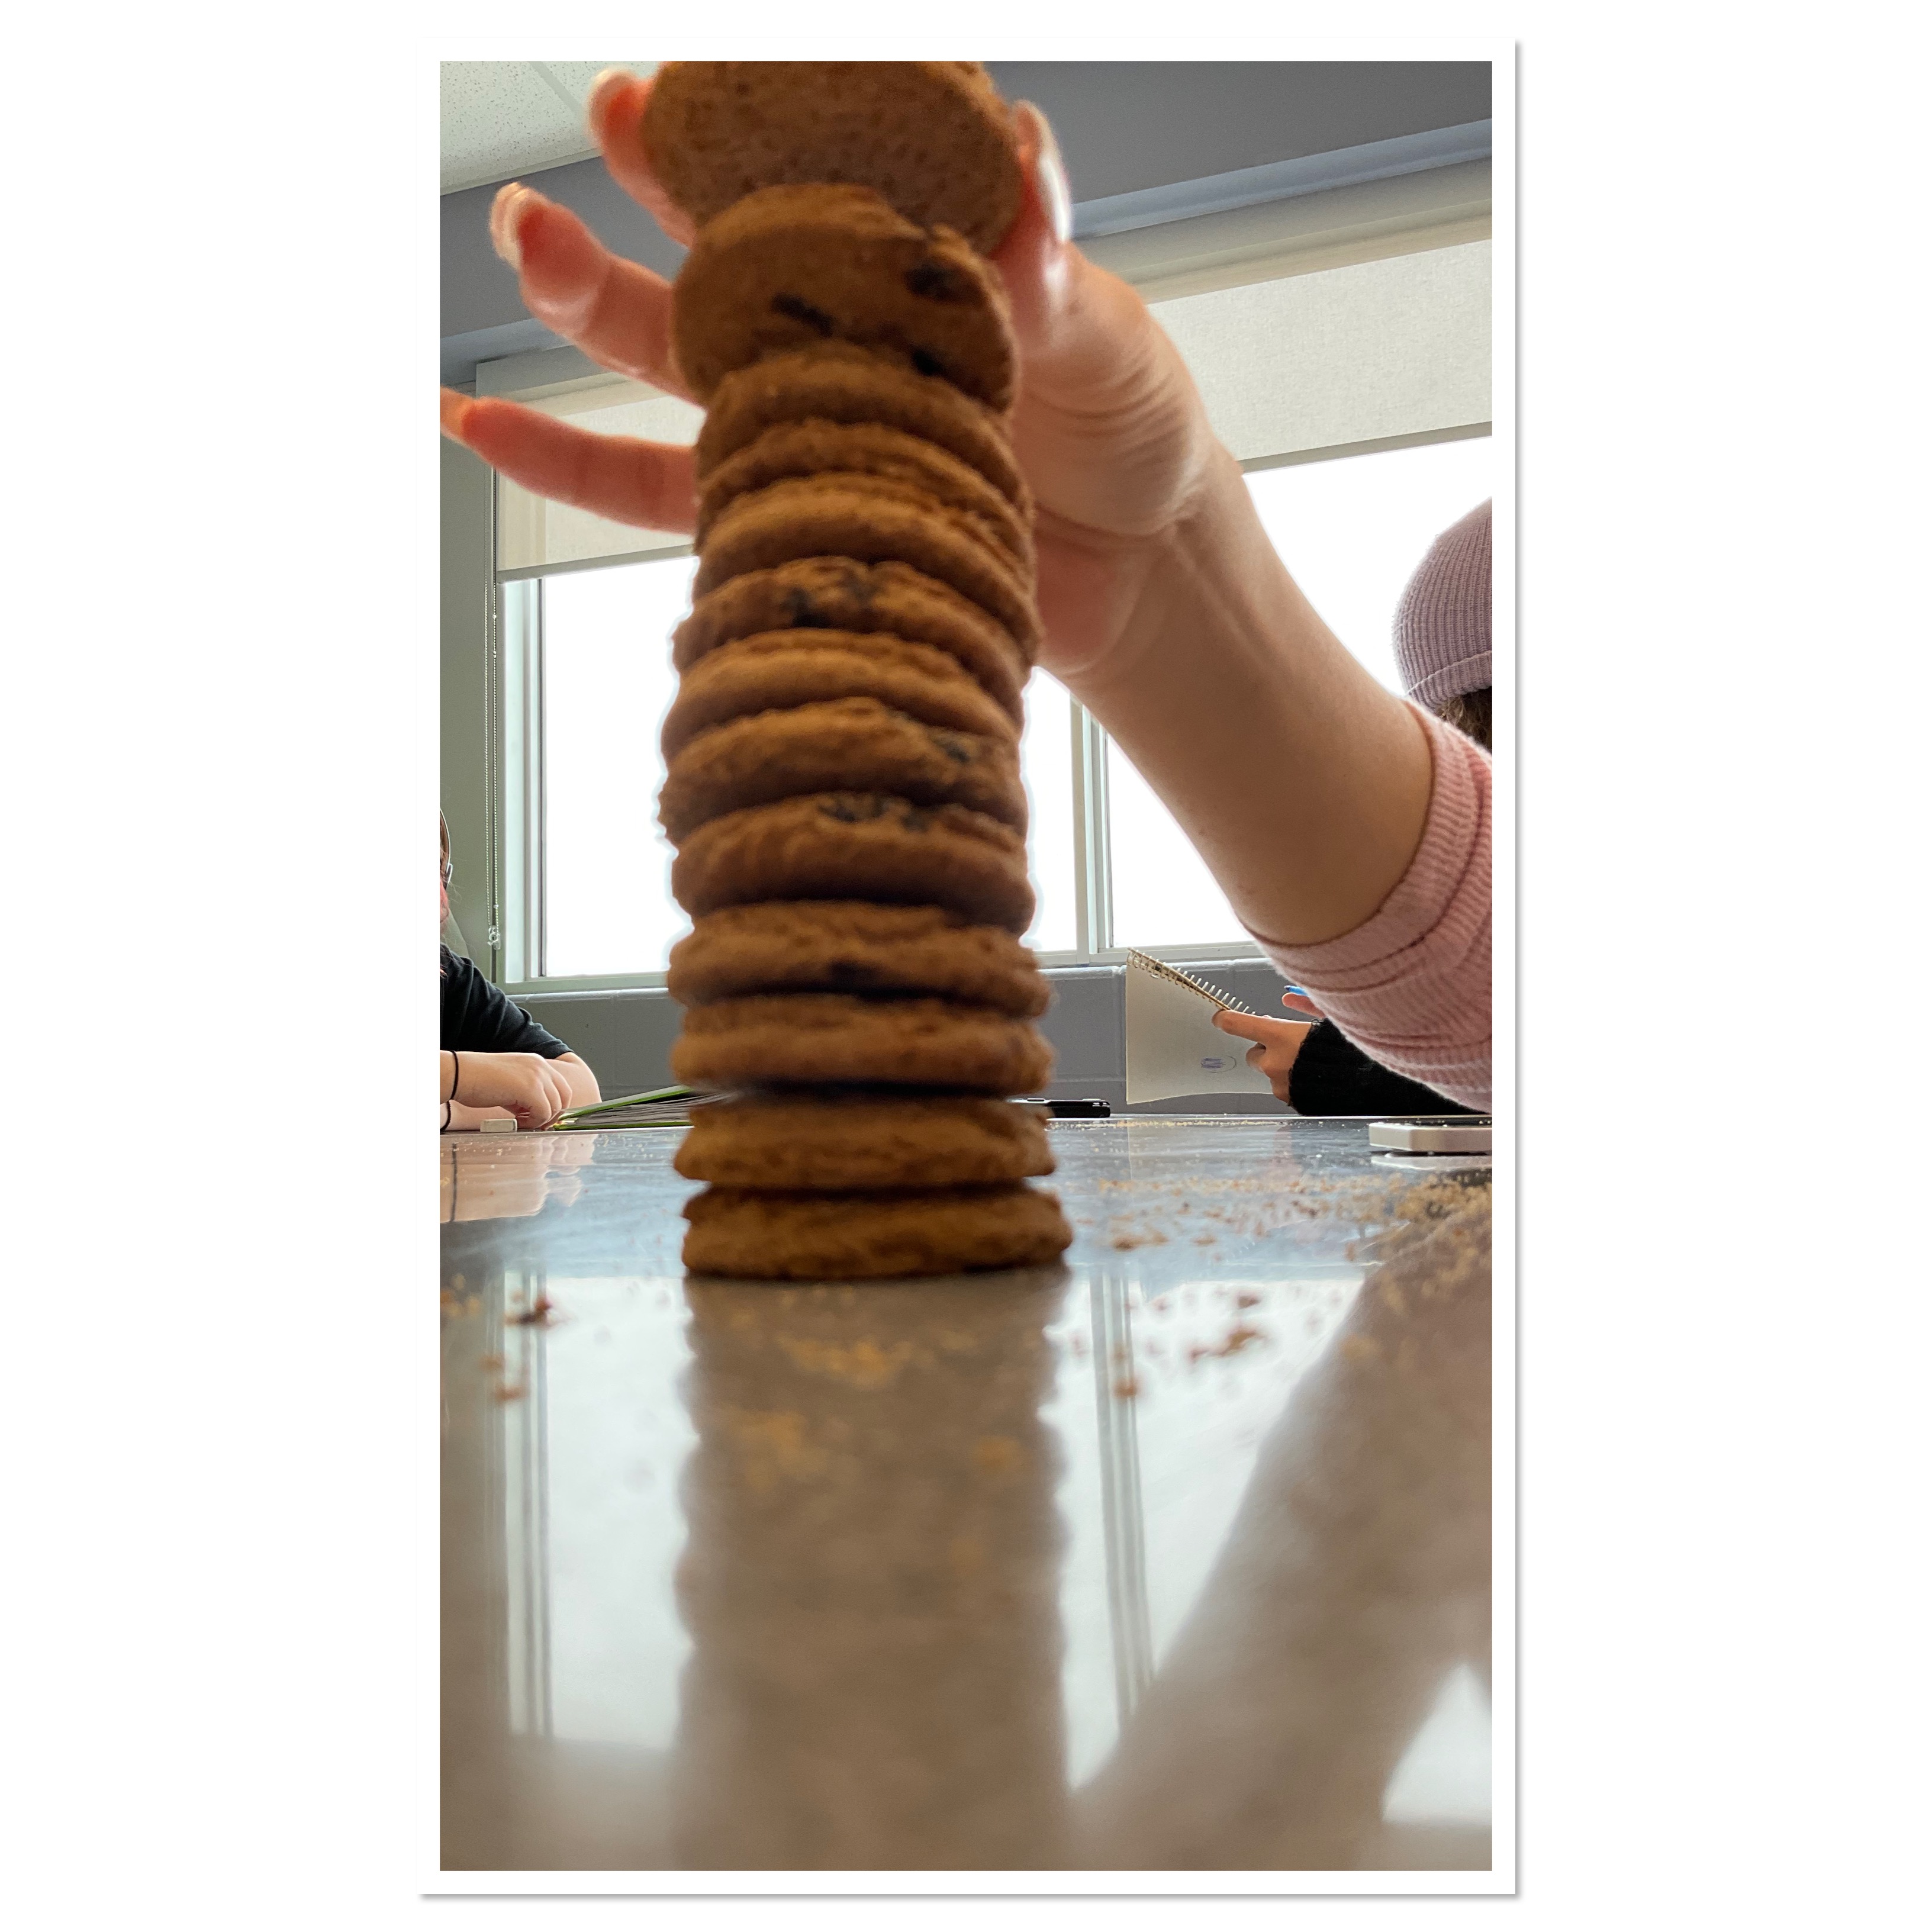
After some frustrations, some regrouping, practicing and strategizing, several students became very skilled!
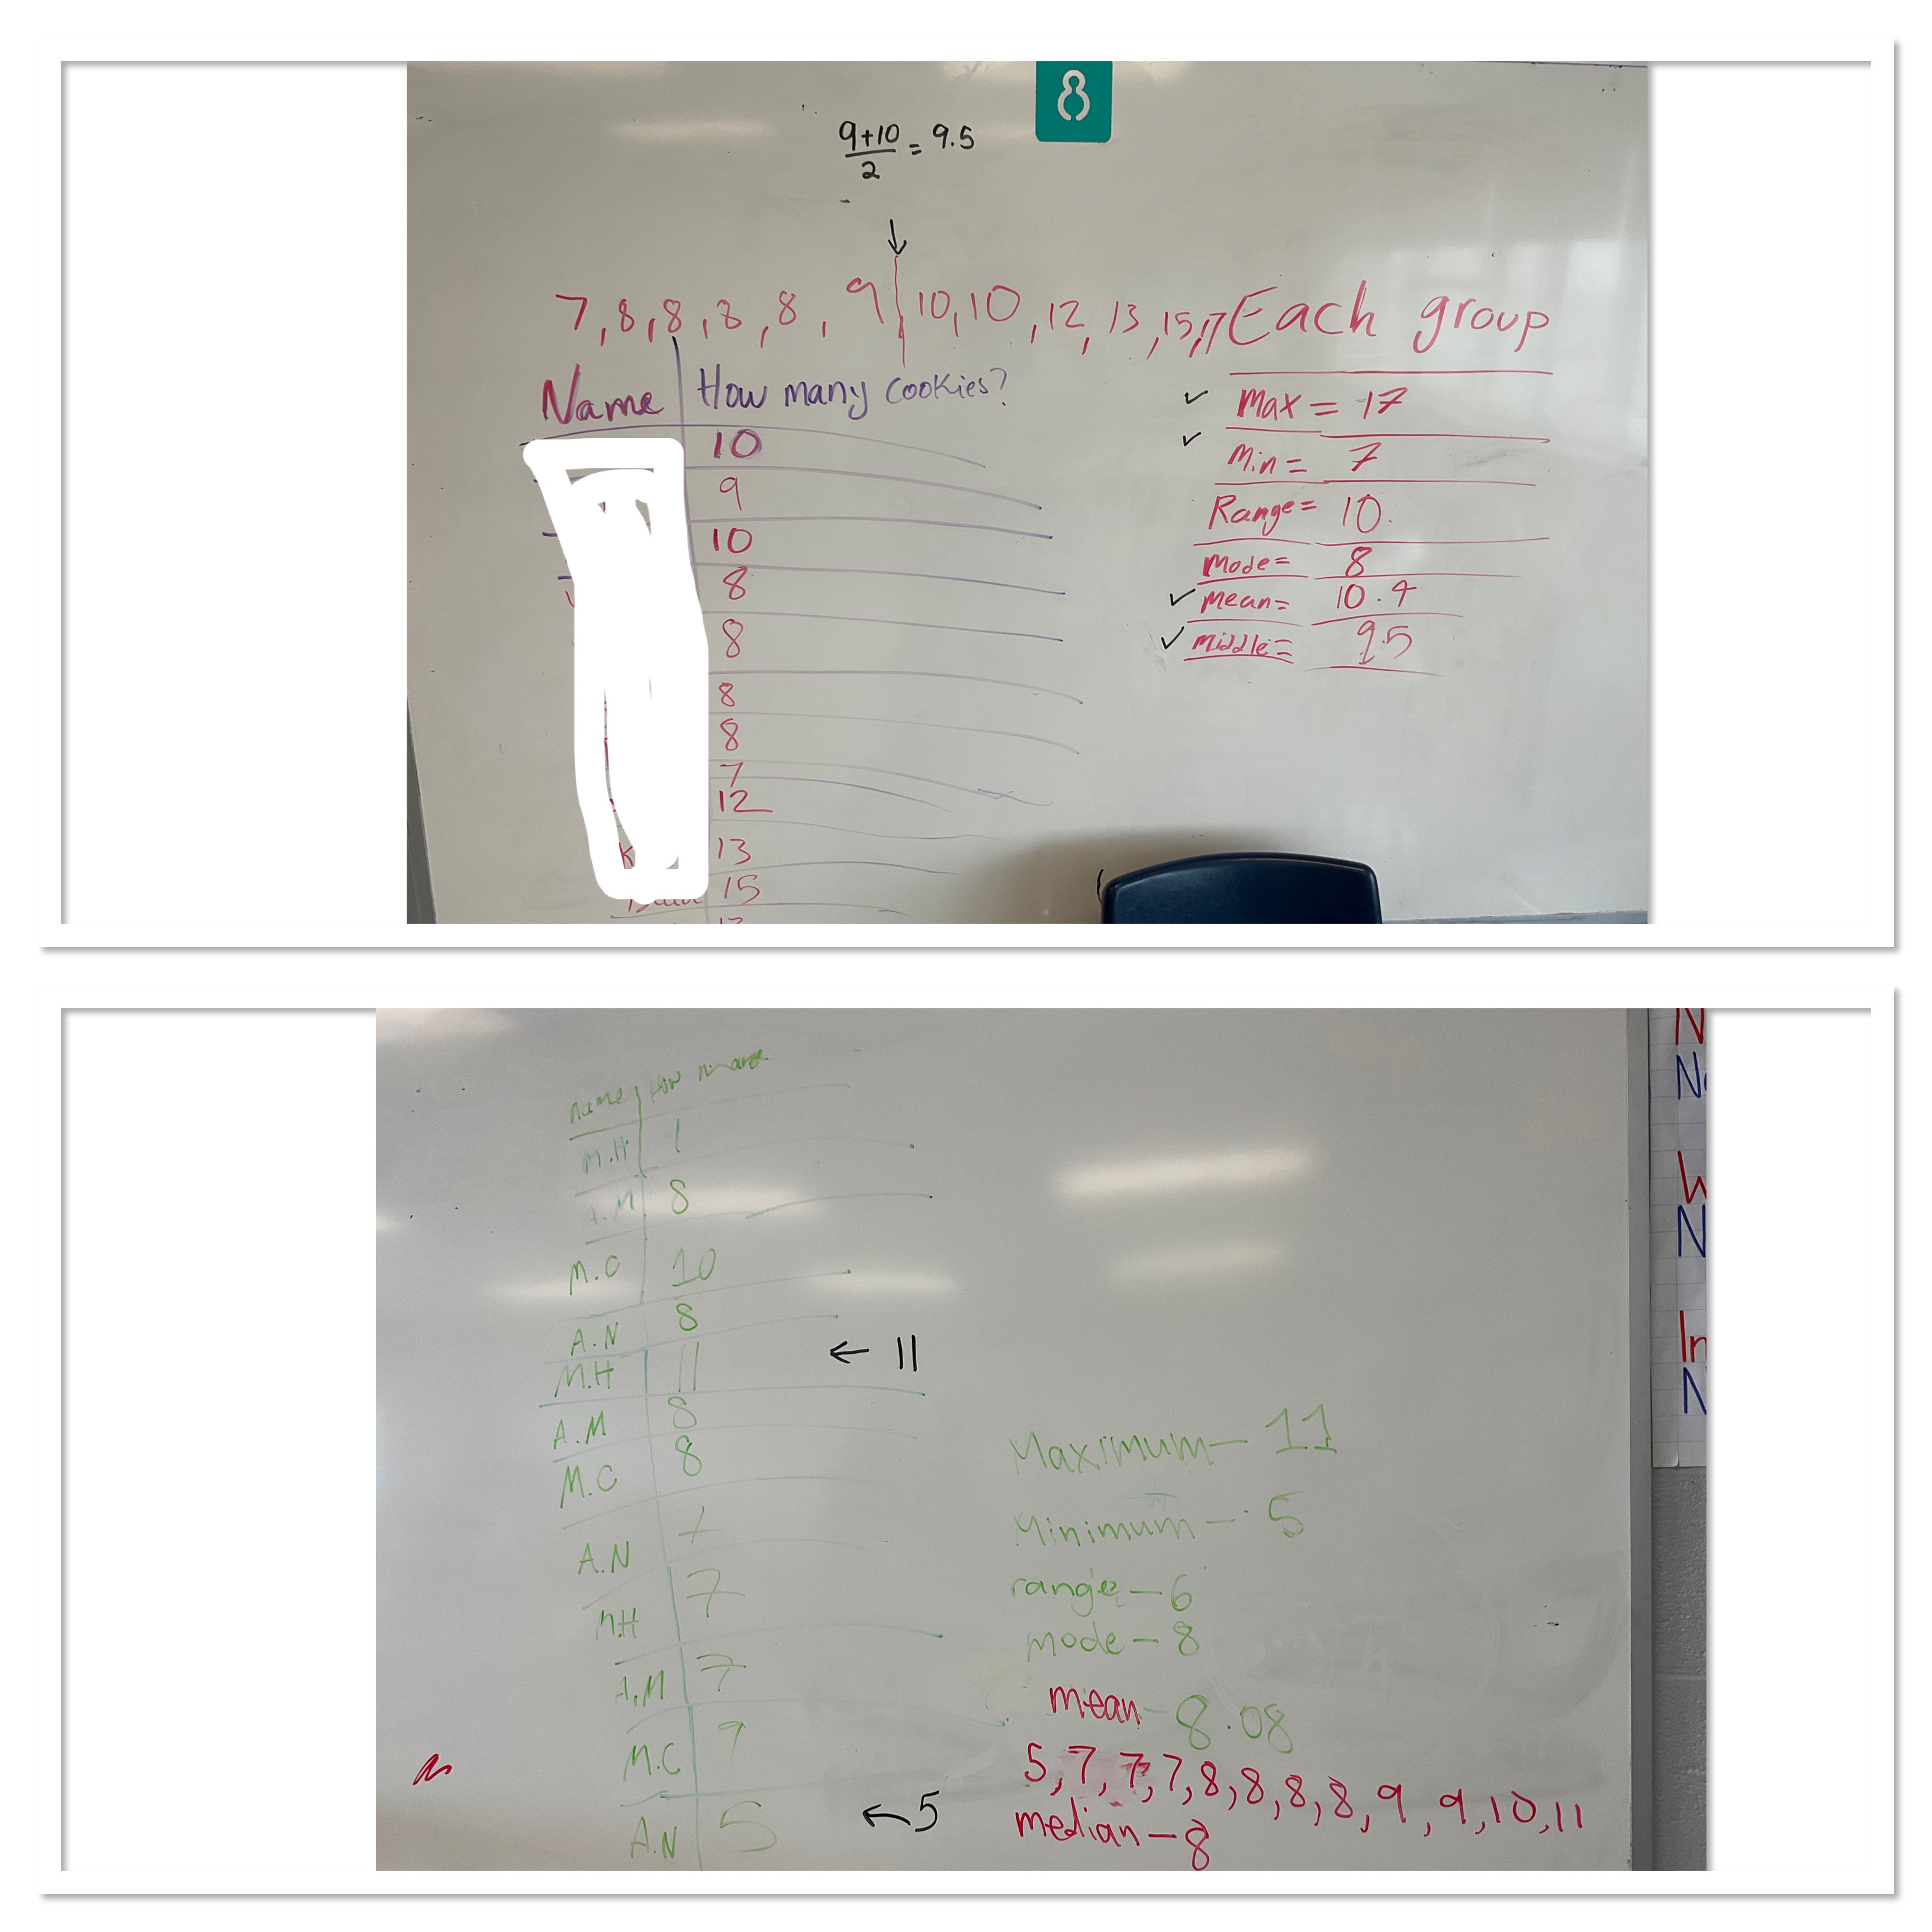
Groups had their data tables complete, then we had to decide who wins. Each group found their max, min, range, mode, mean, and median.
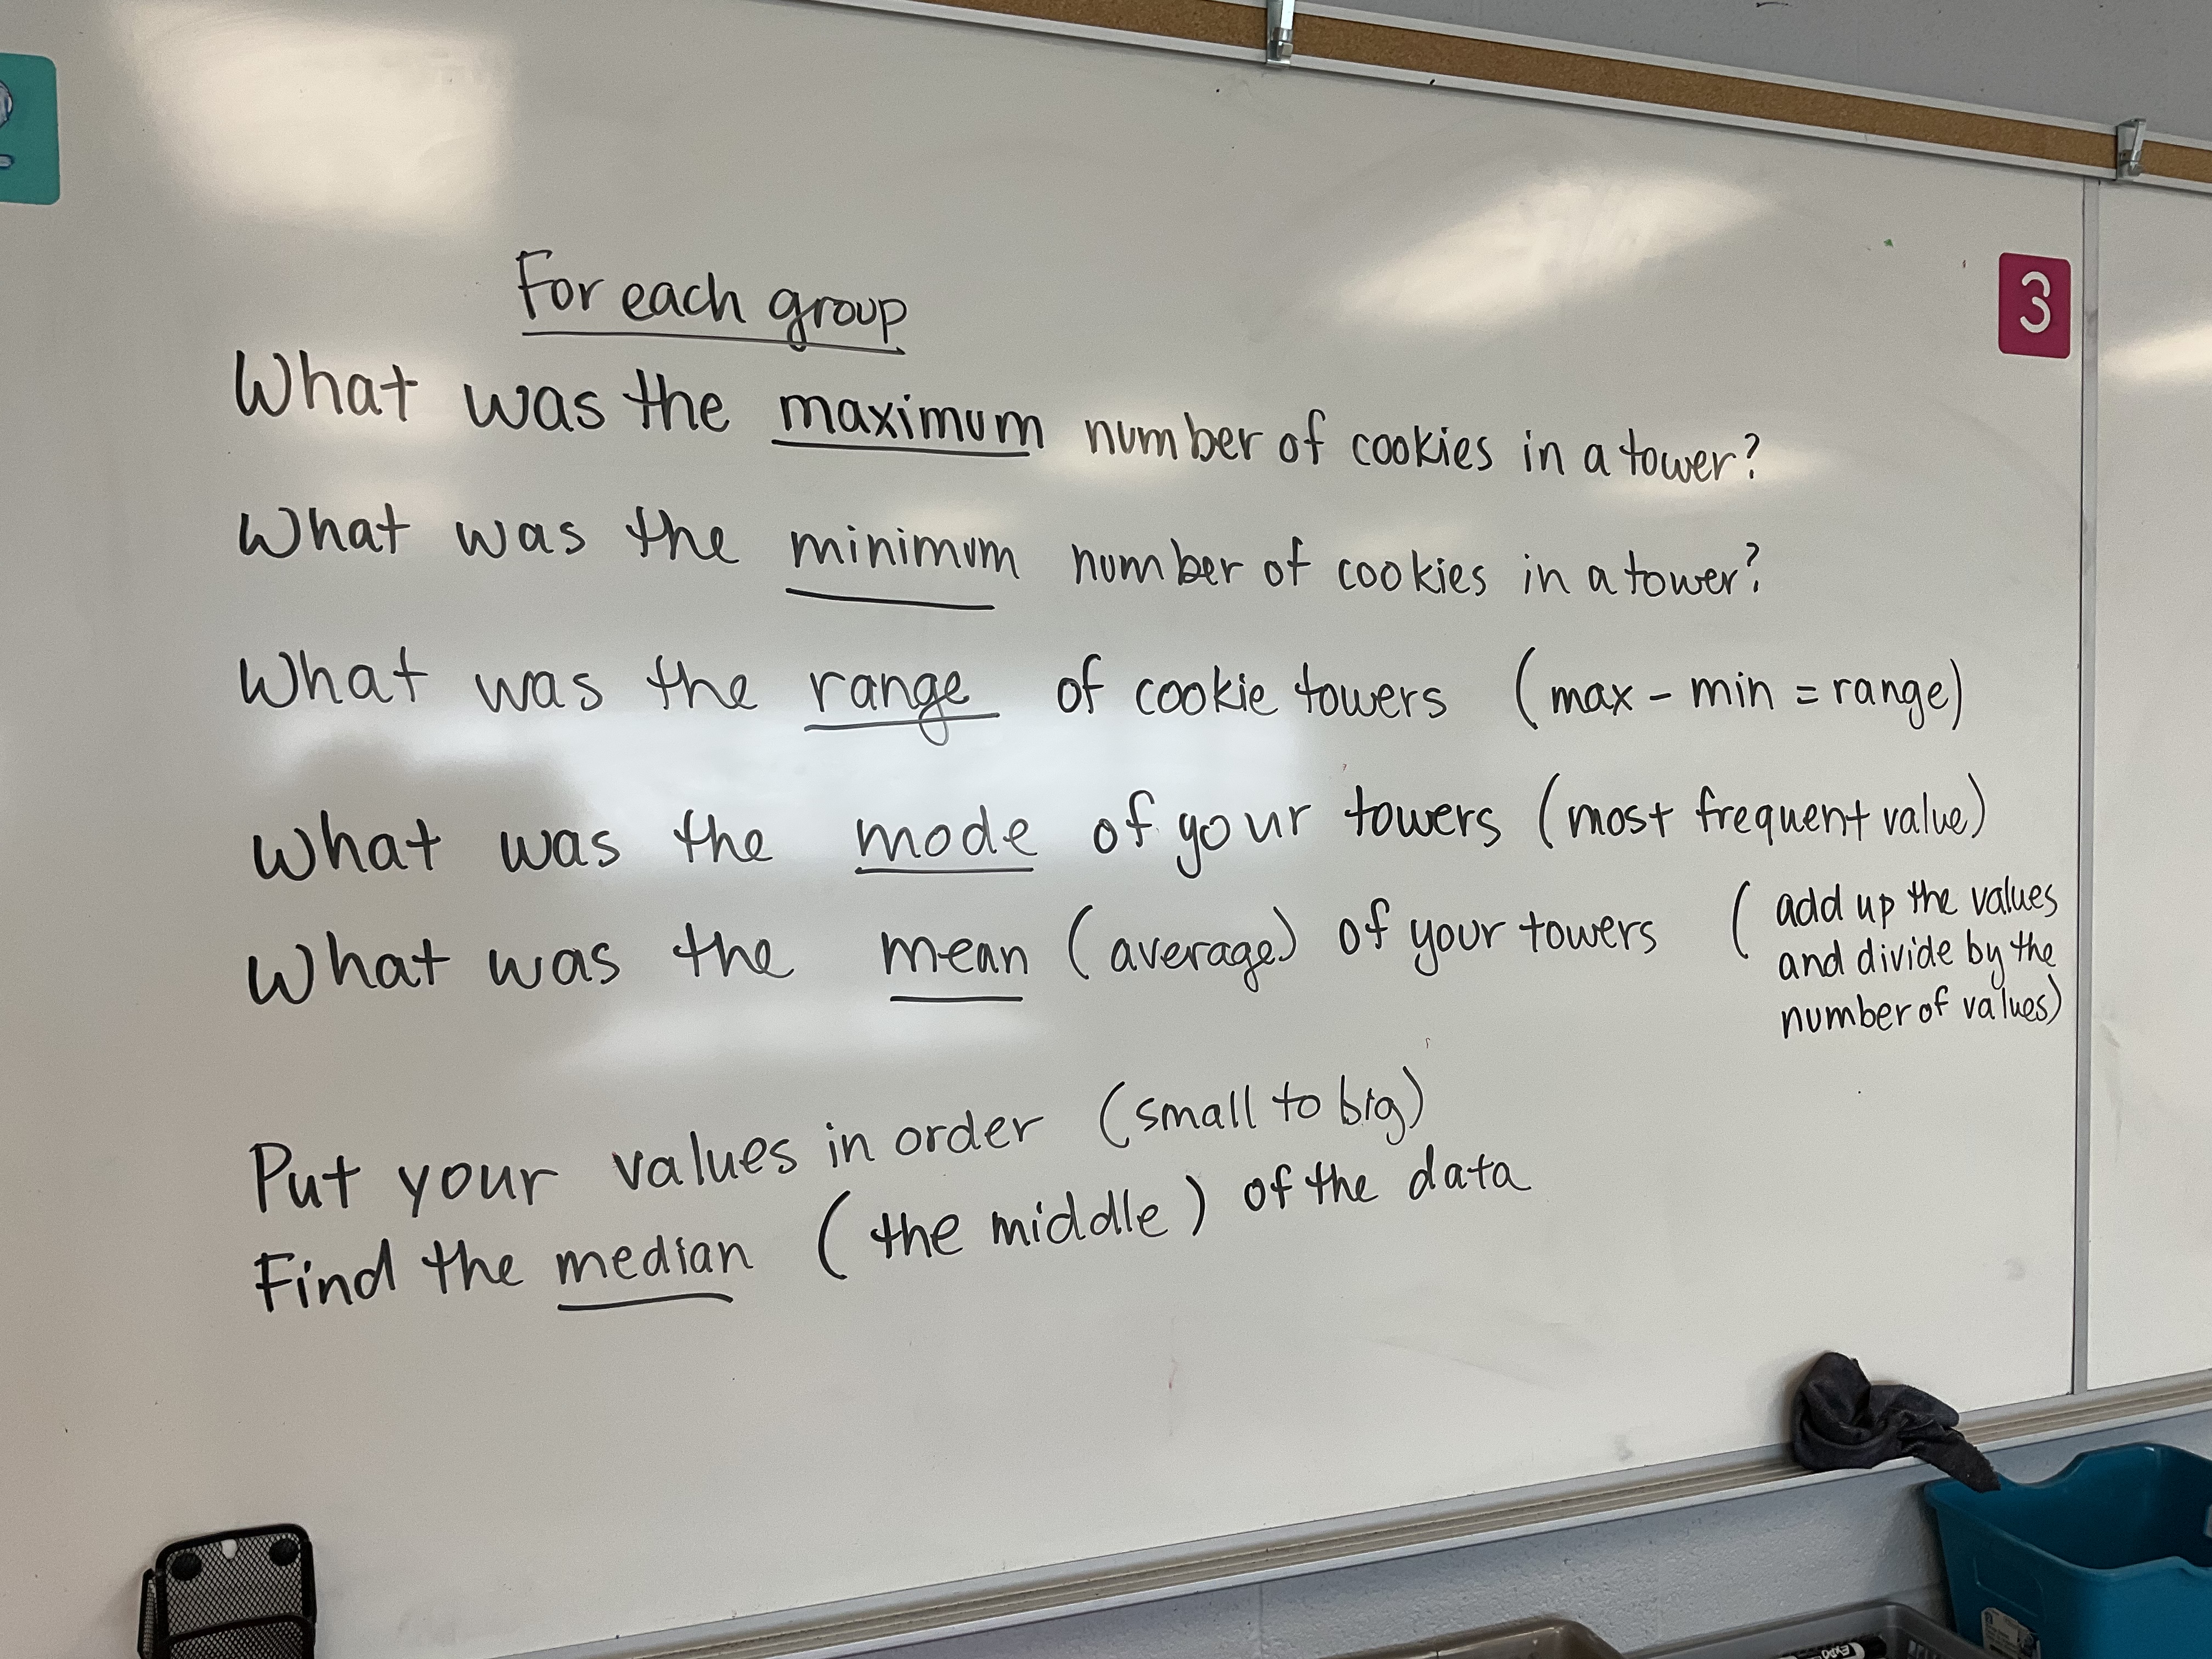
We were able to see which group had the highest average tower, and which group had the tallest short tower, and which group had the highest median tower, and which group has the highest repeated tower height. Some groups won on several criteria, and other groups won on other criteria.
The next step we took was to introduce the idea of a box and whisker plot. We had the data in order to calculate the median, so it was a quick process to calculate the quartiles (the middle of the bottom half, and the middle of the top half).
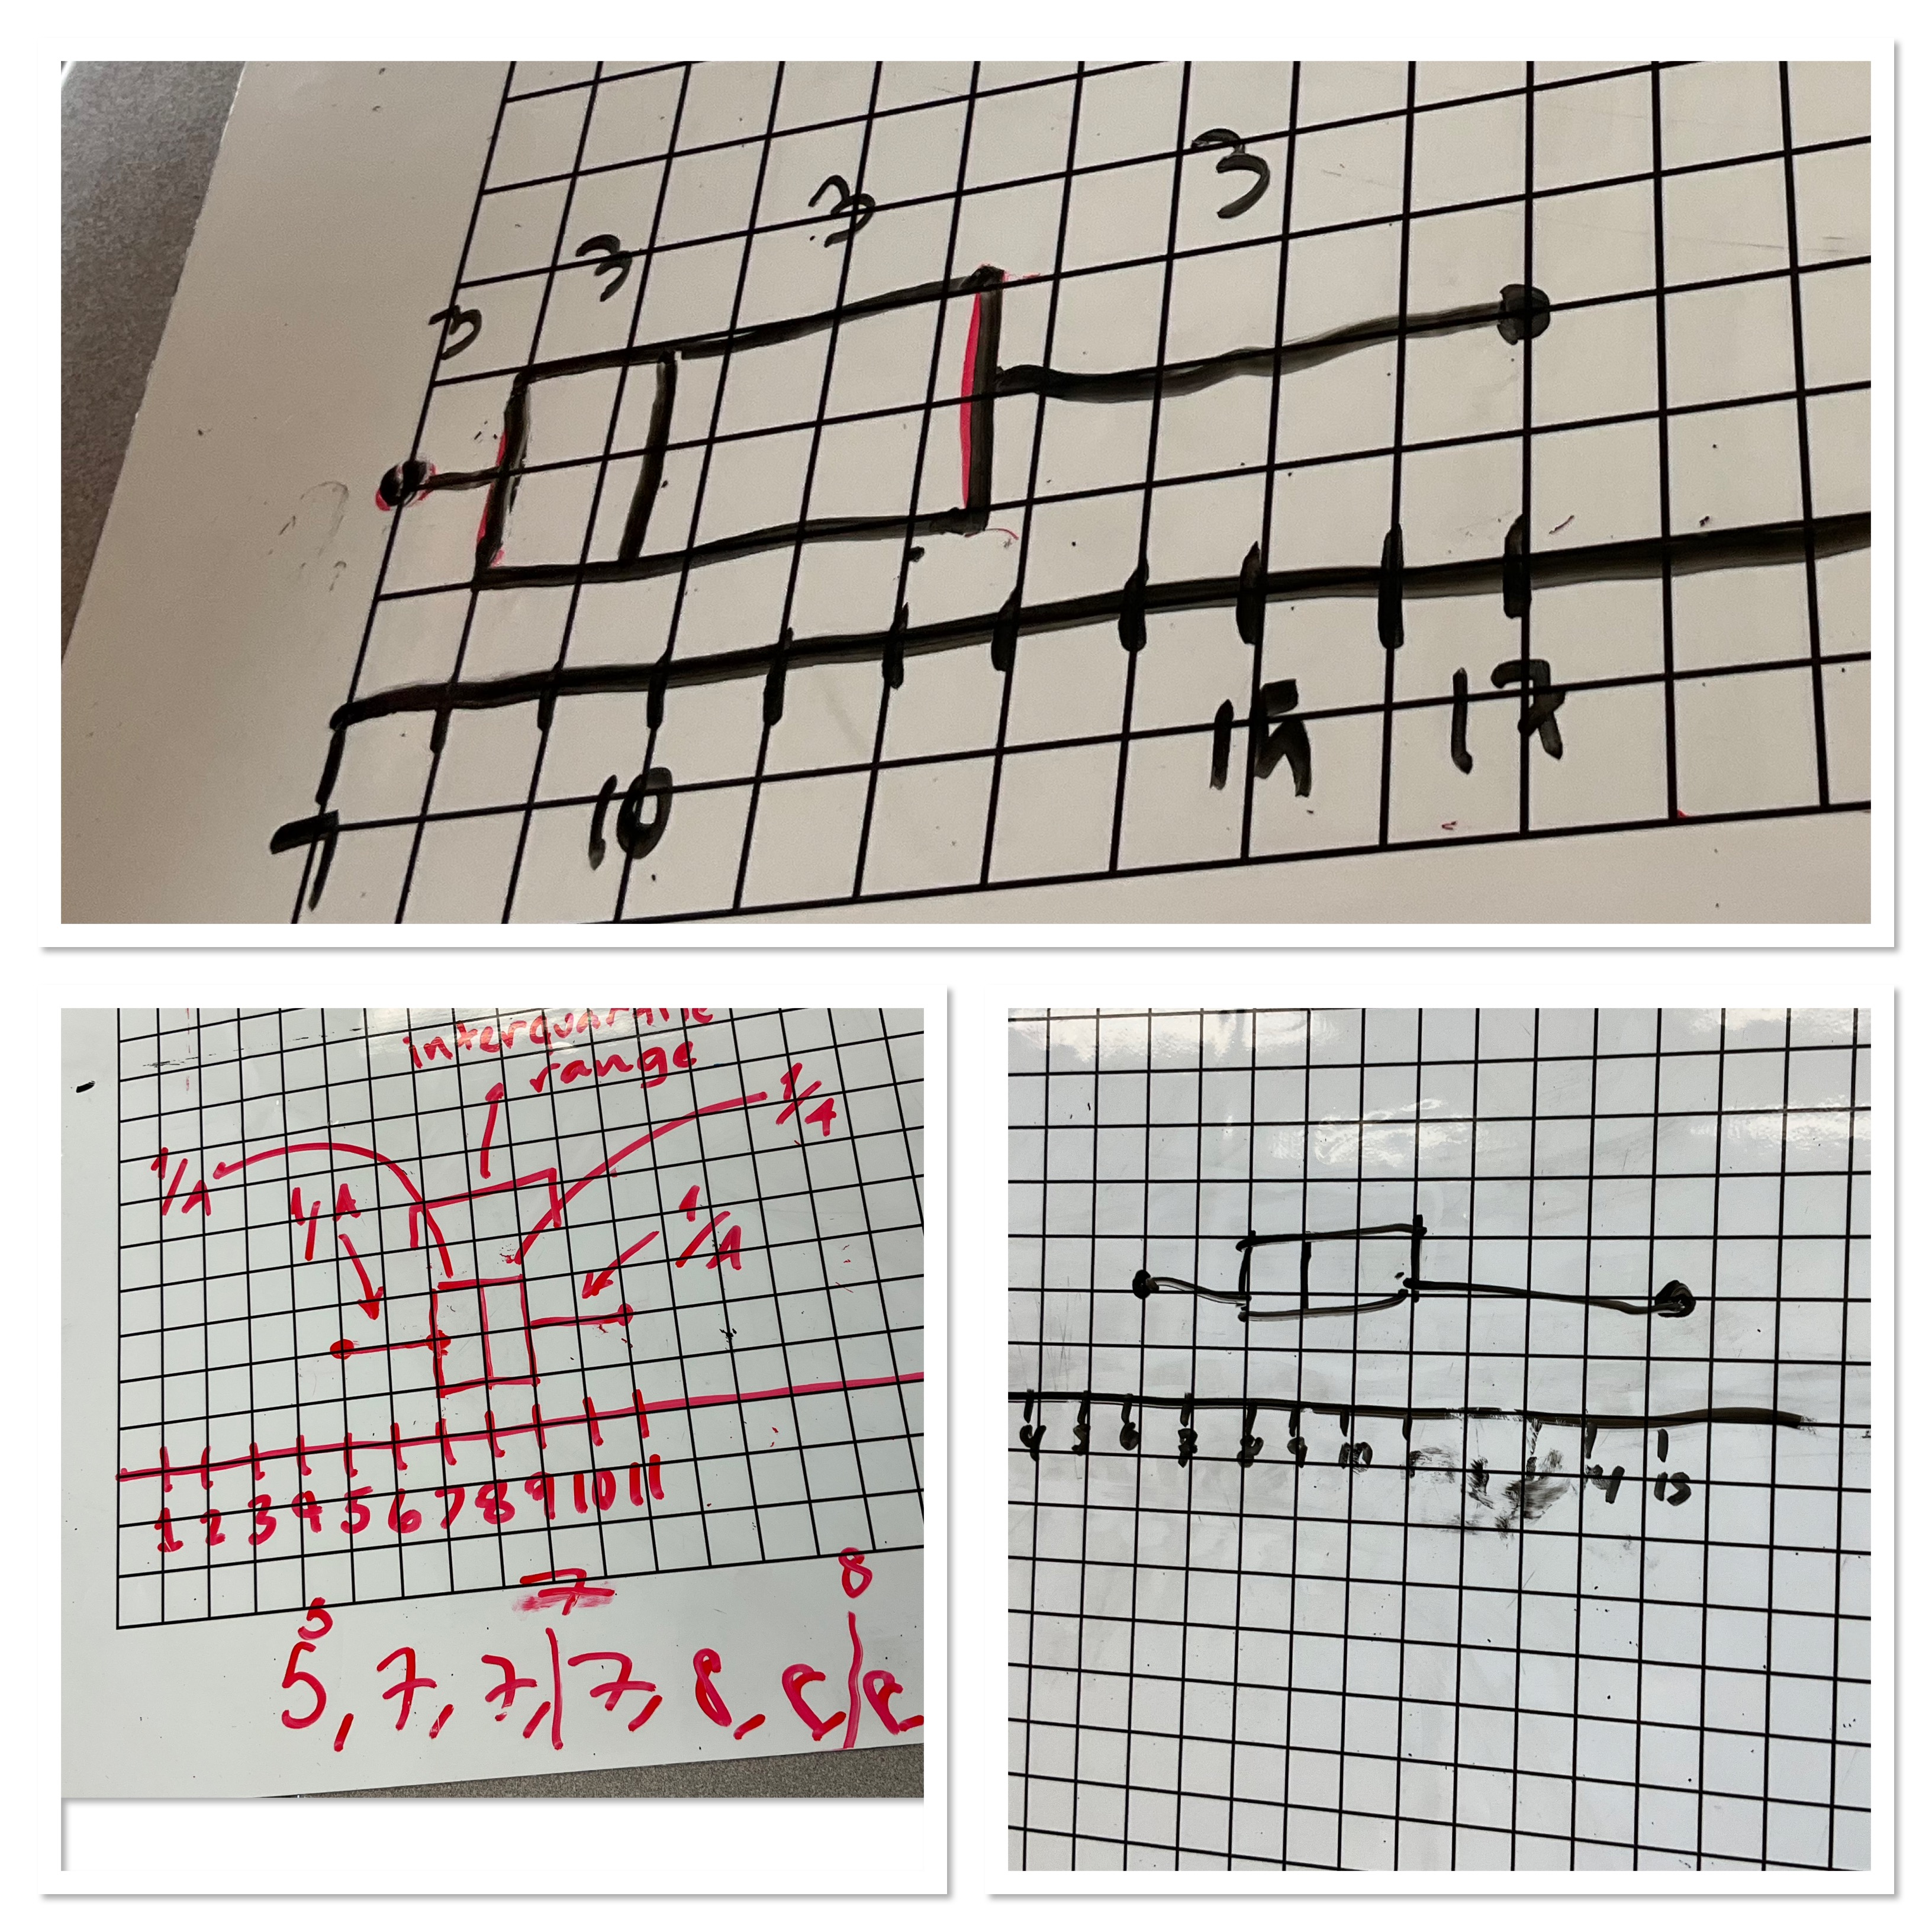
We noticed how easy it is to read the values from the diagrams. If we had 100 data points, searching a list for the maximum, minimum, and determining the median would be tedious. If we were looking at the box and whisker plot we could quickly determine the values at a glance. We can then compare data sets with ease. It was a fun class, and students worked very well together to collect and present their data, and calculations.
