Visual Patterns
Today I was in a colleague’s grade 10 applied class to work with them on modelling linear and quadratic patterns.
We remembered from grade 9 how to continue a pattern moving forward and backward. We made a table of values and a graph, and we looked at how to make equations. To get to an equation my new strategy is to have students think about figure 10. In the case of the trees, we can think of it 2 ways:
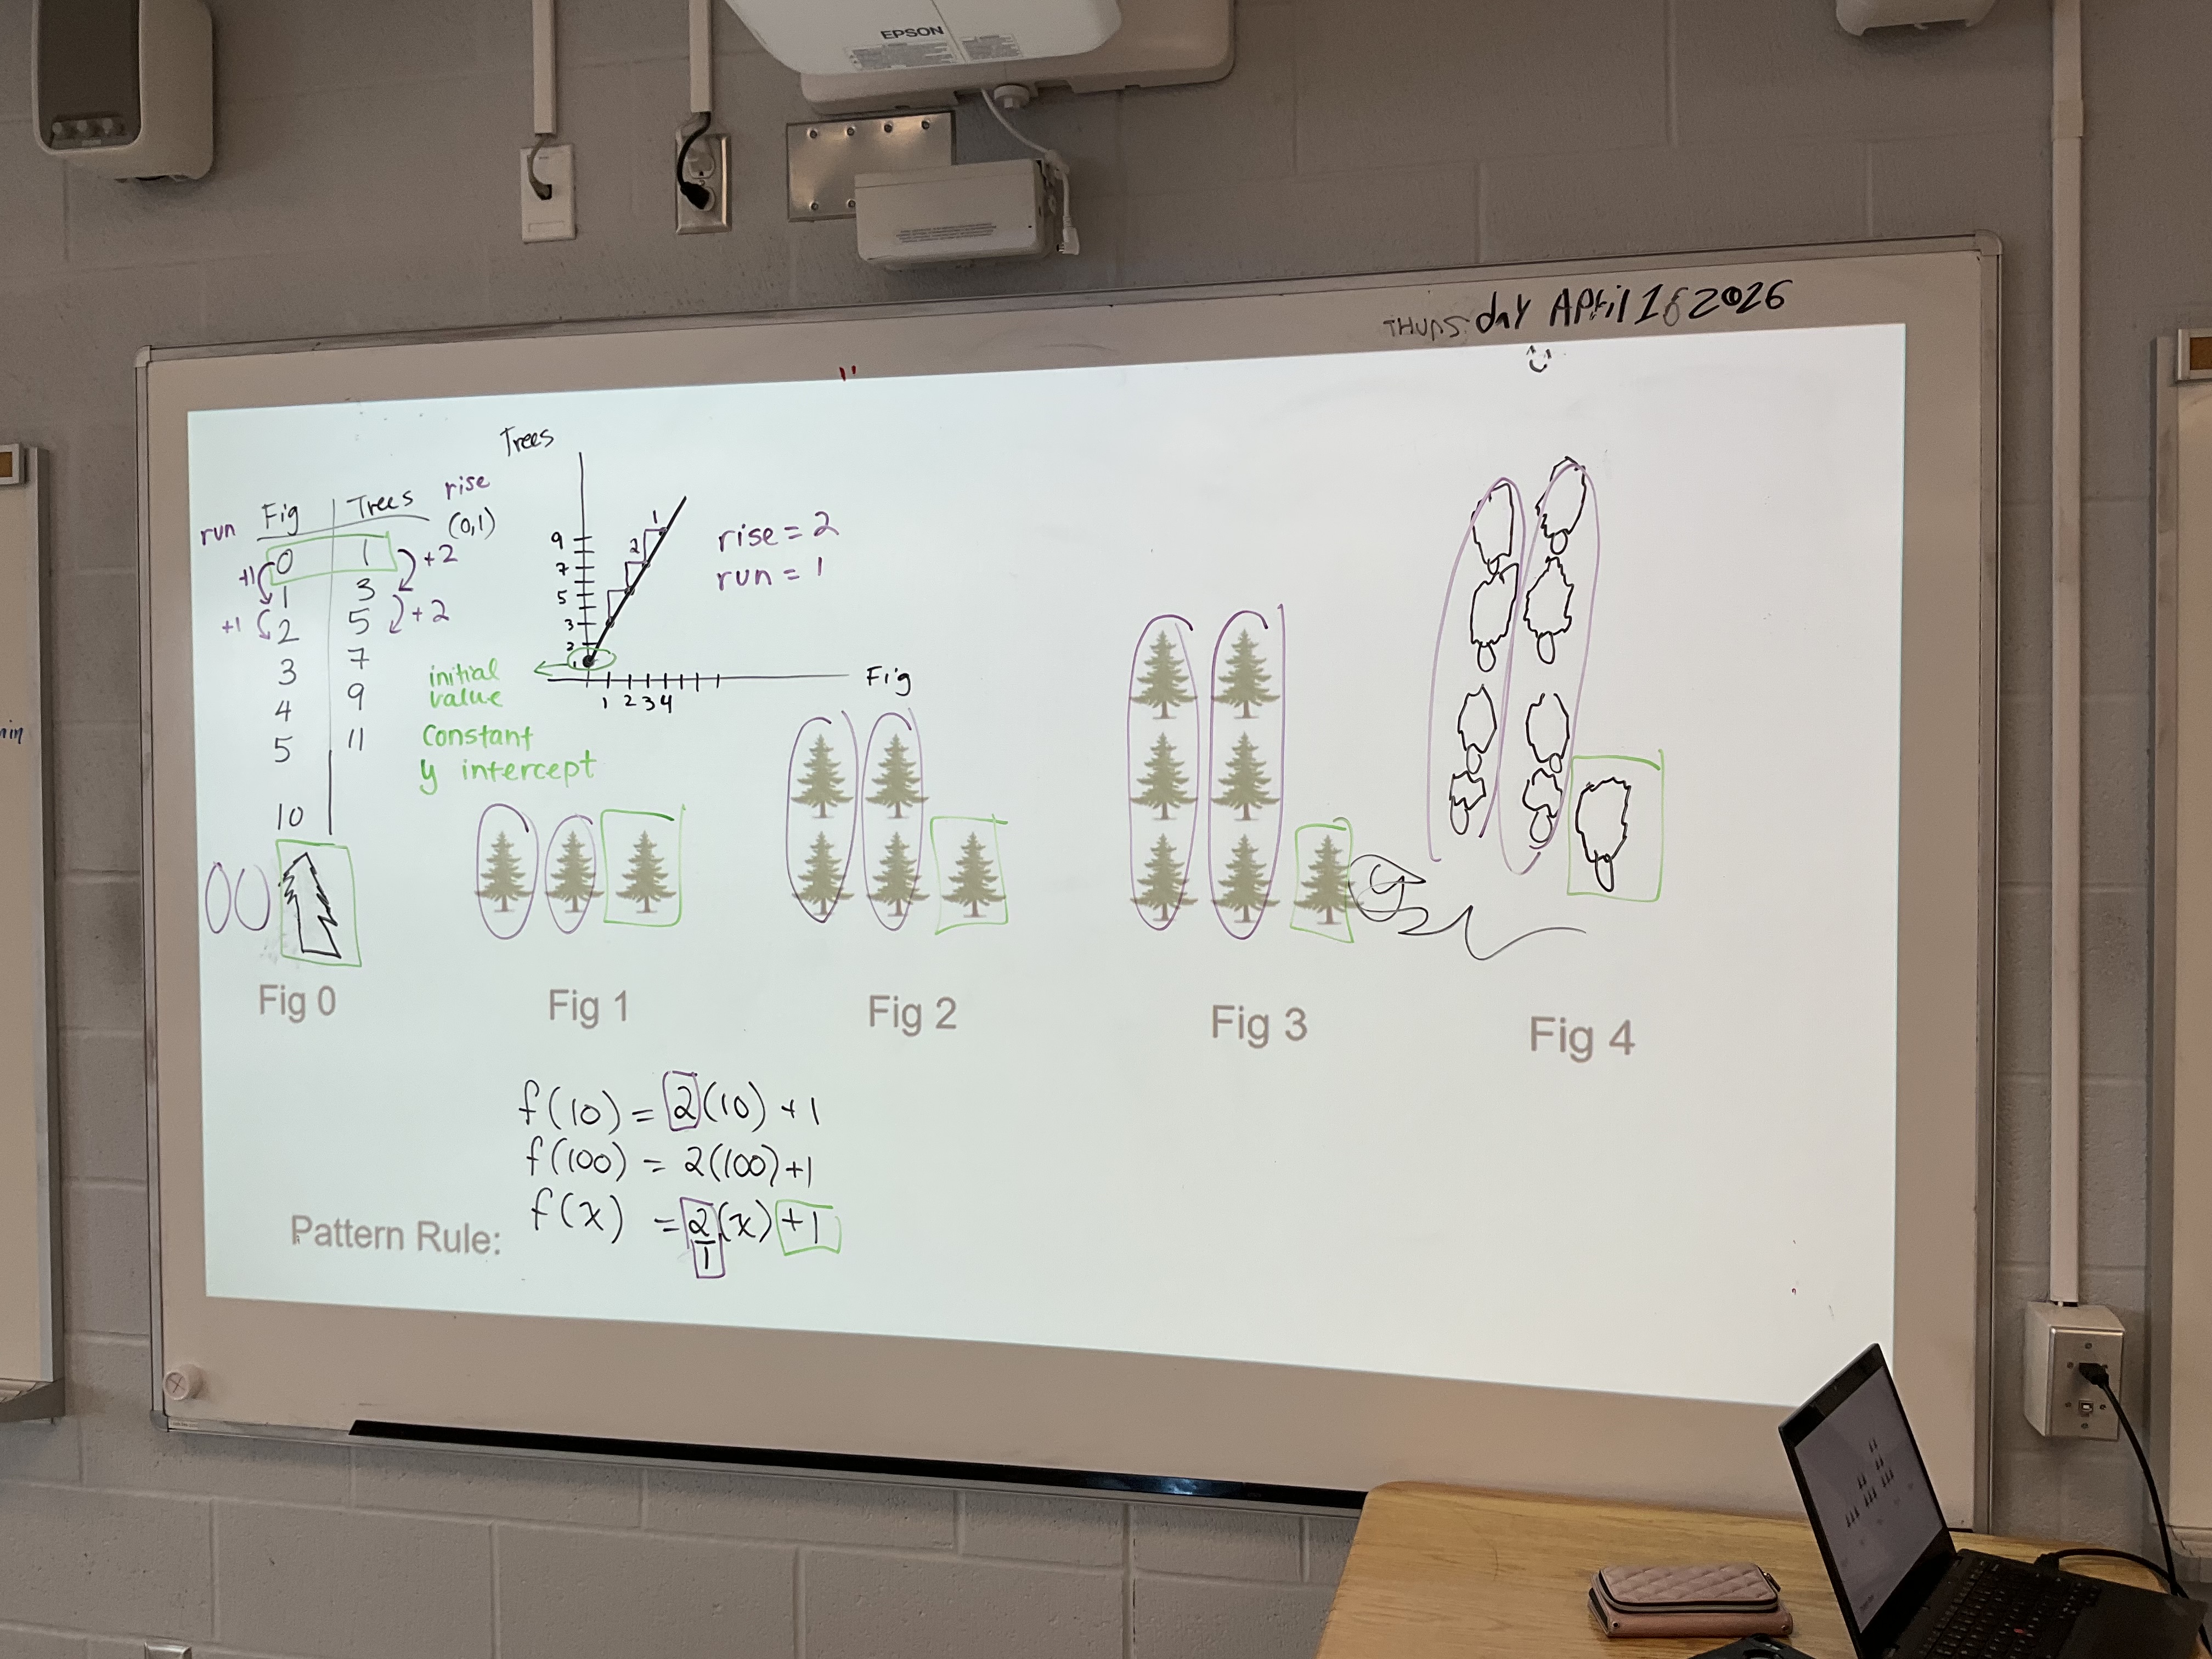
- Start with 1 tree (figure 0) and then add 2 10 times. f(10)=1+2(10)
- notice that in each figure, there are 2 columns of that value, and one extra solitary tree, so f(10)=2(10)+1
From there we can find figure x by swapping out the 10 for x. f(x)=2x+1. Introducing function notation works here, and I use it for grade 9s and 10s. The 10 applied class seemed ok with it too.
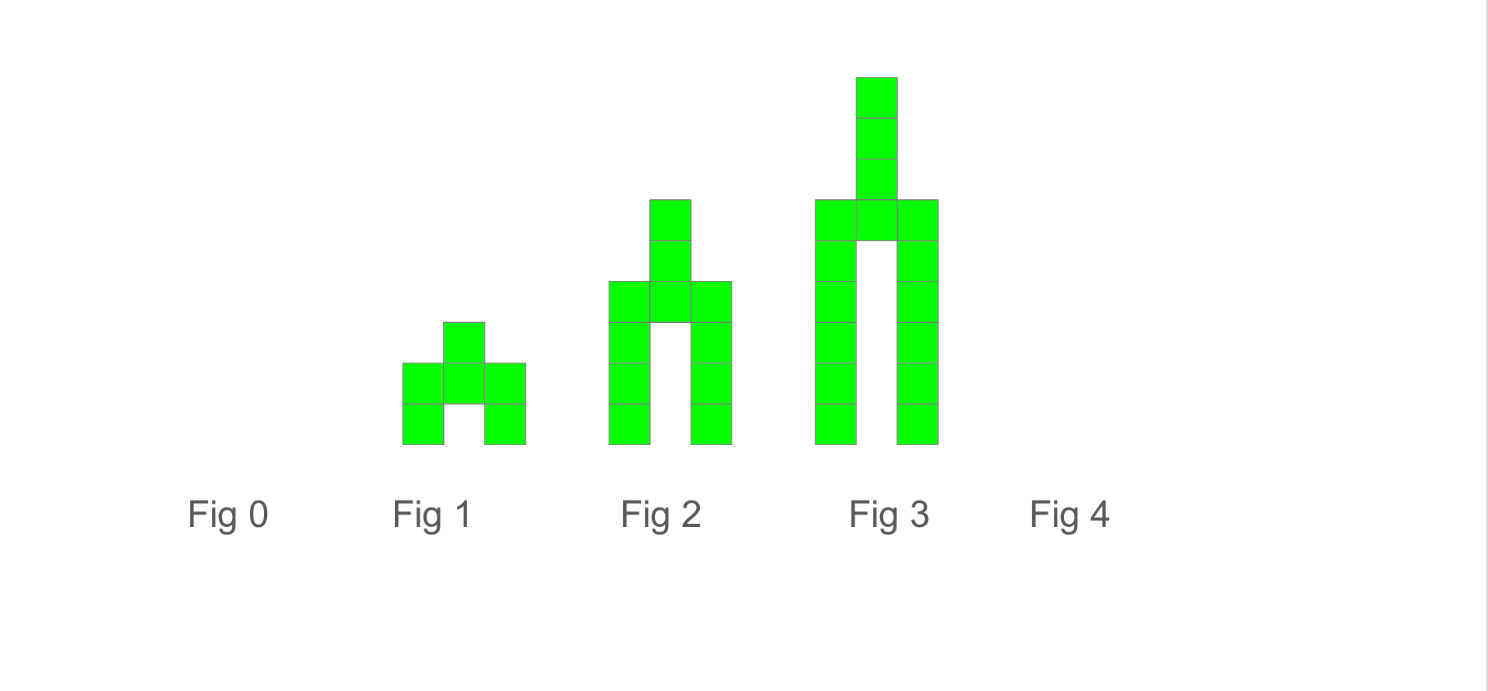
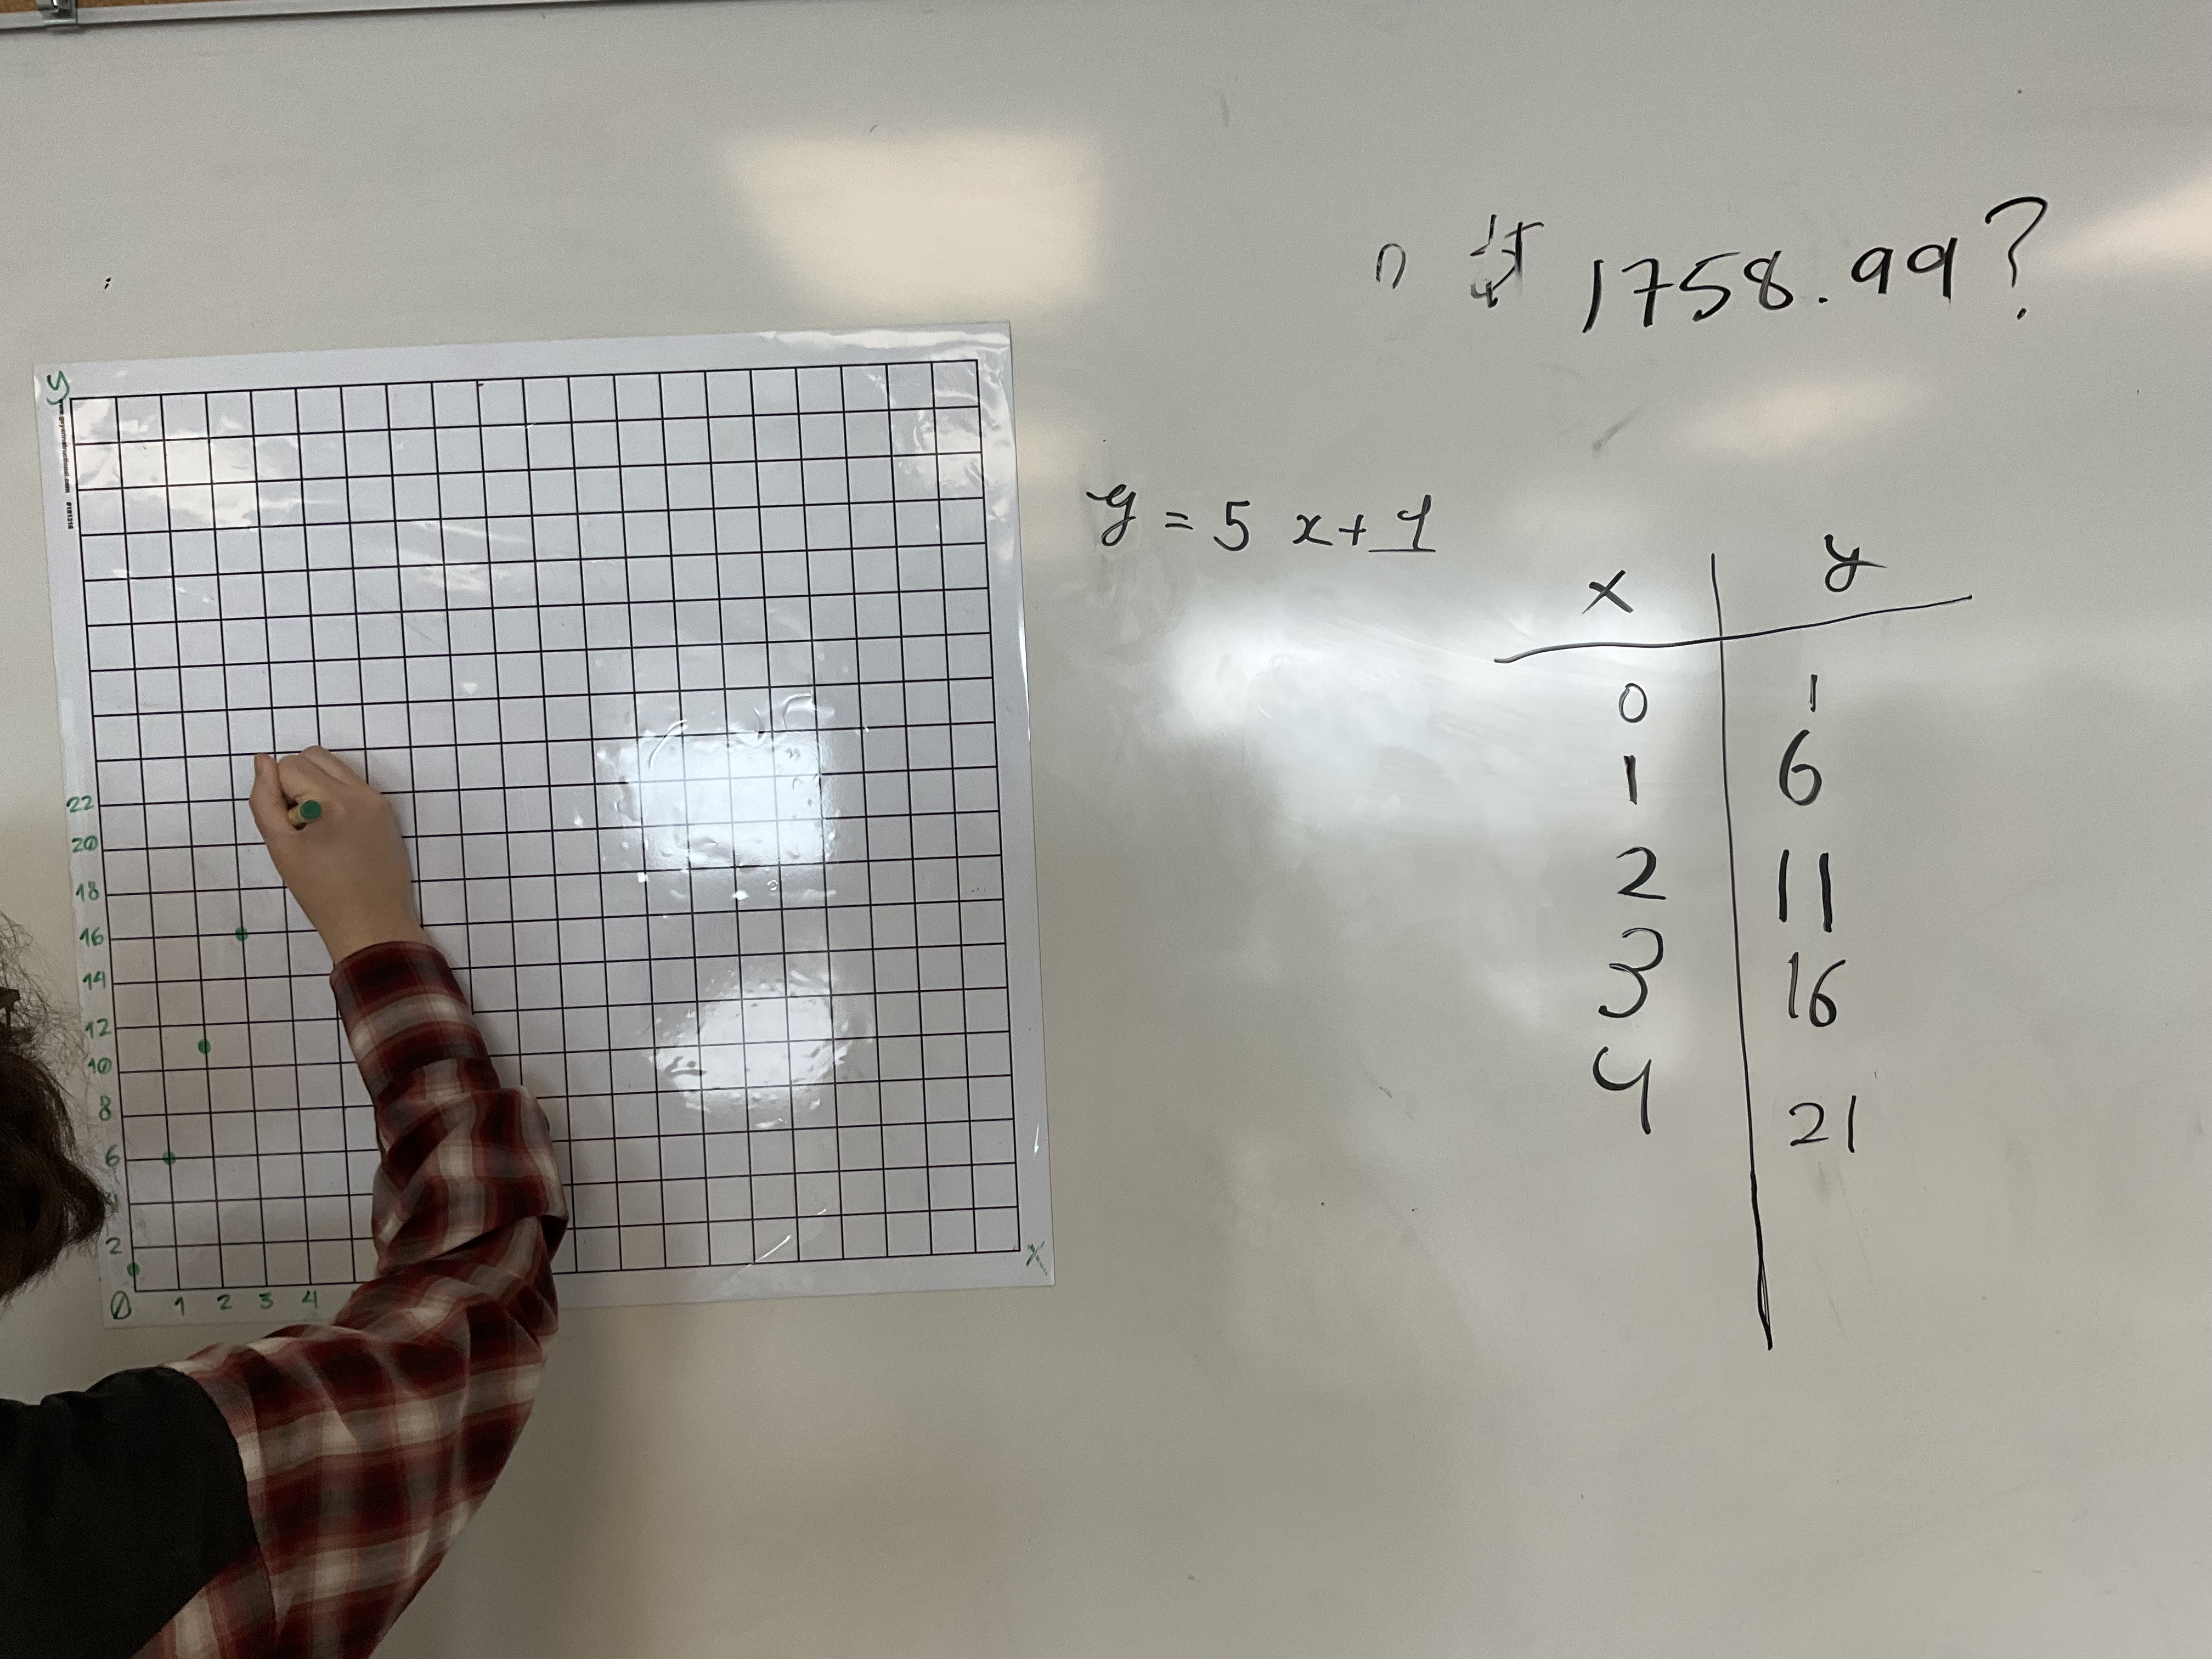
The next pattern we did in parters at the whiteboards.
Finally we did some practice with quadratic patterns. We noticed they grew differently, not going up by the same each time, but that the “change” changed by the same amount each time. We named that the first and second difference, and saw how we can find squares of the figure number, and groups of the figure number, and the constant visible in these patterns.
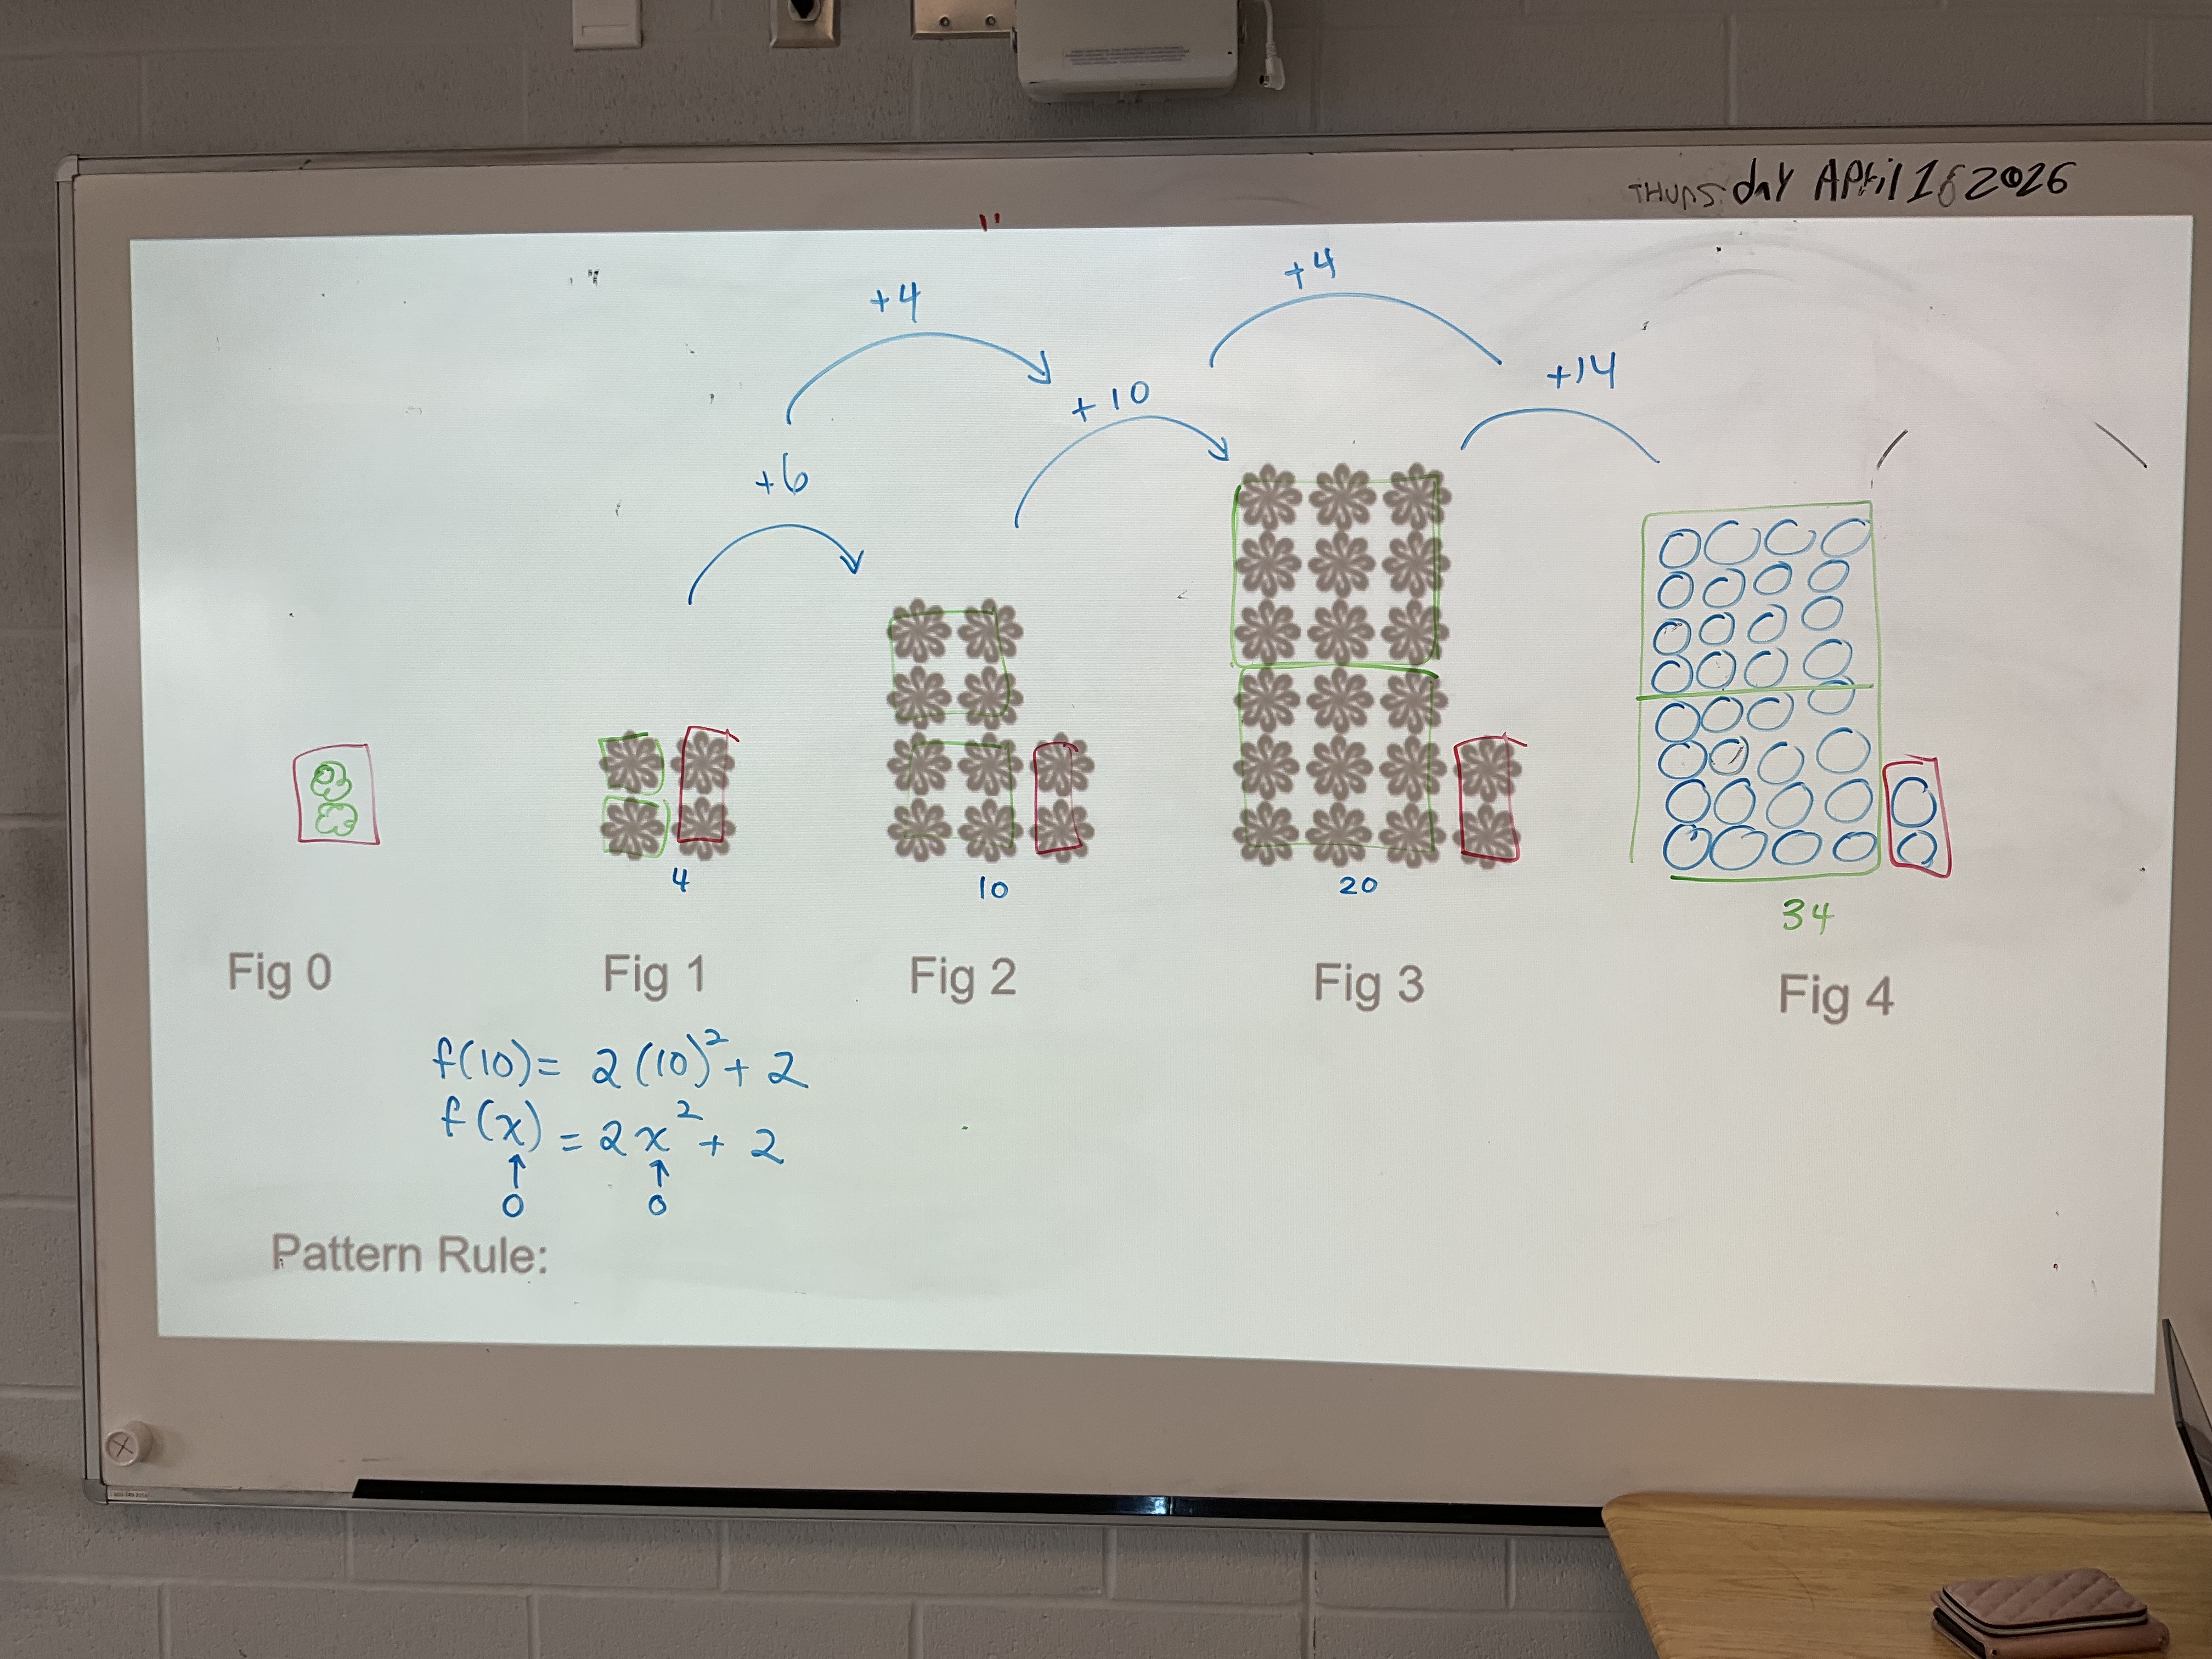
Again, we look at figure 10, there’d be 2 squares of 10 by 10, and then 2 left over as the constant. So the equation is f(10)=2(10)^2+2
and f(x)=2x^2+2
Students were starting to get the hang of it after a few examples.
For more examples go to visualpatterns.org
