Desmos and Inequalities
Grade 9s are using desmos to explore inequalities and equations on the cartesian plane. We started by making a list of all the possible numbers we know that add up to something less than or equal to 10.
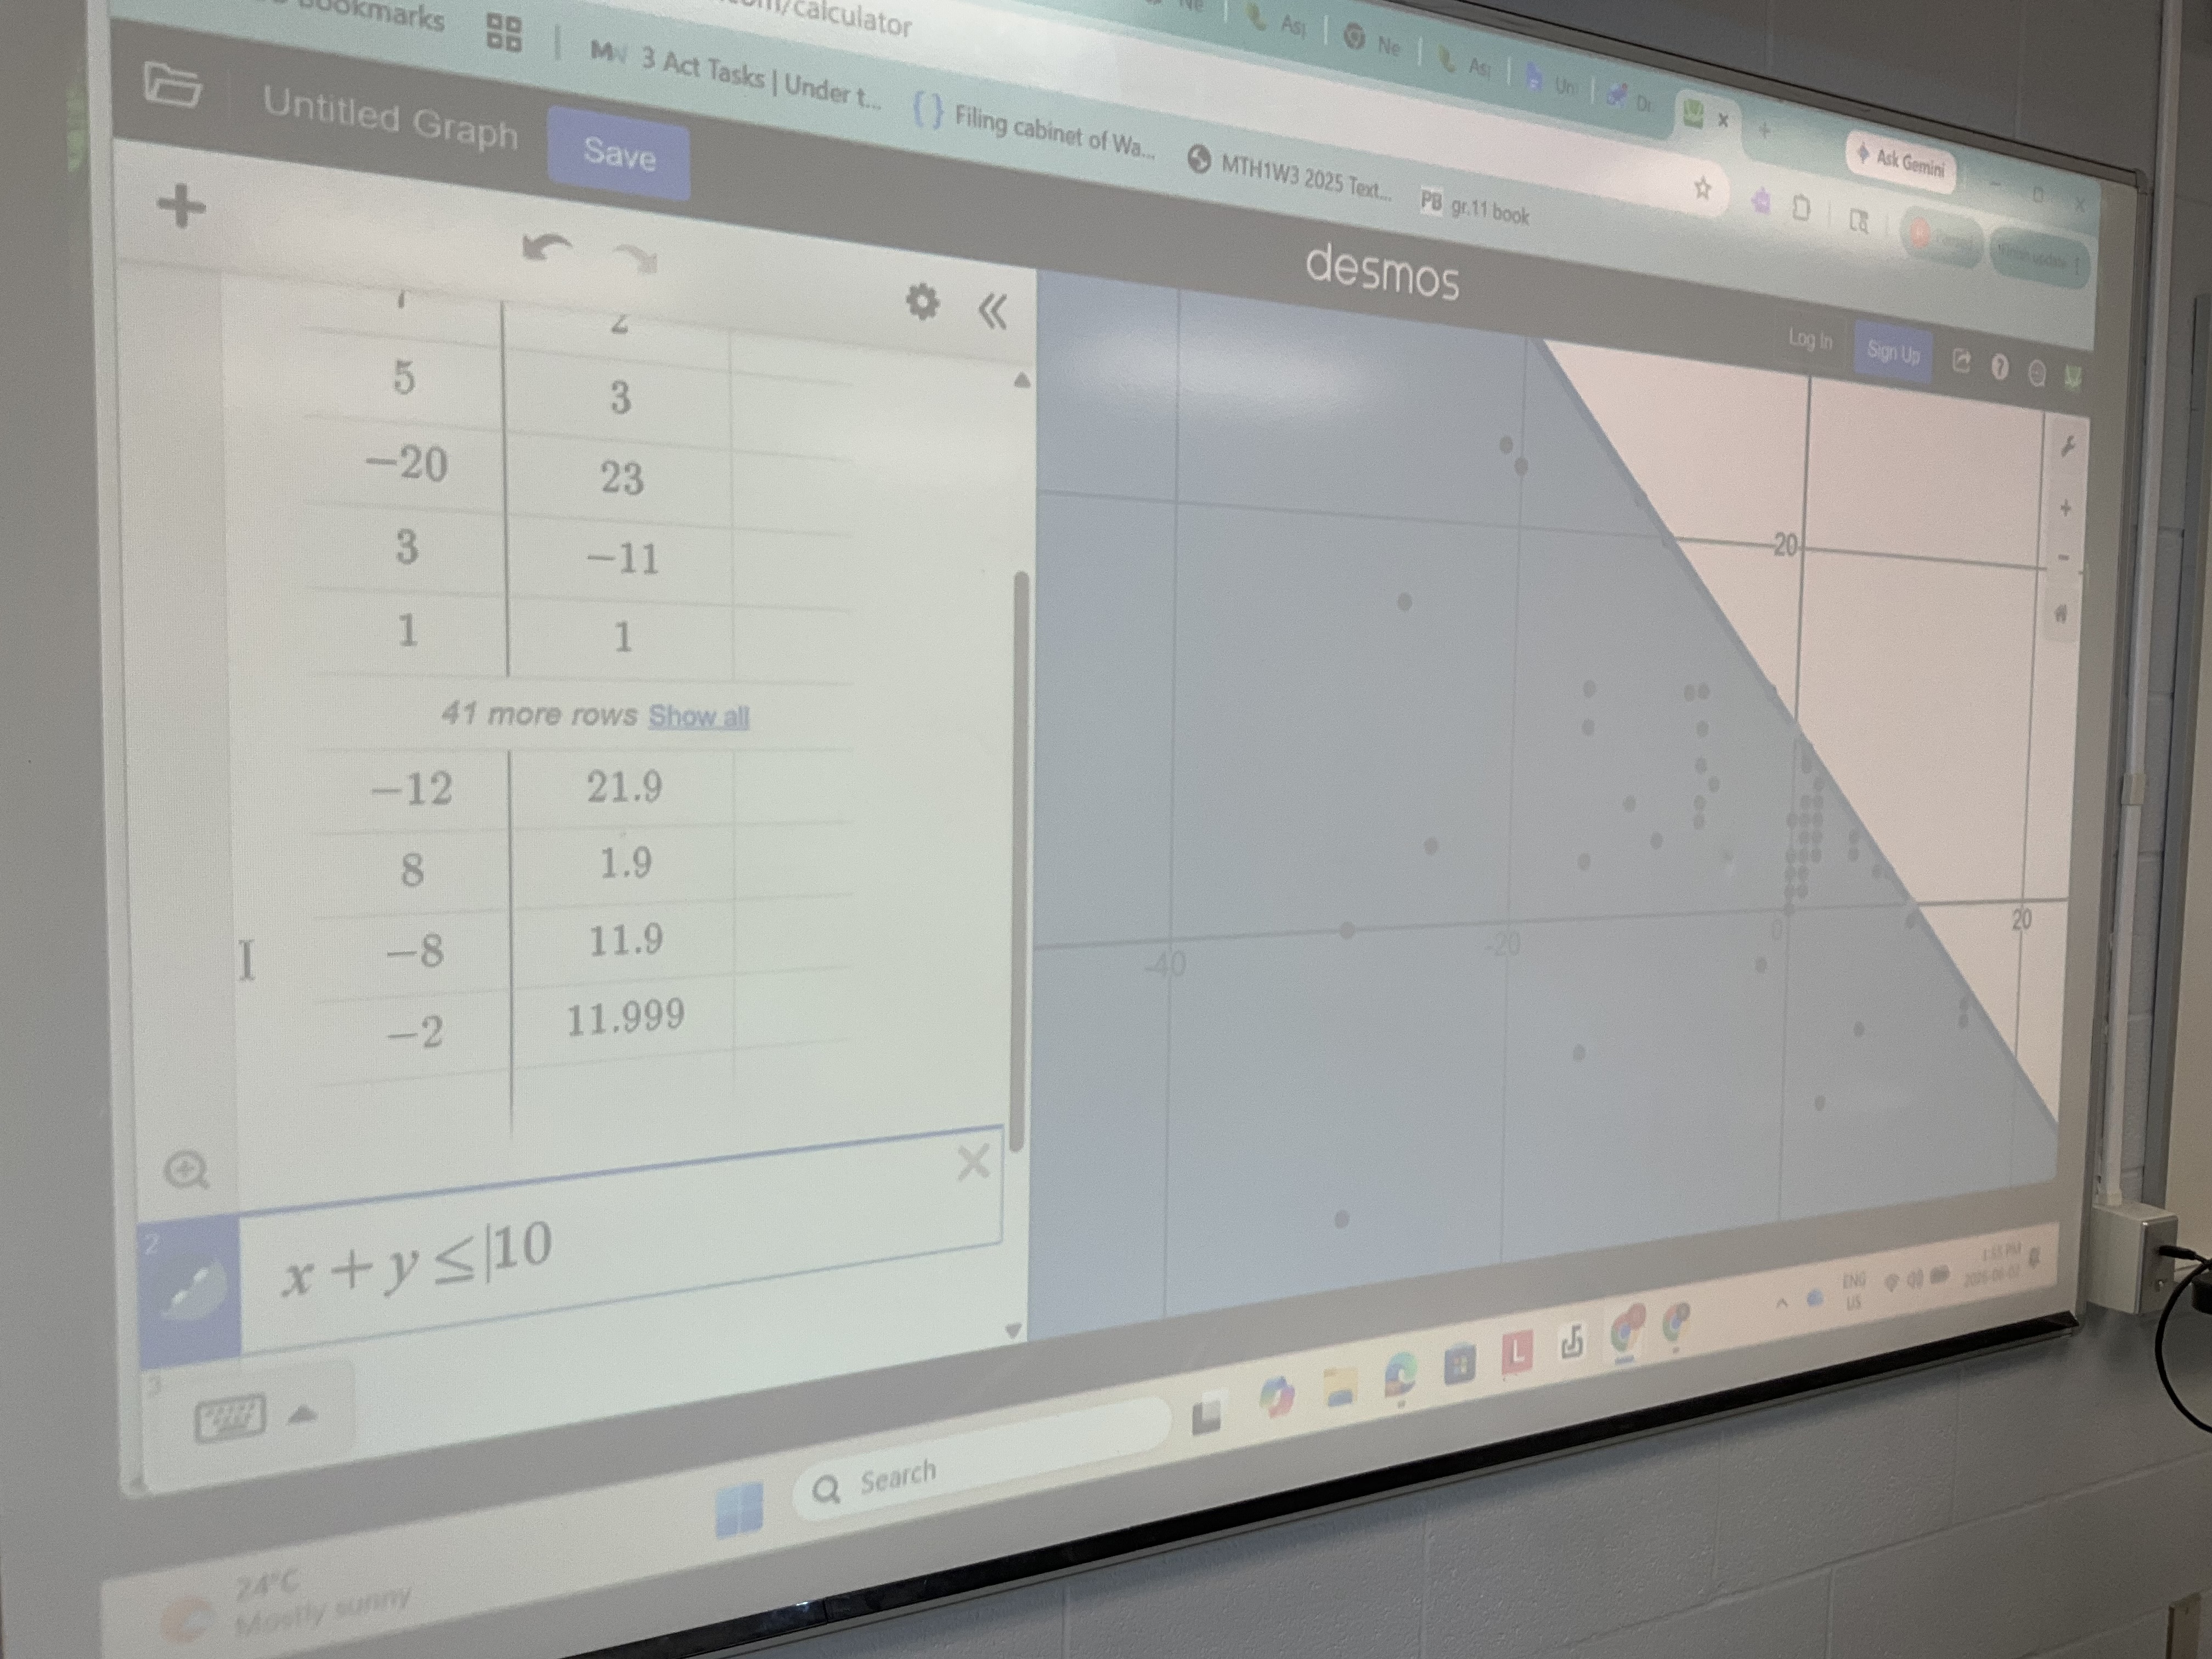
After we compiled the list, we noticed that there was a region that had dots, and a region that didn’t. We then found out that you could type inequality symbols in desmos and it will show the region coloured in, bound by a dotted or solid line depending on if there’s an “or equal to” in the symbol.
We got to review skills of isolating y, remembering what slope and rise and run are, what’s the y intercept. We also looked at how to calculate the x and y intercepts because sometimes that’s a faster approach. We substituted 0 in for x, and then for y and calculated the intercept values.
We’ll keep working on more graphing tomorrow and solving systems graphically. There’s so much to review before the exam and EQAO. I’m very glad we spiralled through material so it all is kind of building on past skills and review.
