3 Act Task
Today I was invited into a colleague’s grade 9 math class for a 3 act task that we led together. 3 act tasks start with act 1 to pique the interest. Students watch the video and write down what they notice and wonder.

Next comes Act 2, where more information is shared, and students use the information to solve a problem.
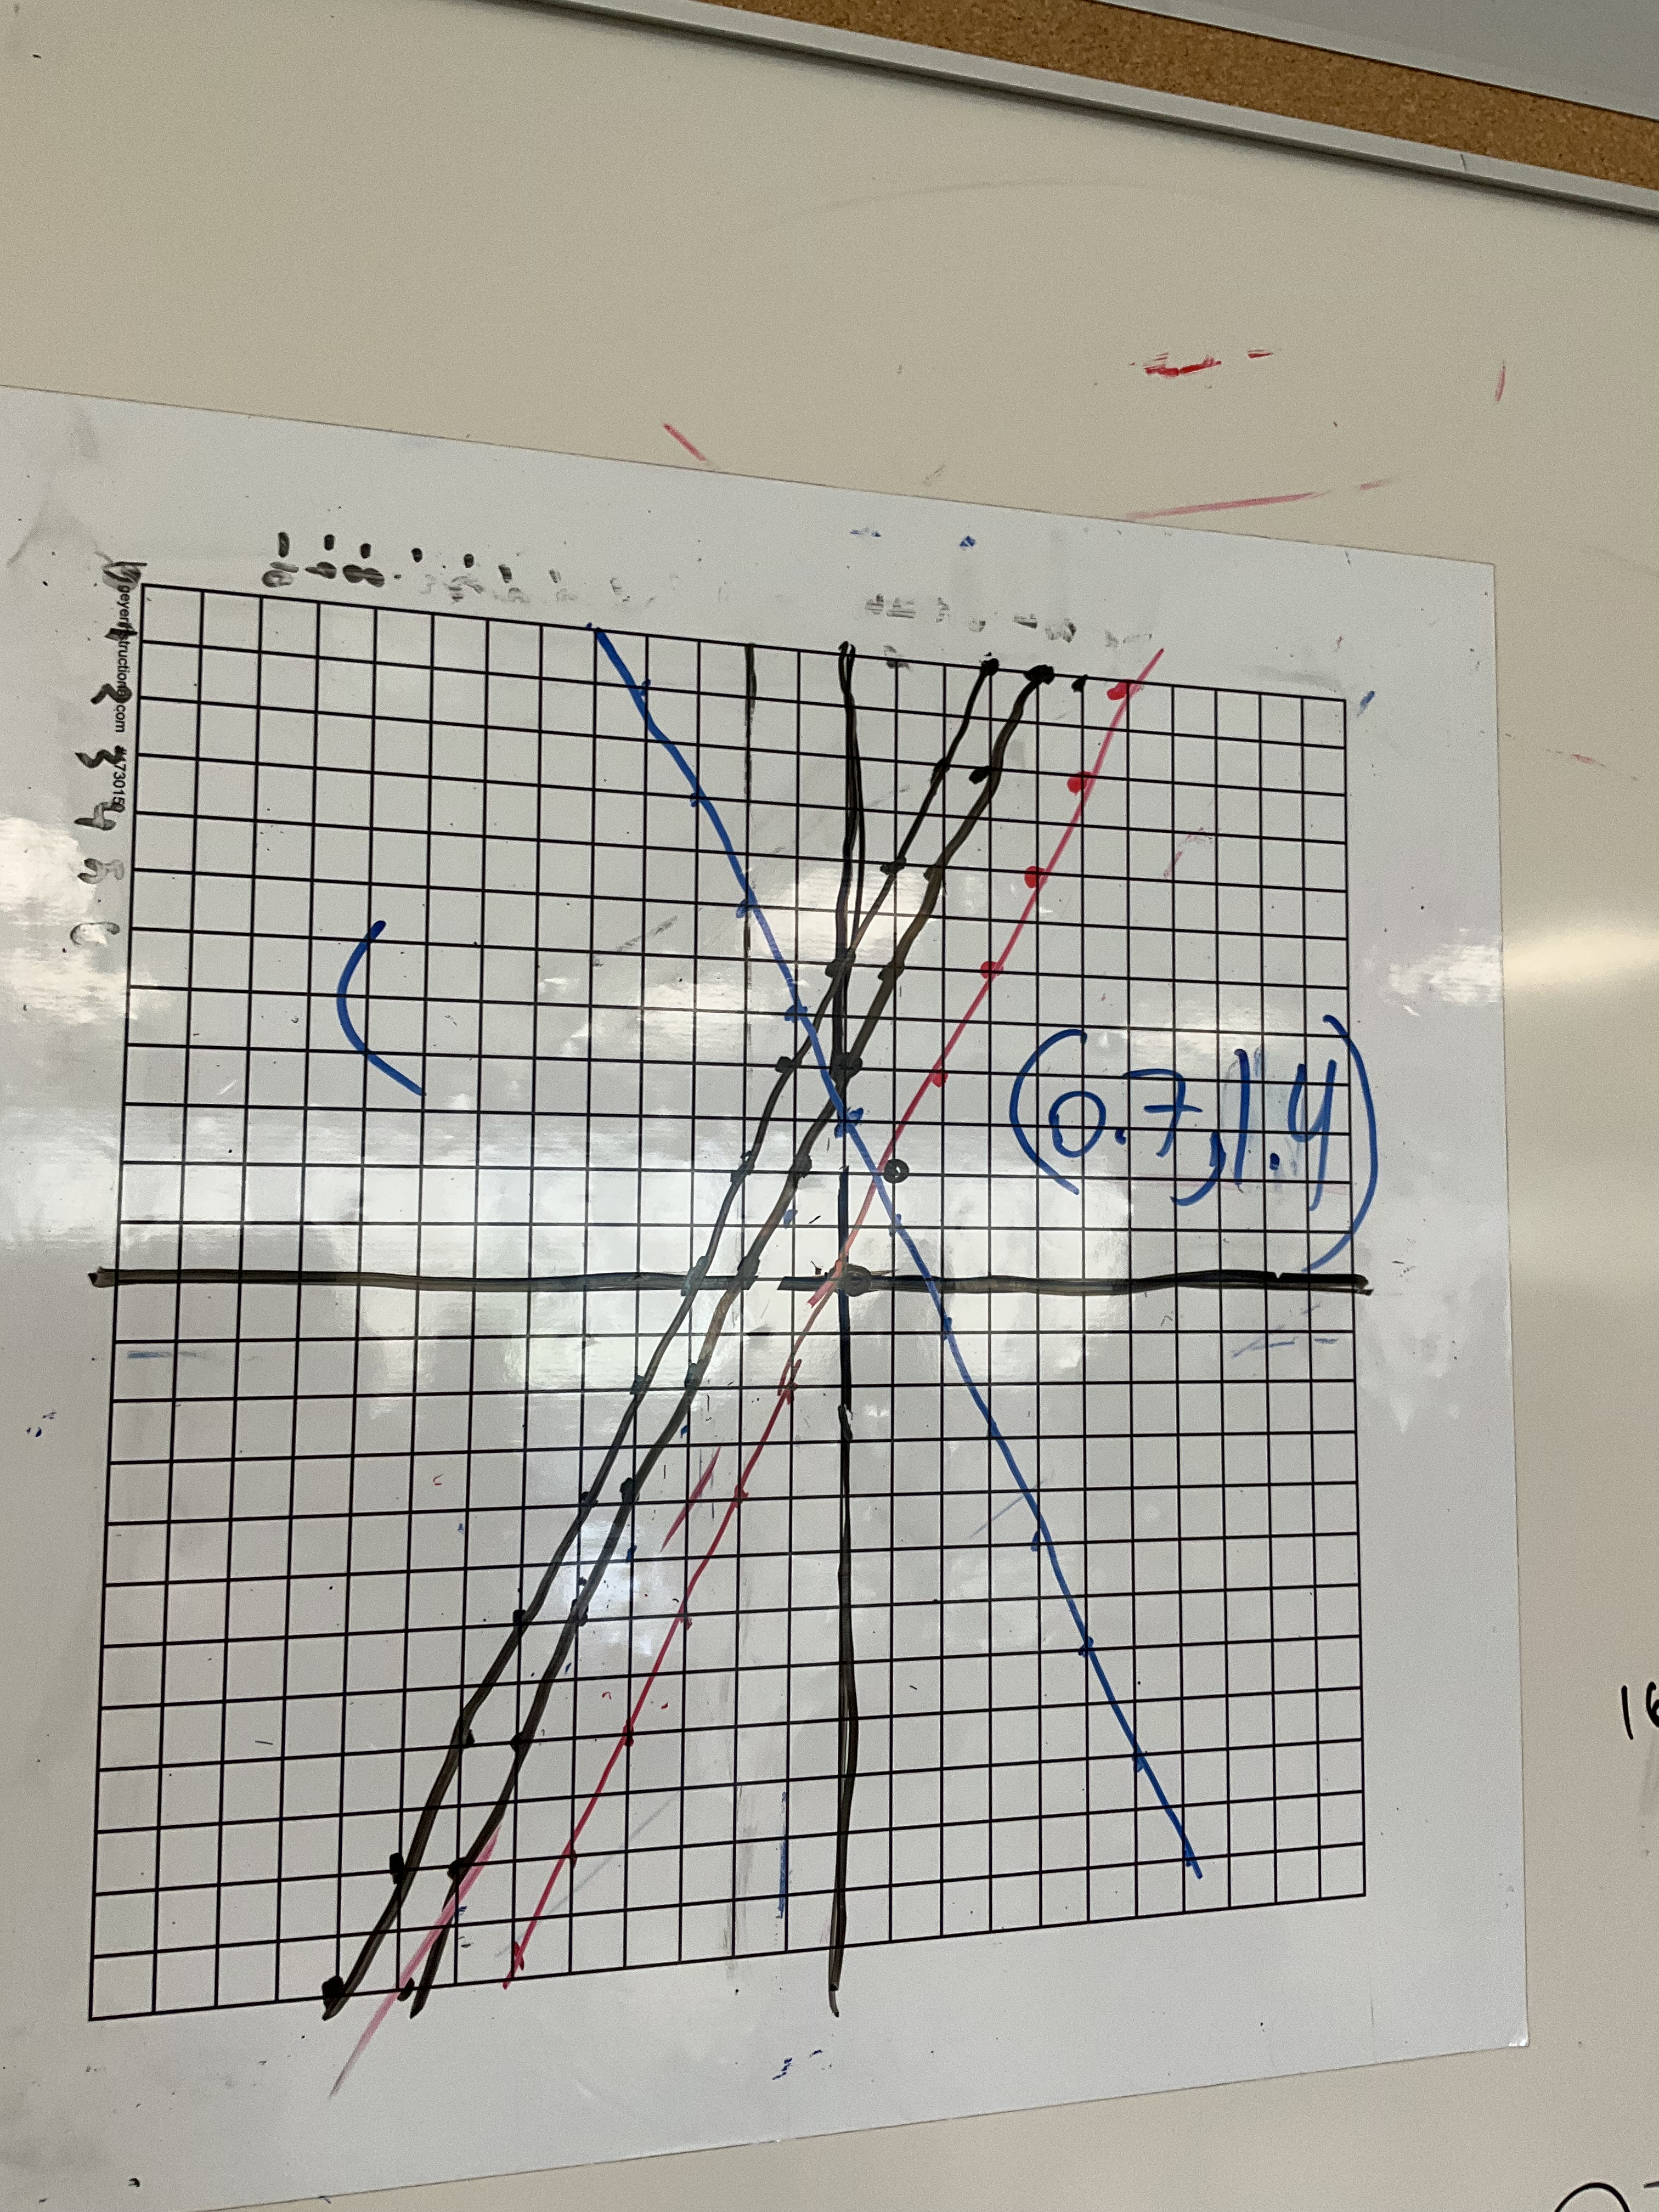
In this case we are figuring out how long it takes for the candle to burn out fully. Students use the data, in tables, and graphs and use logic to attempt to solve the problem.

This class has recently been working on scatter plots, so we encouraged a graphical representation to solve. Sometimes this can be done by loudly praising the graphical representation of one group, and others will latch onto that methodology. We worked on making sure axes were well scaled, and had labels, and then groups realized that they’d need to extend the trend a bit through extrapolation and a line of best fit. Some groups needed to extend beyond their graph!

One group didn’t want to scale their axis in a conventional way. We worked with them to see how their graph could still help them solve the problem.

In the end, when all groups had sorted through their responses, we consolidated their work, pointing out excellent communication, and including vocabulary about trends that they’d been using recently. At the end of class we watched the final act video which revealed the conclusion.
This task shows the use of a graph and extrapolation to solve, which made it a great fit for the recent topics.
I look forward to working with this class again soon!
Beading Progress
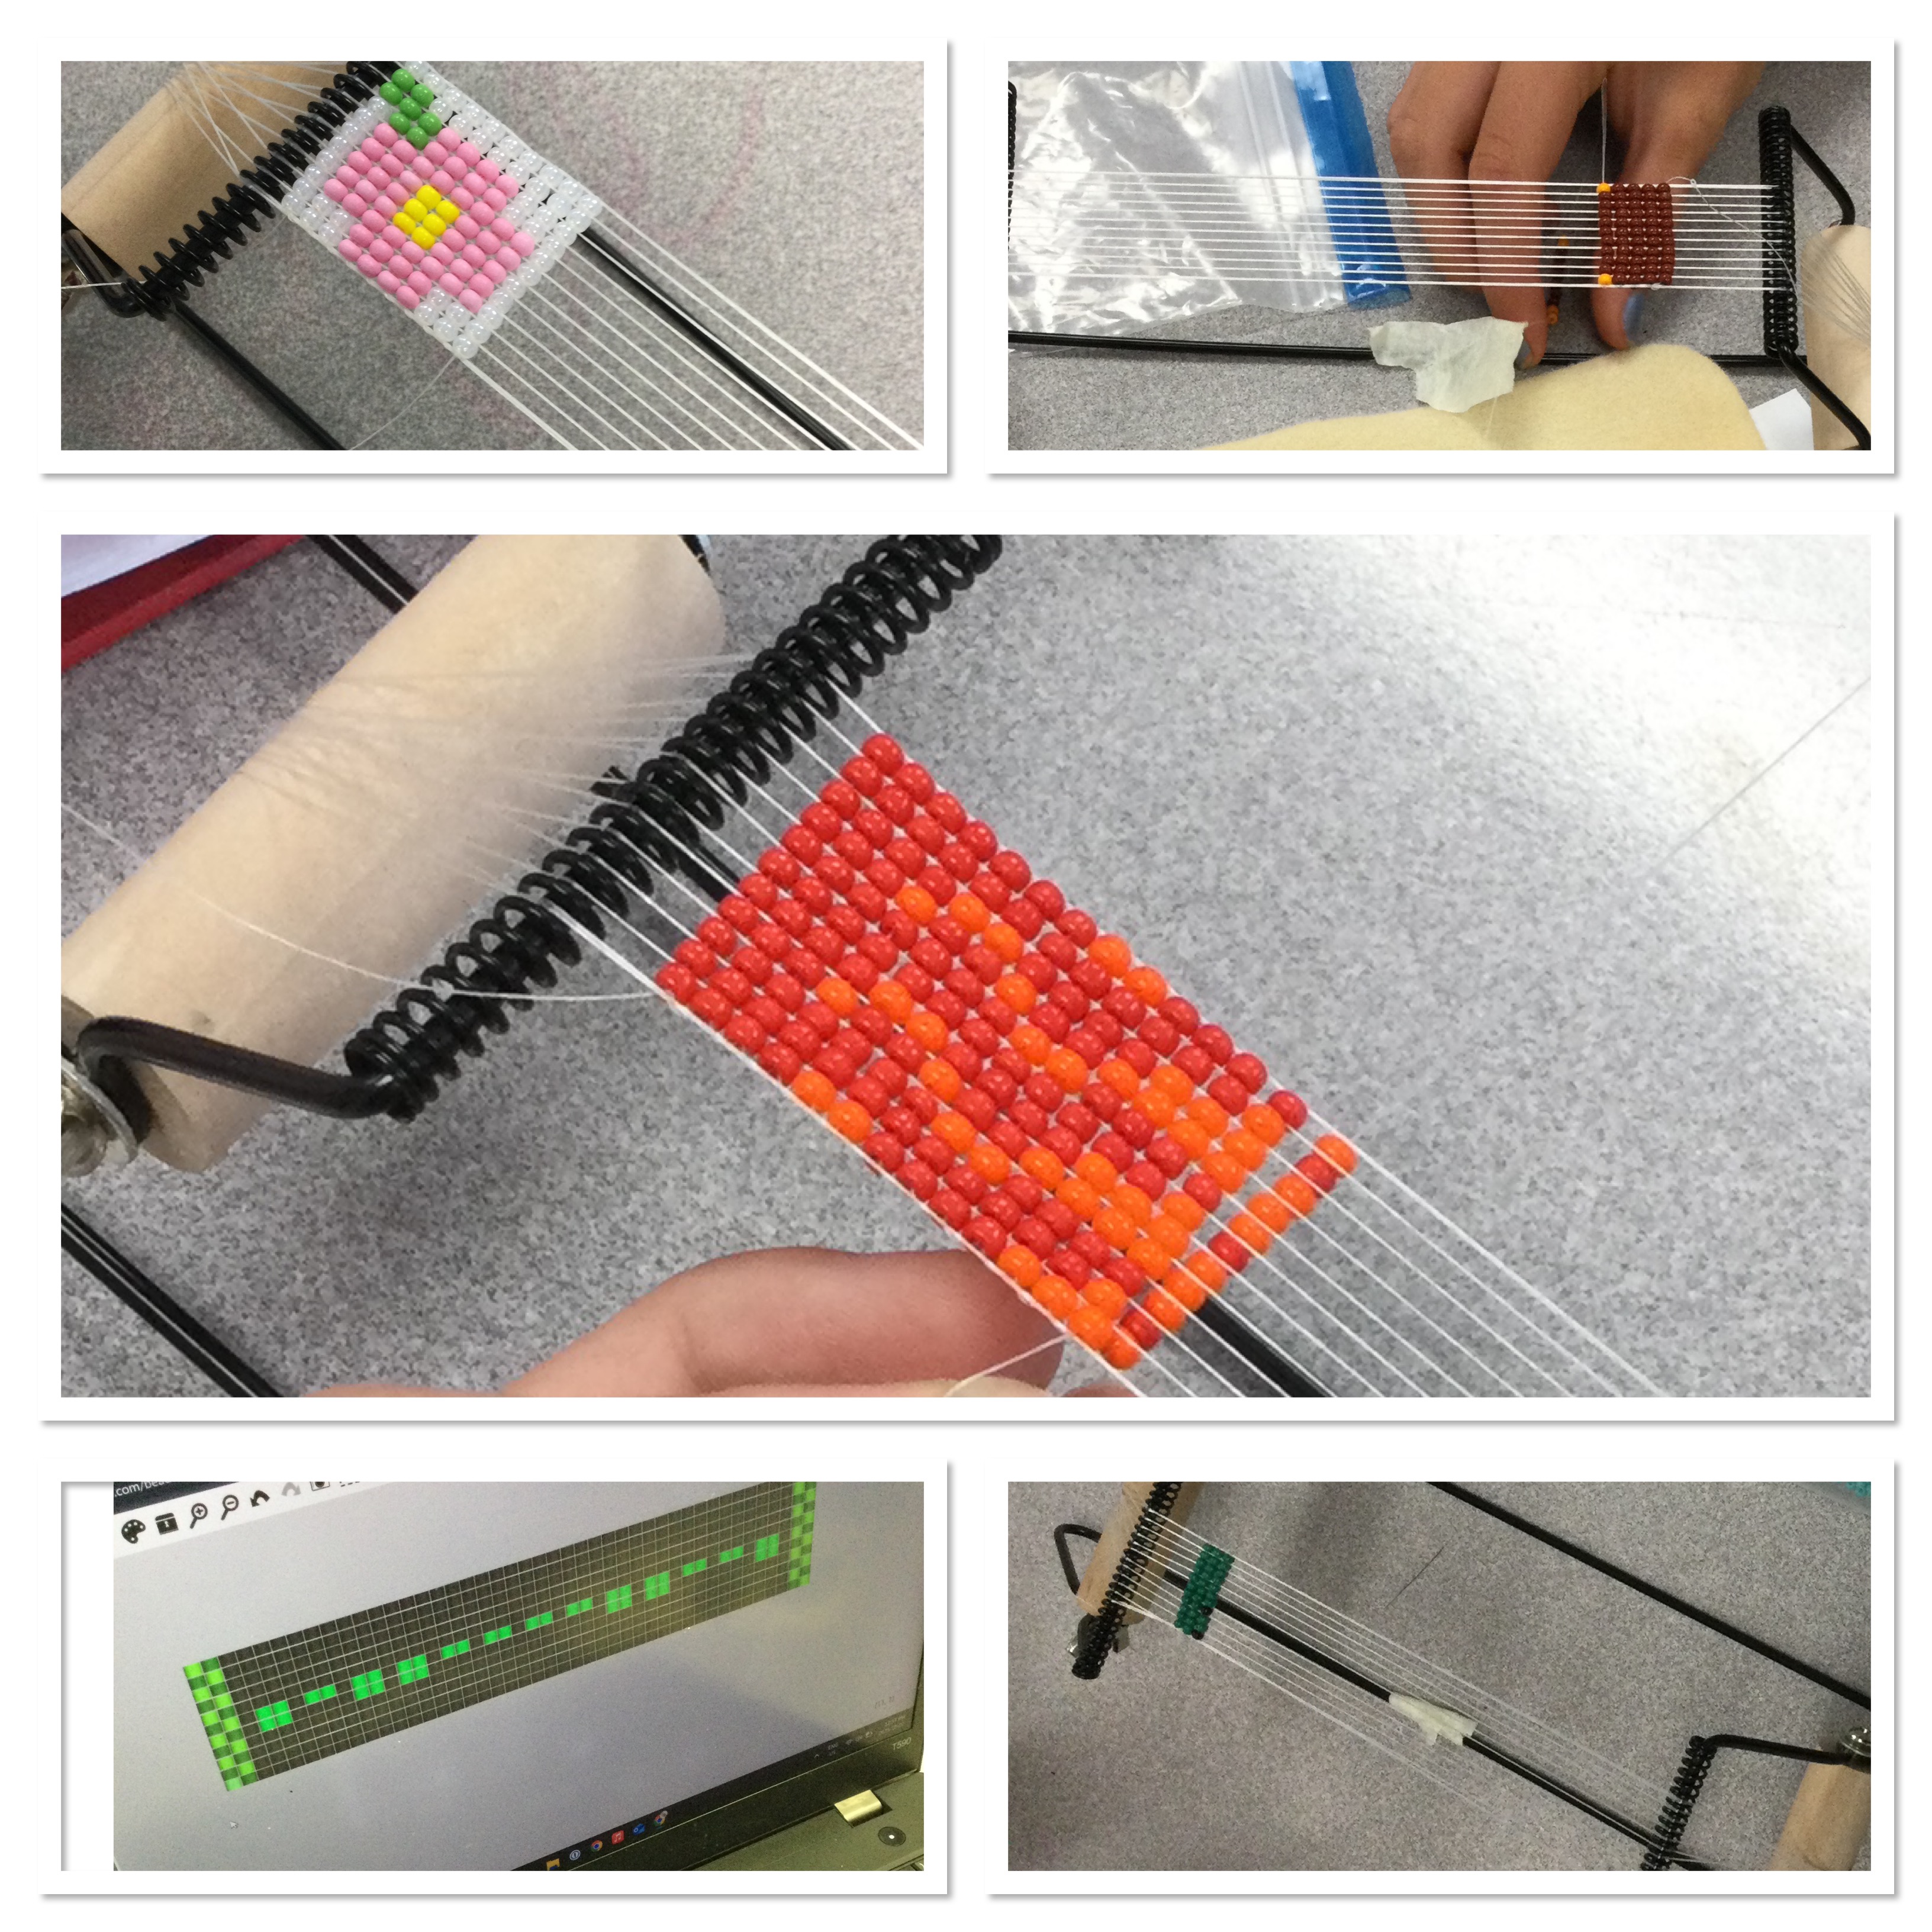
We worked hard at our beading projects again today. We are making solid progress!
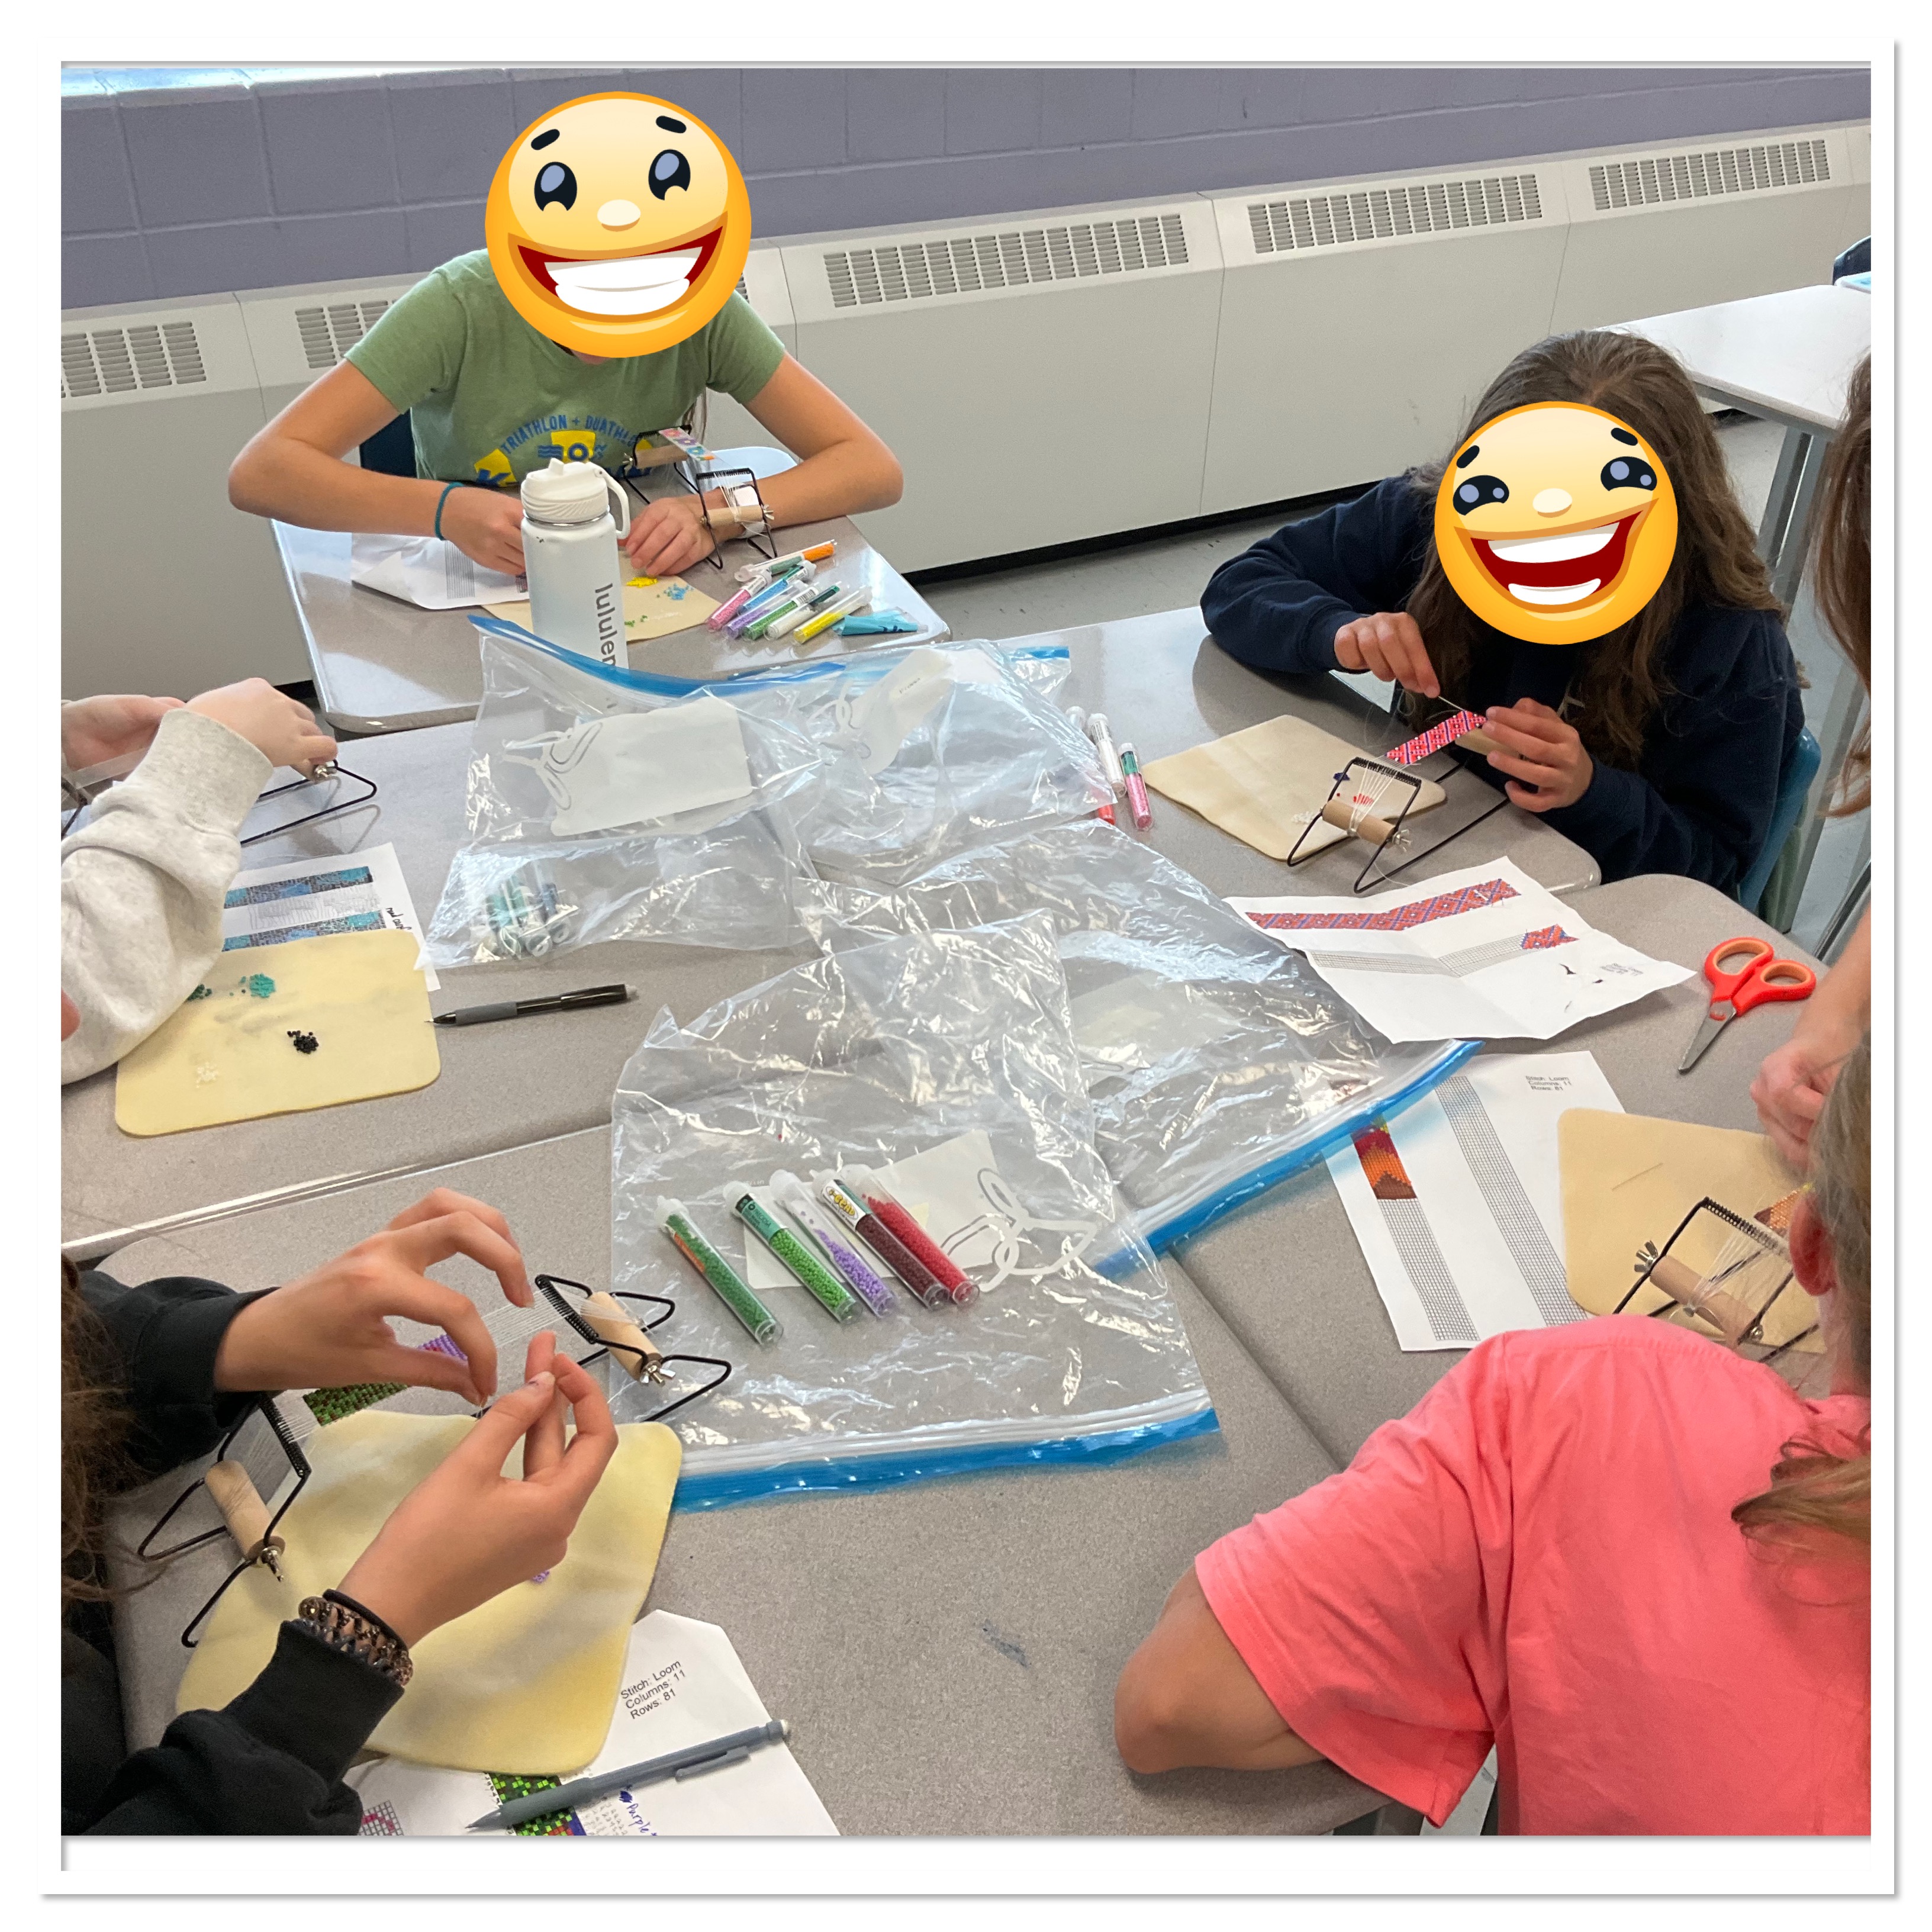
Now that we know what we’re doing, it’s quite a calm meditative activity. We don’t have to remind ourselves as frequently to watch our energy. We need to make sure we are doing beading with good energy and intentions.

We’re making really interesting patterns too. Each one is unique and we’ll have lots of math to discuss when we get to finishing our projects.
Tomorrow most of us will be weaving in ends and gluing to prepare for attaching hide to make bracelets or keychains.
Beading Progress
Today we learned how to get started with our beading projects. We used our patterns to decide what beads we need. We put the first 11 beads on the needle and learned how to thread them to attach them to the warp threads on the loom.

Next we gave it a go! We ran into our fair share of frustrations: a loom came unthreaded, some knots happened where we didn’t want them, beads fell off the thread, needles came undone, but all in all we made good progress, and we kept calm when things were challenging.
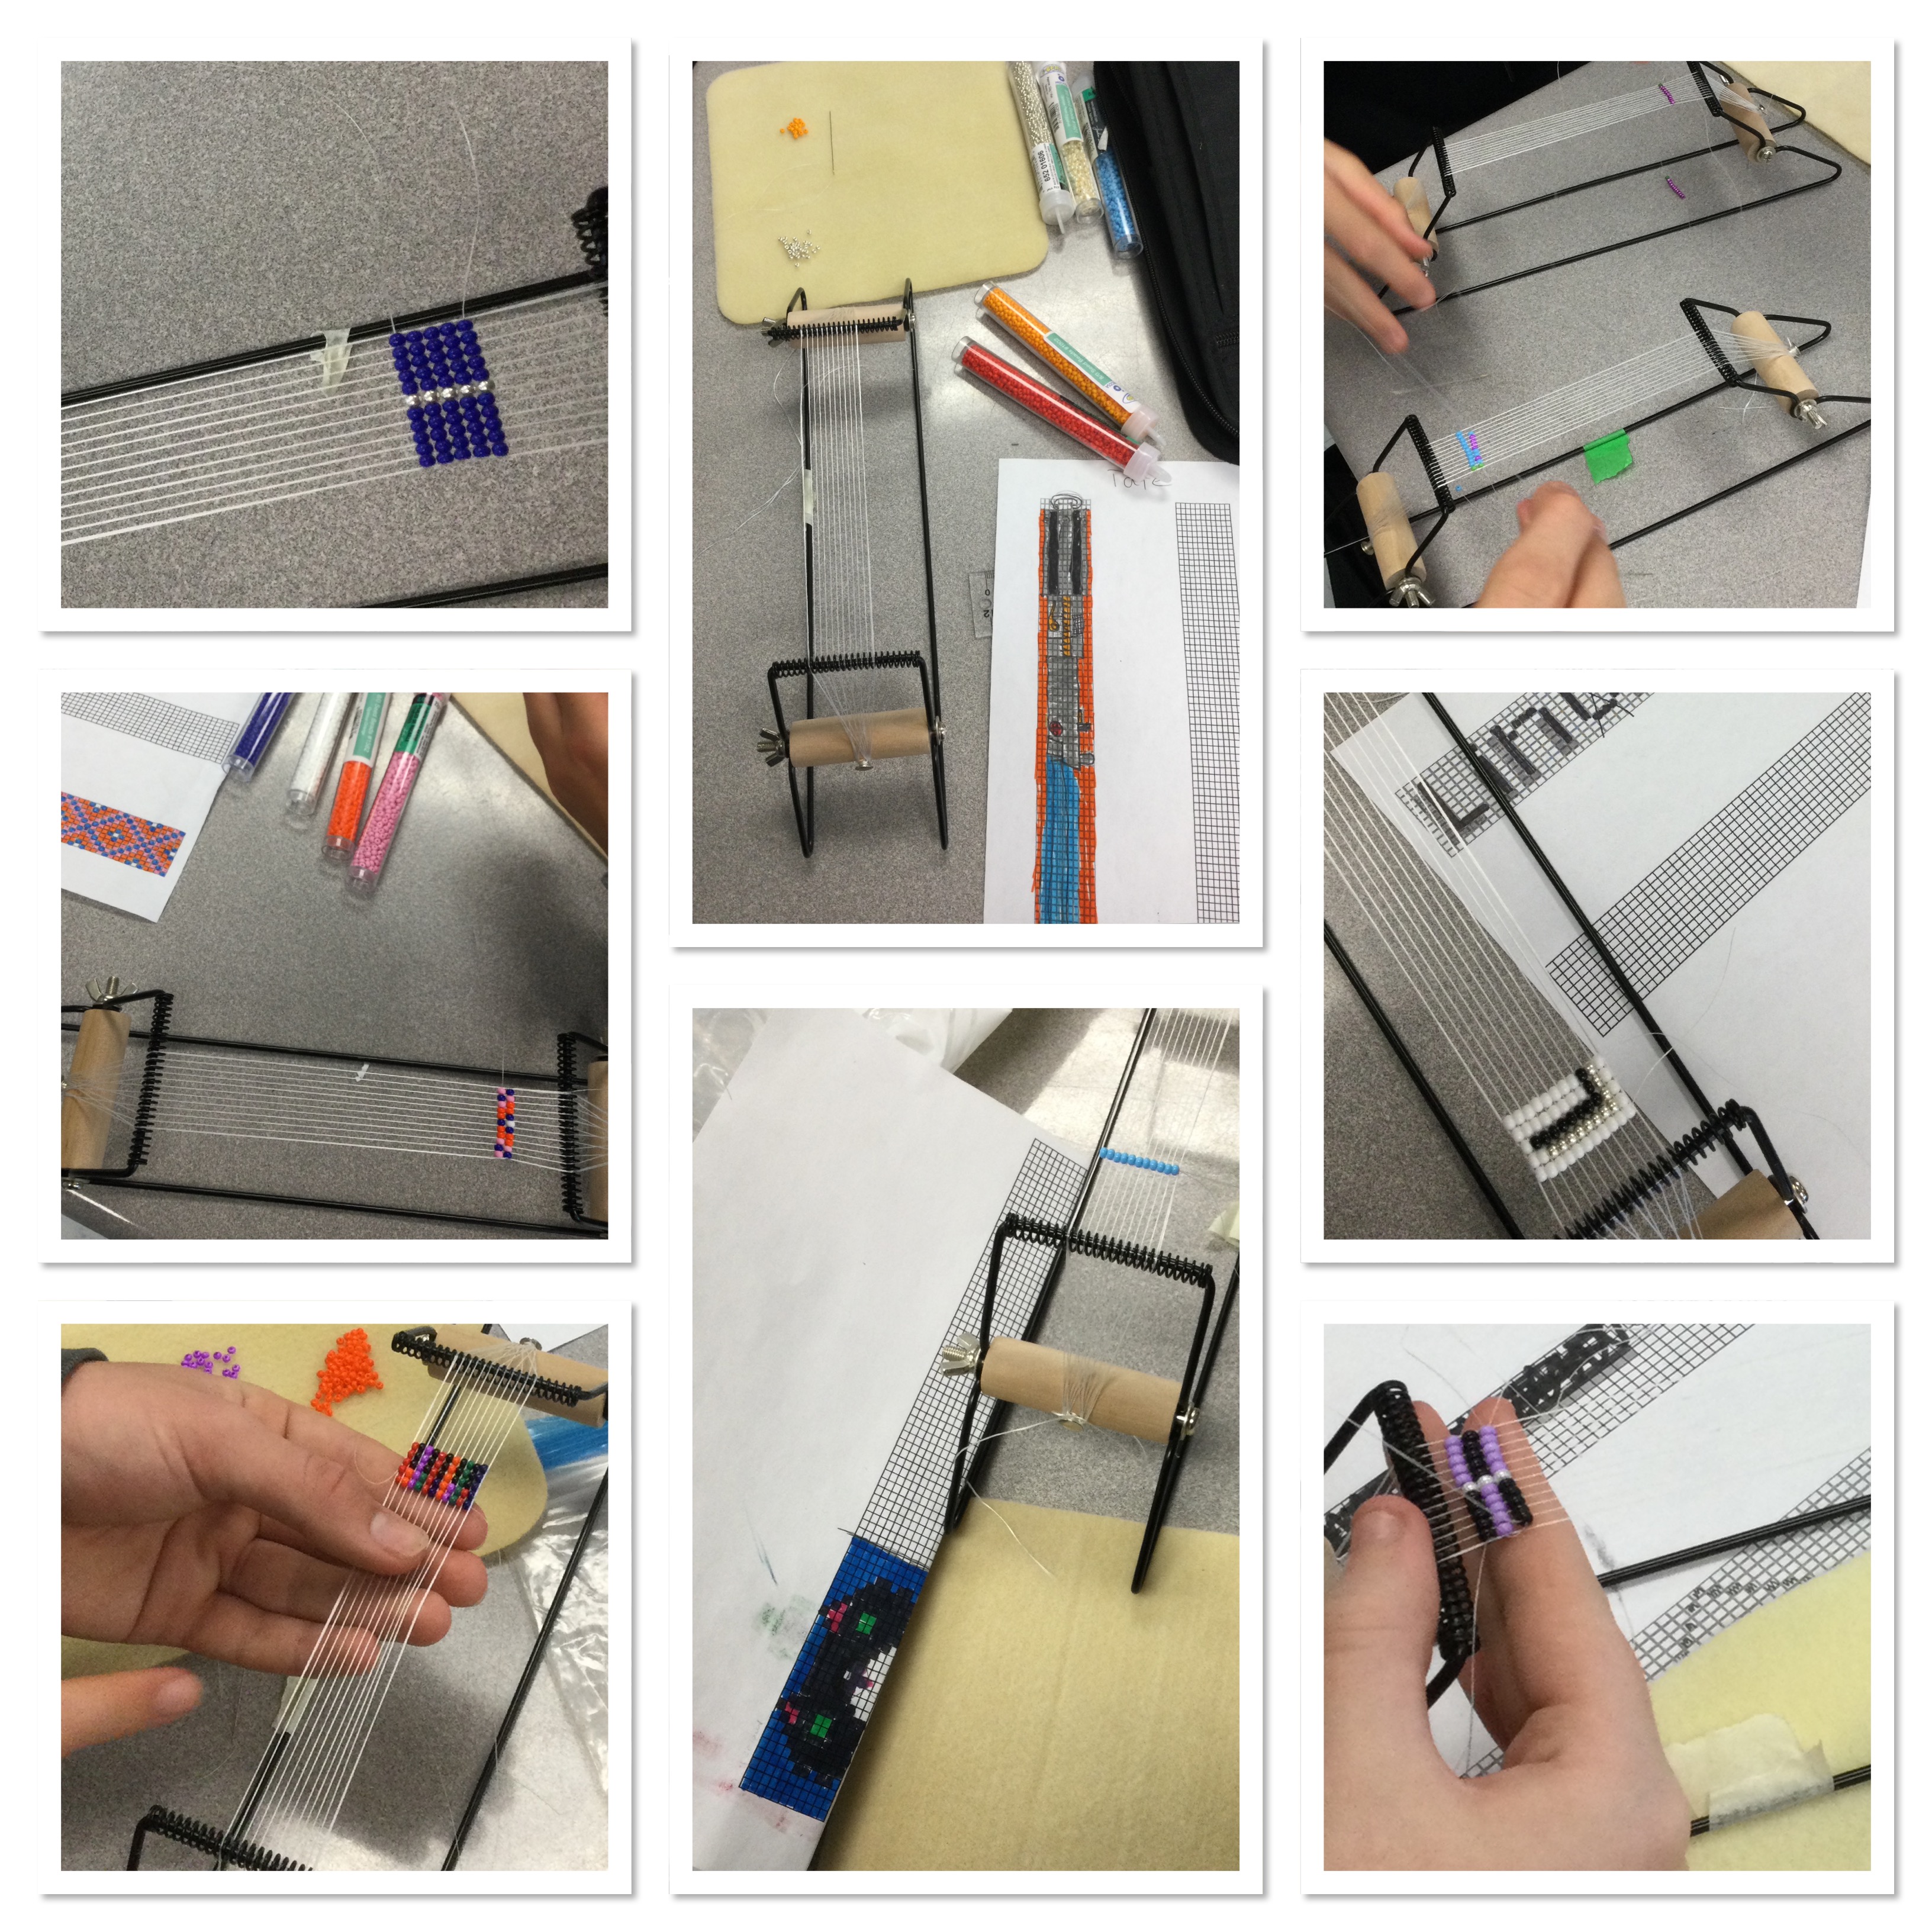
It’s pretty neat to see what progress can be made in one day. We look forward to continuing the progress tomorrow. If all goes well we can be finishing them up before the PA day on Friday.
Great work grade 9s!
Multiplication Fluency
We’re working on multiplication strategies these days, and we got out the base 10 blocks to model some multiplication. We did 15×6 to start with.

Some students made 6 groups of 15, and then counted. They knew they had 6 groups of 10, and 6 groups of 5, so the total was 90. Others used doubling and halving with this question. They doubled the 15 to make 30, and they halved the 6 to make 3, then they multiplied 30×3 and got 90. They then used 9 rods of 10 to build the 90, or used 100 and a negative 10 rod to get back to 90. It was neat to see the different ways students approached the problem.
We next looked at 26×15 to see if there were different approaches.

One group built a rectangle thar had dimensions of 26 and 15. We can see (top right) that this gives us a nice area model to work with. We can section the rectangle by friendly numbers and then calculate the small areas and add them up. Another group kept using the doubling and halving. They doubled the 15 to get 30, and halved the 26 to get 13 then did 13×30. Some did 13x3x10 to make it easier. Either way you get 390. One group made the 390 in a 3D shape and another made it in a flat rectangle, starting off with 400 and removing one by using a negative 10 rod.
I’m really glad my students are getting braver and are excited to share their strategies. Here’s one student’s area model. We needed a small correction, but it was a great way to show our work.

Next we used our multiplication strategies to work through a number string, doing one question at a time sequenced in an order to help us get to more complex problems by using work done in prior questions.

We’ll keep working on these strategies. It’s fun to see the learning happen!
Introduction to Loom Beading
Today we had the pleasure of learning from Jessi from the Indigenous Program Team at the board office, who brought some historical and cultural perspectives about loom beading, and some teachings to share with us before we embark on our project.

Over the next few days we will be planning and beading a bracelet/bookmark/keychain, and then reflecting on the math that is present in the work, and the other skills that we learn during the process.
Today we got our beading templates, and started to plan. Tomorrow and Wednesday we will be doing the beading, and then we will finish things off on Thursday, and let the glue dry over the long weekend.
It is always such an exciting time to see what our students can do creatively, and then analyse mathematically afterwards. More pictures will follow in the coming days.
Introduction to Algebra
Grade 10 applied students got their first test back today, and we started learning a new topic: algebra.
We got out the algebra tiles and remembered what we did in grade 9. We built polynomials, then added them.

We simplified using zero pairs, and worked on using vocabulary words to express what we made, and what the result is.

We’ll be solving equations next week using tiles. Hope that we’ve jogged enough memories to have a solid start on Monday. It’s so good that our grade 9 classes are using manipulatives so consistently now, so I know that my 10s will all have seen and used the tiles before. We’ve worked hard to build a solid grade 9 program which we are now spreading into grade 10. It takes work, but it is so worth it!
Correlations, and beans?
My grade 9s really wanted a “fun friday” today, so we did an activity involving everyone getting up, mixing mingling and taking off their shoes. It ended up with a nostalgic discussion that was all about beans. A memorable day for all!
The goal of the lesson was to make a scatter plot and talk about correlation, and to show how google sheets can be used to make a graph and see a trend-line and an r squared value, and then be used to make predictions.
We taped ikea rulers to the wall, then took turns being measured. We stepped on rulers and measured our foot length too. Then we made a graph to see if it’s true that you can guess someone’s height by looking at their shoe size.
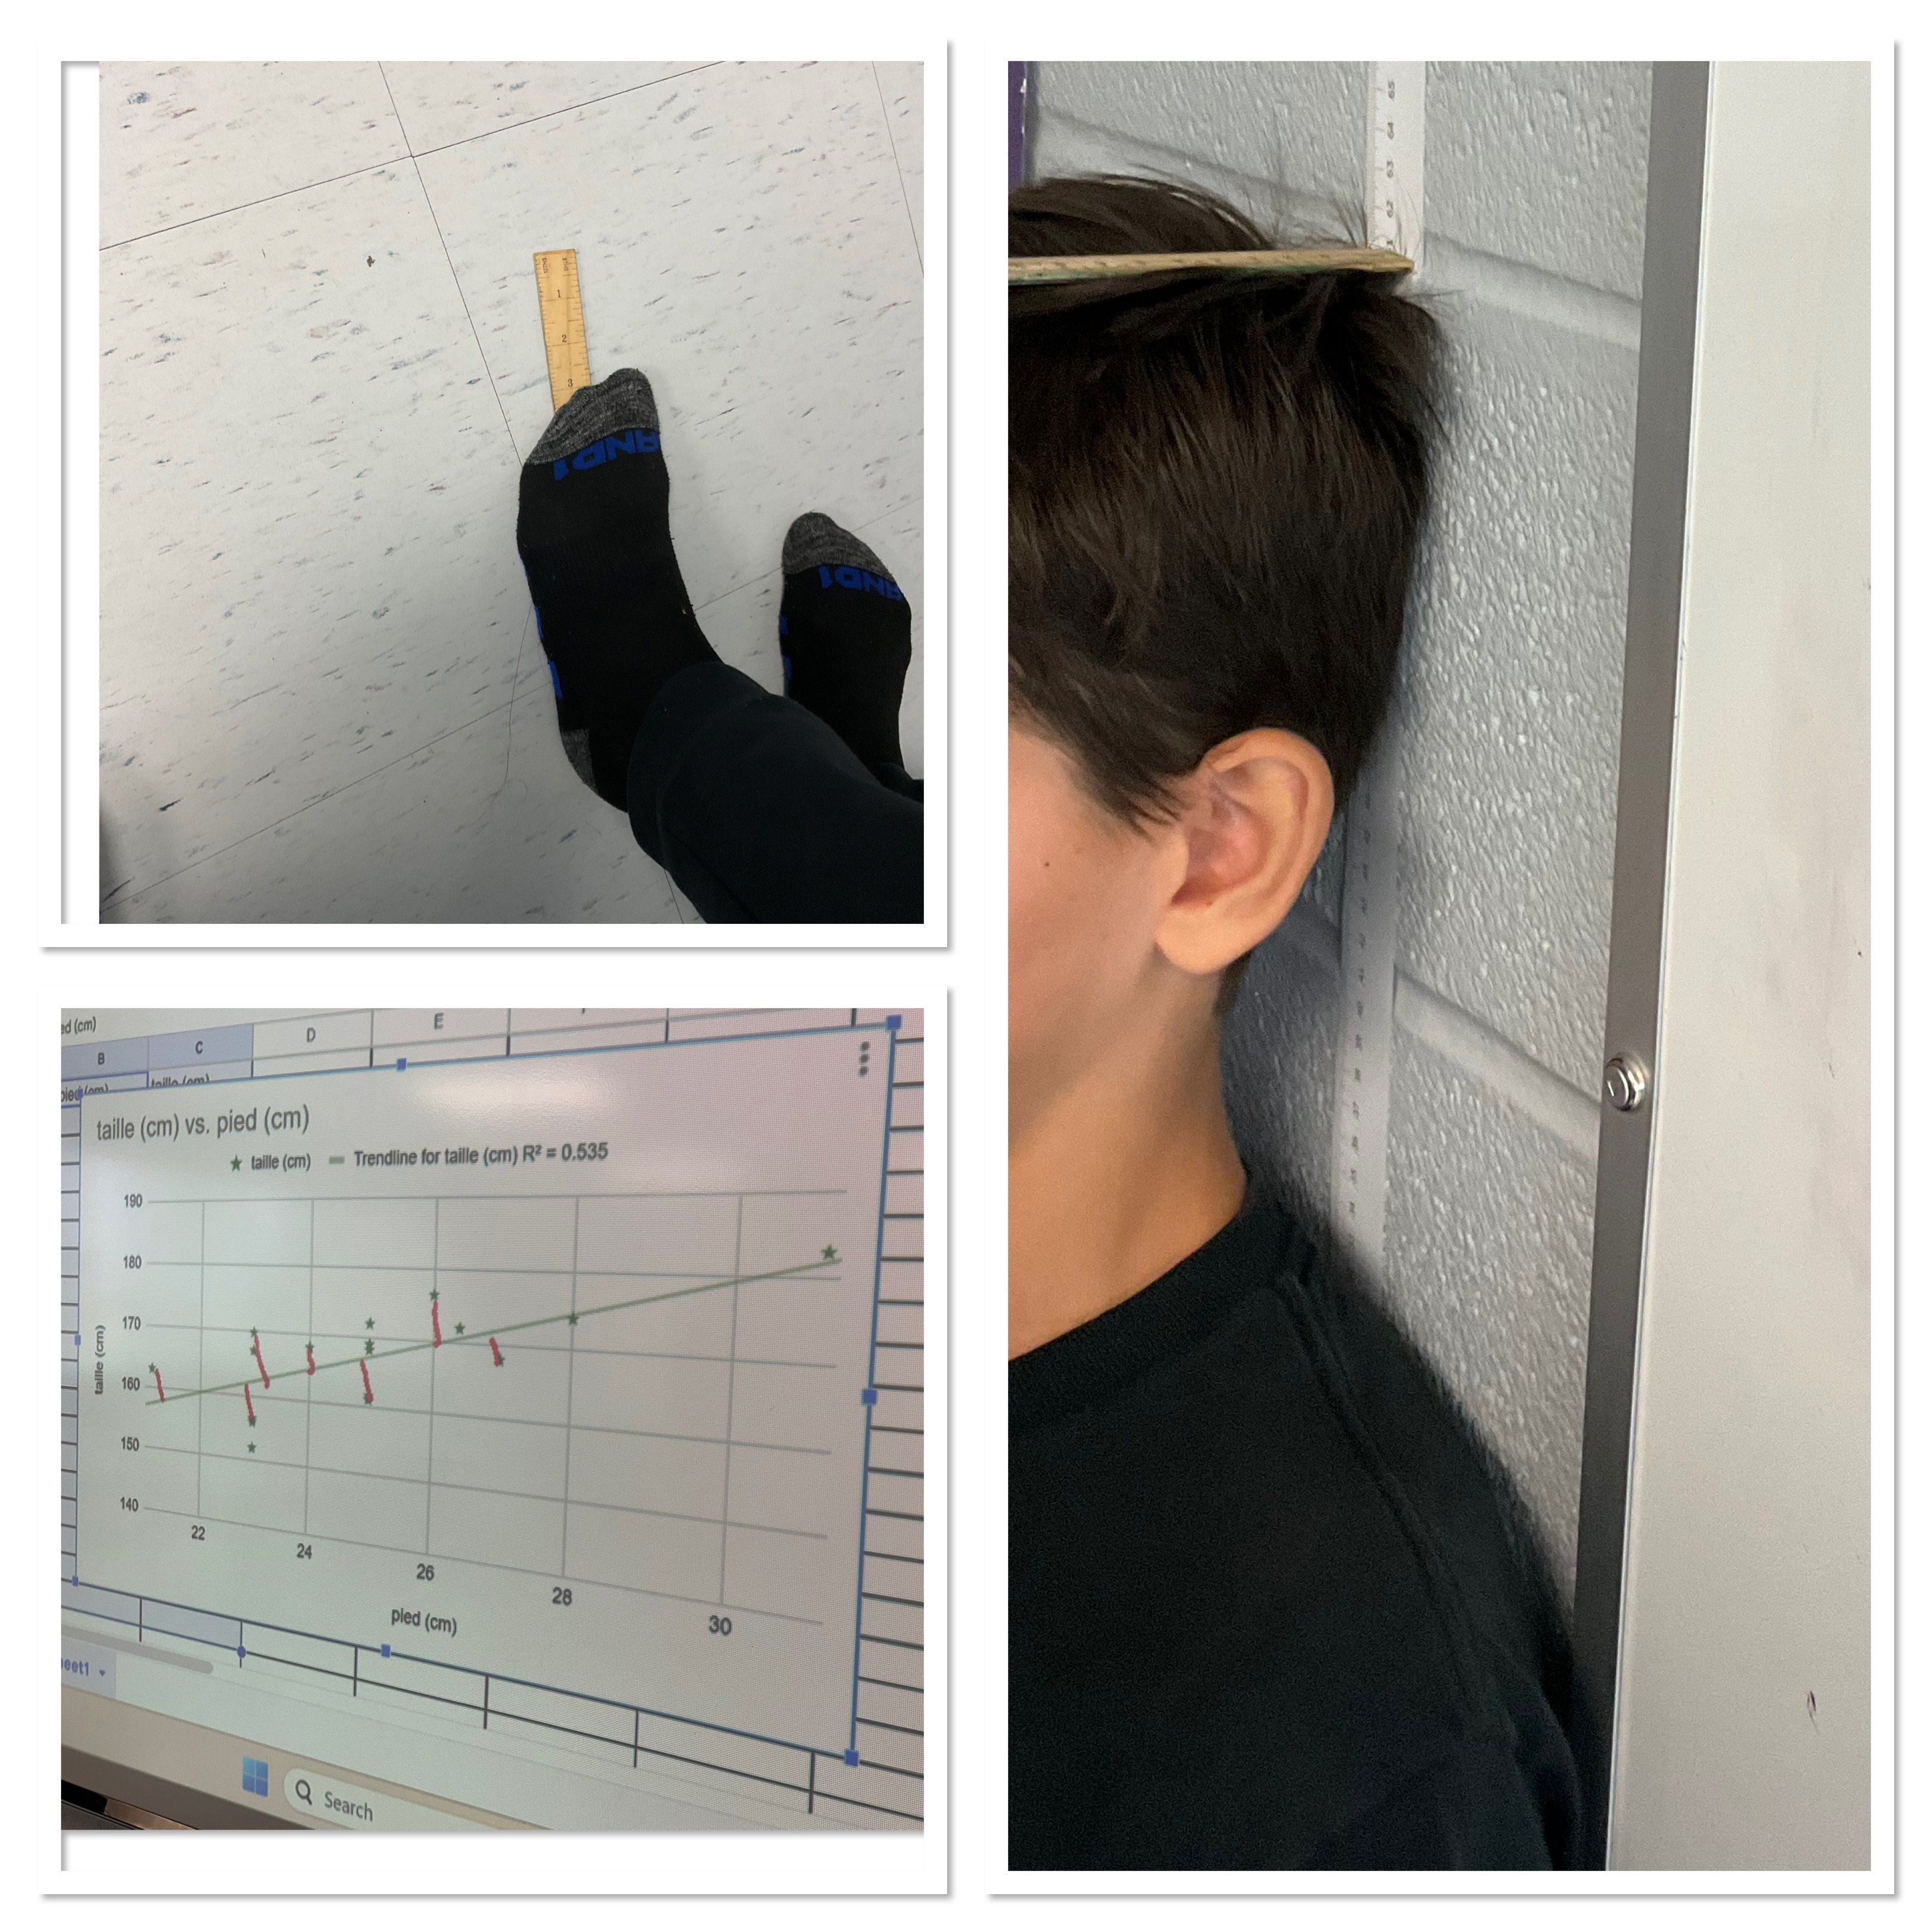
In our class the trend is pretty weak. The r squared value is 0.53, but we can see that height correlates a bit to foot length. The larger the foot the taller the person, in general, but we wouldn’t be very confident in the height of someone if we just saw a foot print.
We talked a bit about how this graph really only represents grade 9s, and with a small class, and some absences, it is not even a really good sample of the whole grade 9 population. We noted that grade 9s are in the middle of growth spurts, and that this likely does not represent what a graph of adult height and foot length would be.
We discussed vocabulary about trends (postivie/negative, strong/weak, linear/non-linear) and we made lines of best fit by hand, and with technology on google sheets. The final step was to chat about making predictions using our trend-line, and how some predictions are interpolation (inside the data) and some are extrapolation (outside the data).
I then told the class a story about when we were back at kcvi and had deep windowsills. My classes used to take advantage and grow beans on the windowsills. We’d turn it into quite a project. We used the dry beans to explore counting, and then we germinated the beans in paper towel and water in a baggie for a few days. We looked at the fraction that germinated and the fraction that rotted.
we planted the beans in small paper cups and cared for them as they sprouted above the soil. The plants were measured daily, and data tracked in a table. We grew kidney beans and black eyed peas, and compared their growth over the first week or so that they sprouted above the soil.
Next step was to graph the bean data in scatter plots, we could compare growth rates of different types of beans and make predictions from the data about the height of the bean at the end of a month of growing.
The trick is that the beans start off with quite a linear trend for the first week, with a very different growth rate between kidney beans and black eyed peas. These plants do NOT maintain their linear growth though. They are bush beans which have a maximum height. Students predicted bean plants that would be about a meter tall after a month of growing, but they maxed out at maybe 30cm.
By then though we were attached to our little bean garden, and we kept watering them and caring for them and many times the bean plants would flower, and then after the flower dropped off a baby bean was there, growing and producing new bean seeds inside.
After me doing some show and tell (search for beans on this site and there are lots of progress pictures), my students were disappointed in our sleek windowsills and wanted to grow beans. I happen to still have a bag of dried beans in the closet, so many went home today with some black eyed peas in their pocket and dreams of making a bean garden of their own. We’ll see if any are successful.
It ended up being a pretty fun Friday after all!
Solving with Relational Rods
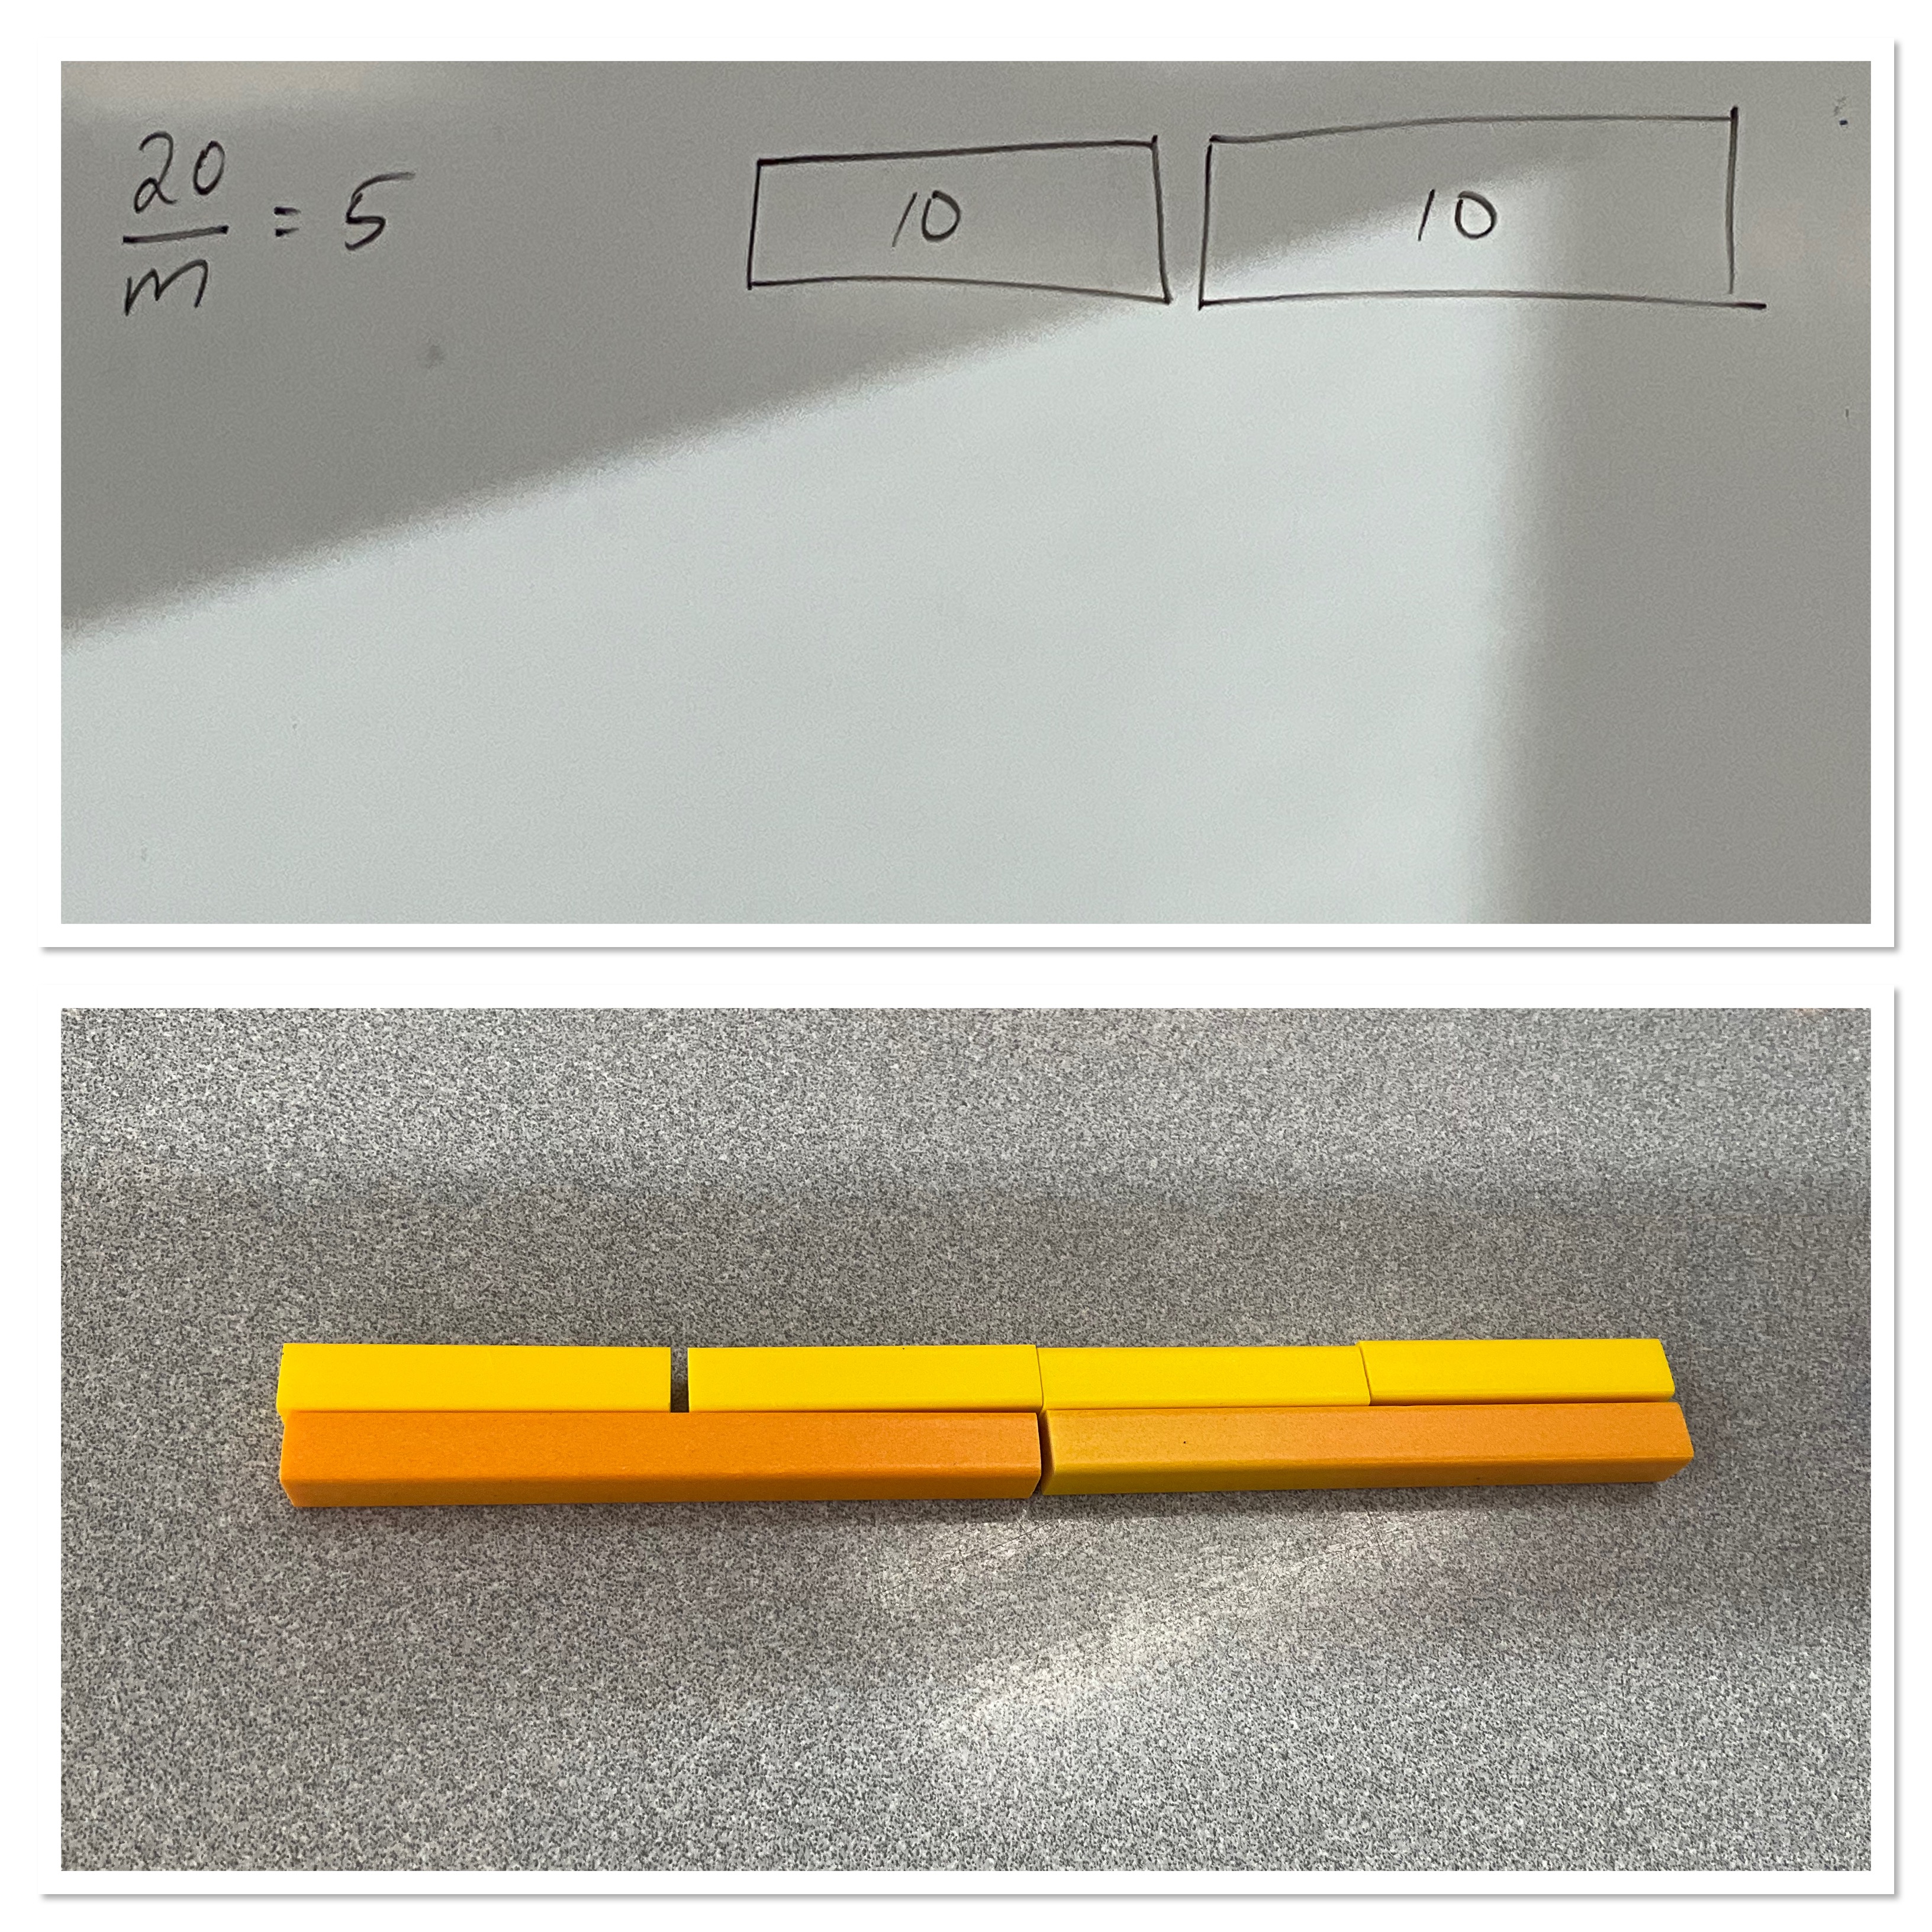
Today I was invited to see a lesson about solving equations using relational rods. This approach is new to me, and it was fun to learn alongside the students. Here we represent 20, and we know that when we split it into “m” pieces, the values of the pieces is 5. So we use 2 of the ten-rods to build 20, and we see that we need to split it up into groups of 5 (the light yellow is the 5 rod). There will be 4 groups, so m is 4.
Here’s another question: 4 groups of something equals 8. We know that the 8 rod is brown. We can use trial and error to find out what rods equal 8 when we use 4 of the same. The red rod works, and has a value of 2.

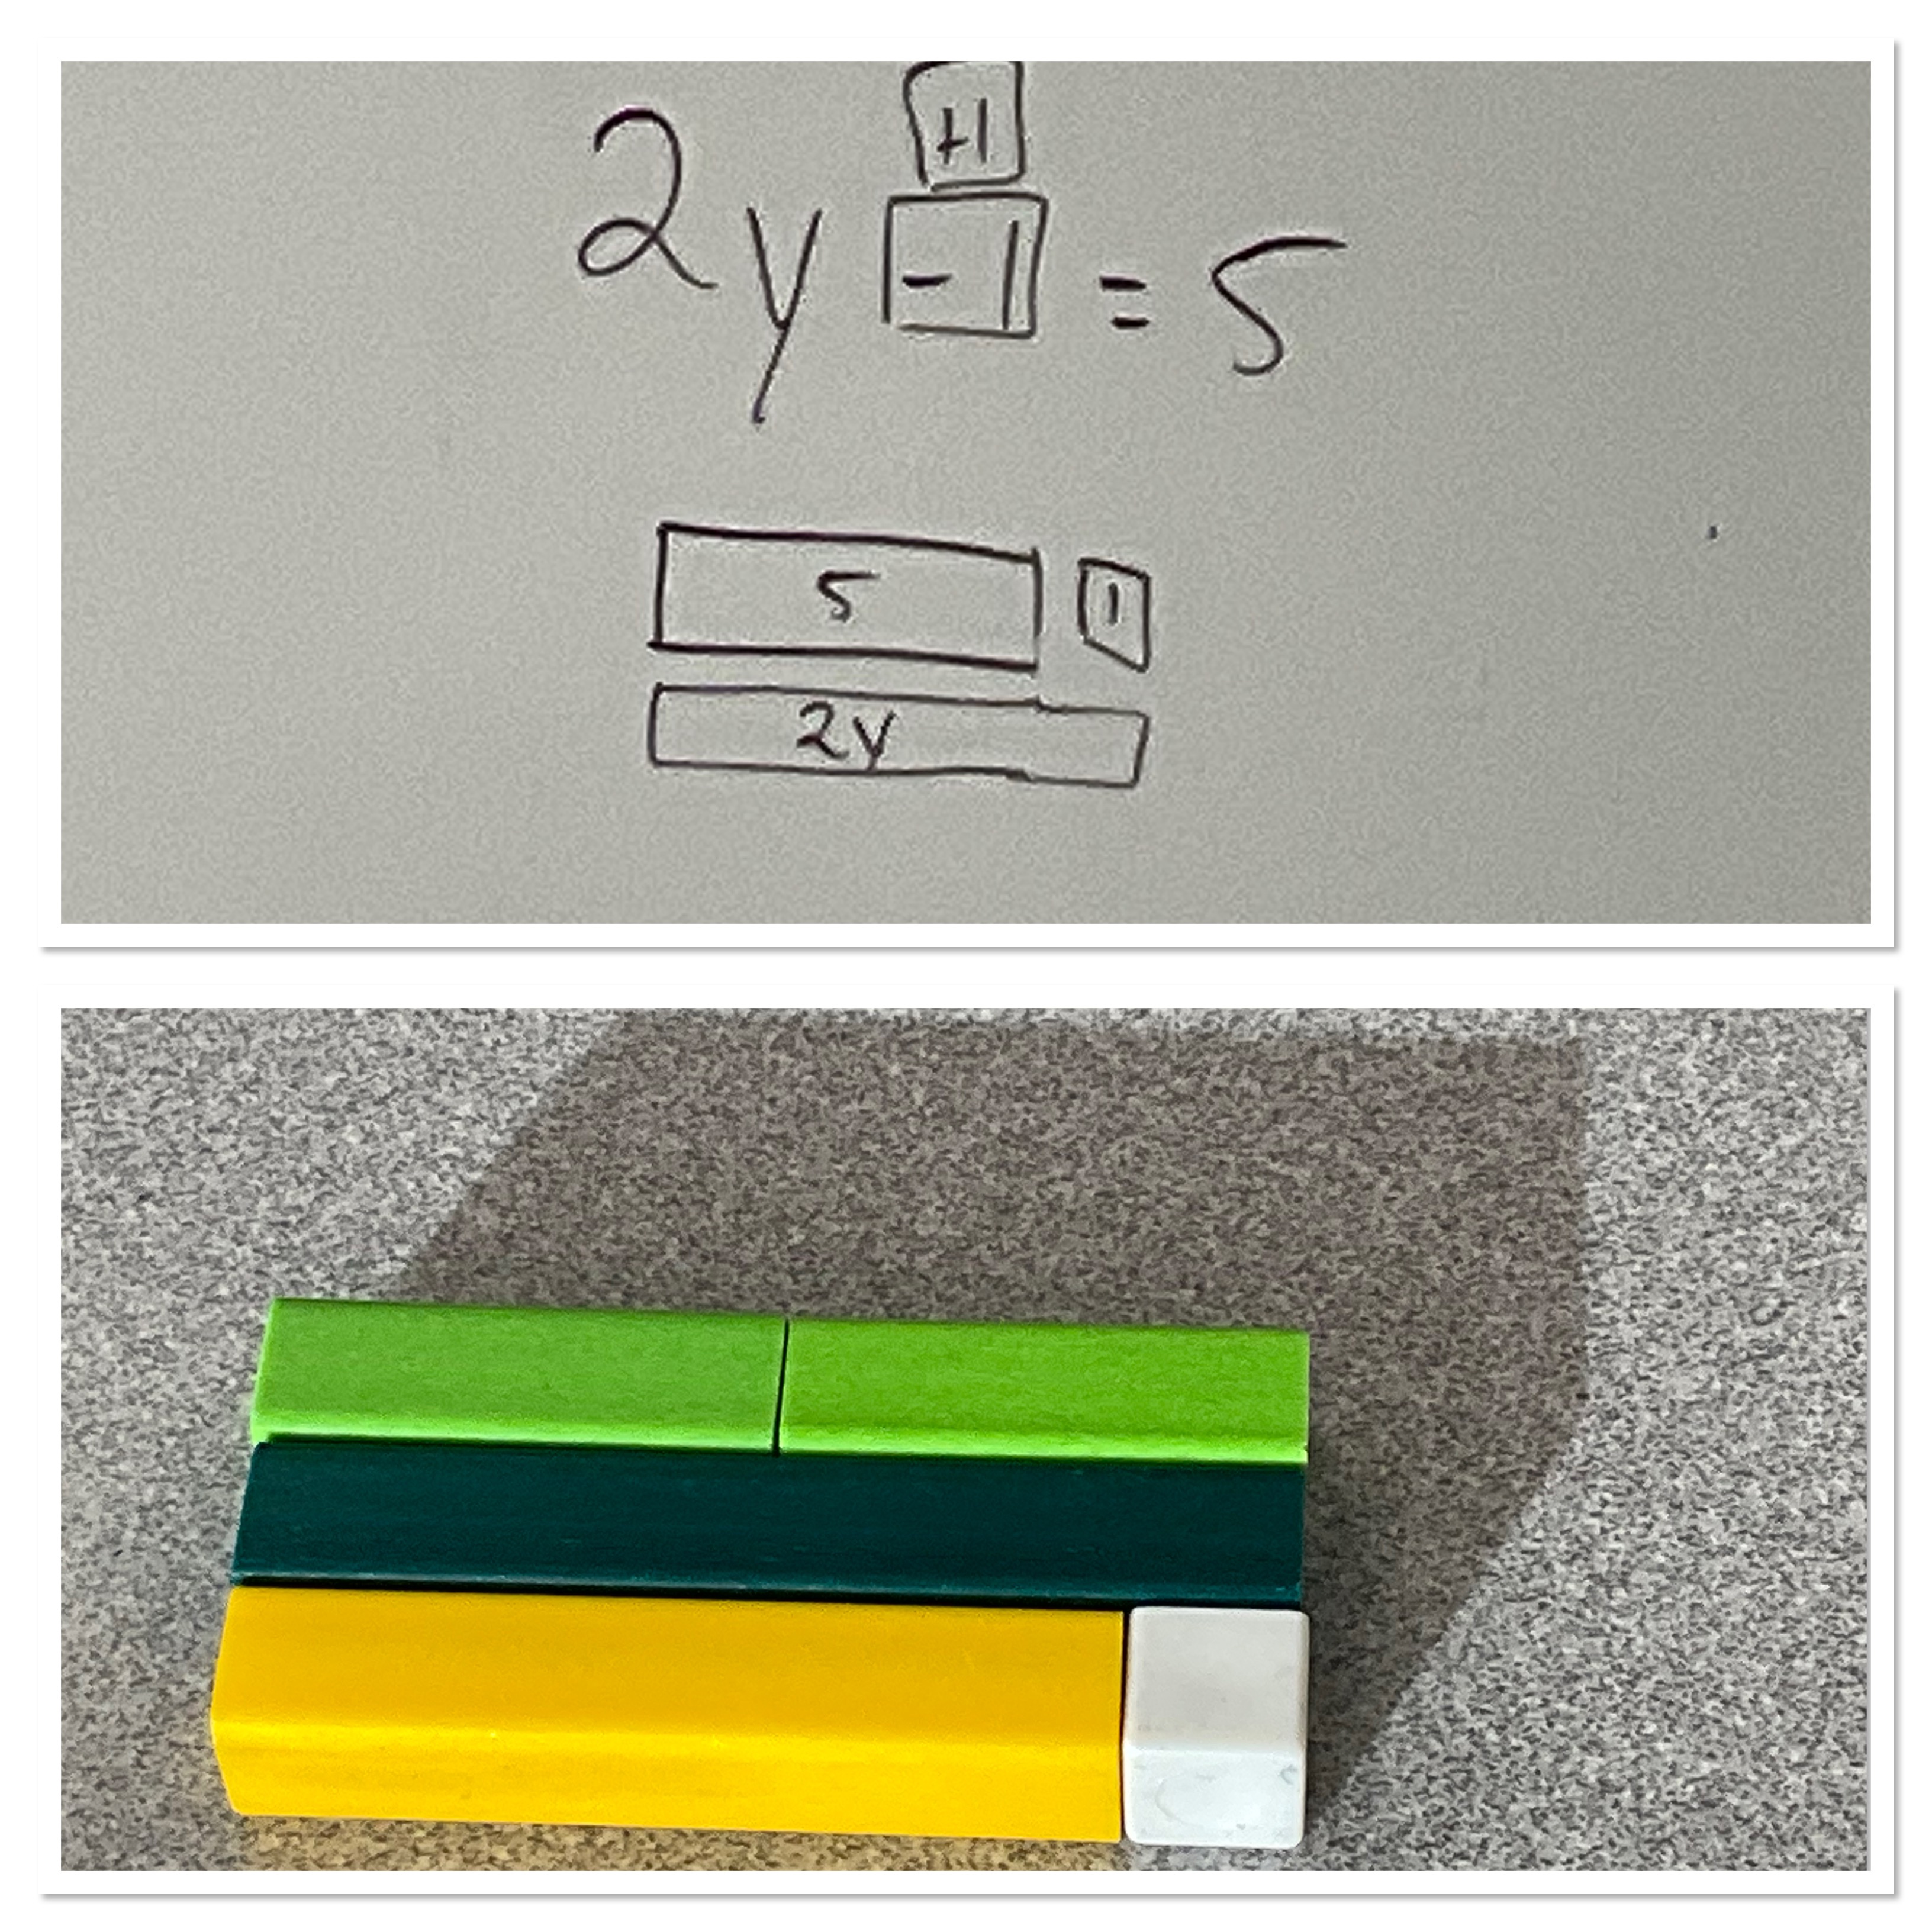
Here’s a more complicated one. 2 groups of something, minus 1, is equal to 5. That means 2 groups of something is one bigger than 5. 2 groups of something is equal to 6. The 5 rod (yellow) plus 1 (white) is equal to 6 (dark green). If we need to find a rod that can fit 2 into the space of the dark green, it’s the light green one, which is 3.
Here’s another: 2 groups of something, plus 6 equals 14. We build 14 from a 10 rod and 4 one rods (lots of other options we could have done). We know that 6 is a dark green. I need to now fill on the empty gap with 2 equal blocks. We can use the purple which is 4. Z=4

Here’s one last one, that was interesting….there were 2 ways to solve. The first way involved building 27. We used 2 ten rods and a seven rod. Then we used a 9 rod (blue) and had to fill on the gap with 2 equal sized pieces. Those pieces happen to also be 9s. We know a=9.
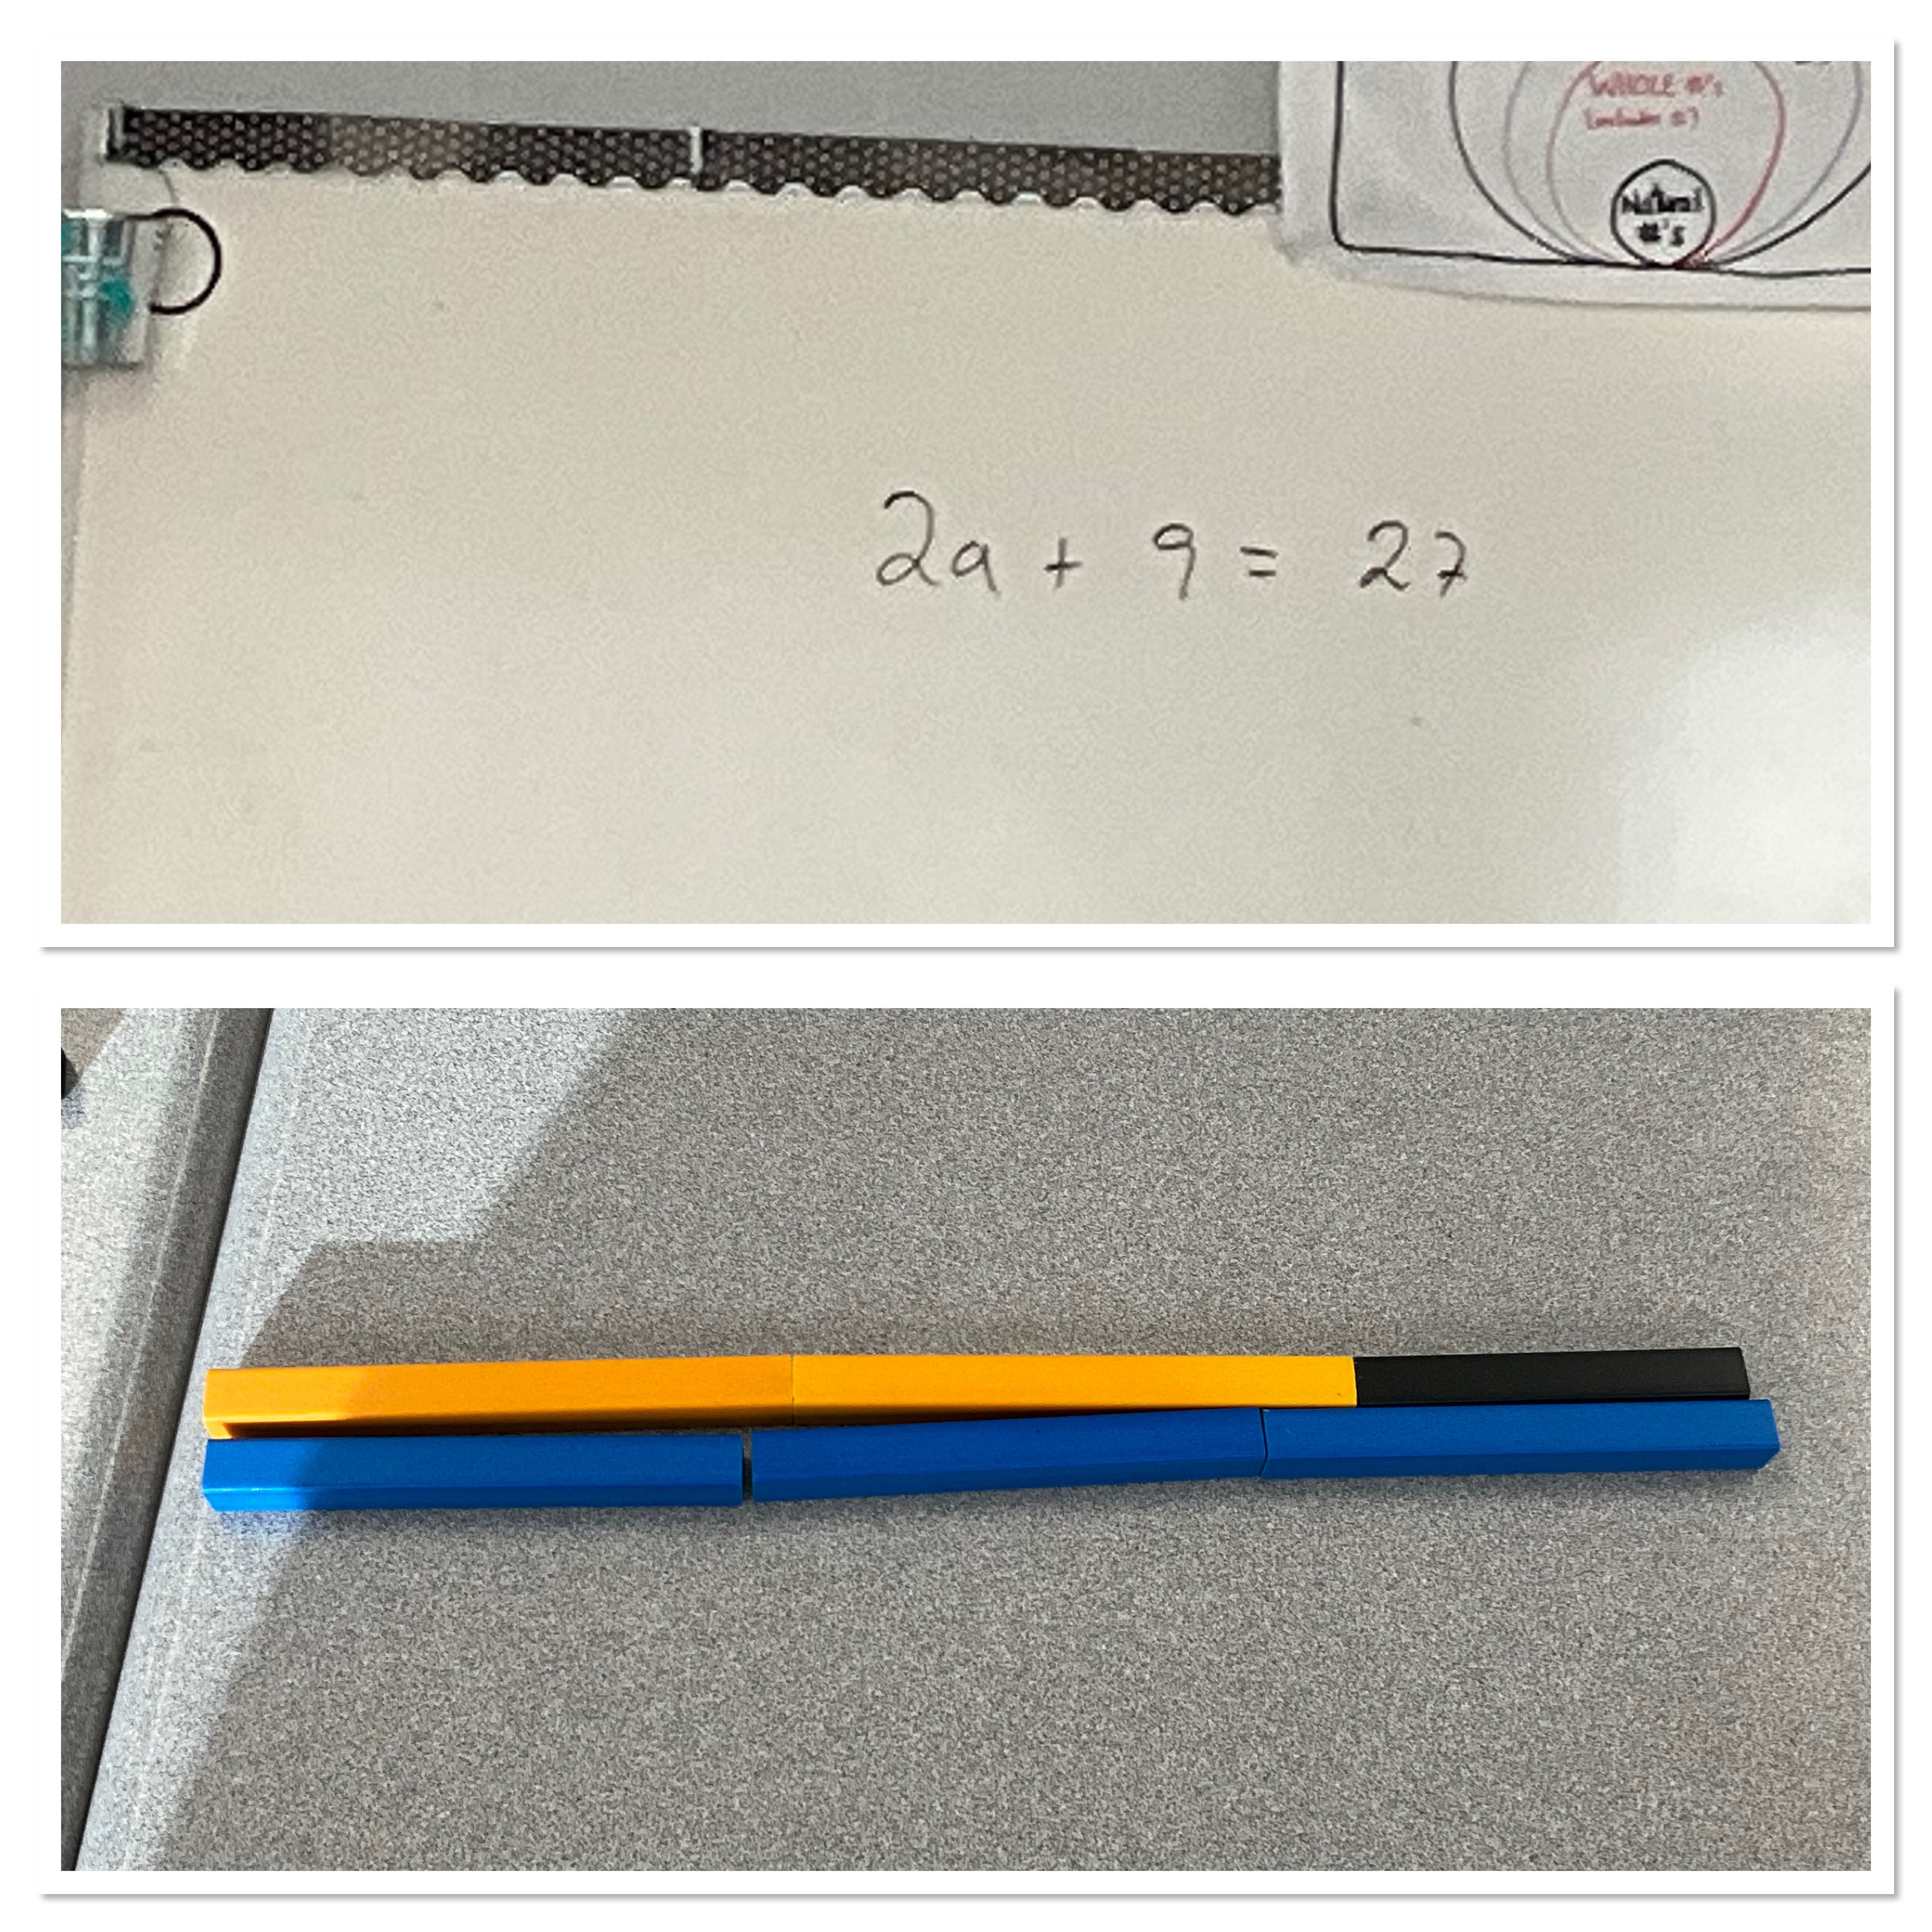
If we had built the 27 in a different way, we can see another property. We can build 27 as 3 nine rods (blue). Then we can build the 2a+9, so we put a 9 on top. We can see that on the top and bottom we have 9s, so those 9s are not needed…and can be eliminated. Now we just need to find 2 pieces that are equal to 18 total, which we can easily see are 9 and 9.

We followed this up with a bit of practice using algebra tiles to solve equations as well. It was a great learning experience for me.
Would you Rather?
Today in my MFM2P class we did some work on being a good group member. We talked about what we do when working with a partner. We share the marker and both contribute. We use clean language that is encouraging, respectful and positive. We ask good questions and learn from each other. We write our thinking so other groups can learn from us, and we listen with our ears AND our brain.
We did some review of graphing lines, to close some gaps made visible on yesterday’s test. We worked on graphing y=2x+4, y=2x+6, y=2x, and y=-2x+3. Then we looked for intersection points.
We noticed what makes lines parallel, and what positive and negative slopes look like, and what the constant in the equation means.
The next challenge we had was a would you rather challenge.
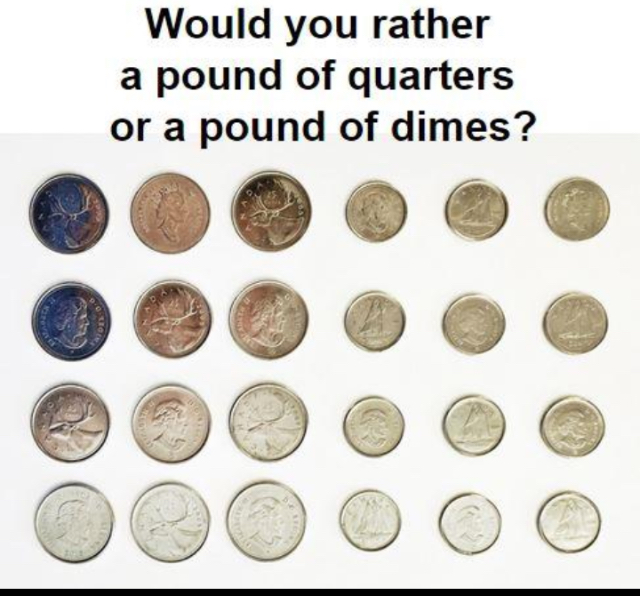
I had never tried this question before. It was a good chance to talk about what a pound is, what quarters and dimes are, and what information we’d need to solve the problem.
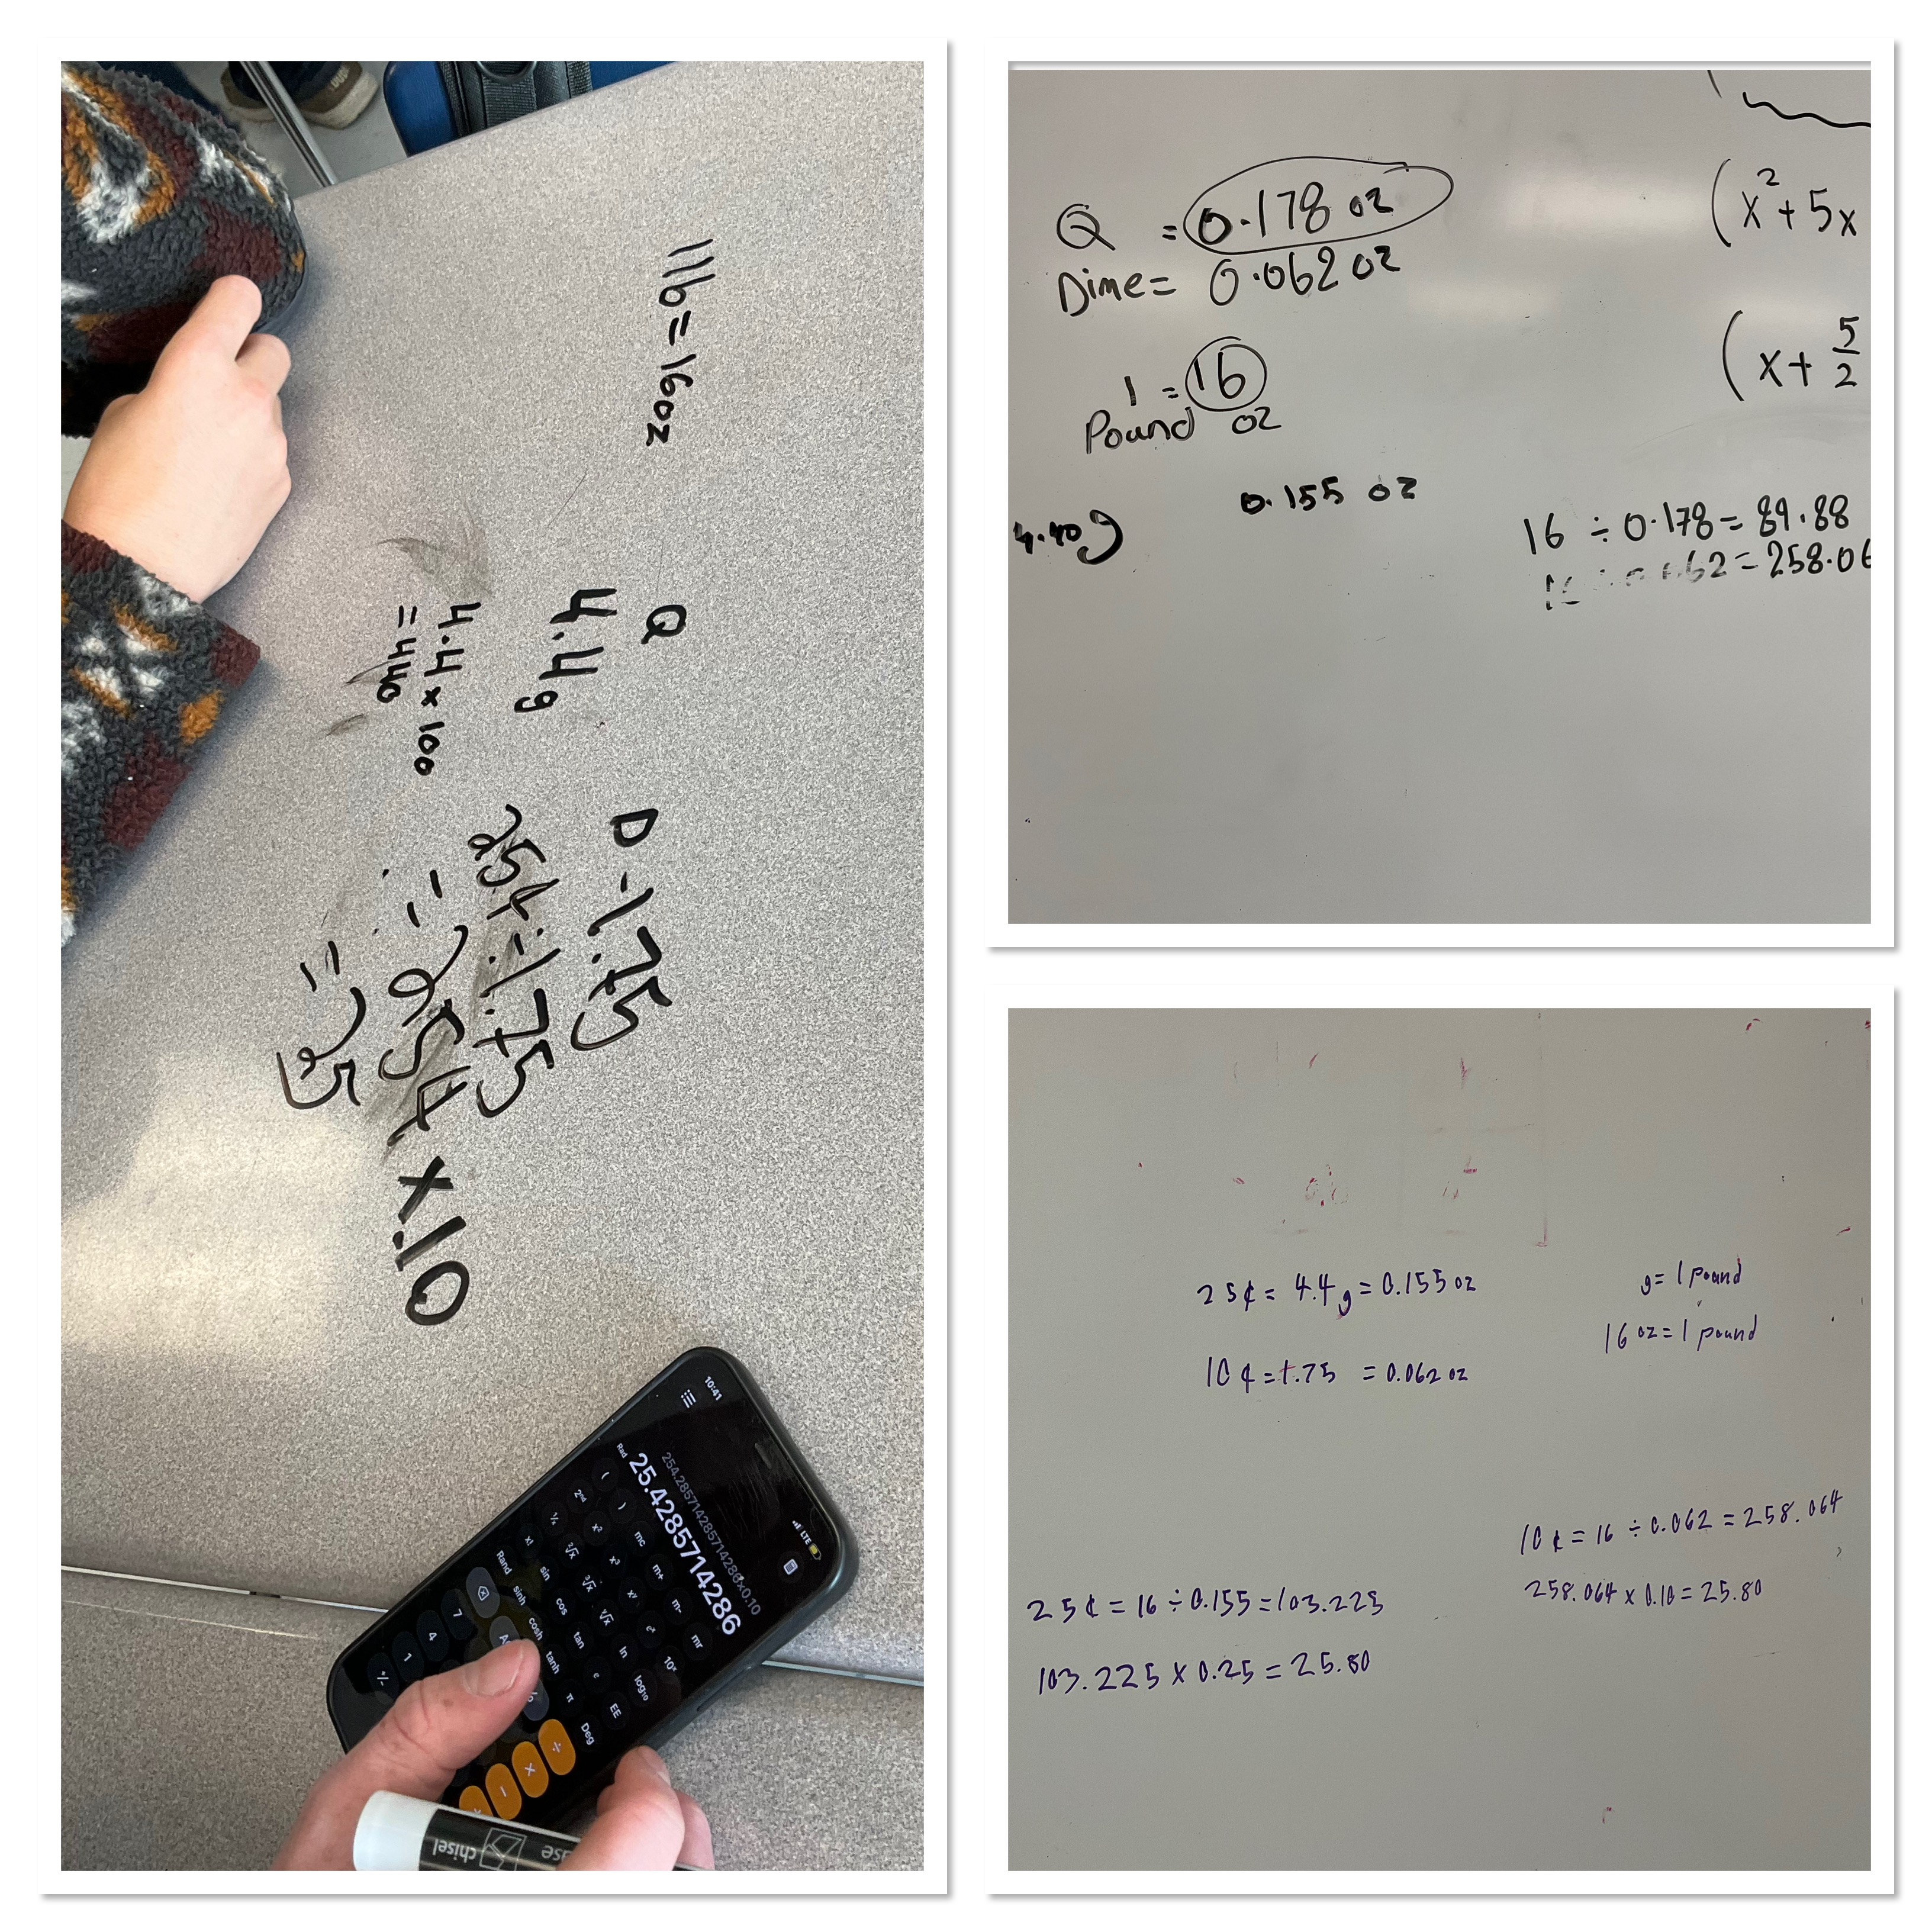
Students dove into the problem solving once we looked up the weight of a quarter and a dime is in ounces, and what a pound is in ounces. This task uses unit conversion and proportional reasoning. It’s fun to see how groups worked together to tackle the problem.
Spoiler: the value is about $25 in either case, which is pretty cool! We decided having that in quarters would be easier to manage.
There are lots of sites with would you rather questions prepared already, a quick google search can help you find your next mathematical challenge.
It was a good day with lots of teamwork, positive language, and participation. I hope we continue with this energy moving forward.
Solving with Algebra Tiles
My grade 9 class this week has been working on solving equations. We used algebra tiles to help us visualize what we are doing, and to help us choose our next steps. Here are some examples of the process.
We represented each side of the equation, and drew a line where the equal sign is. We know that both sides are equal. Our goal is to get the variable tile alone on one side. We can do that a few different ways. Here we decided to create zero pairs for the +2 which is on the same side as the x. This will annihilate the +2, and we will have the x alone.
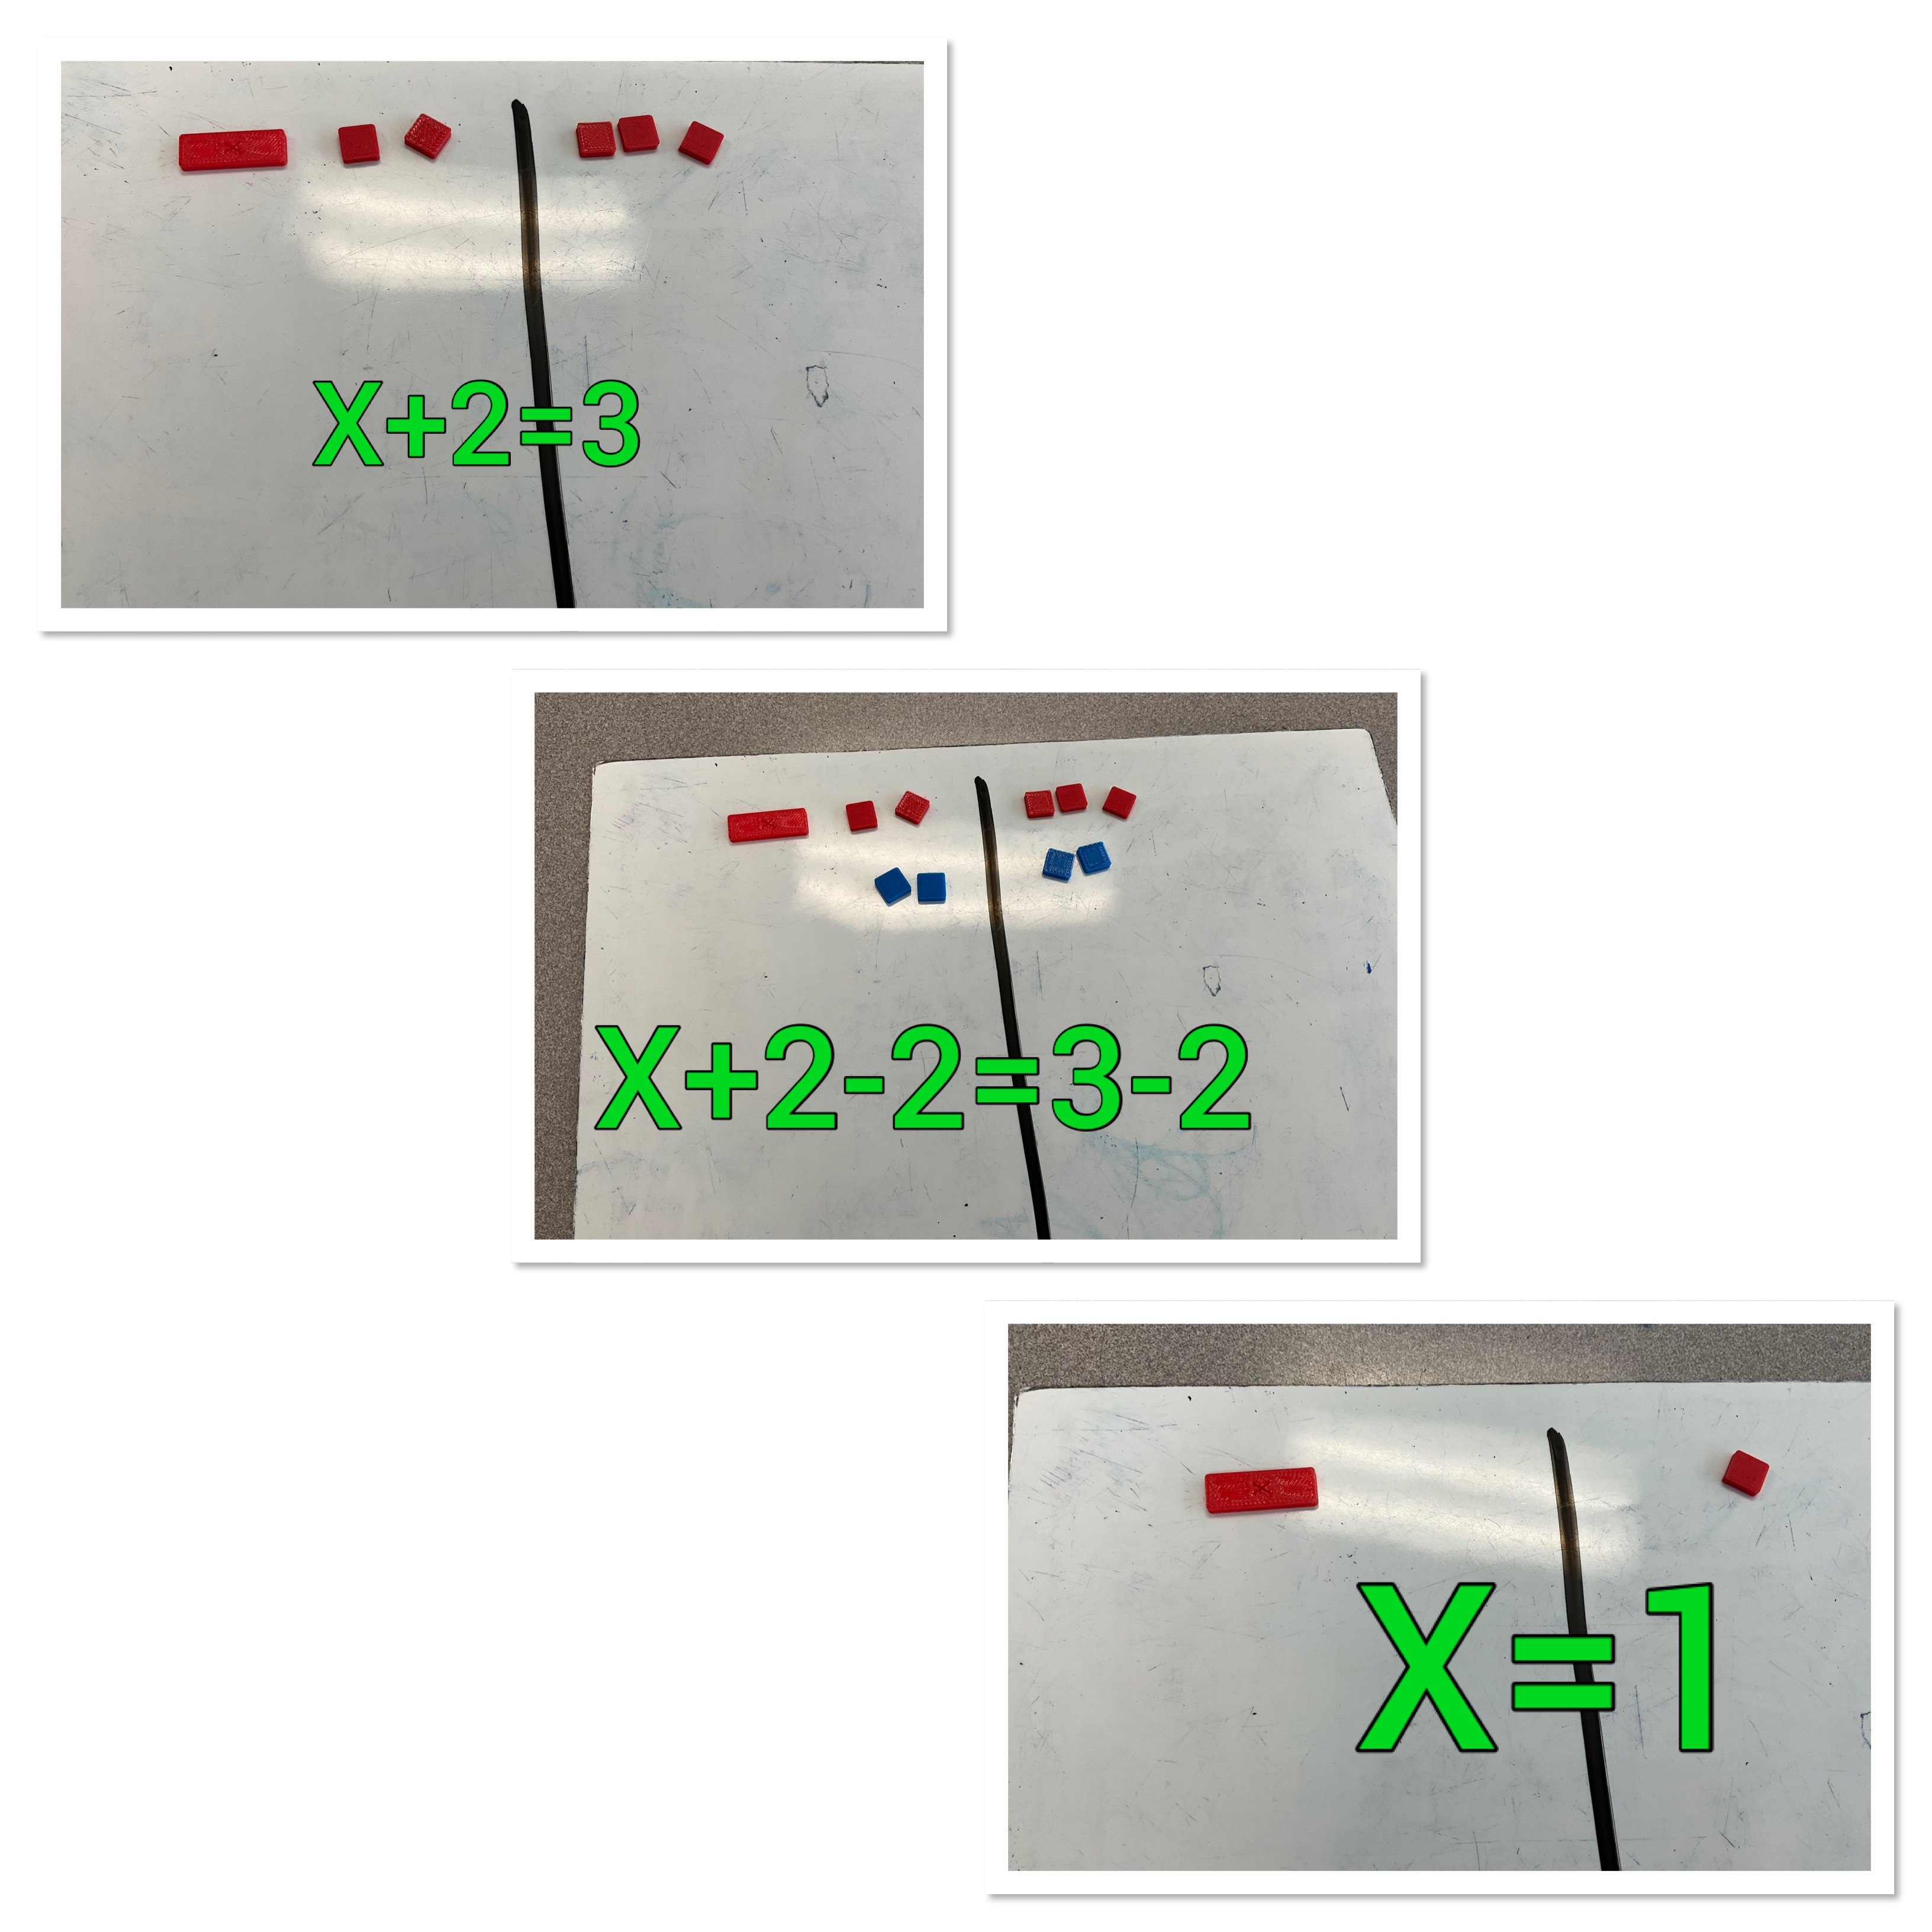
We have to do the same on both sides to keep the equation equal.
Here’s another example. We have variables on both sides here, which we are not thrilled about. To annihilate the -x on the right side, we place a +x to create a zero pair. We must place +x on the left as well to keep things equal. Next we place +3 on both sides which will create a zero pair with the -3 which is on the same side as the x term.

We end up with 3x=8. The next step is to split the 3x into 3 groups. We want each x to have its own group. We split the 8 up into 3 groups too. This is tricky since it doesn’t divide equally. We will have 2, and then we need to cut each of the little blocks remaining into thirds. Each group will get 1/3 of each remaining block. Wr end up with 2 and 2/3 as our answer for x.
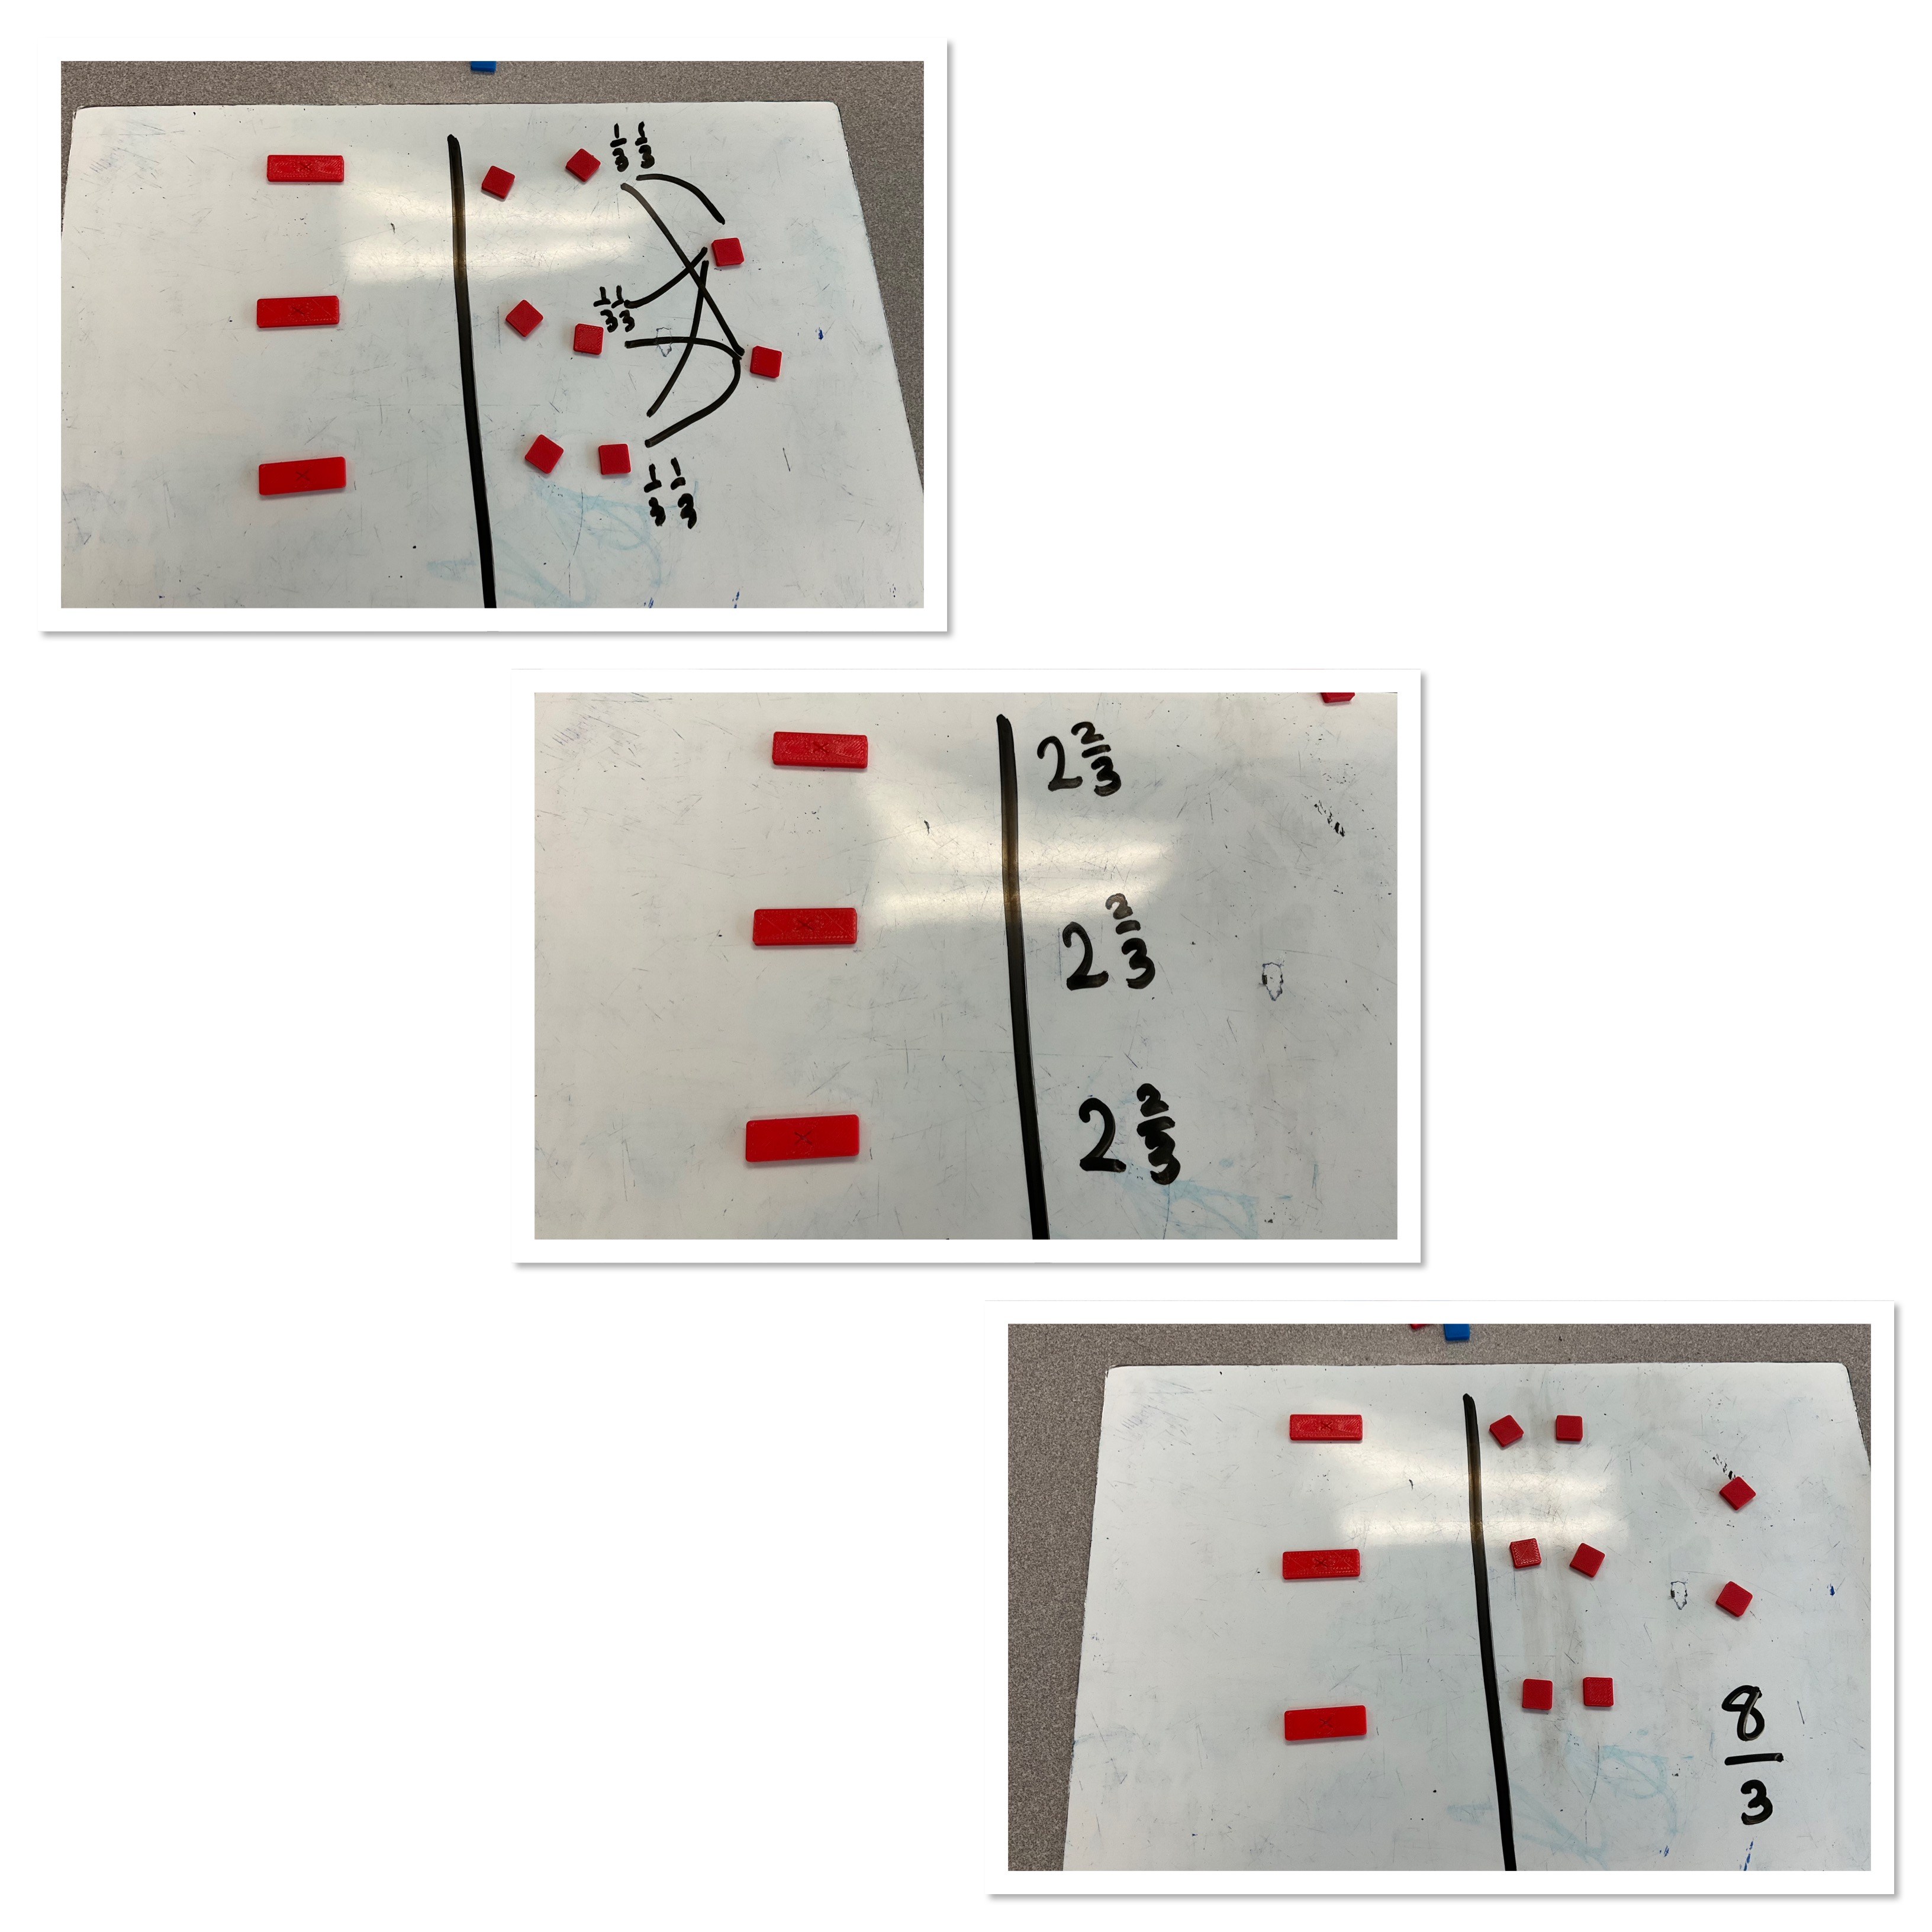
Another way to visualize this is to say that we have 8 blocks that we want to divide into 3 groups, and we represent x as the fraction 8/3, which is equivalent to 2 and 2/3.
We have worked on representing and solving lots of equations. Some students will use the tiles for quite a while. Others can make the connection to an algebraic representation, but the understanding remains that we use zero pairs and opposite operations to isolate x. Using the tiles helps us remember what our like terms are, and we physically see both sides all the time, and we know we must keep them equal by doing the same thing on both sides each time.
