Welcome to Grade 11
Today was the start of semester 2, and we hit the ground running in grade 11. We’re sitting in random groups, and working at the walls in smaller random groups.
Today the goal was to review grade 9 and 10 math. We did some work on fractions, prime factoring, patterning and modelling relations with tables, equations and graphs. We saw the very first function notation to calculate figure 10, or f(10) for each equation. We also practiced adding and subtracting polynomials, and solving equations with and without fractions.
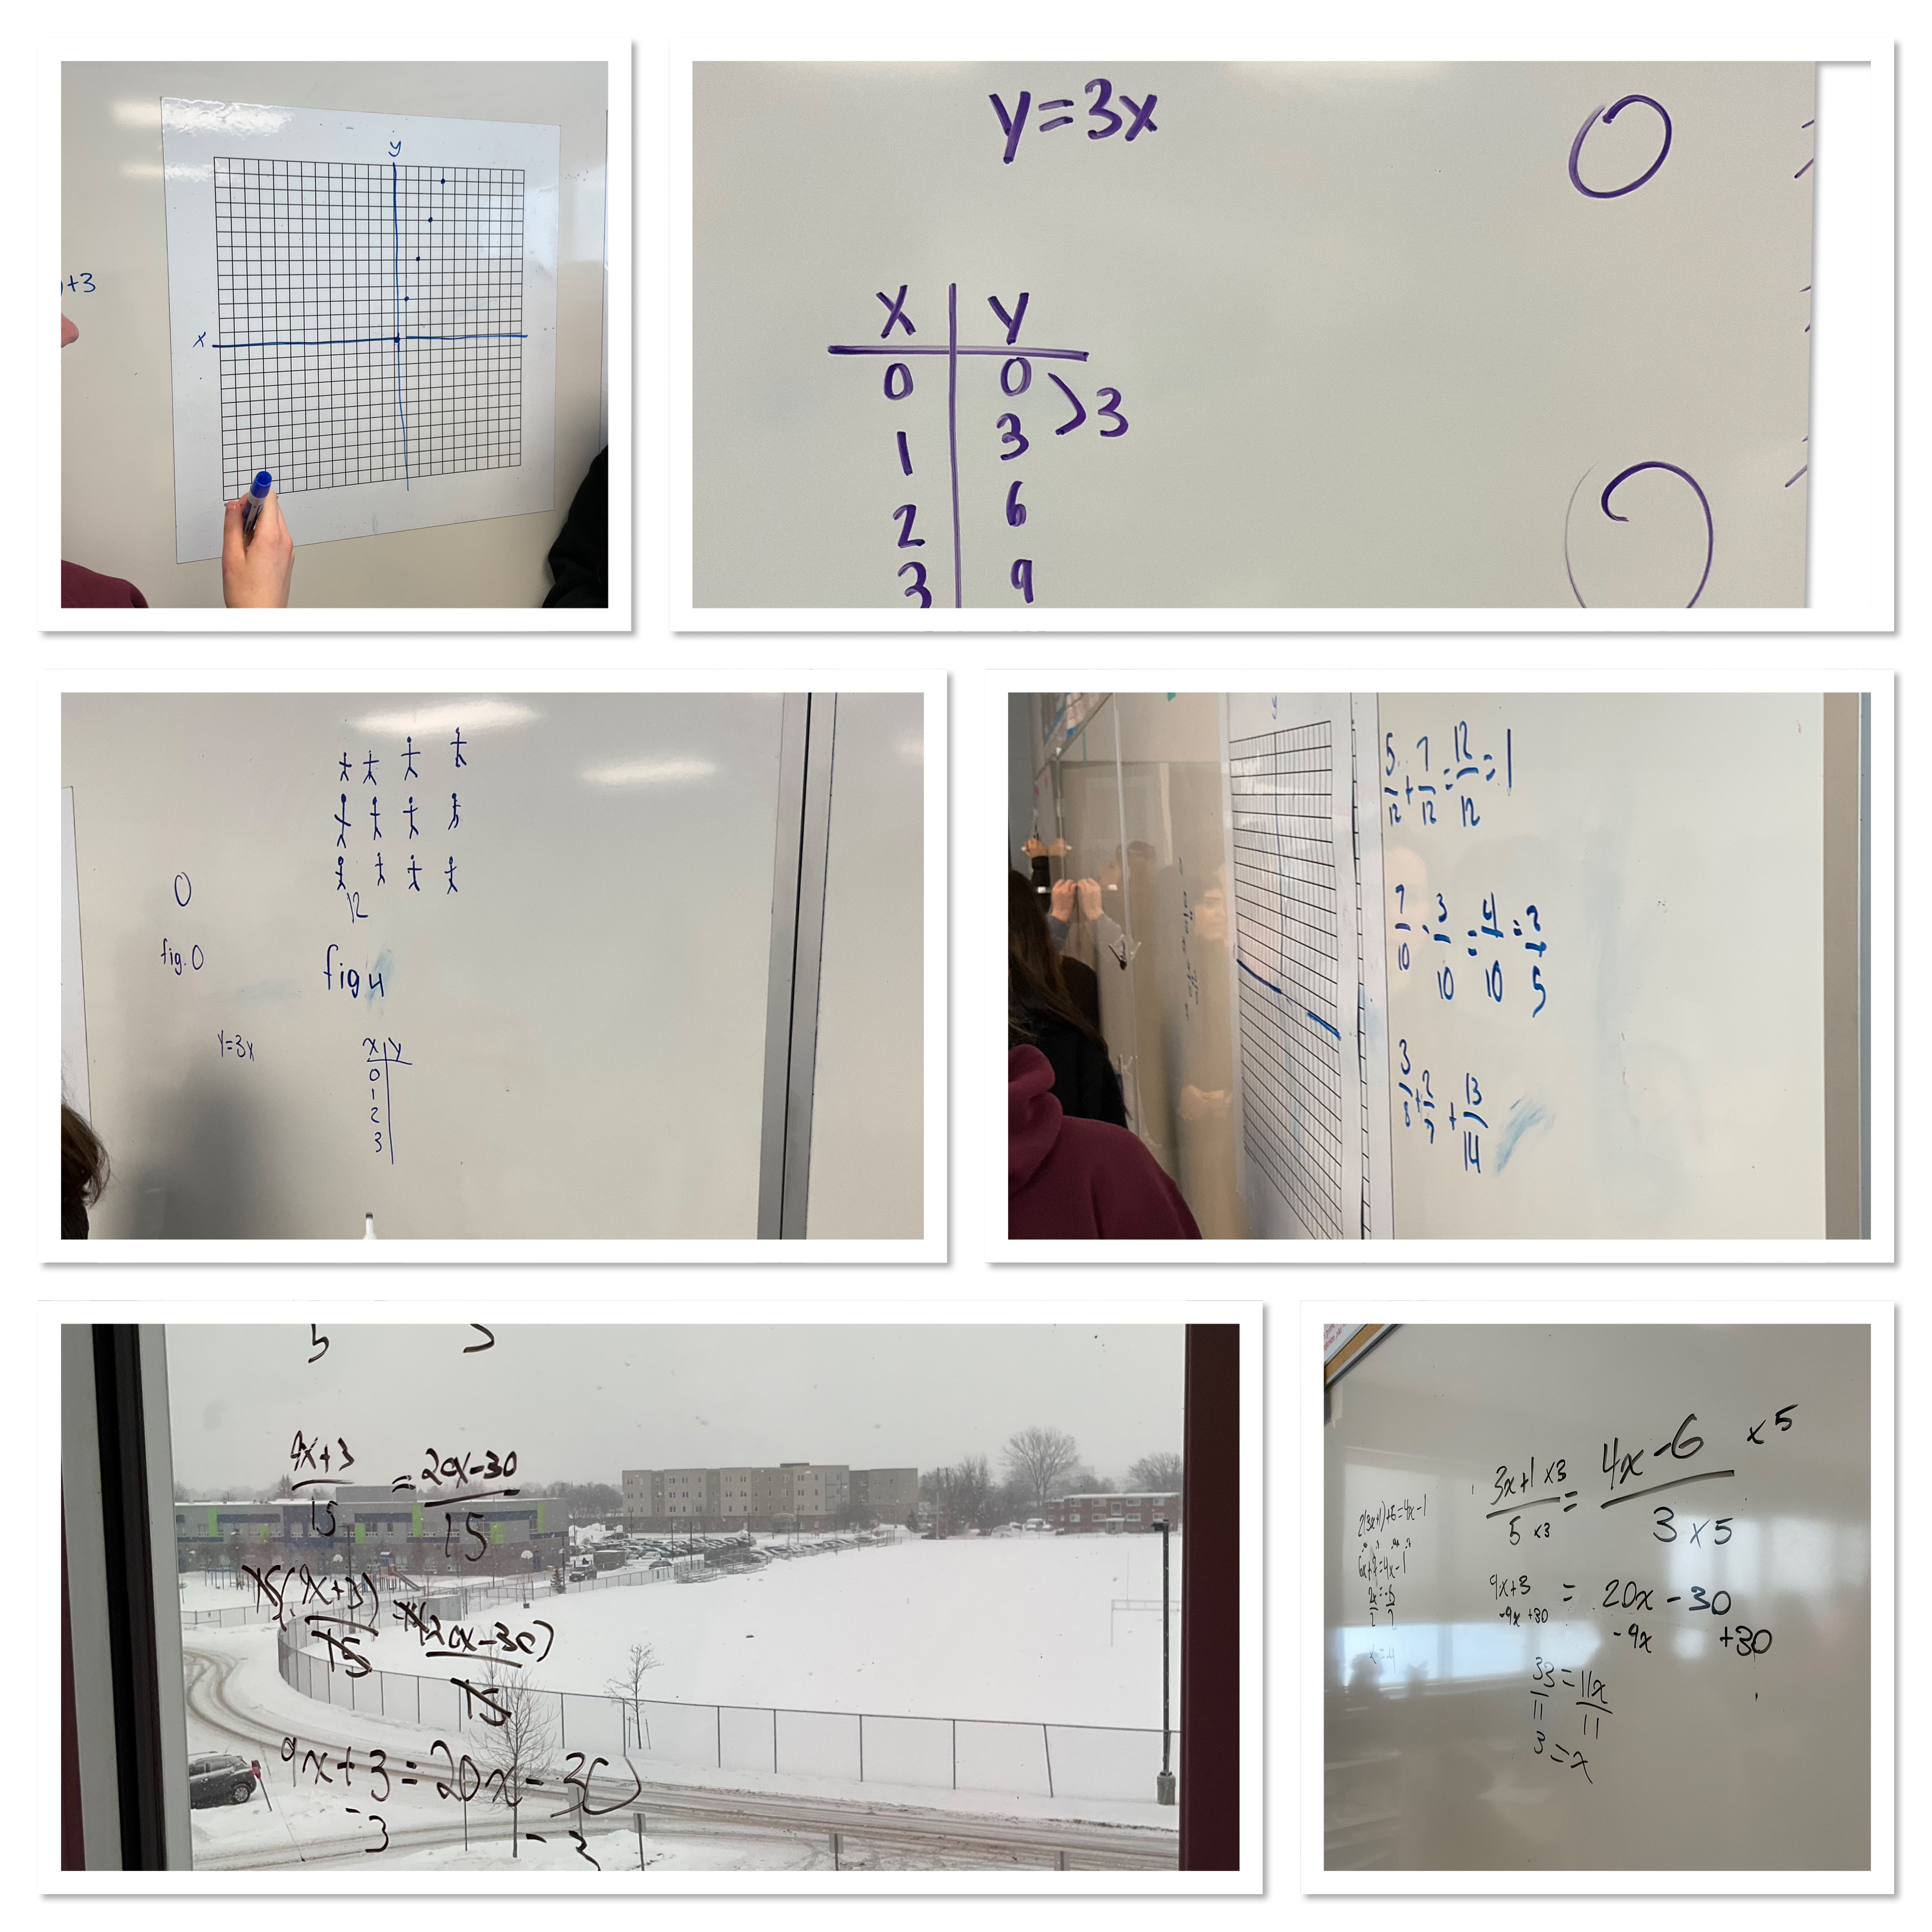
We have such a big class we’re working on walls AND windows! It was an impressive start to the term, shaking off the cobwebs and working on our collaboration. Looking forward to a great semester together.
Pathways P.D.
A colleague joined me to do a math professional development session at Pathways to Education for their staff and volunteers.
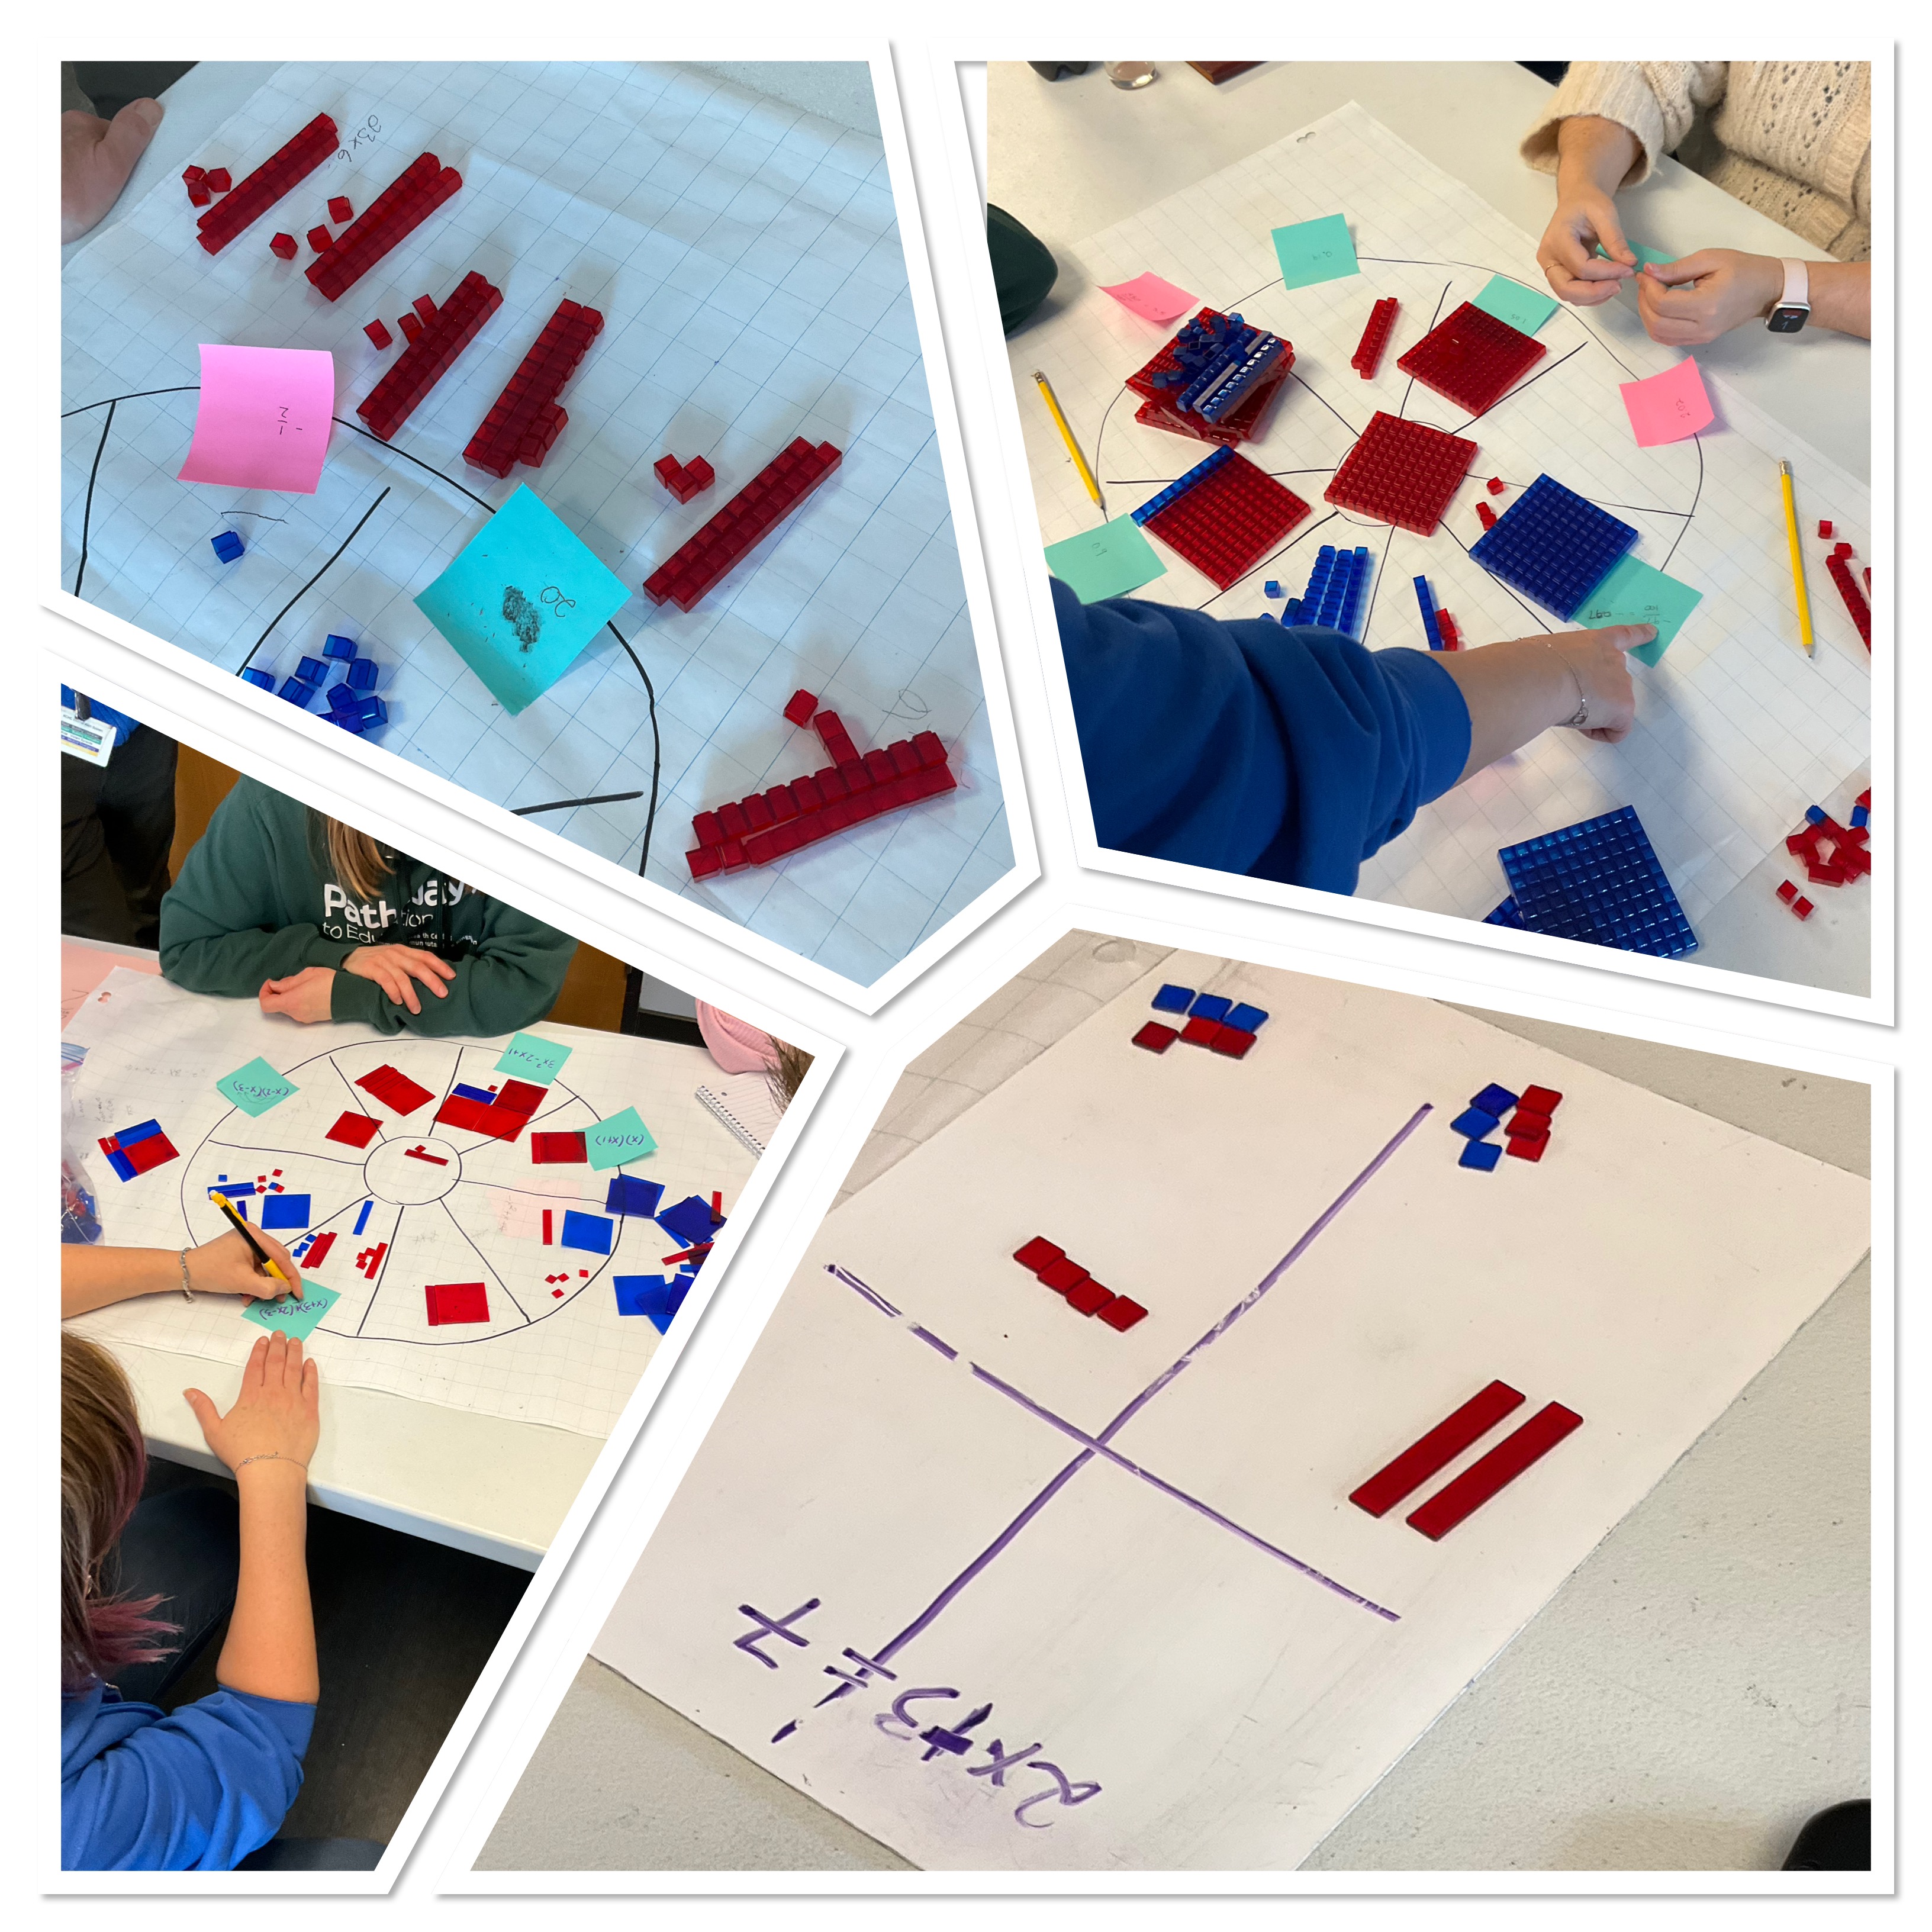
We used concept circles to explore base 10 blocks and saw how to use them to practice place value and integers.
We worked on multiplication, like 6×23 and how to represent that as 6 groups of 23 (an additive approach) and also how those 6 groups can be made into a rectangle with length 23 and width 6. The area is the product. We can then visually split up the area model into 6×20=120 and 6×3=18 so 6×23=138.
We looked at algebra tiles and how we can represent multiplication with the area model using tiles, and also how to simplify and add polynomials. Finally we used tiles to solve equations.
I hope we’ll do more sessions over the term to build on these skills.
Sphere Day!
Today we calculated the surface area and the volume of spheres.
We explored the volume with a displacement tank. A tennis ball just happens to fit perfectly in a juice concentrate can, so I made a cylinder that is perfectly suited for the tennis ball by cutting the cylinder down so the height of the can is the same as the height of the ball.
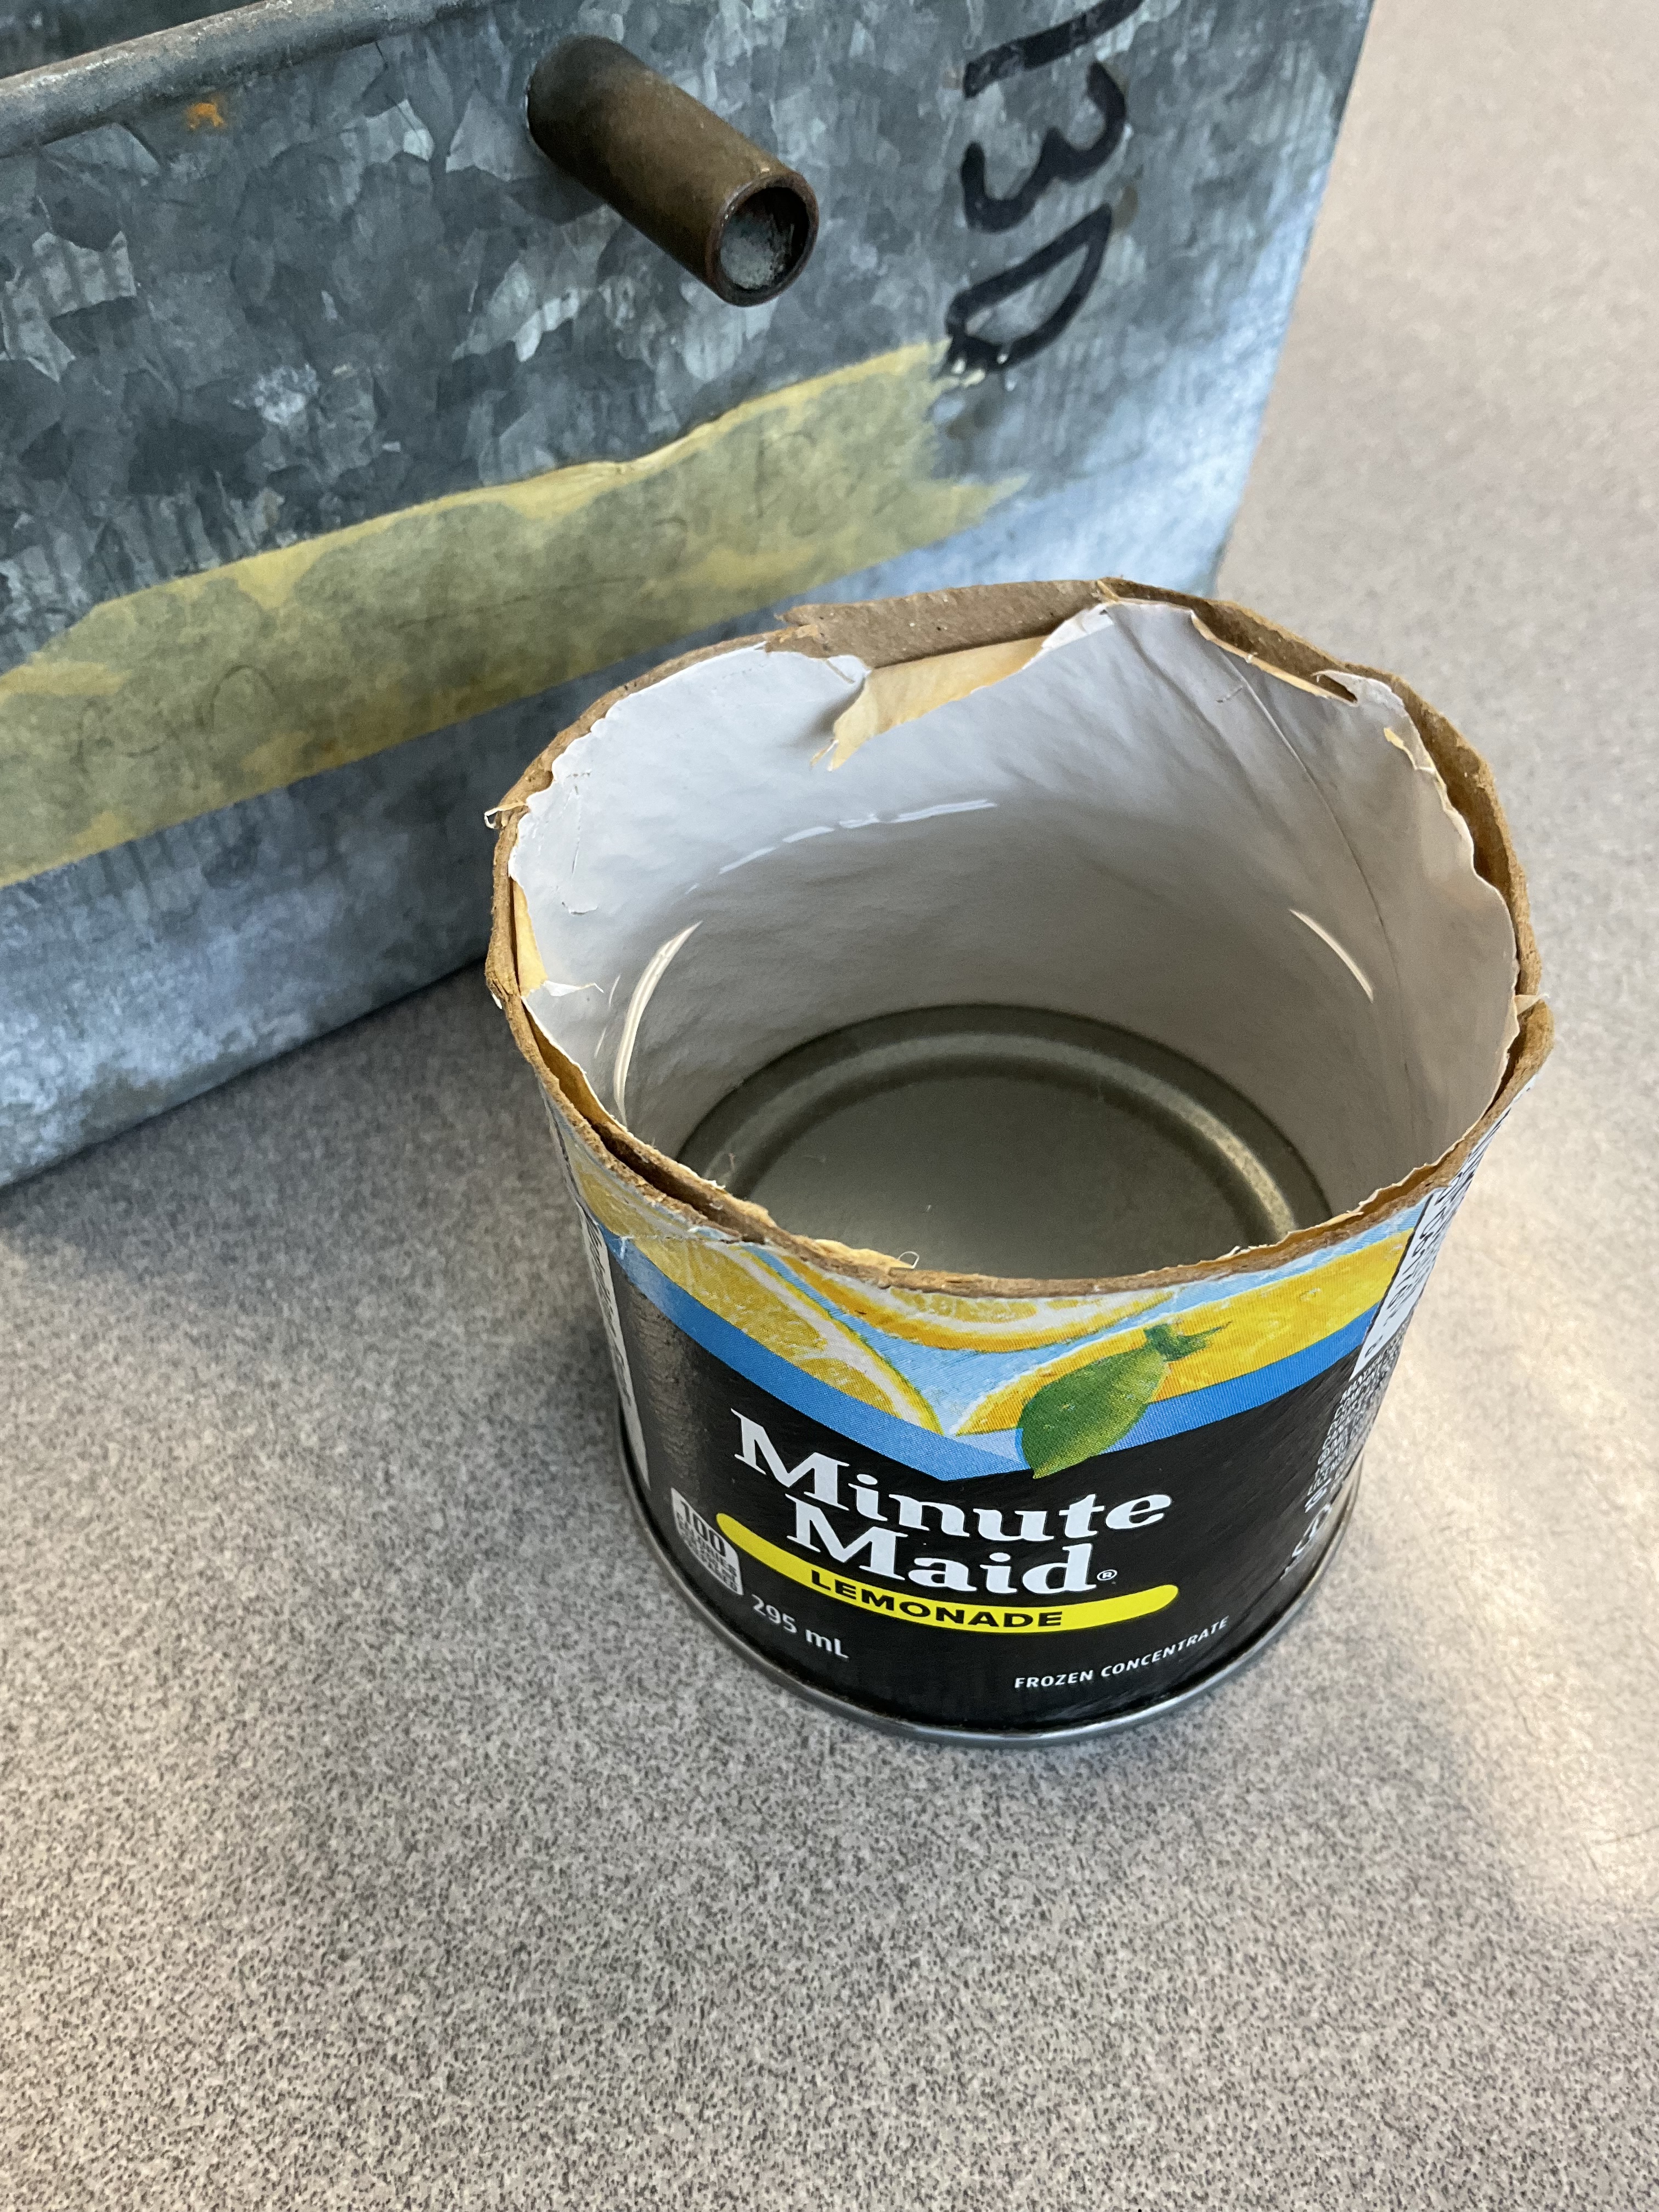
We put the tennis ball into the displacement tank and had to press it down since it floats. We caught the displaced water in the cylinder. It filled it 2/3 of the way.
To prove that it was filled 2/3 of the way, we used the cone and sphere from the solids set.
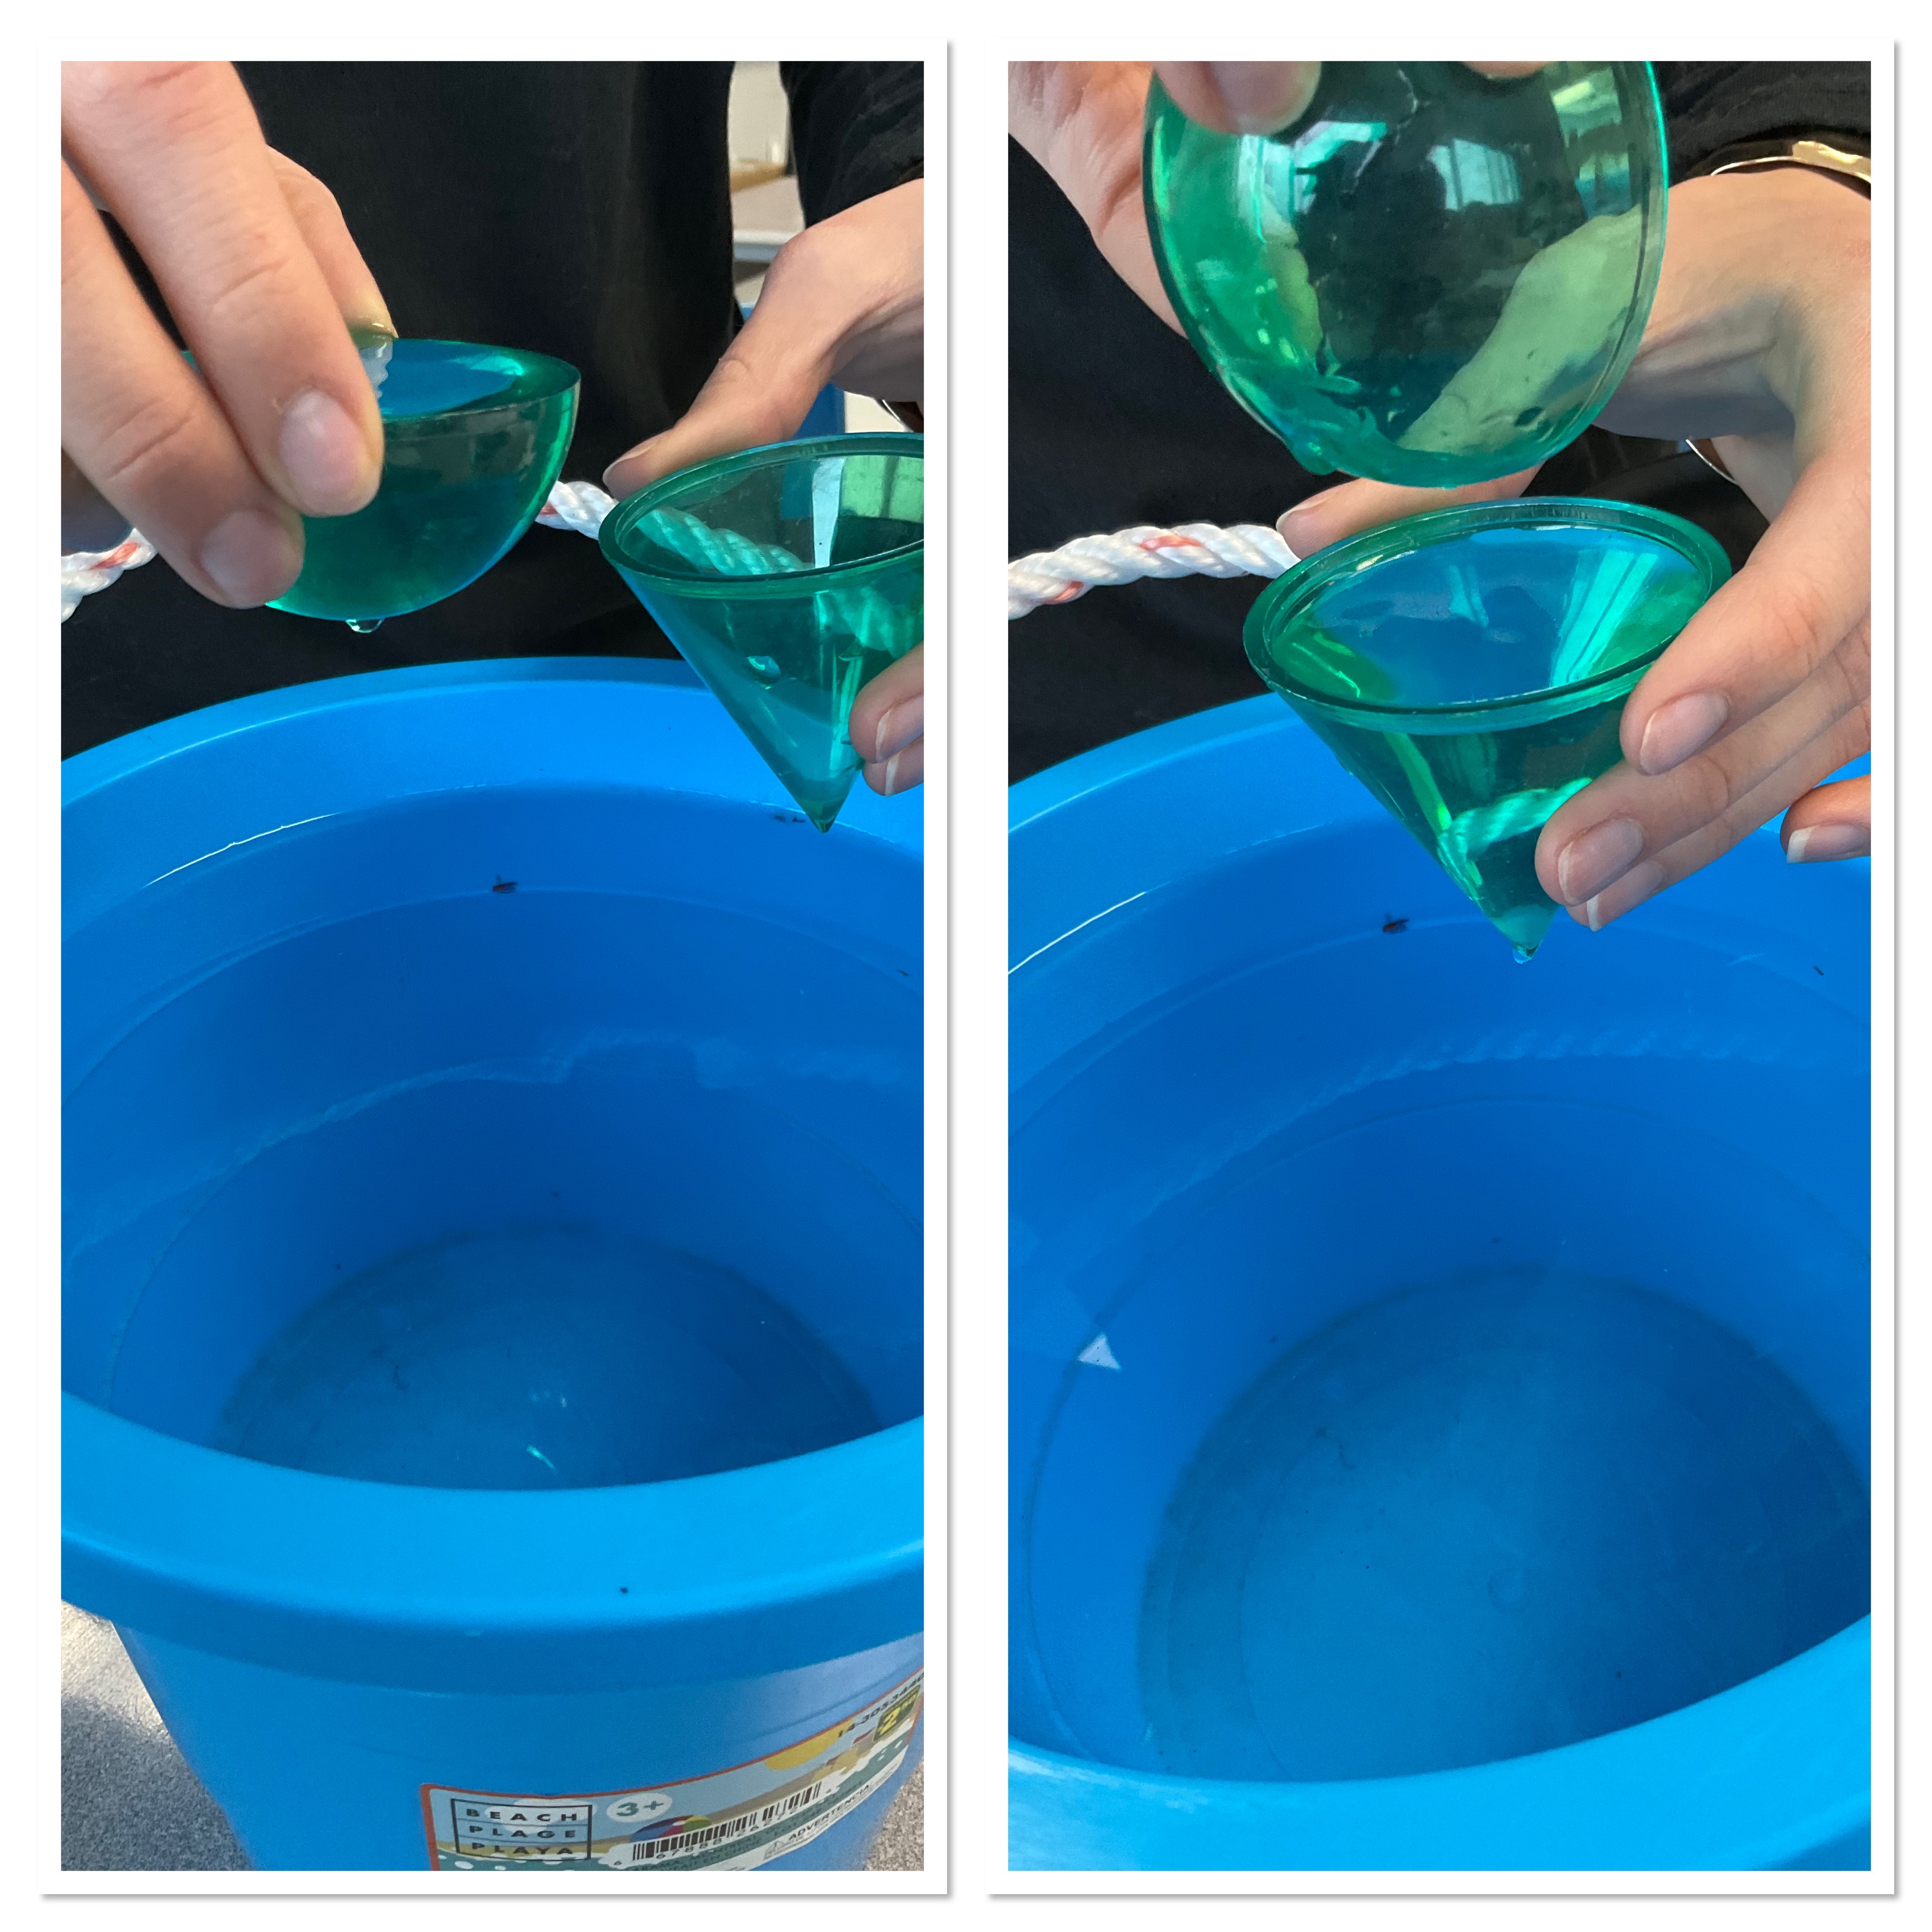
We saw that half a sphere has the same volume as a cone. We already know that a cone has the same volume as 1/3 of the cylinder, so a whole sphere (2 cones worth) is 2/3 of the cylinder.

We went through the derivation using some intense algebra and substitution. We needed to substitute thar h=2r, and then we could get the formula for volume of a sphere.
Surface area was next on the list. We used oranges to help us, since they can be peeled. The peel is the surface of the sphere. We drew circles with the same diameter as the orange, then we peeled the orange and fit the peels into the circles.
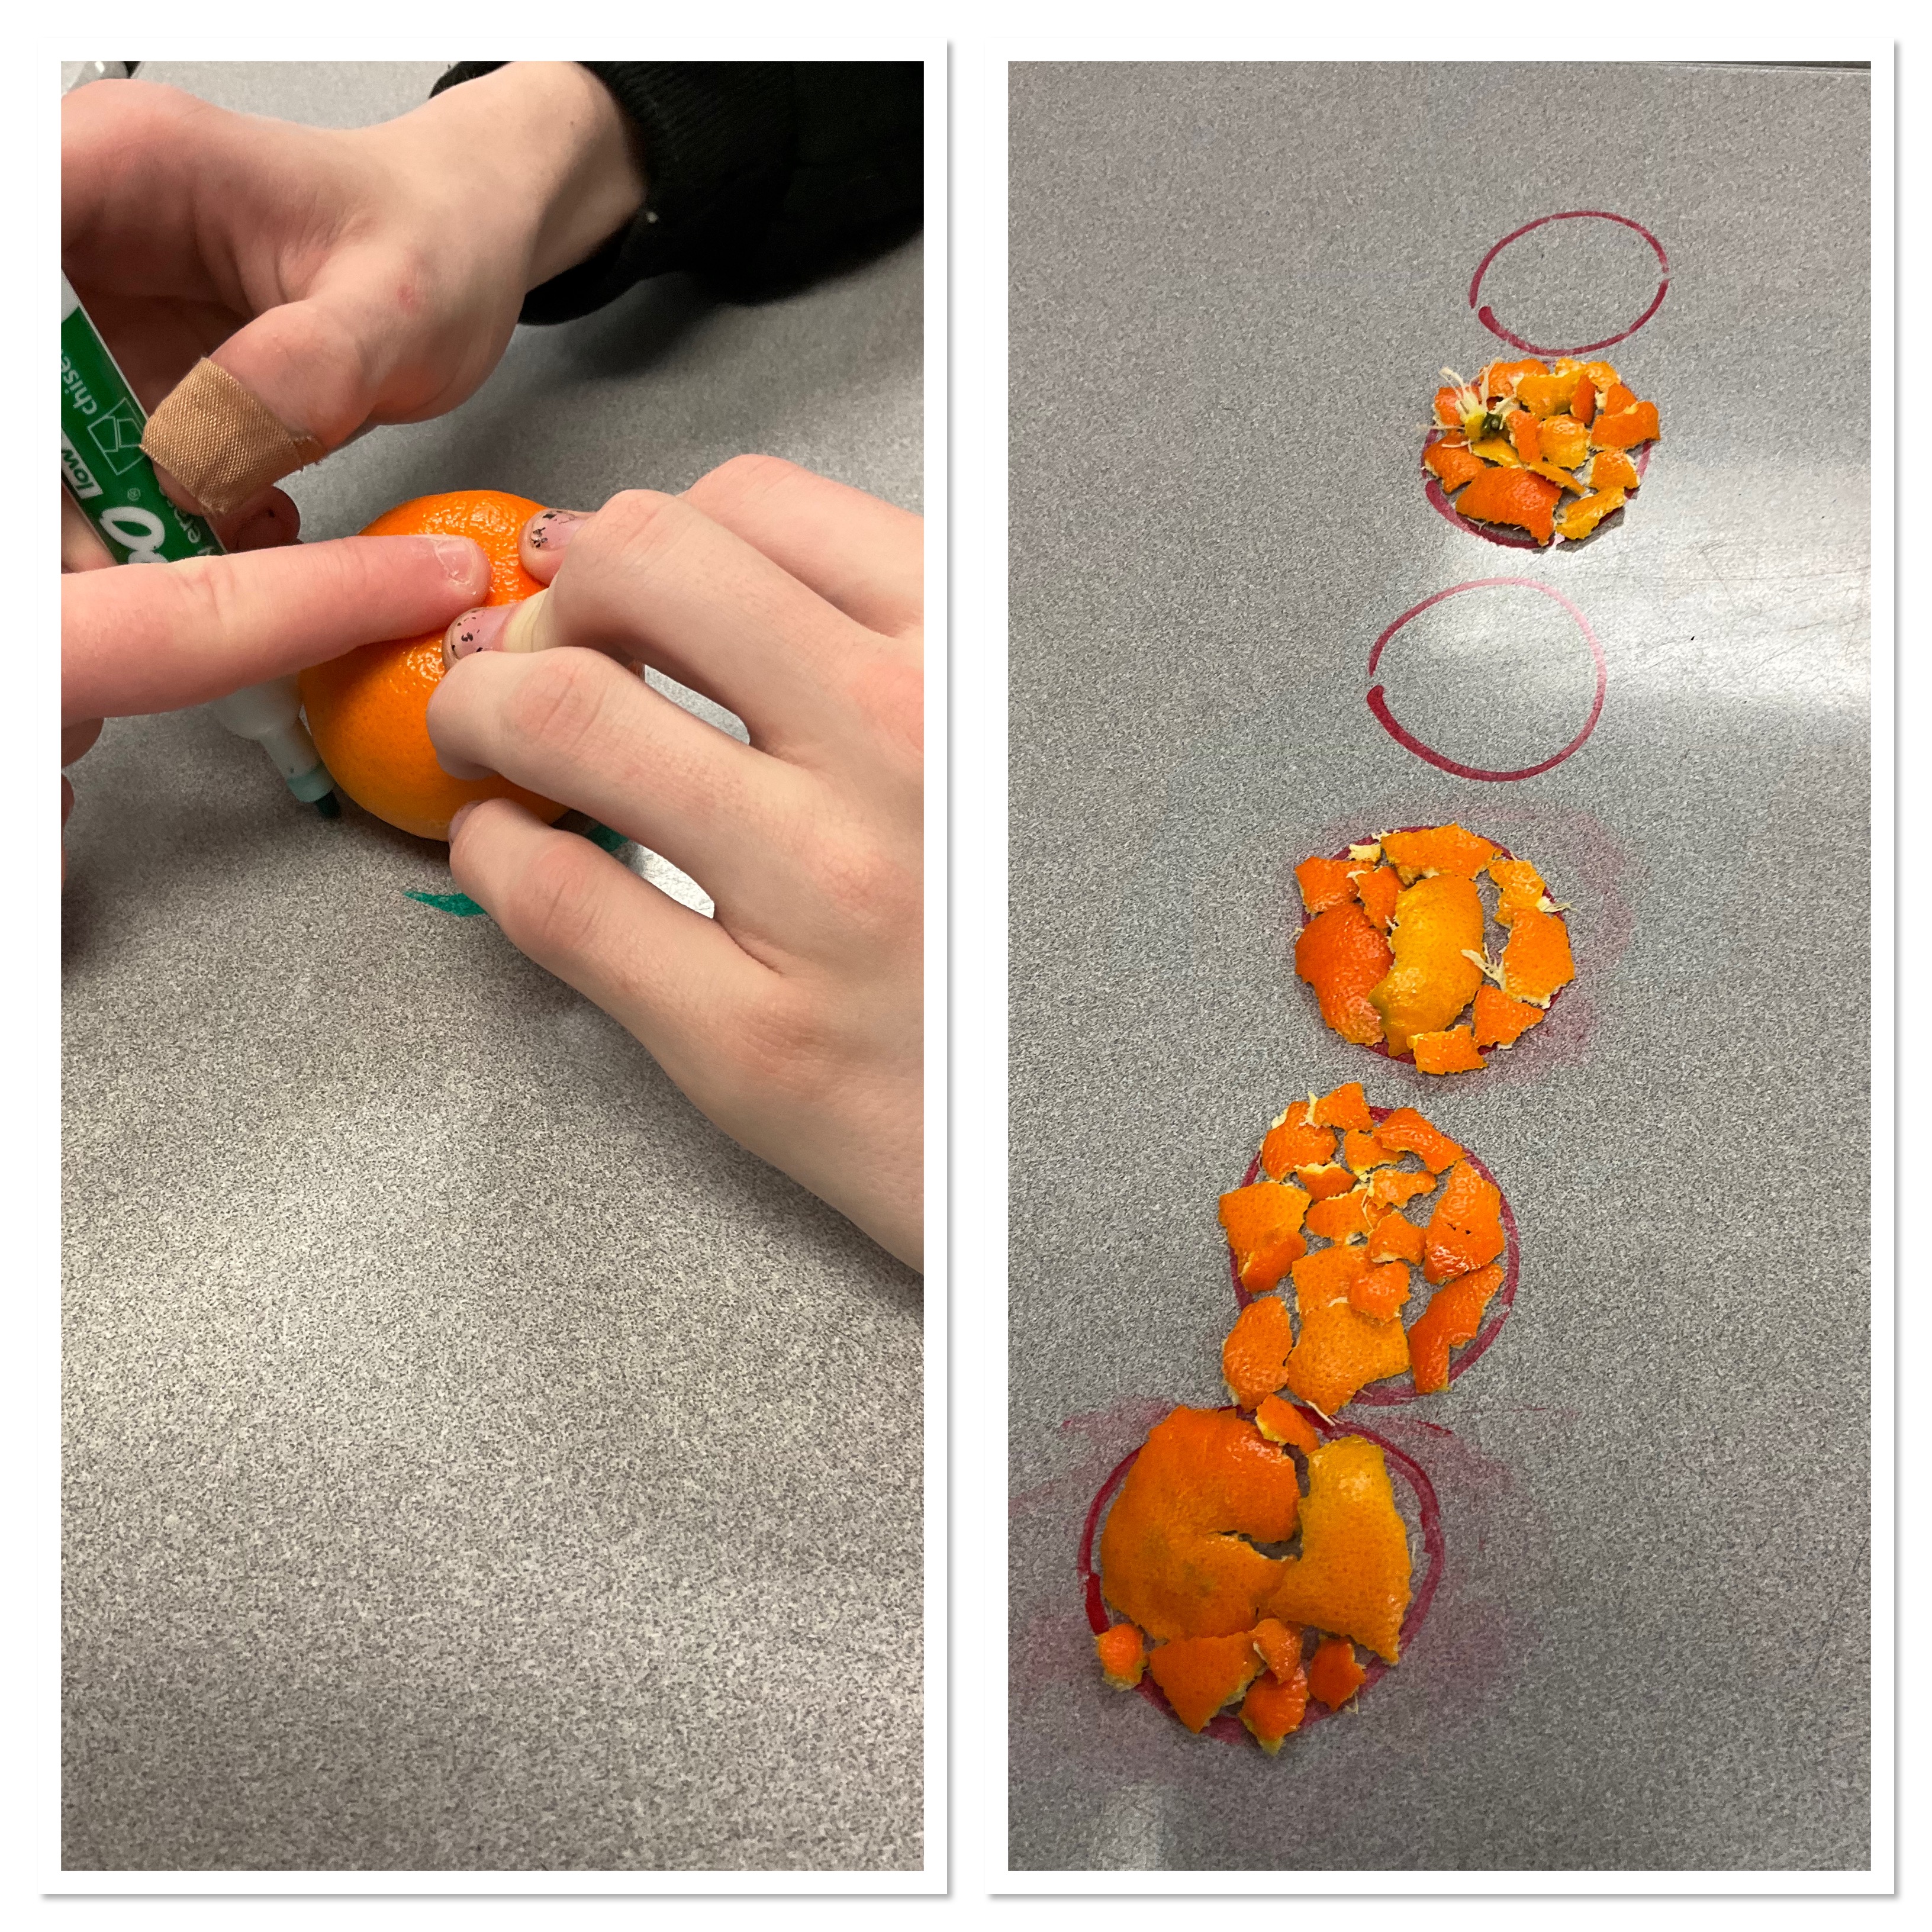
We can fill 4 circles perfectly with the peels. This corresponds to the formula of the sphere’s area.
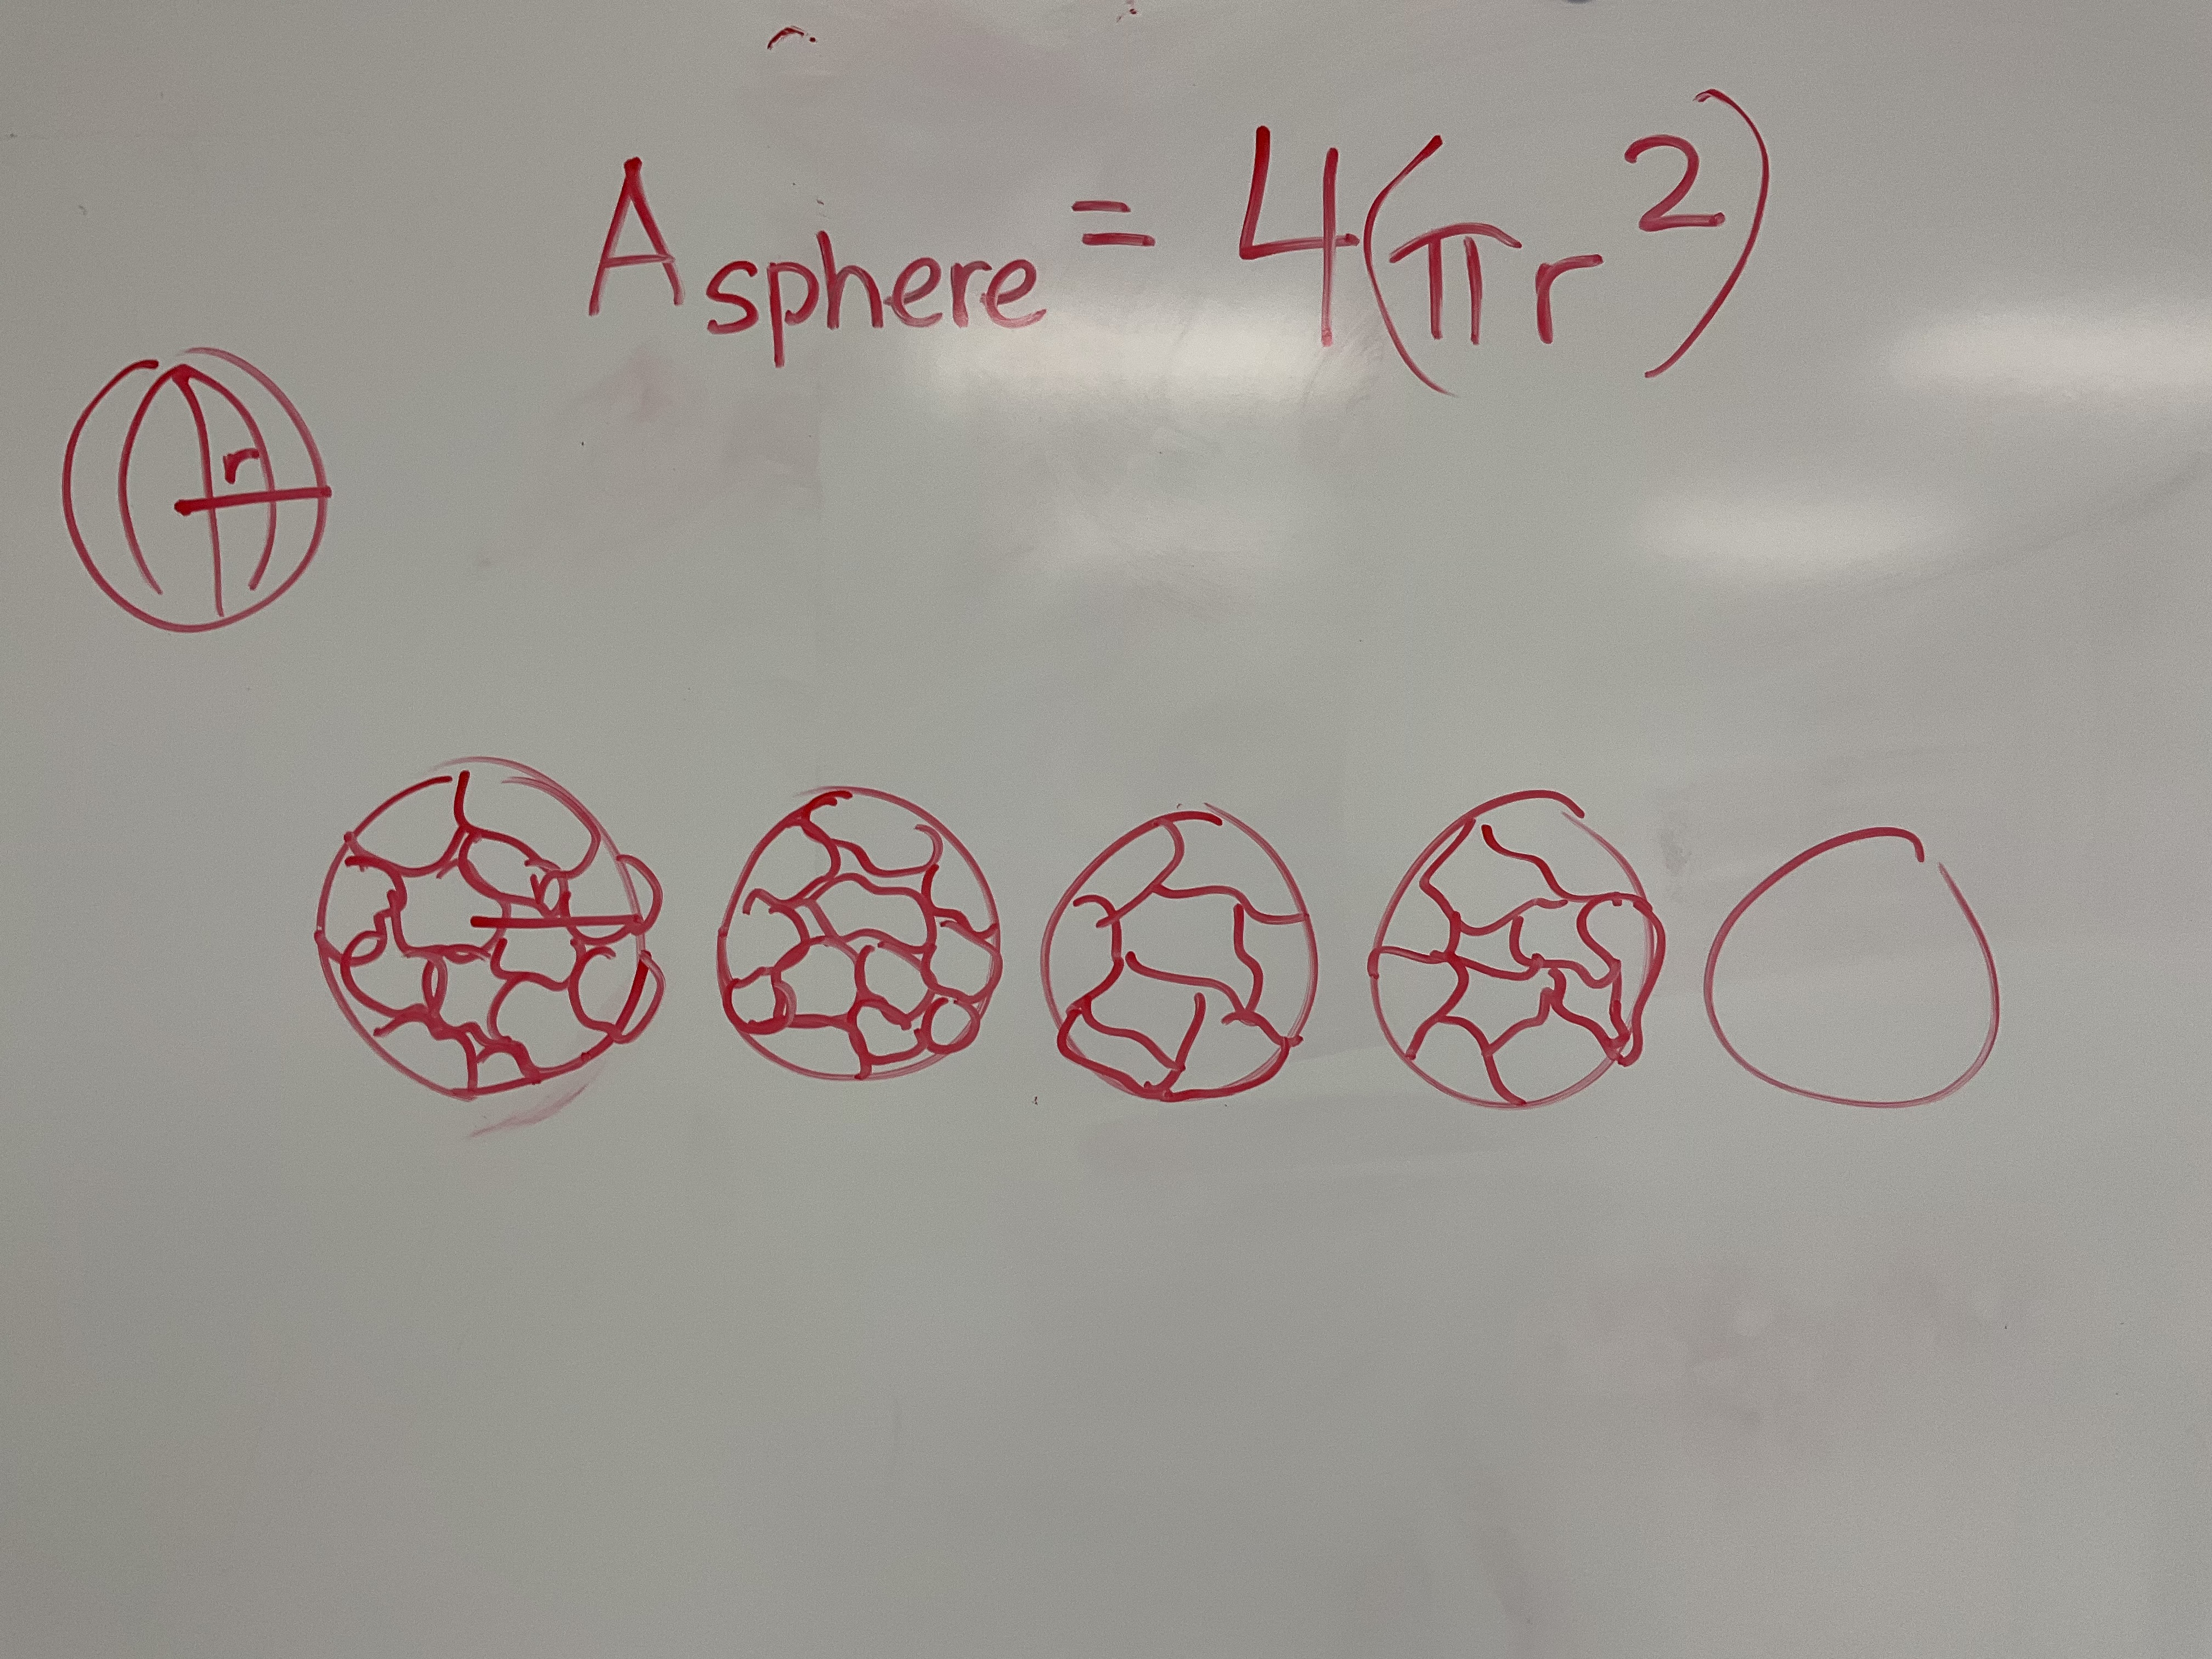
This was our last new learning, and we’ll be preparing for our exams which take place next week.
Popcorn Pandemonium
Today I was invited to work with a grade 9 class with the goal of exploring systems of equations. I love the 3 act task popcorn pandemonium, so that’s was the game plan to start.
We watched the video and noticed and wondered. This class has come a long way since September with their ability to dive into a task and try to figure things out.
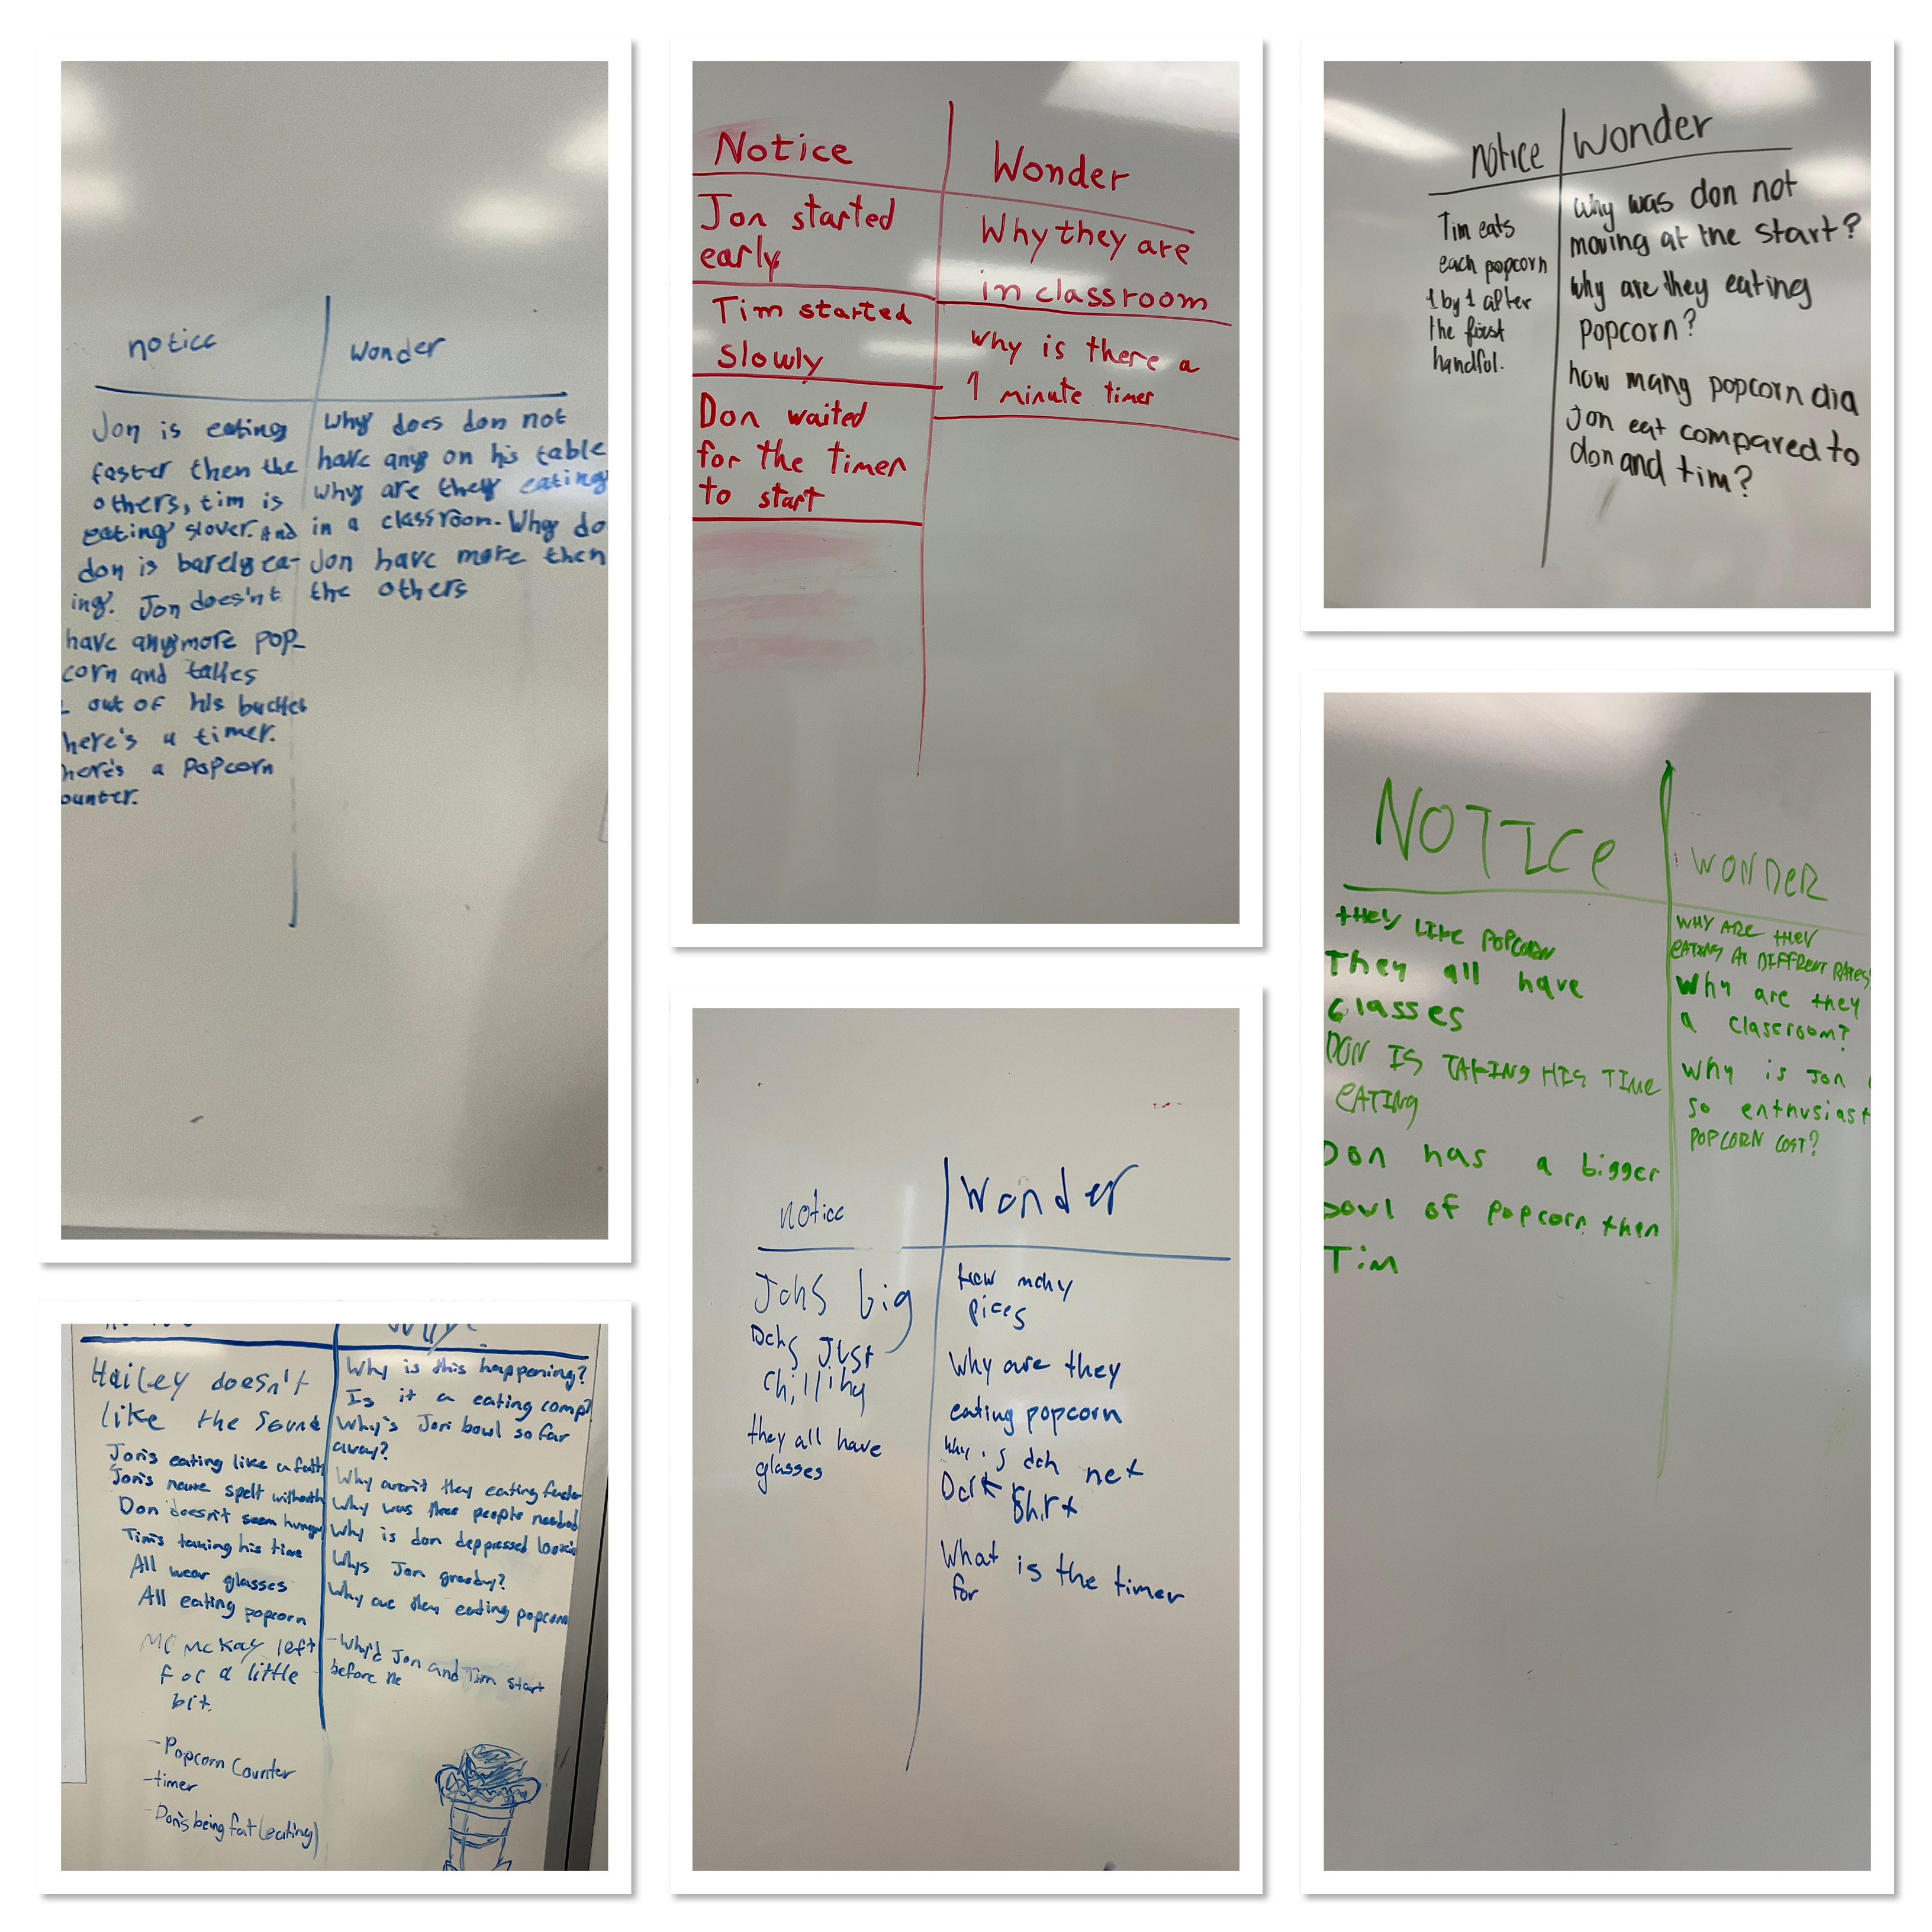
Next we watched the act 2 video
we made use of the extra information in the video to model the popcorn eaten, and to figure out who would eat more after 1 minute (when the timer elapsed)
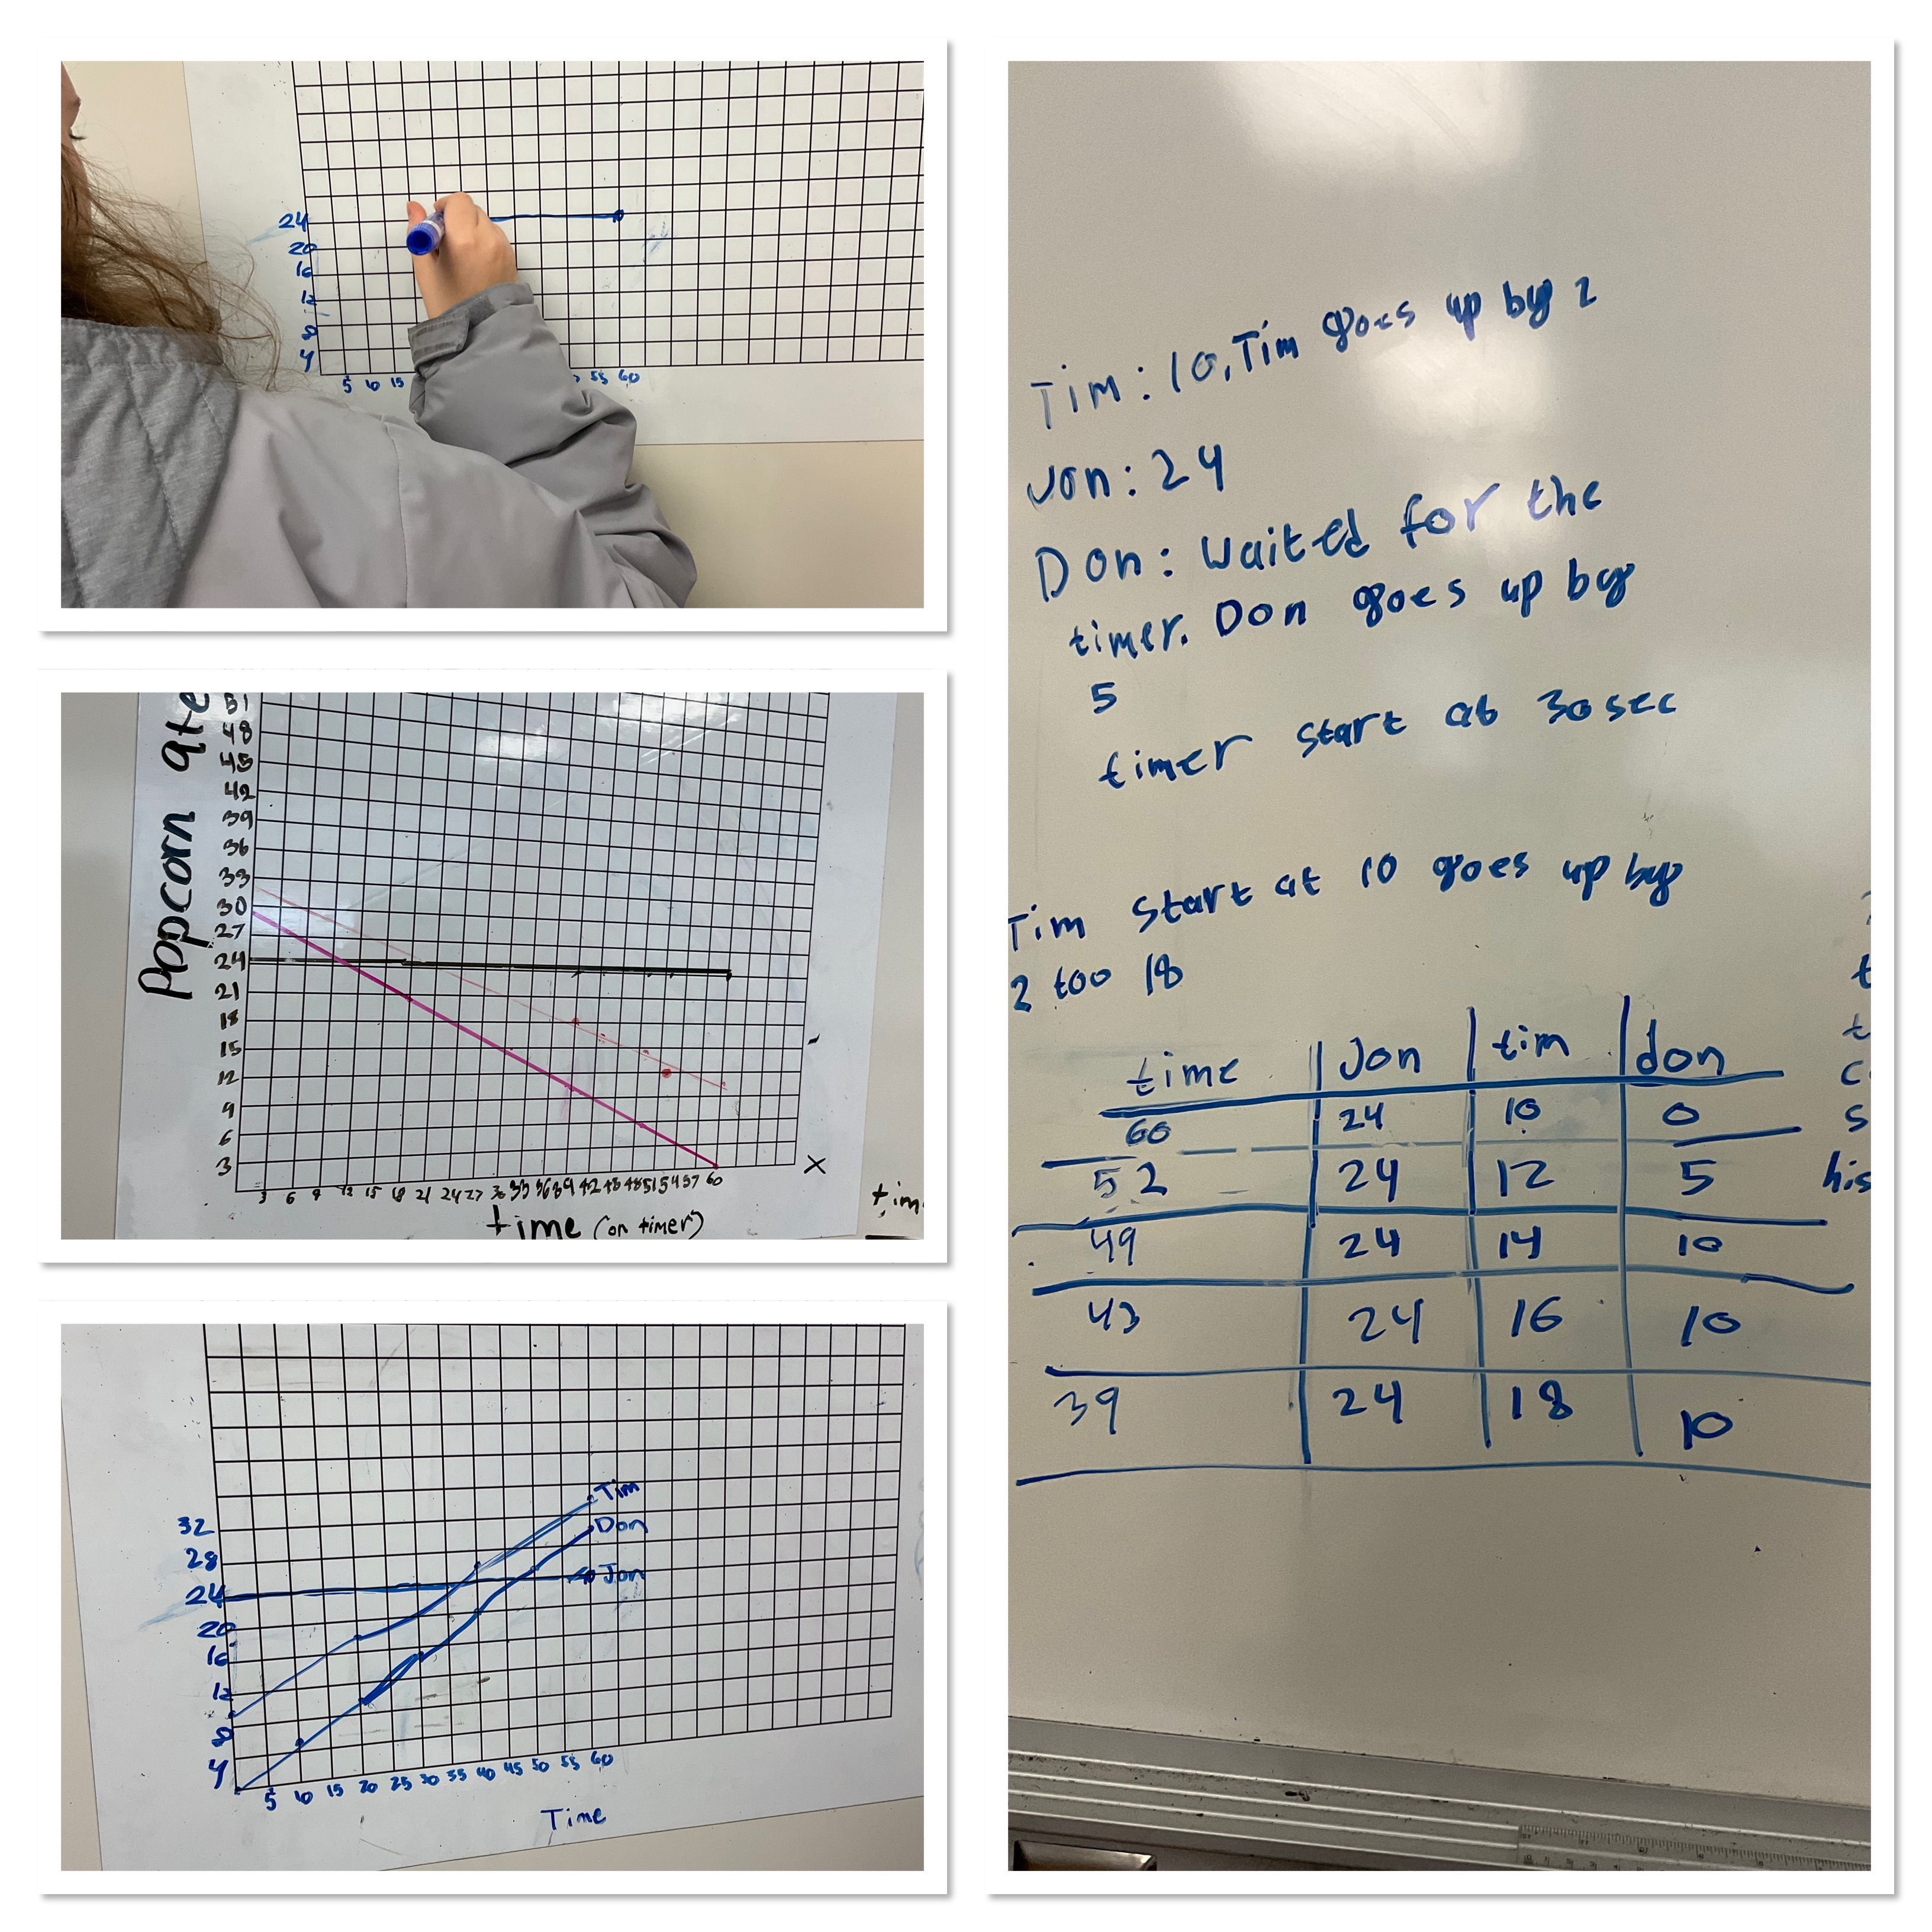
This class had a few different ways to approach time, time elapsed, or time remaining on the counter, so some saw the graphs come together in a different way, looking at what the values of popcorn would be when the timer was at 0 (the y intercept). This is why some groups had negative slopes and some had positive. We didn’t correct/clarify as they worked, because the problem could be solved by either interpretation.
Here’s the graph that we made
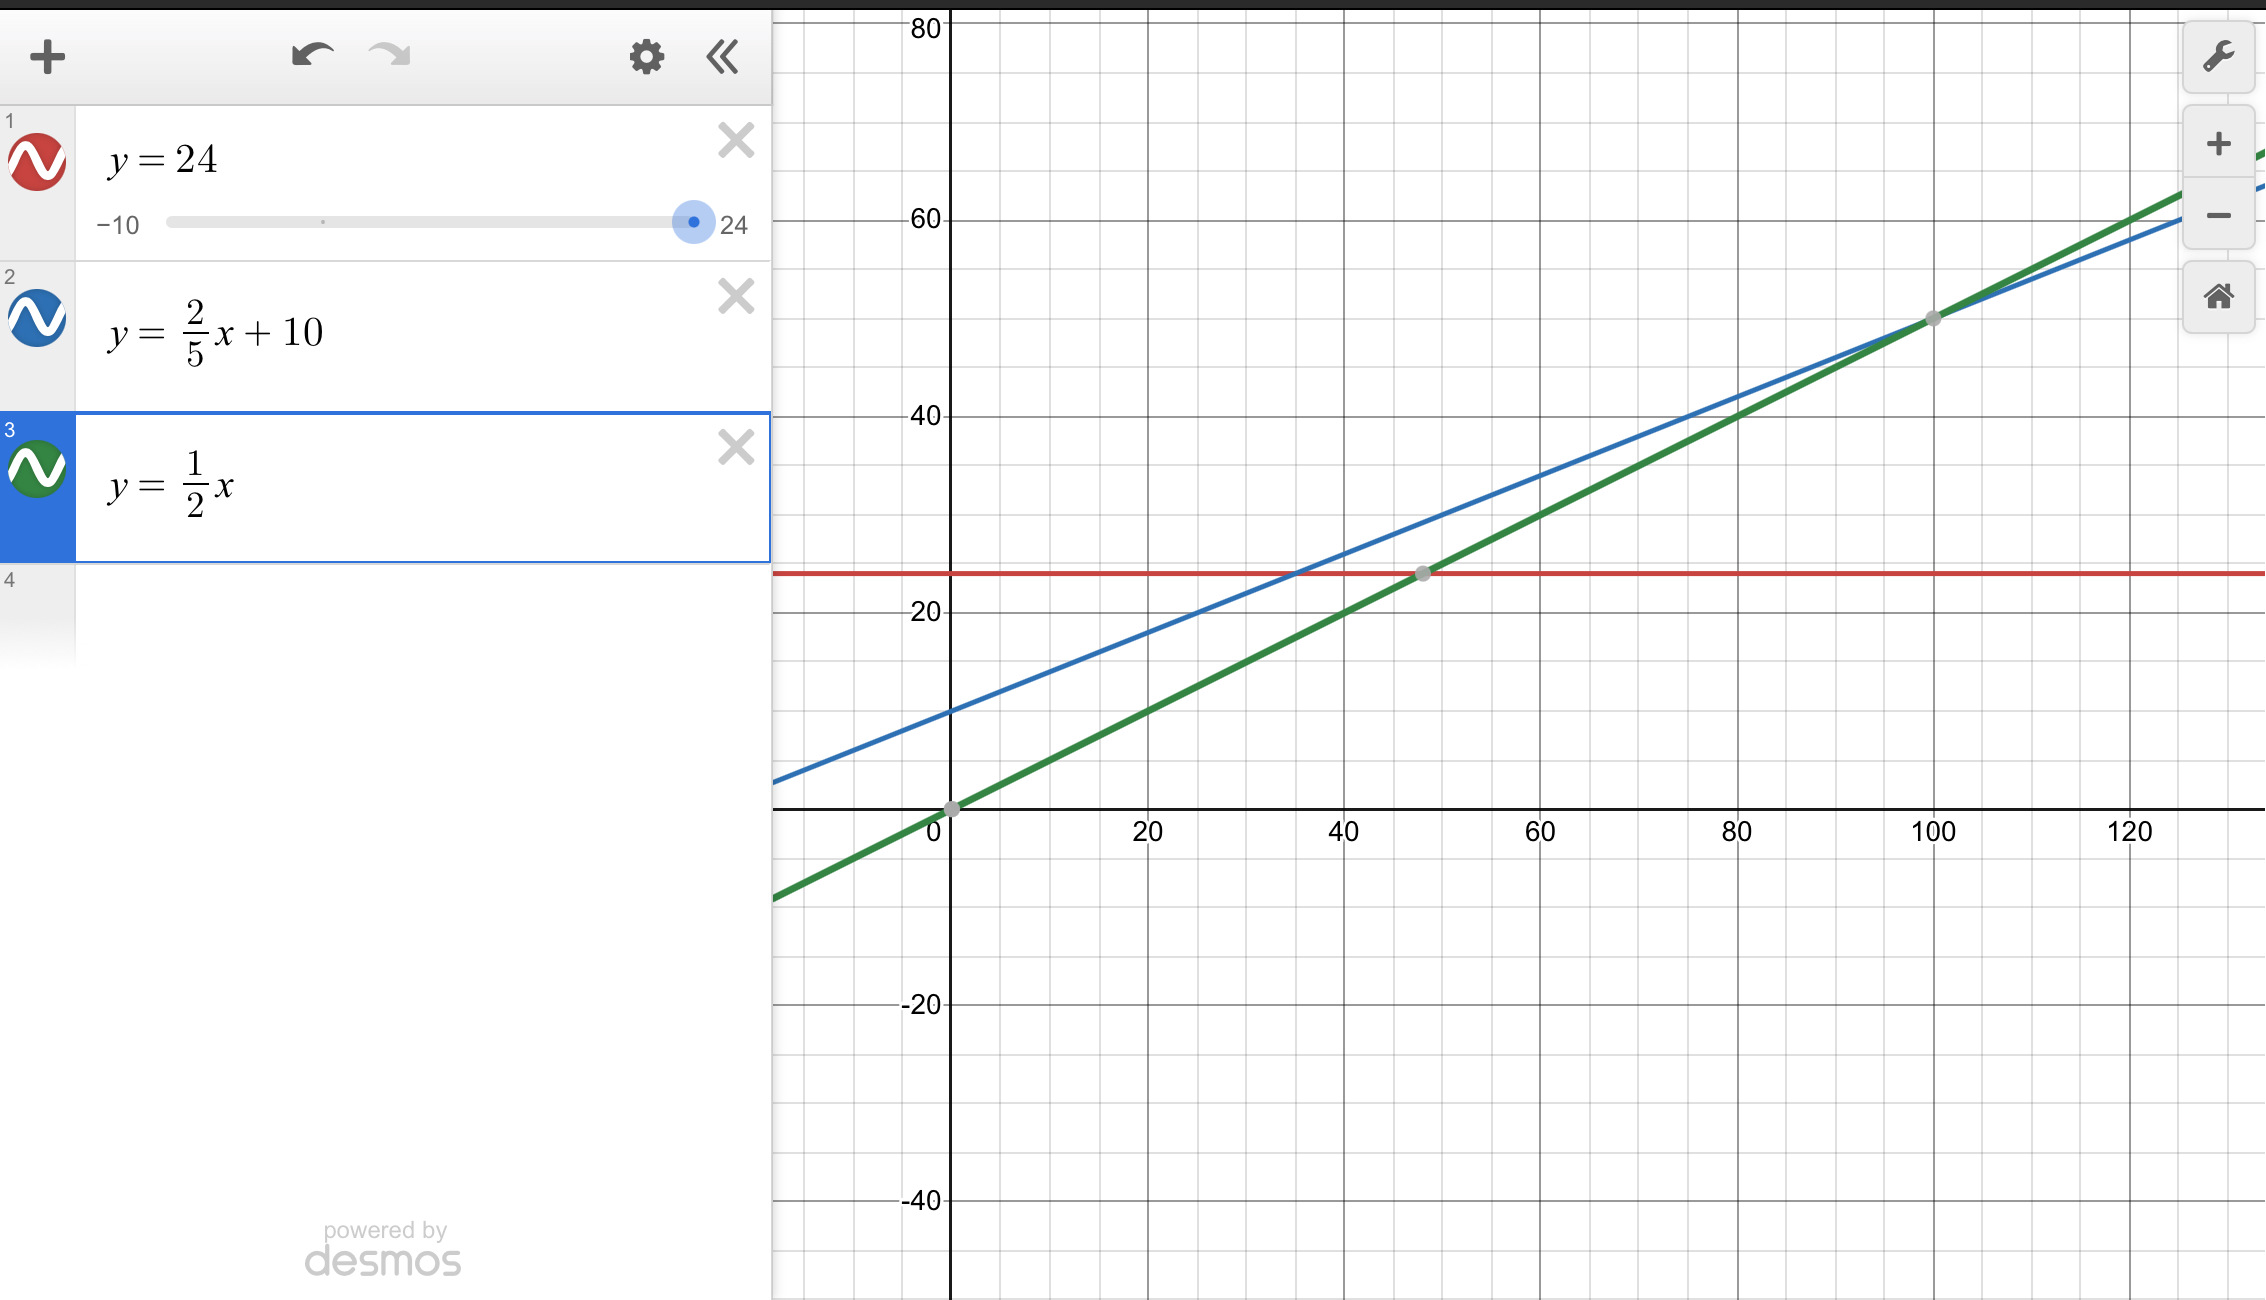
From the graph we looked at who would eat the most popcorn at the 1 minute mark. Next we looked to see if we wanted Don to win, how long would they need to eat for. This brings inequalities into the discussion. For t>100 Don wins. We looked at the point of intersection as the “tie” and then for t<35 Jon wins, and for 35<t<100 Tim wins. We could see lots of points of intersection to explore all the different “ties” possible.
Next we looked at what would happen if Don ate slower, or if Tim had a different head start, and how that would affect the graphs. If 2 ate at the same rate, but one had a head start, they’d never have an intersection because their lines would be parallel etc.
We could explore a lot through this task. It was a nice way to get them ready for EQAO and the thinking questions they’ll have to tackle then.
We didn’t get to watch the 3rd act because we were so deep into debriefing the act 2 math, but here’s the video anyway.
Beading
One of our grade 9 classes is participating in a beading workshop right now (similar to what other classes did this fall). It is so nice to see the creativity that they have, and chat with the students about the math that they see in their patterns.
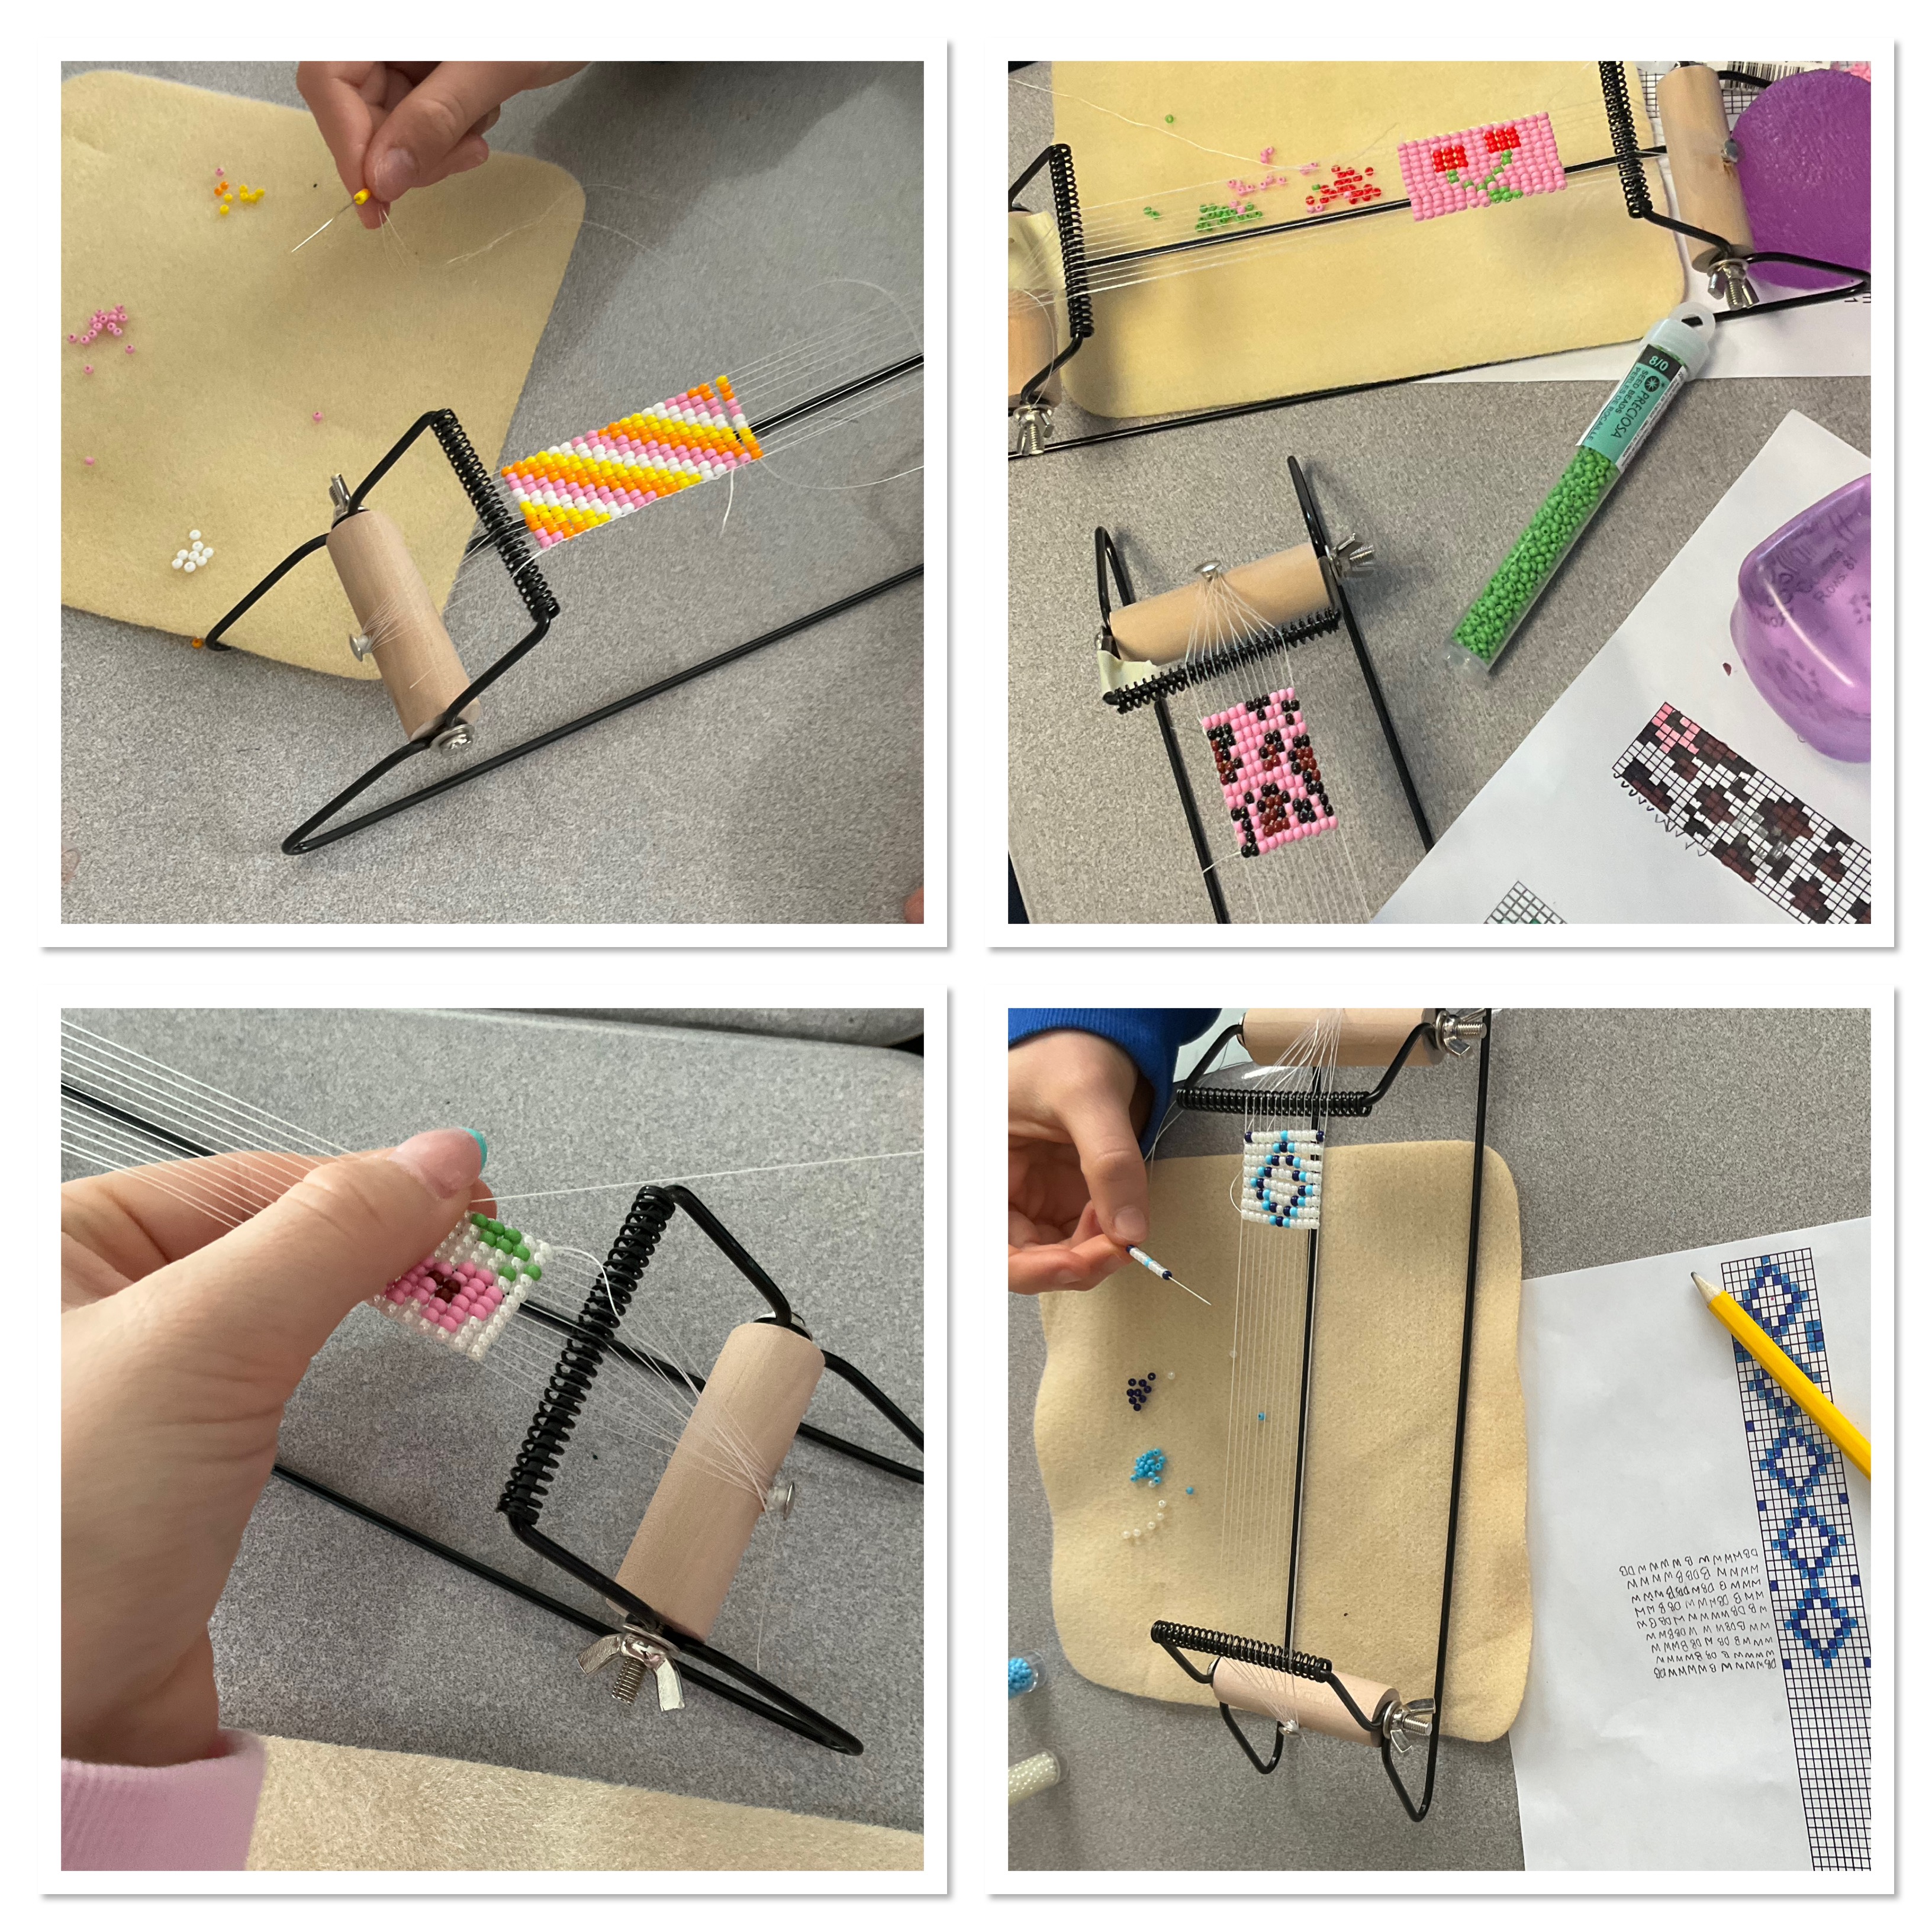
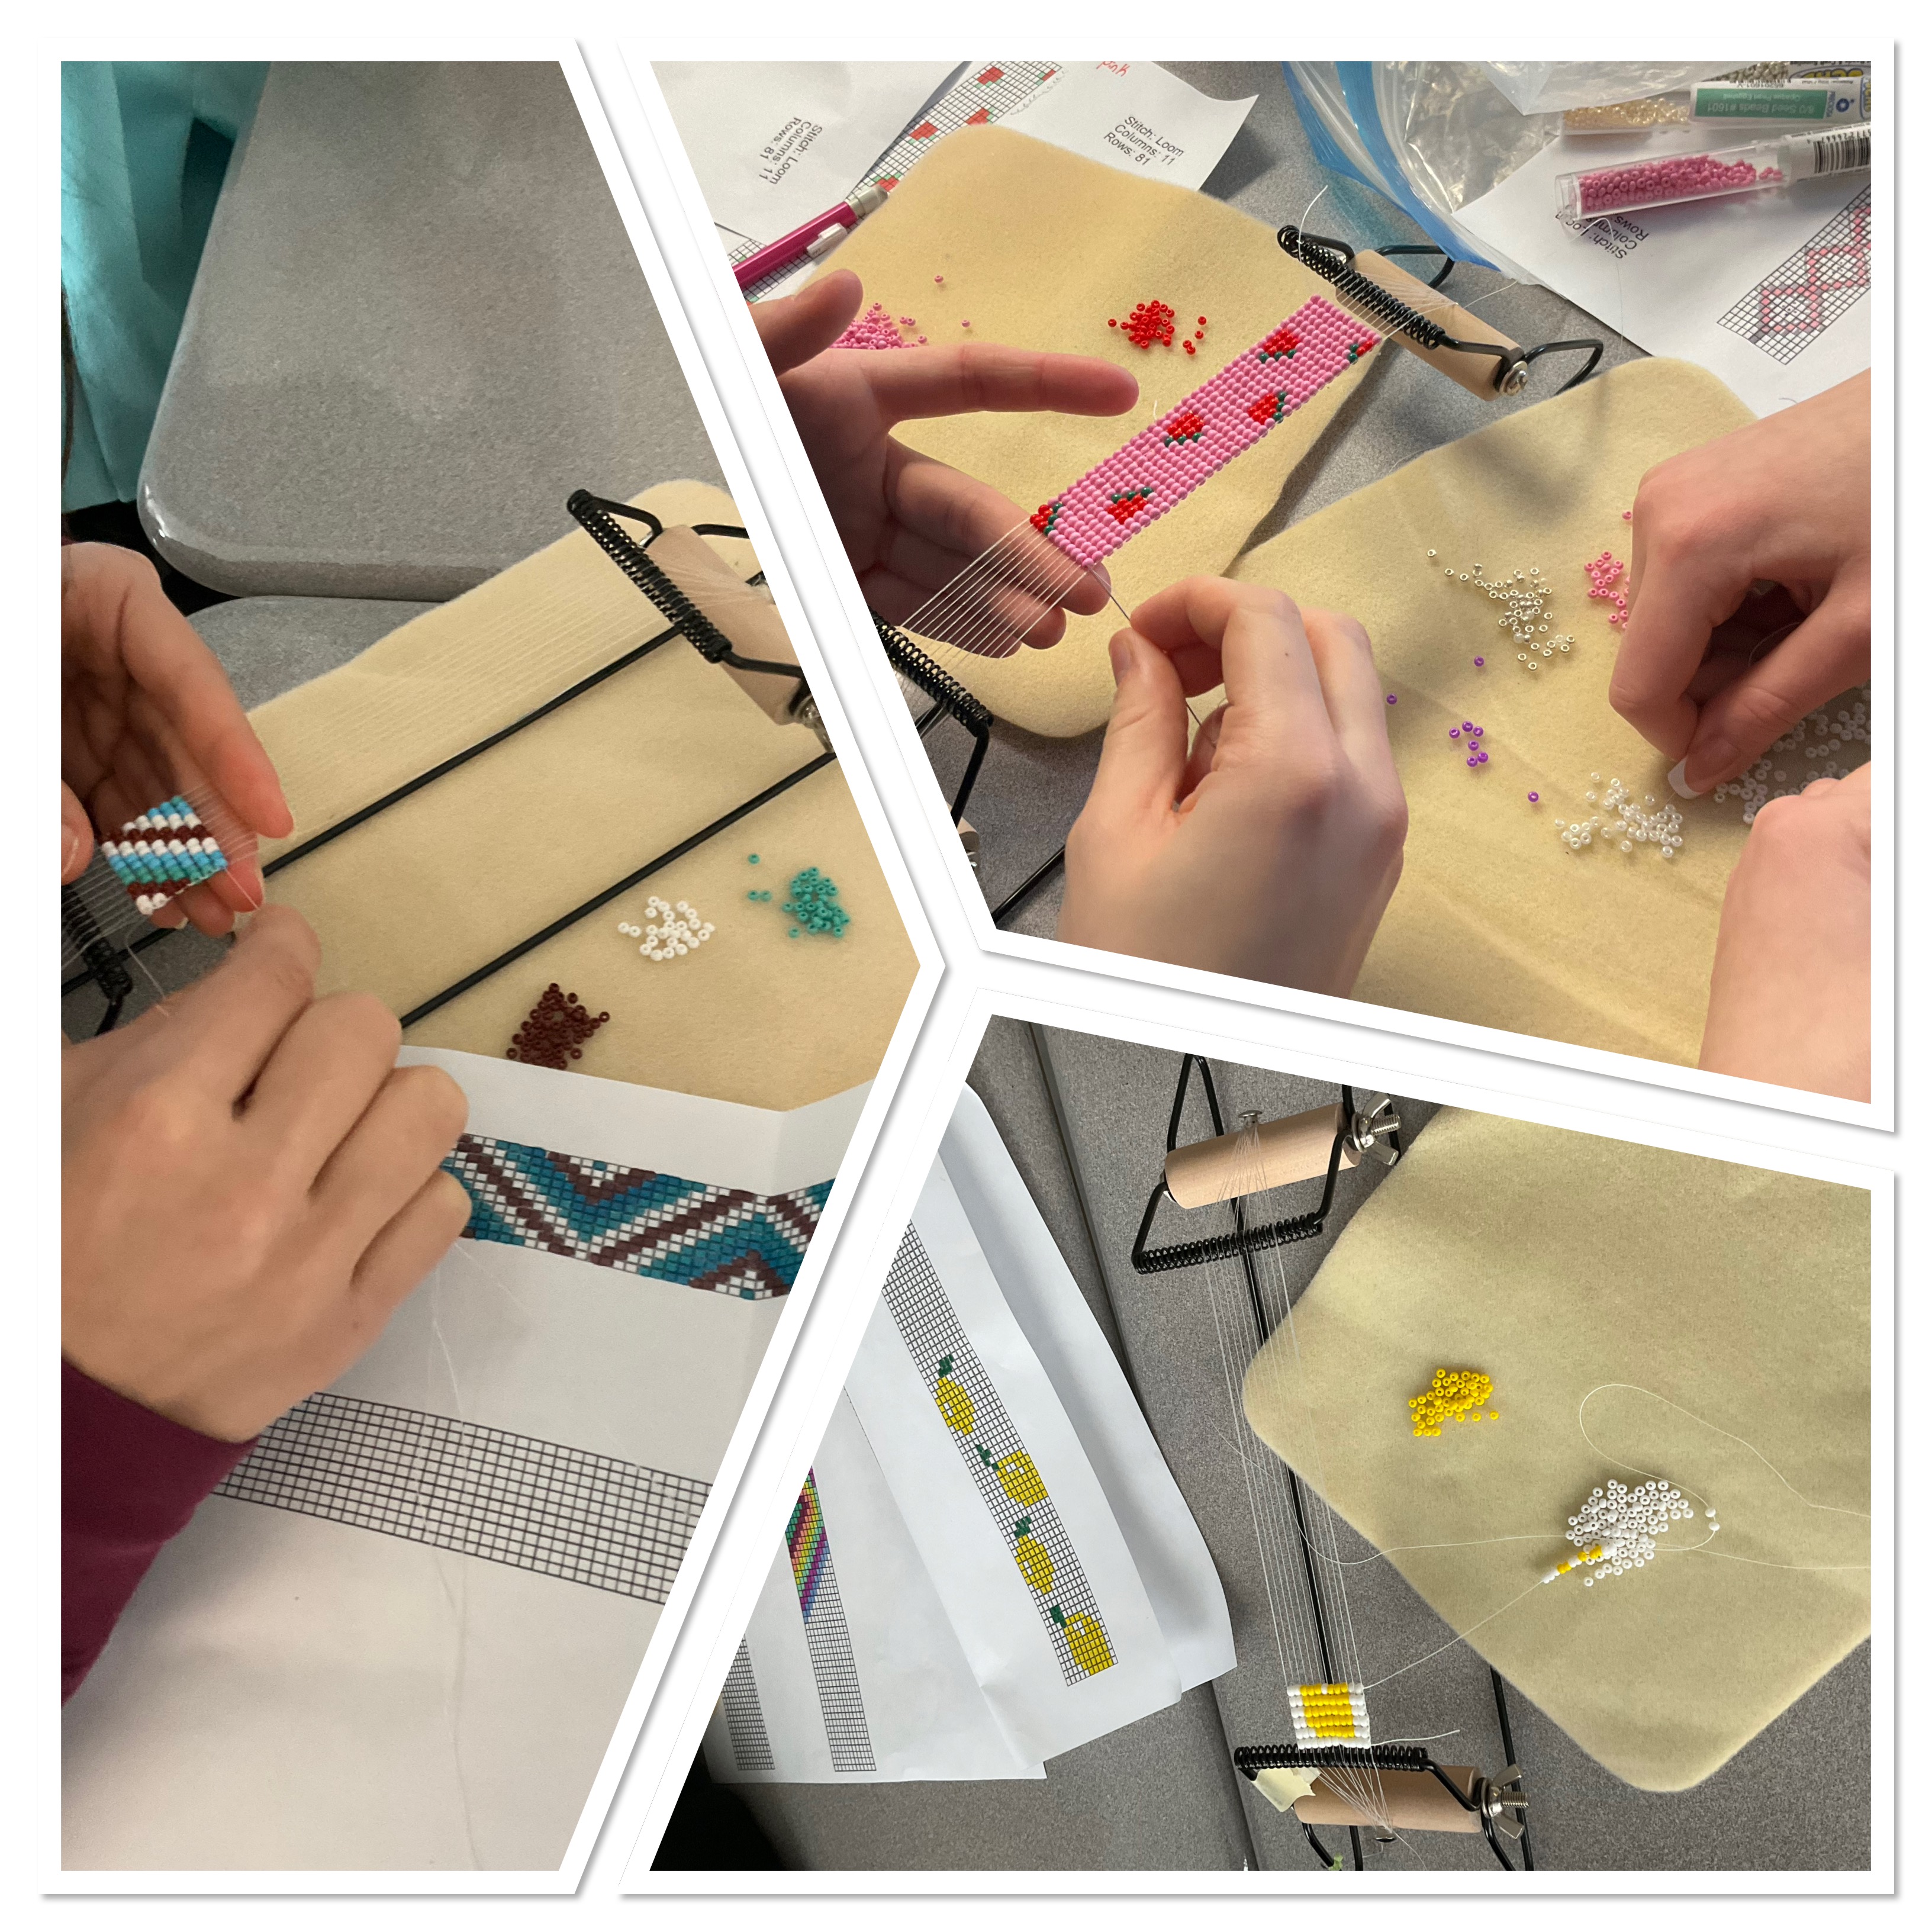
Many thanks to our Indigenous program team for facilitating these educational experiences for our students.
Ball Roll Race Finale
Today was all about analysis and making predictions, and then we did the final race.
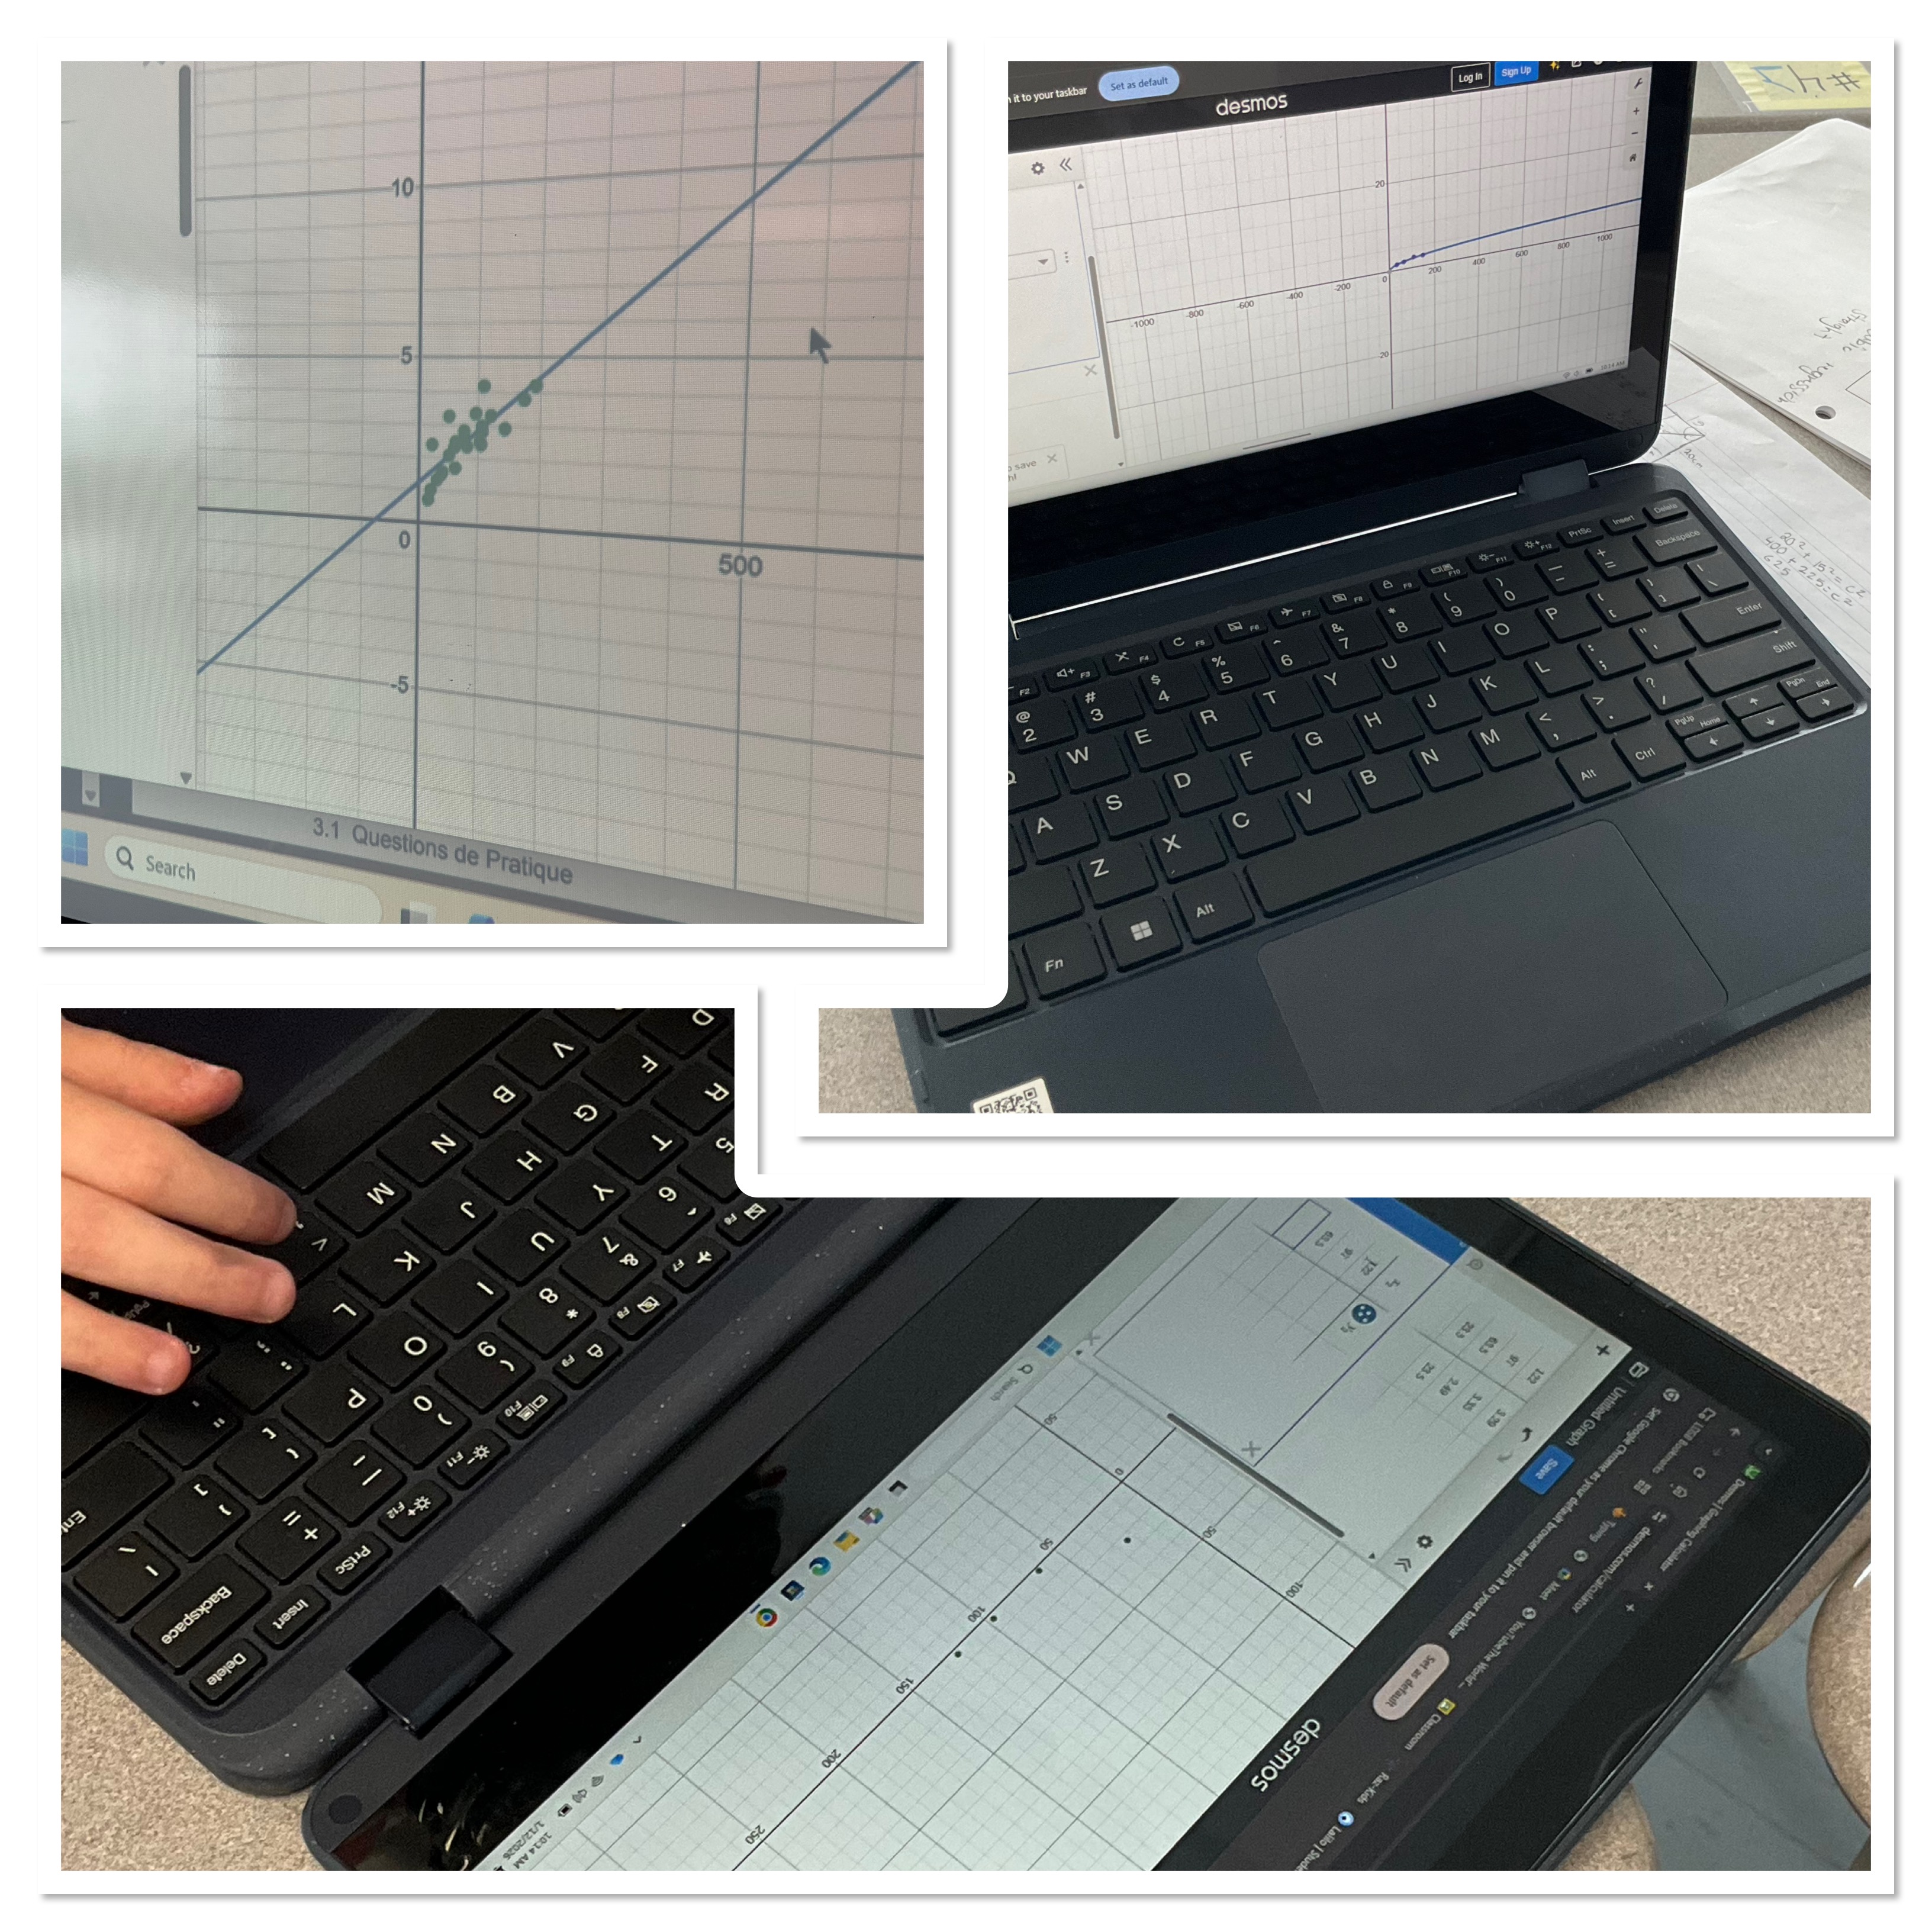
We spent some time at the start of class making graphs by hand and with Desmos in our groups, and then using them to predict what we thought would be the end results.
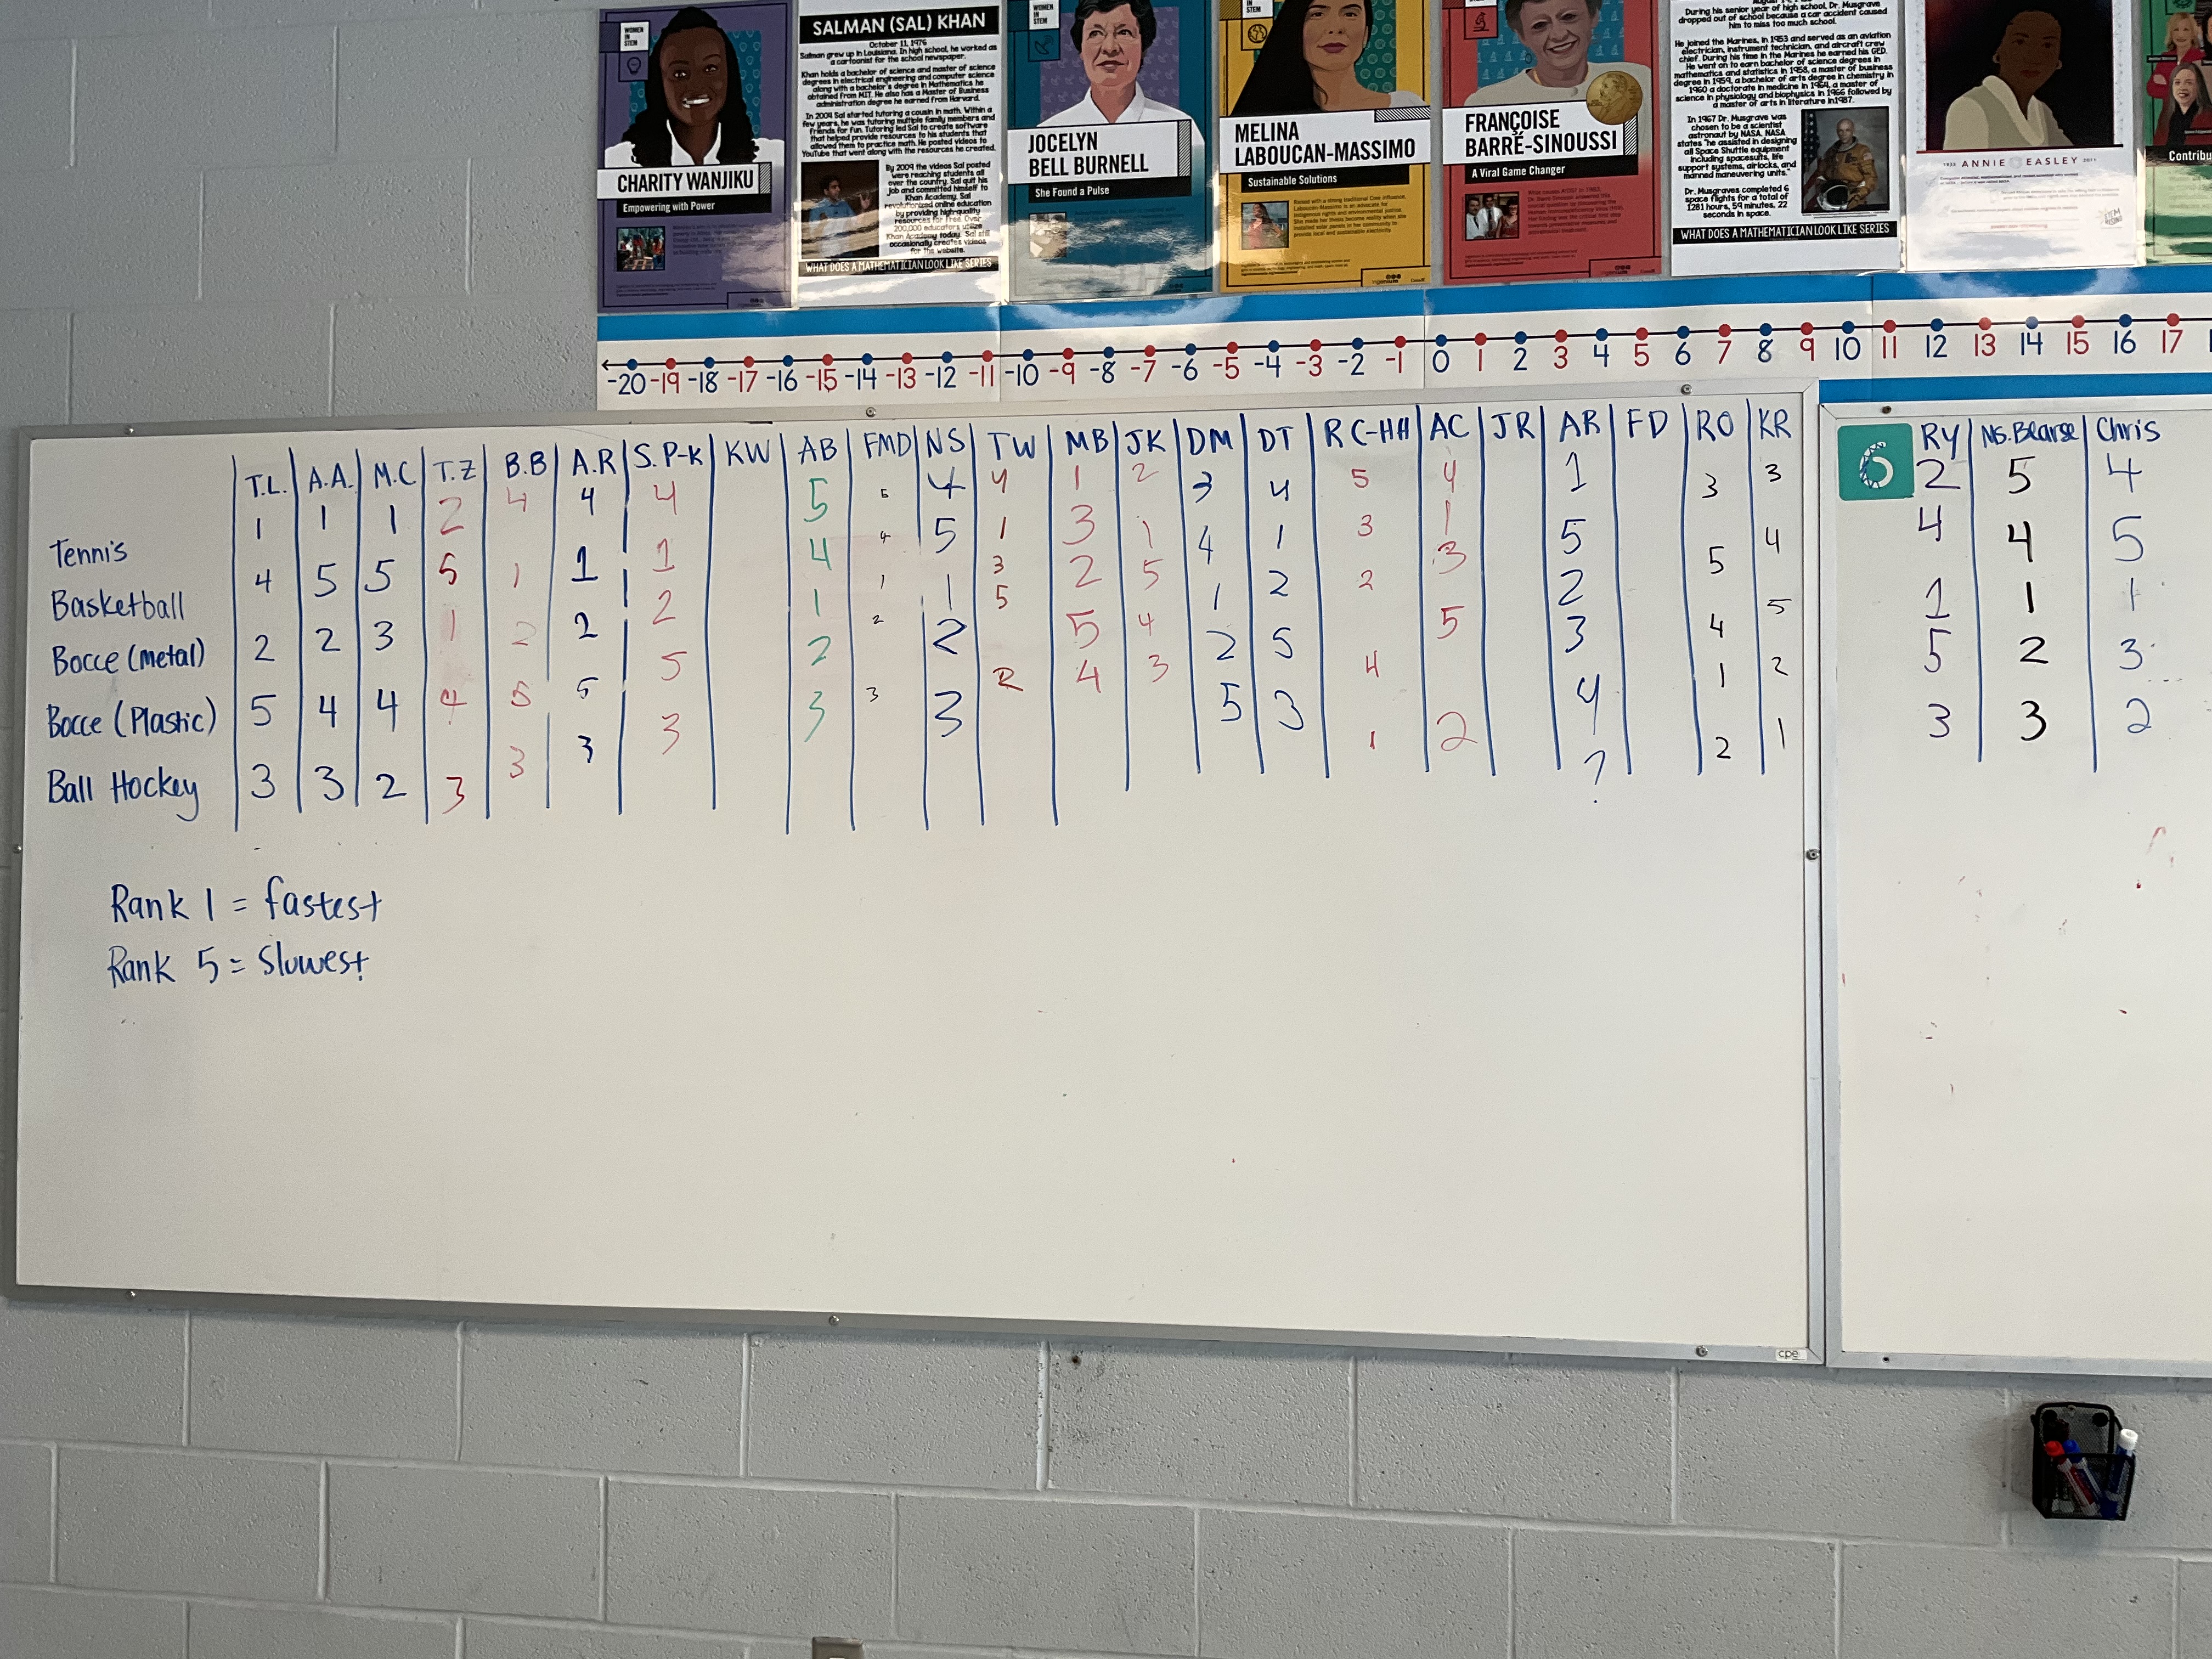
We looked at some composite graphs from all the groups, and since class I made one with ALL of the data here
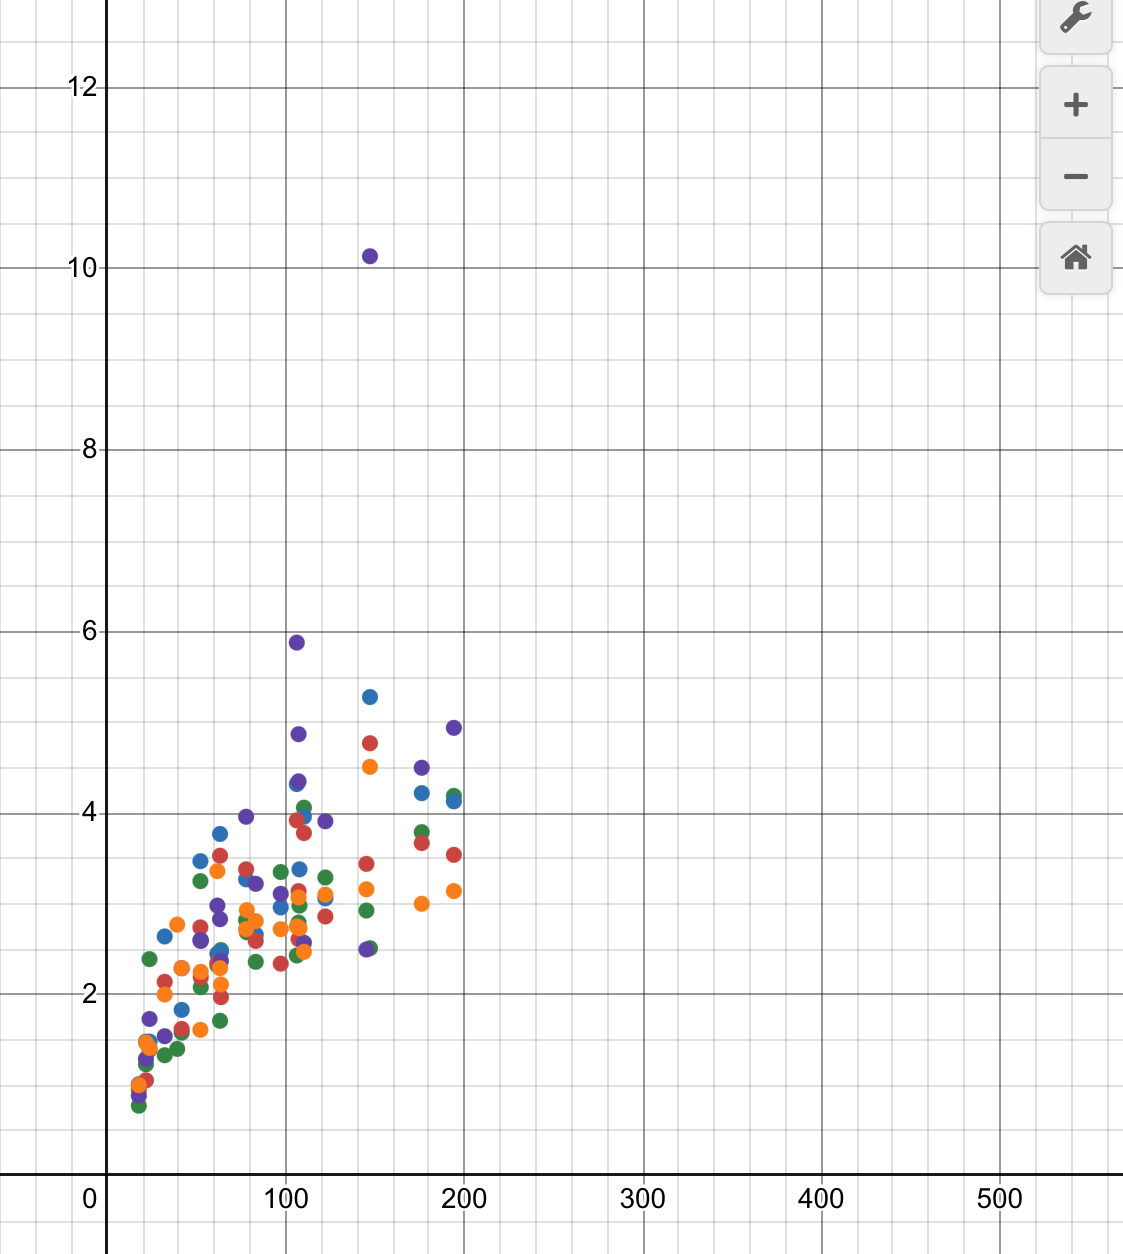
We can see a non linear trend when we have lots of data together, but most groups assumed that their 4 points of data could be fit with a line.
Once we had locked in our choices, we went downstairs to the ramp to do our final trial. We lifted the meter stick and the balls rolled down the ramp.
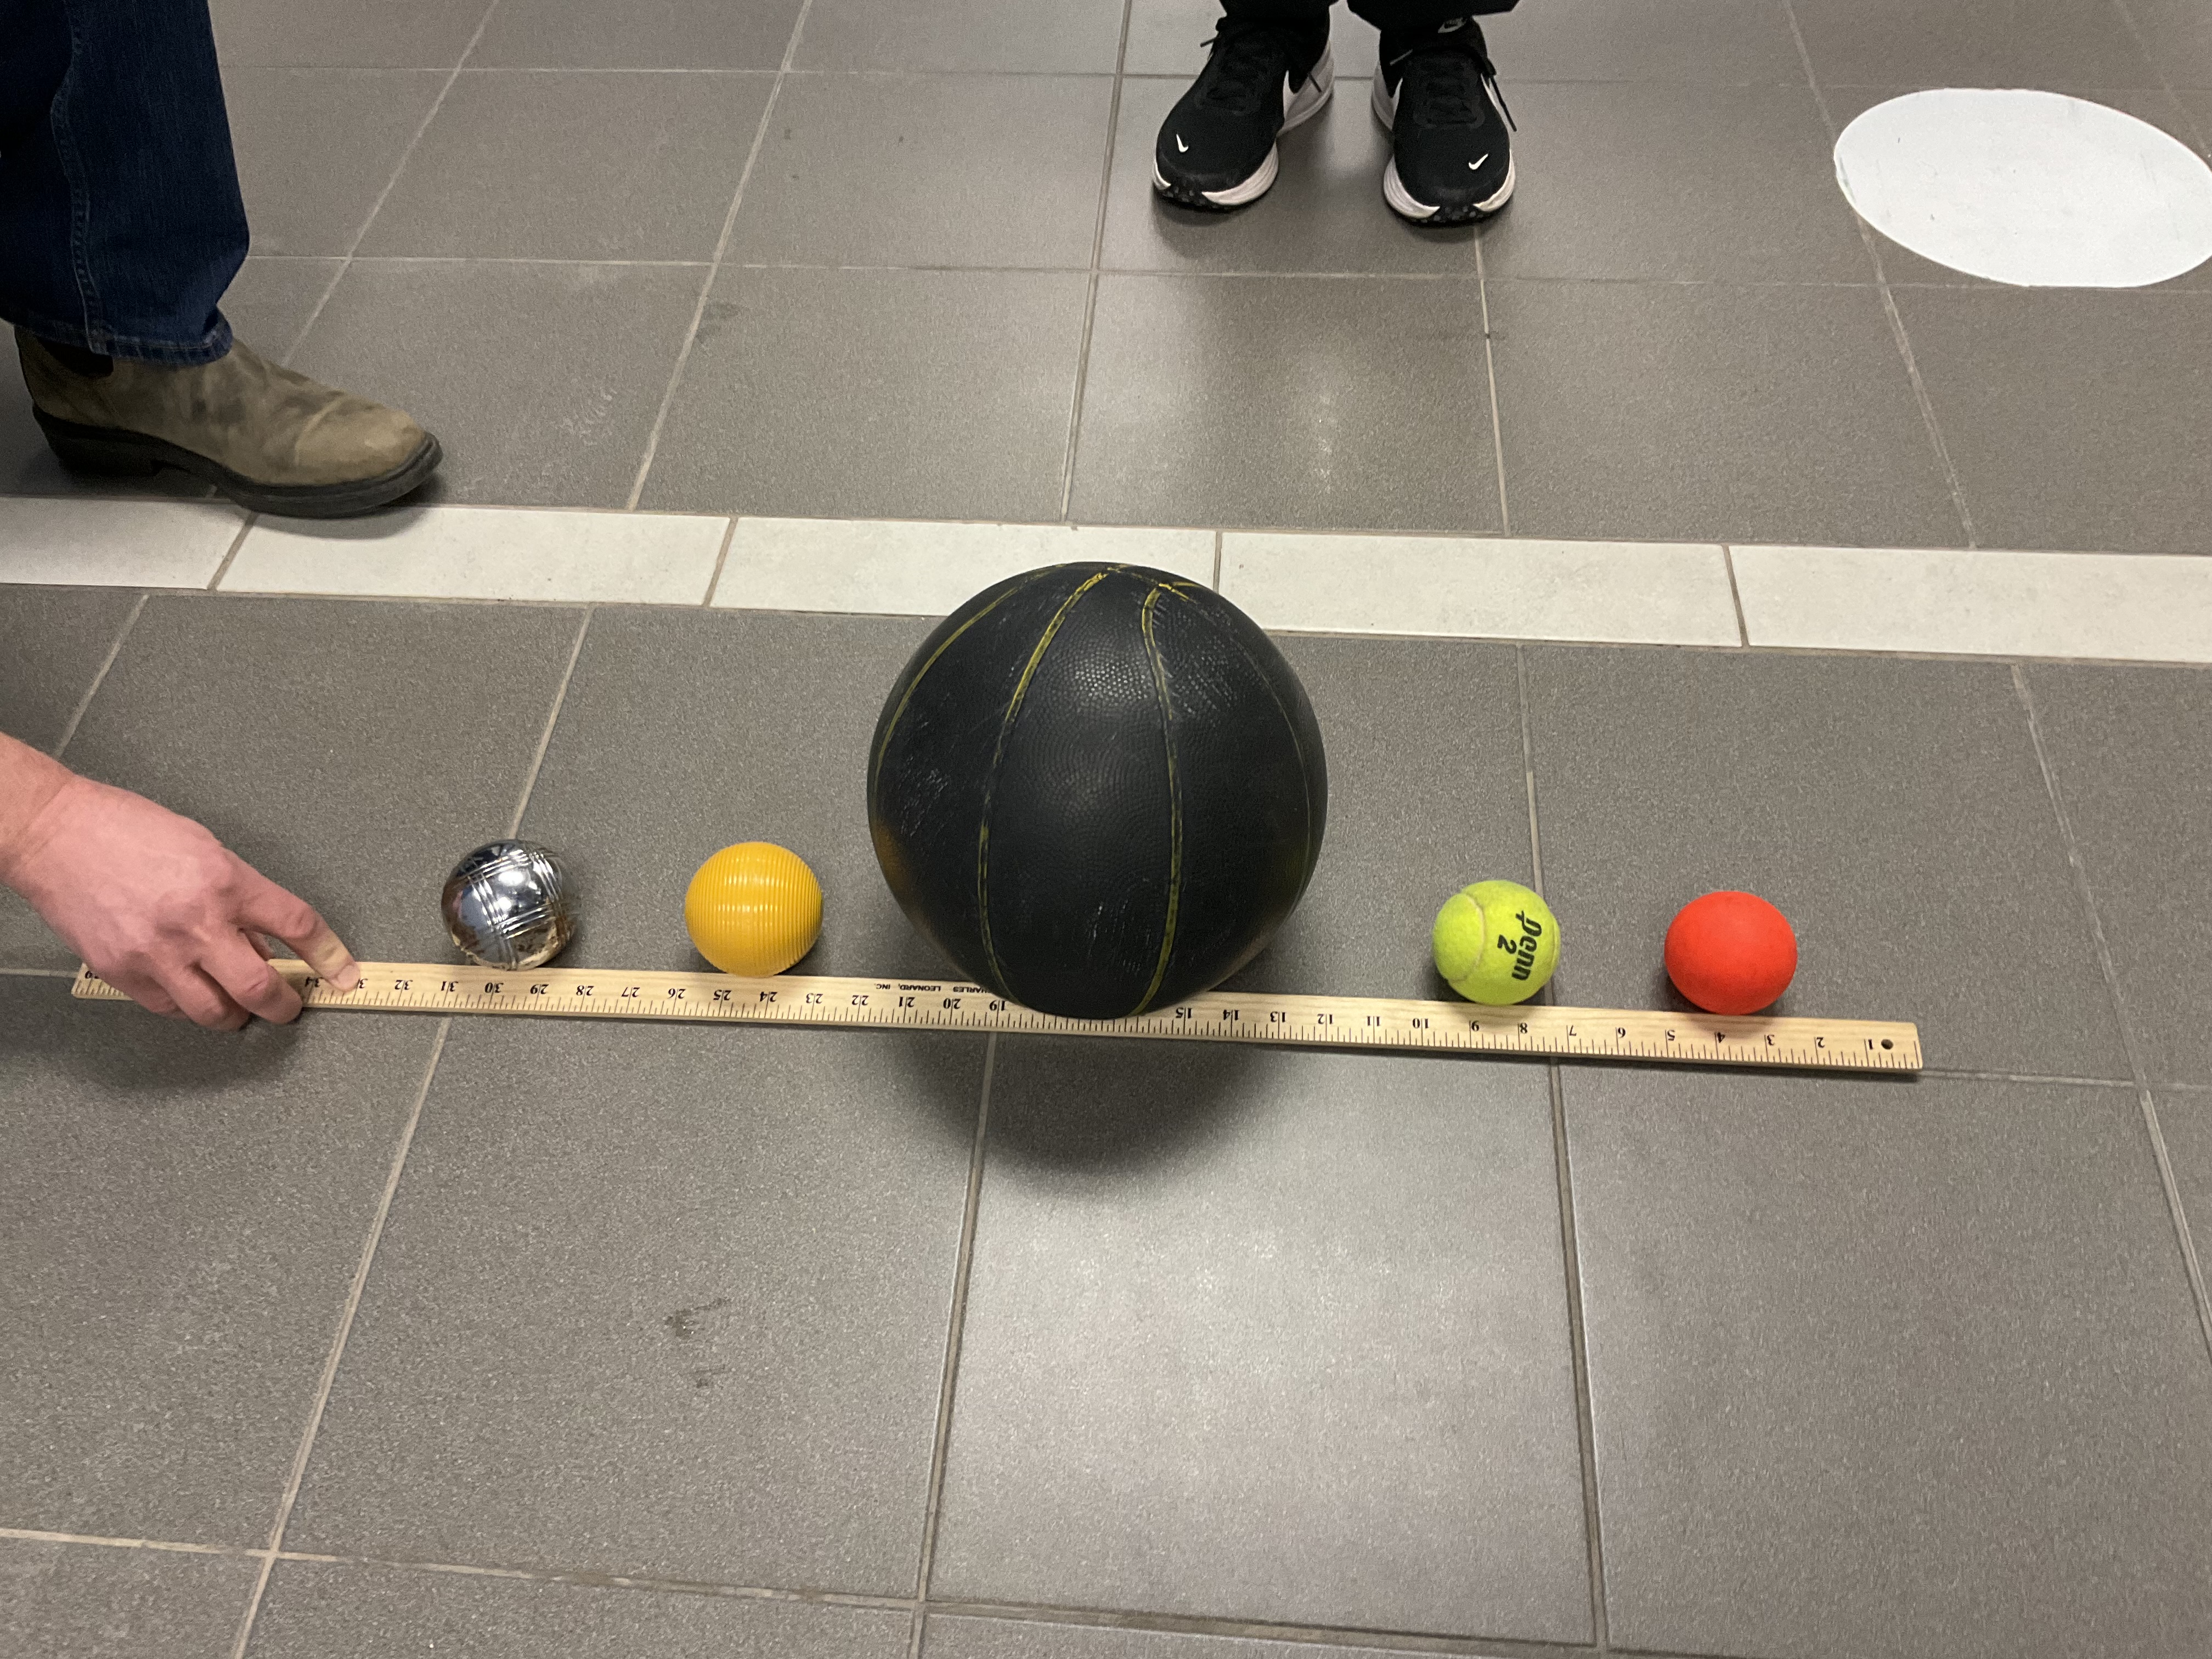
They didn’t roll in straight lines which may impact results slightly. Our order of finishers was: metal bocce, plastic bocce, basketball, ball hockey ball, tennis ball. Nobody in the class guessed the correct order!
We also noticed that the times that we got from our linear predictions were off. We had predicted that it would take more time than it did for the balls to finish the race, so that’s more proof that the graphs are non-linear.
Many thanks for everyone helping to make this a smooth activity! Students worked really hard.
Heat Loss House day 3
The houses were running all night, with their little furnaces keeping them at a temperature of 30 degrees. We came together today to learn the results, and to see where there are leaks by using a thermal imaging camera.
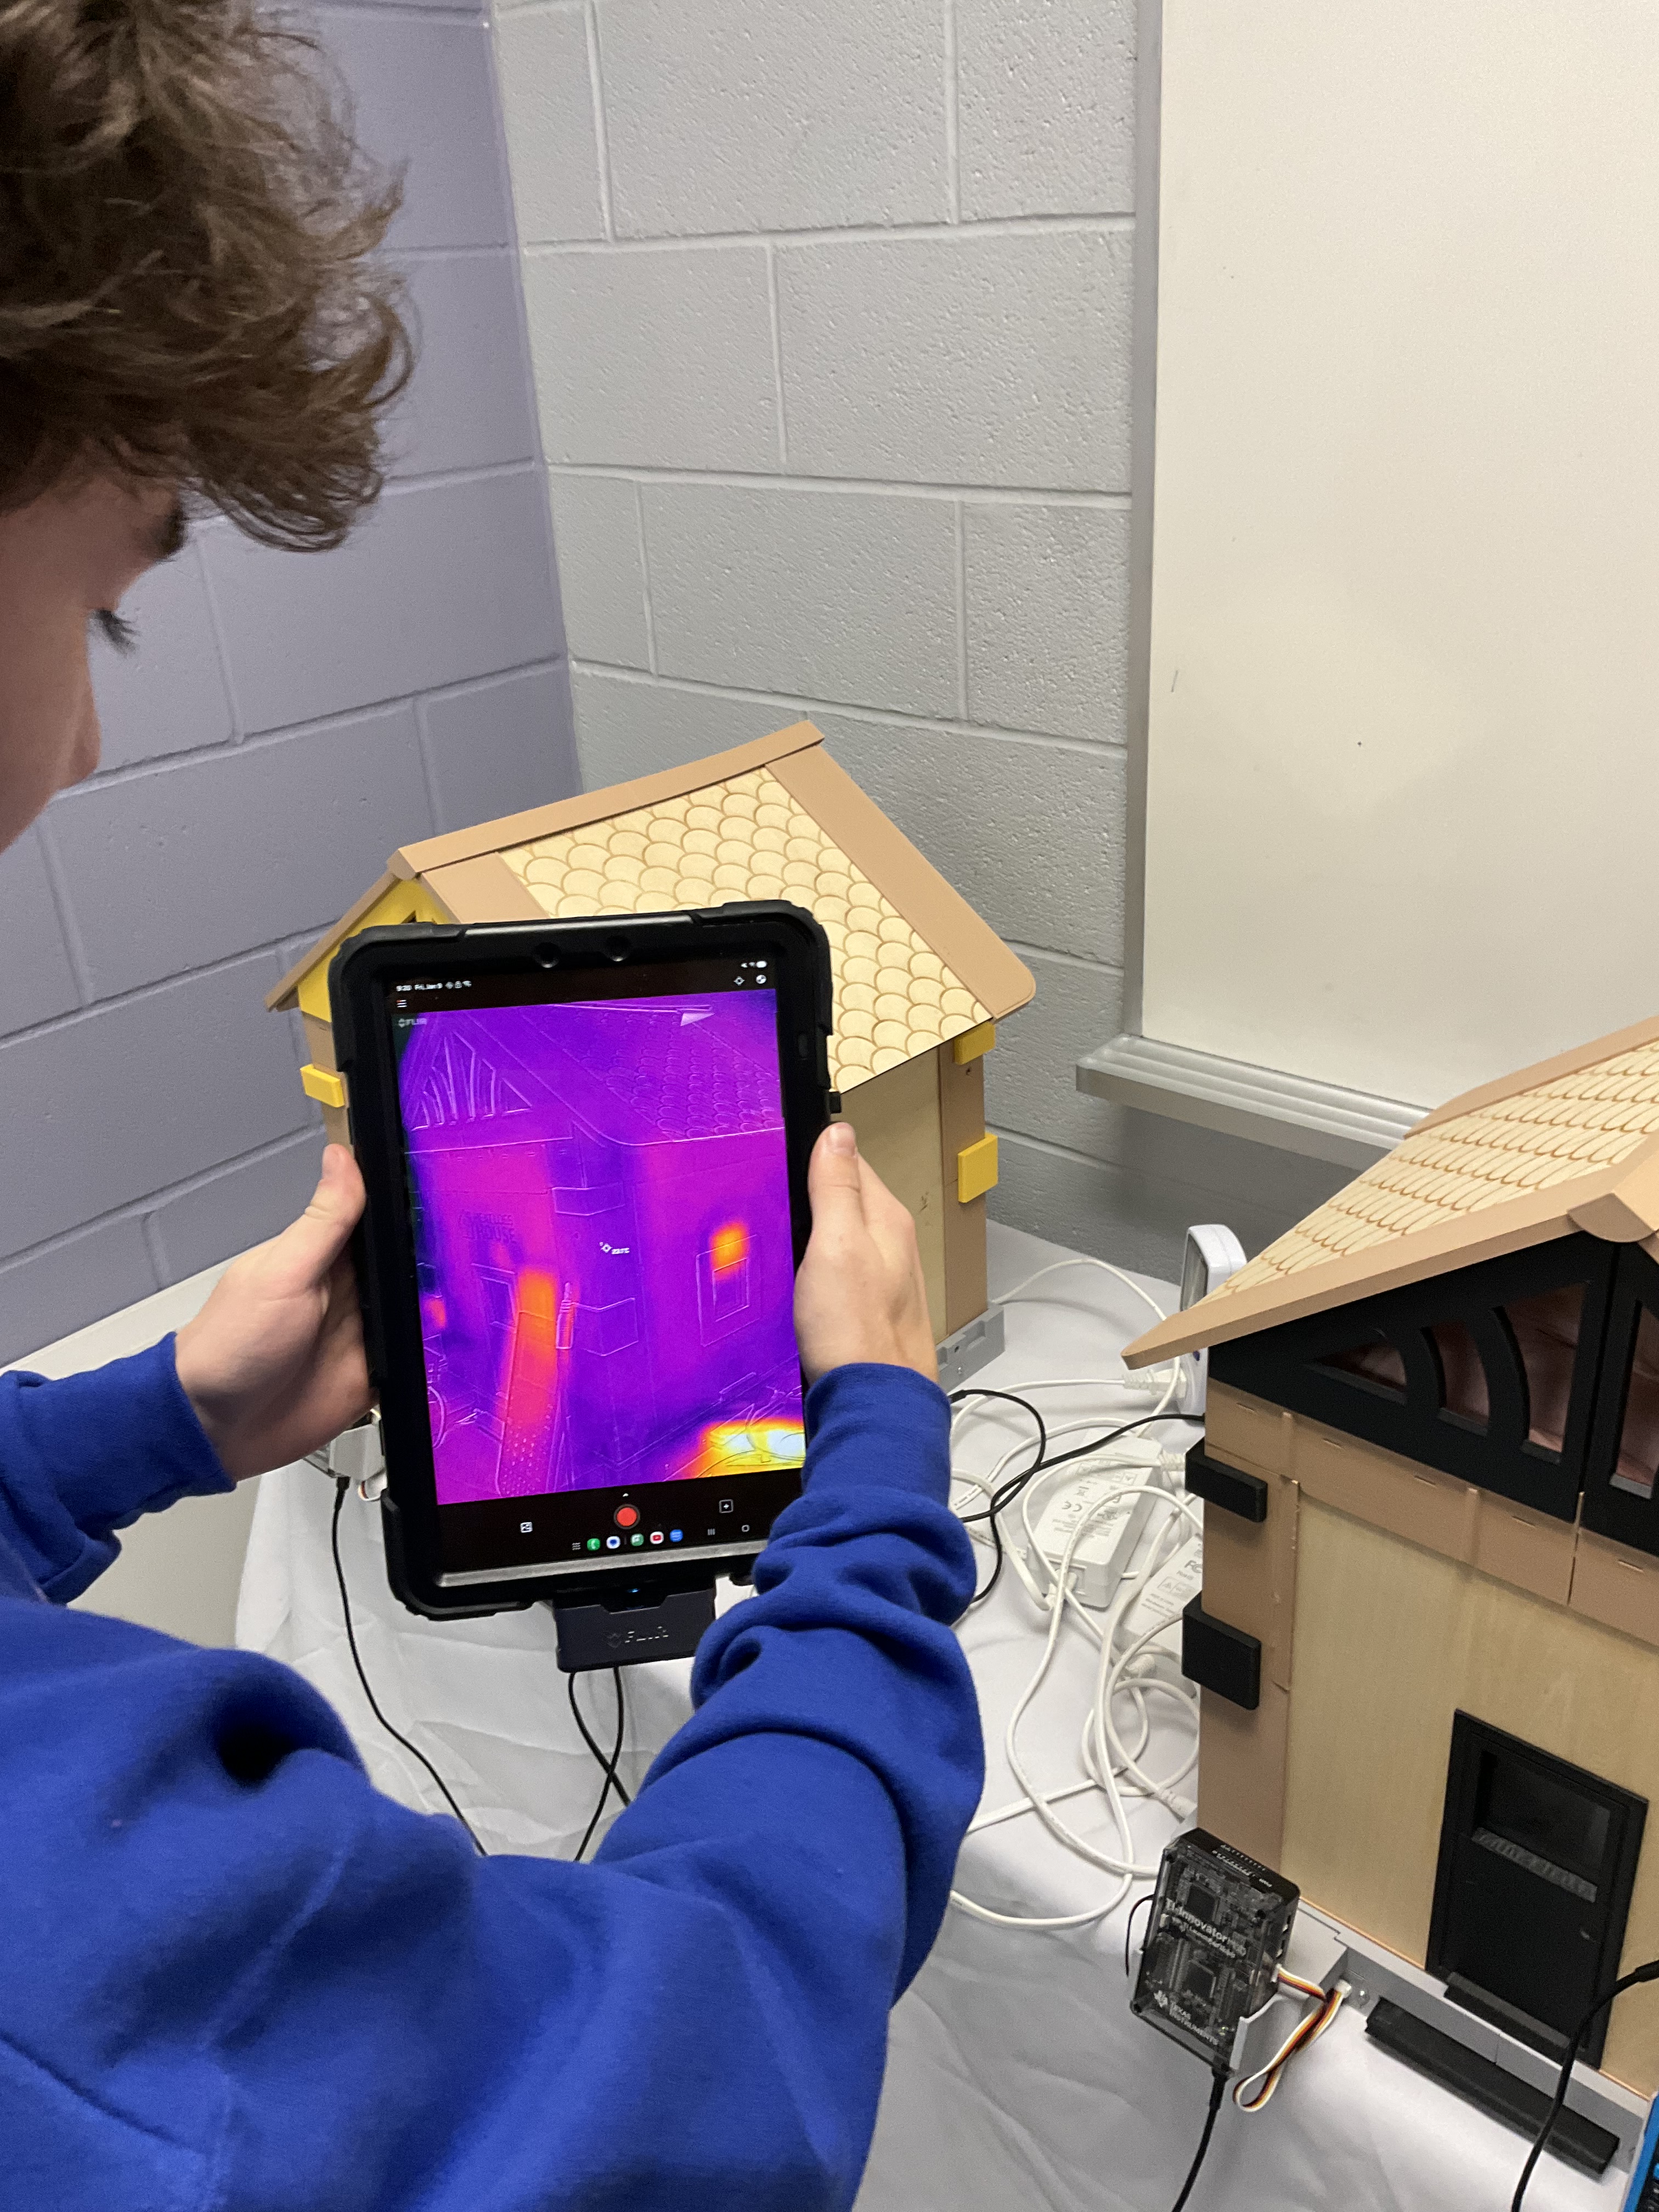
We learned about how insulation and windows affect houses in the real world, and how we might use a thermal imaging camera to find leaks in our own house. We learned about how a water leak by a windowsill could lead to fibreglass insulation compacting and sliding down inside the wall, and causing a big cold spot.
We learned about how any watt saved is good because we are burning fossil fuels to produce much of our energy and that contributes to the greenhouse effect, and climate change. We also saw how this house project has been on the road to Indigenous communities last year and hopefully is helping raise awareness of insulation and helping communities make good choices about home repair options.
There were many houses that were very well insulated and performed well, but one group won the prize. Good job Red Team!
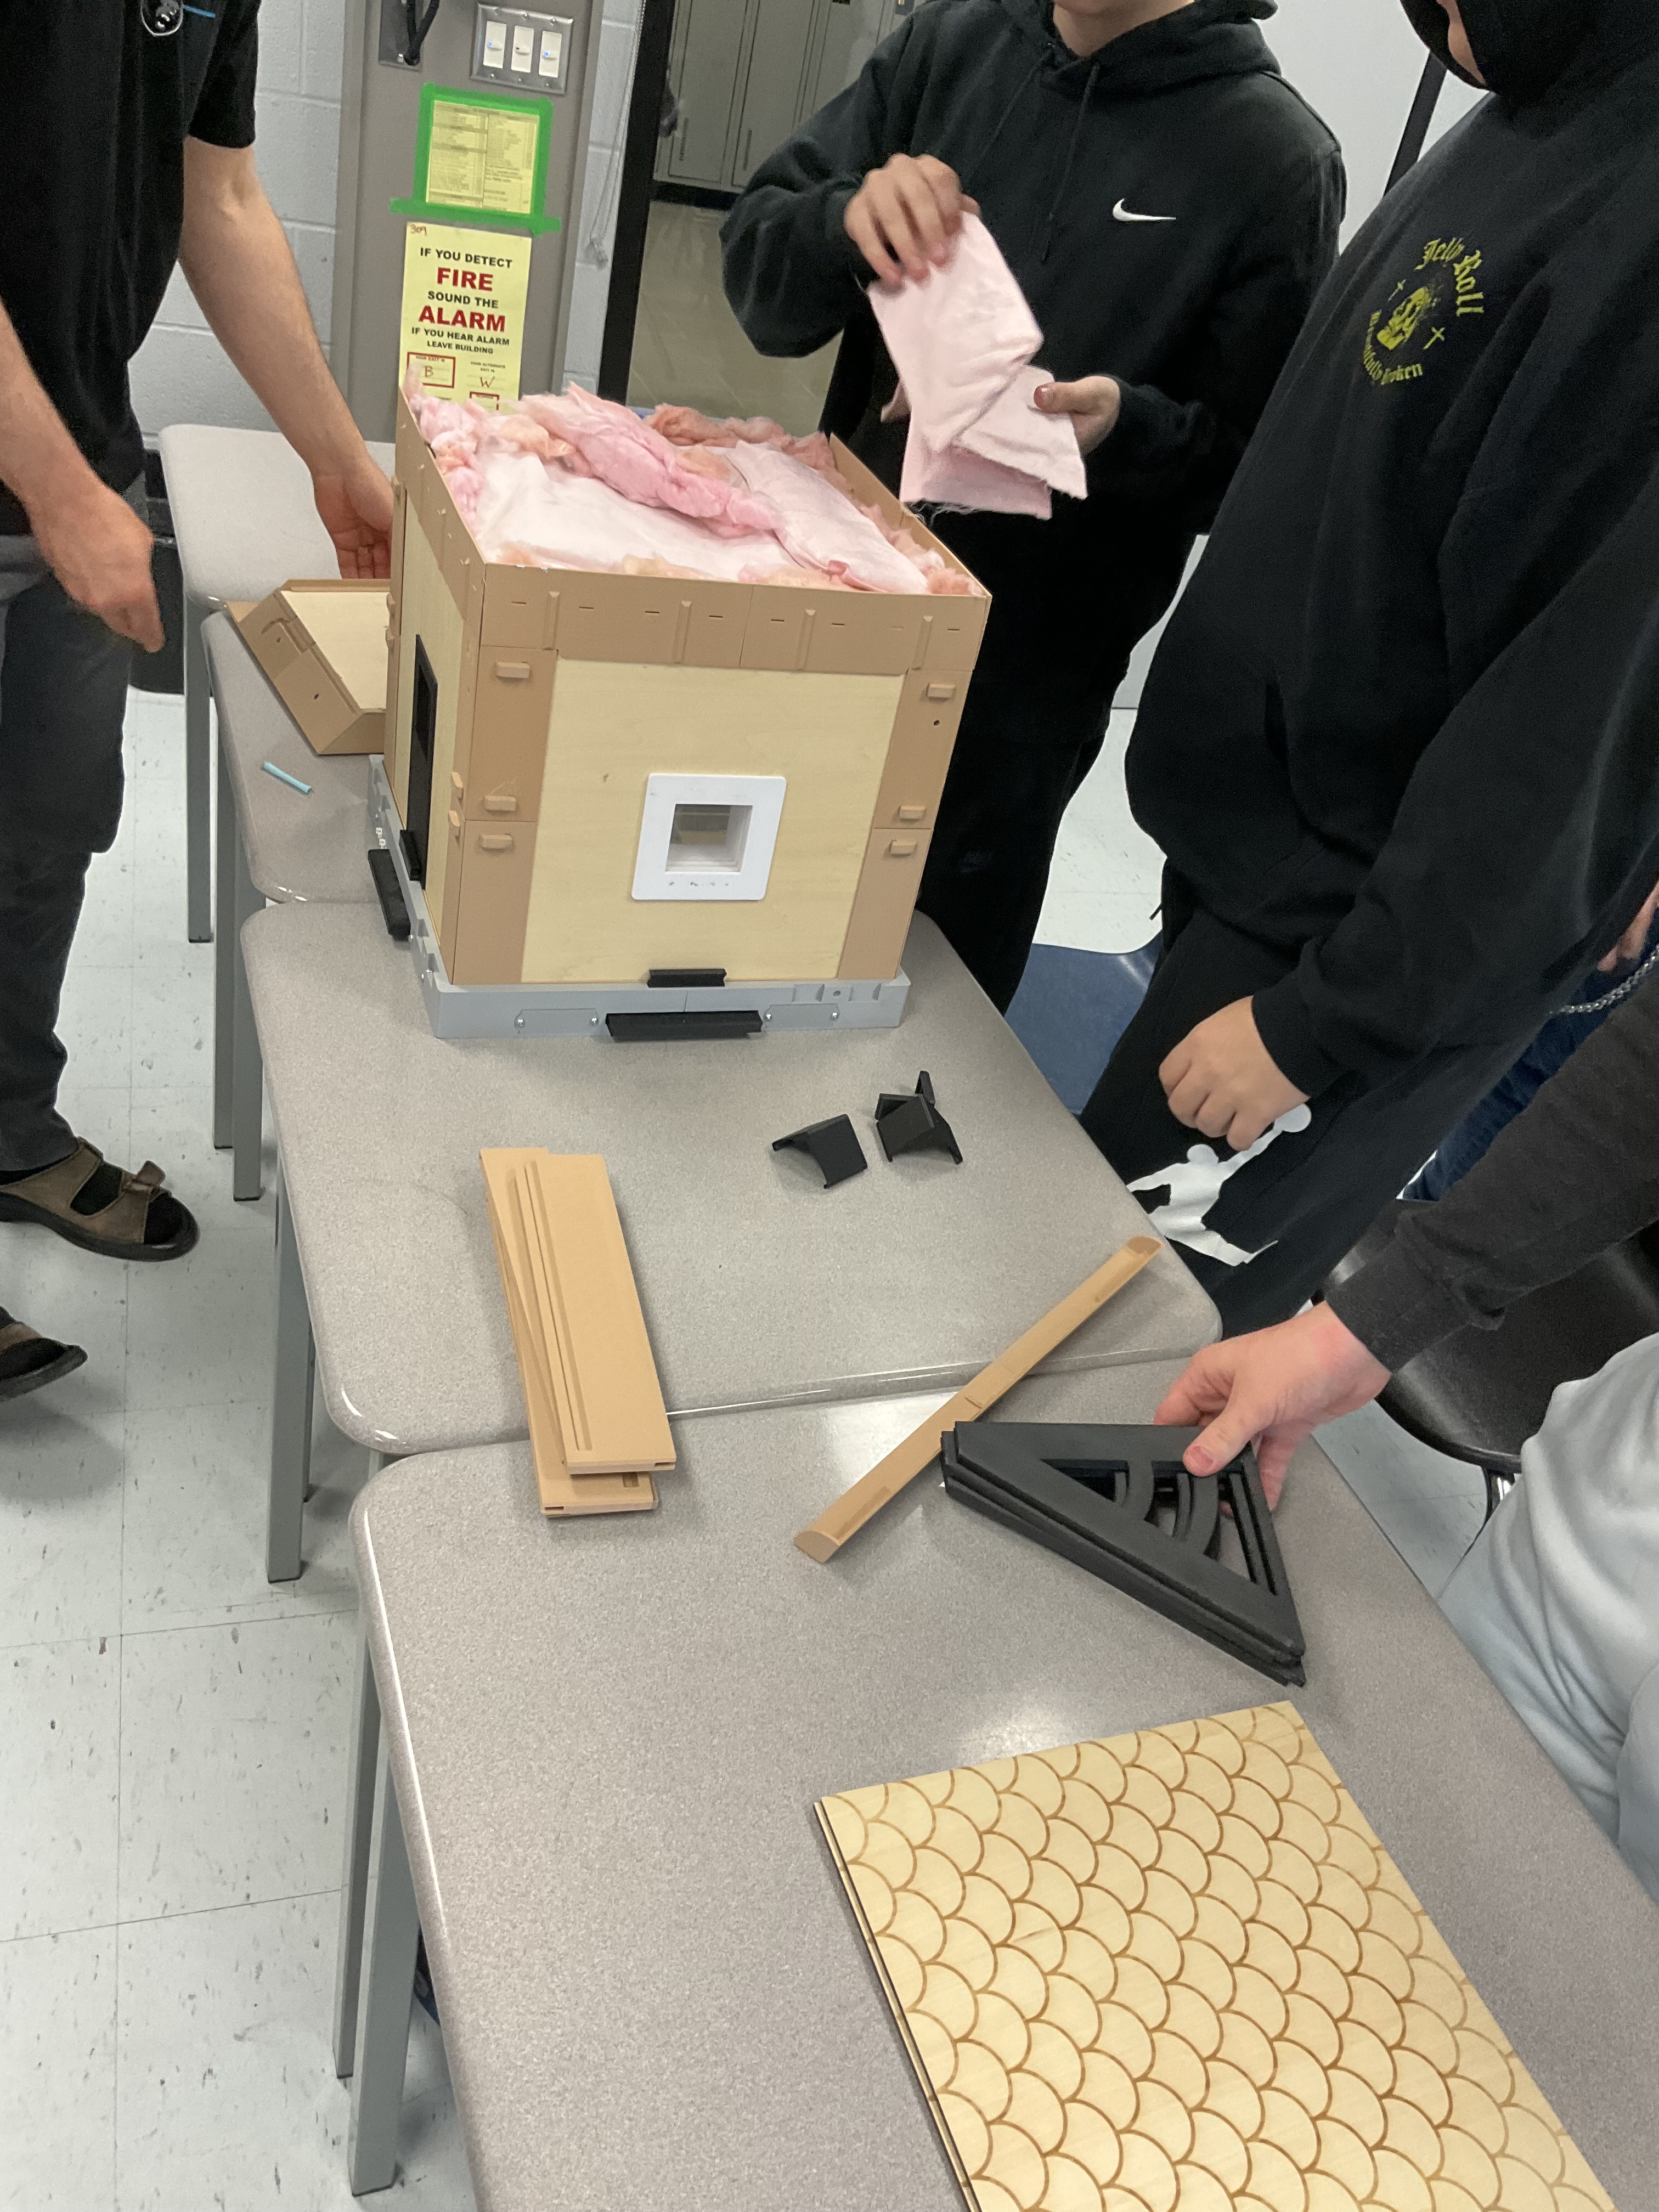
We took apart the houses in the end, so they can be used at another school.
Many thanks to the Heat Loss House Project for sharing their knowledge with us as we went through this 3 day task.
Ramp Race Day 2
Today we got to work with our ramps, finishing up all of the data collection and averages.
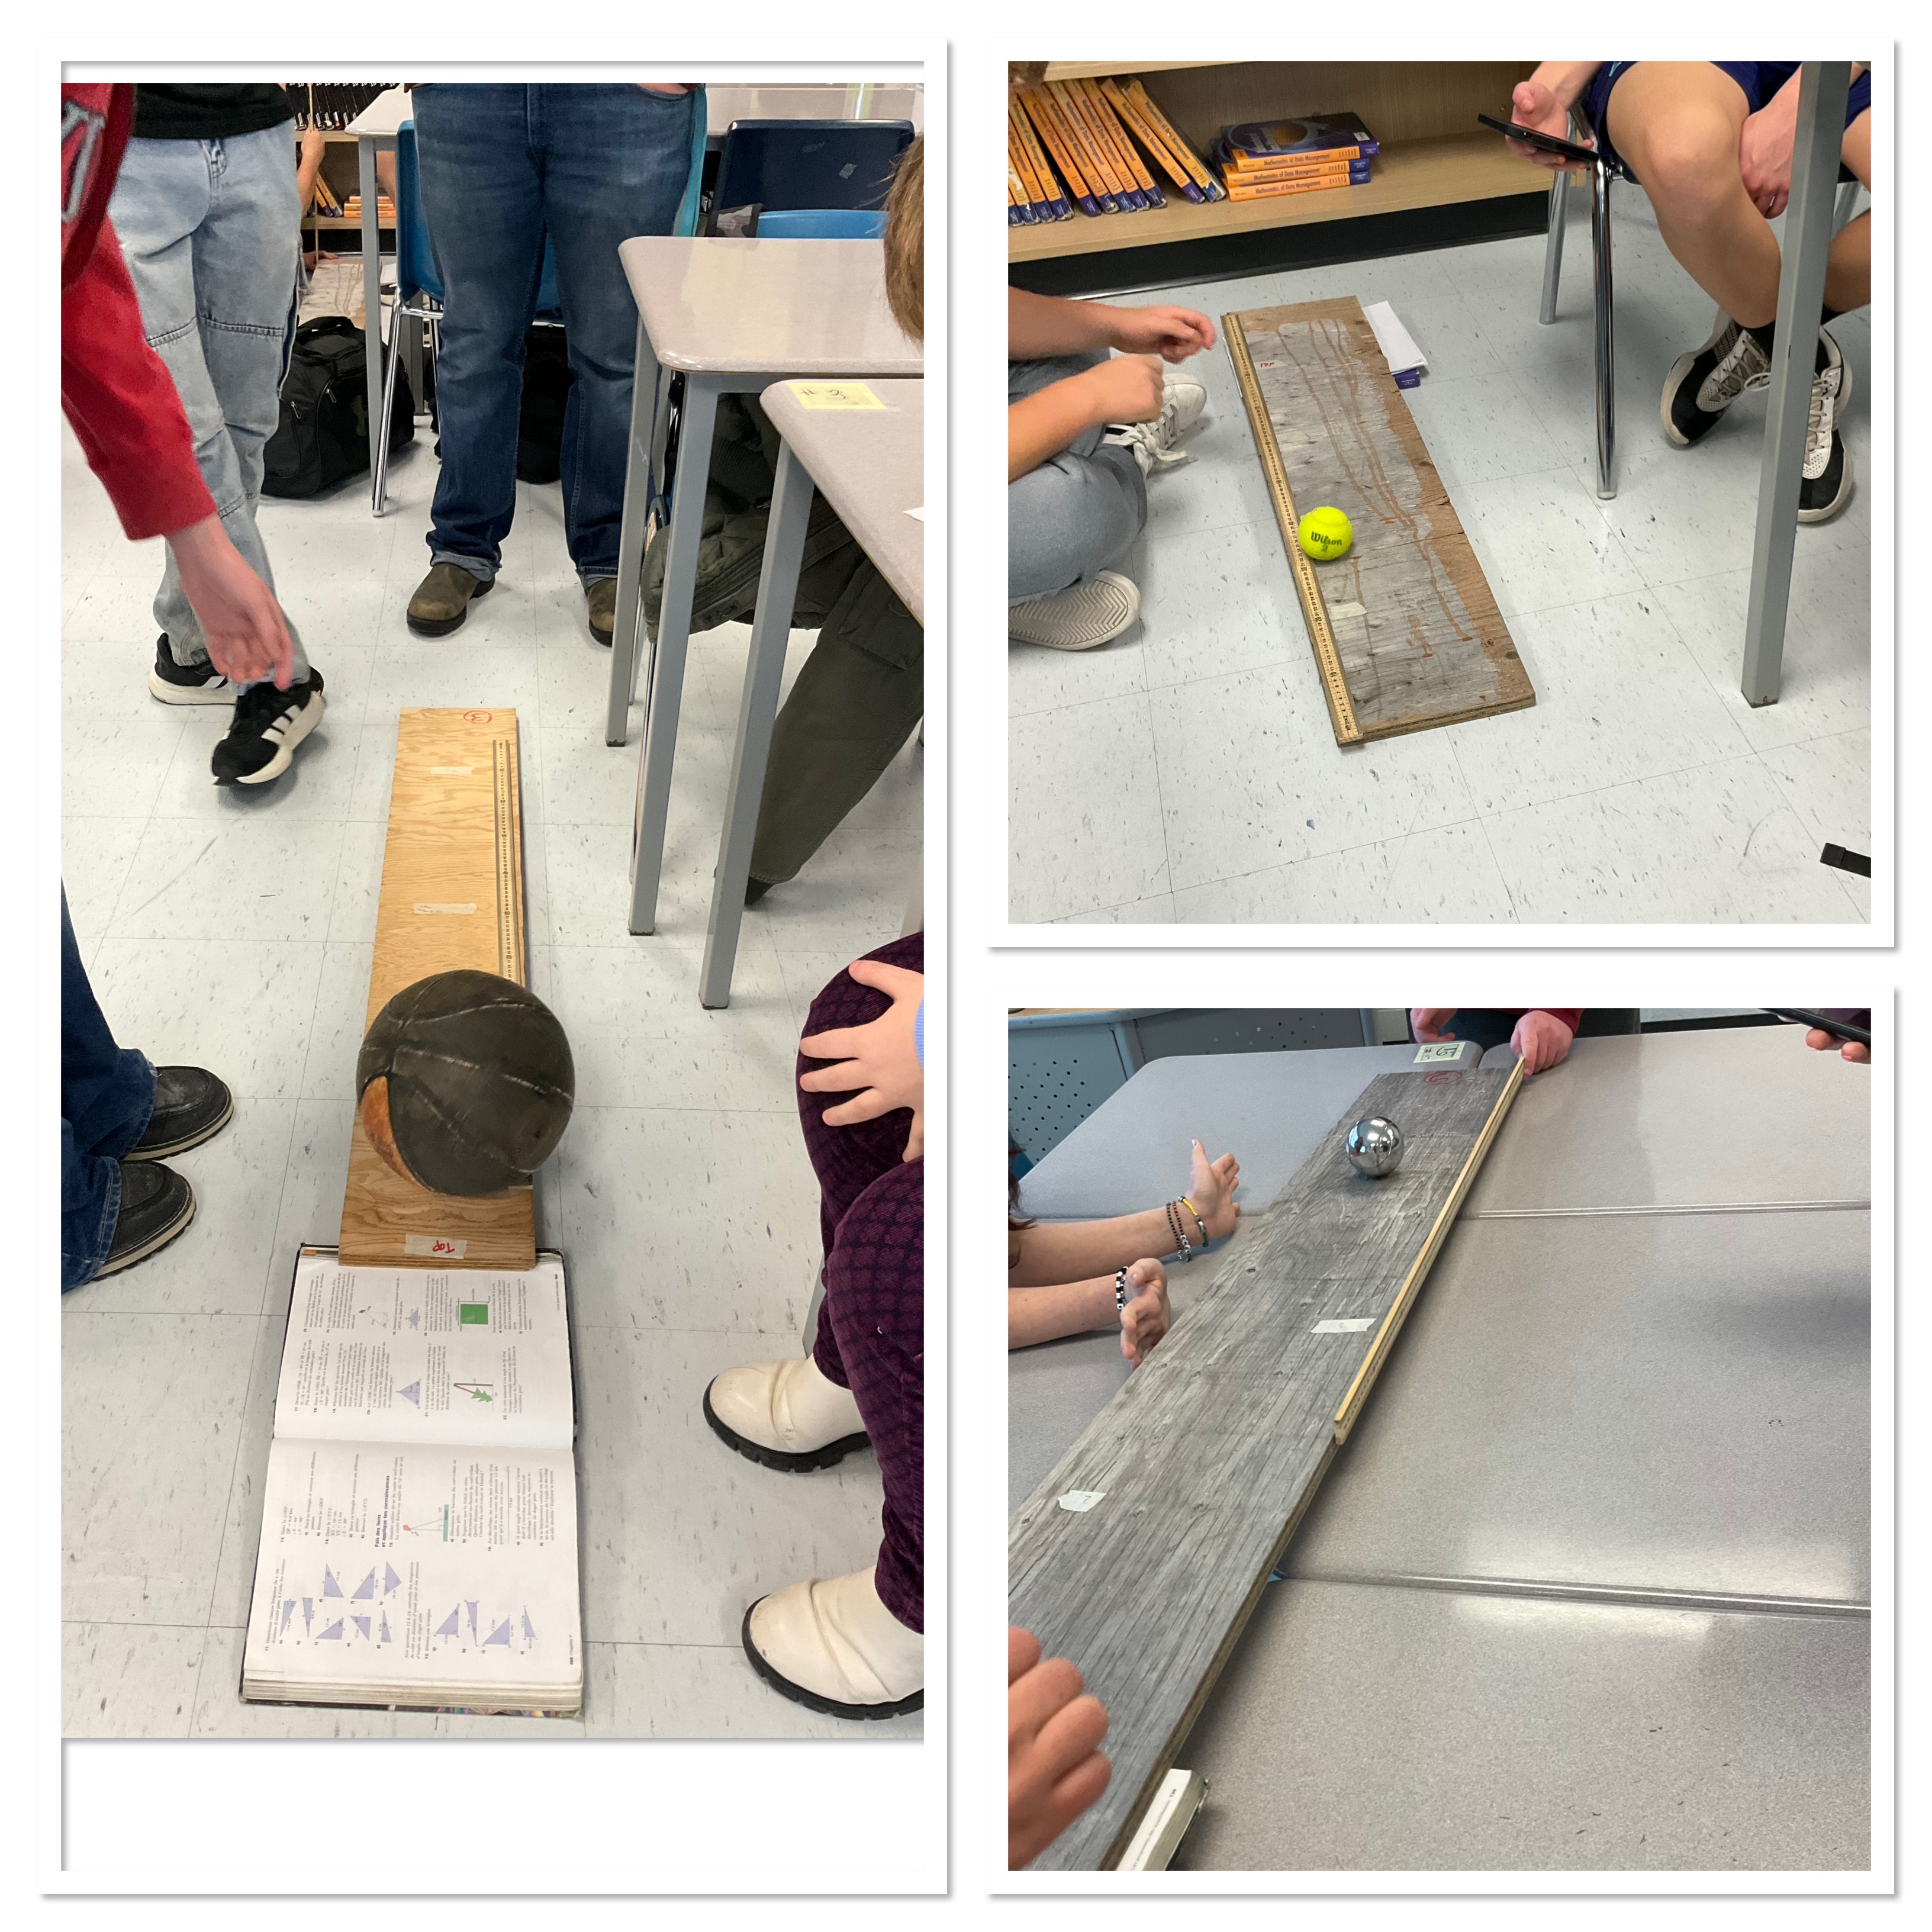
We looked at the data to see if it seemed linear or non-linear, and tried to model the data.

We used Desmos to help with our models. From the data for most groups a linear model seemed to work.
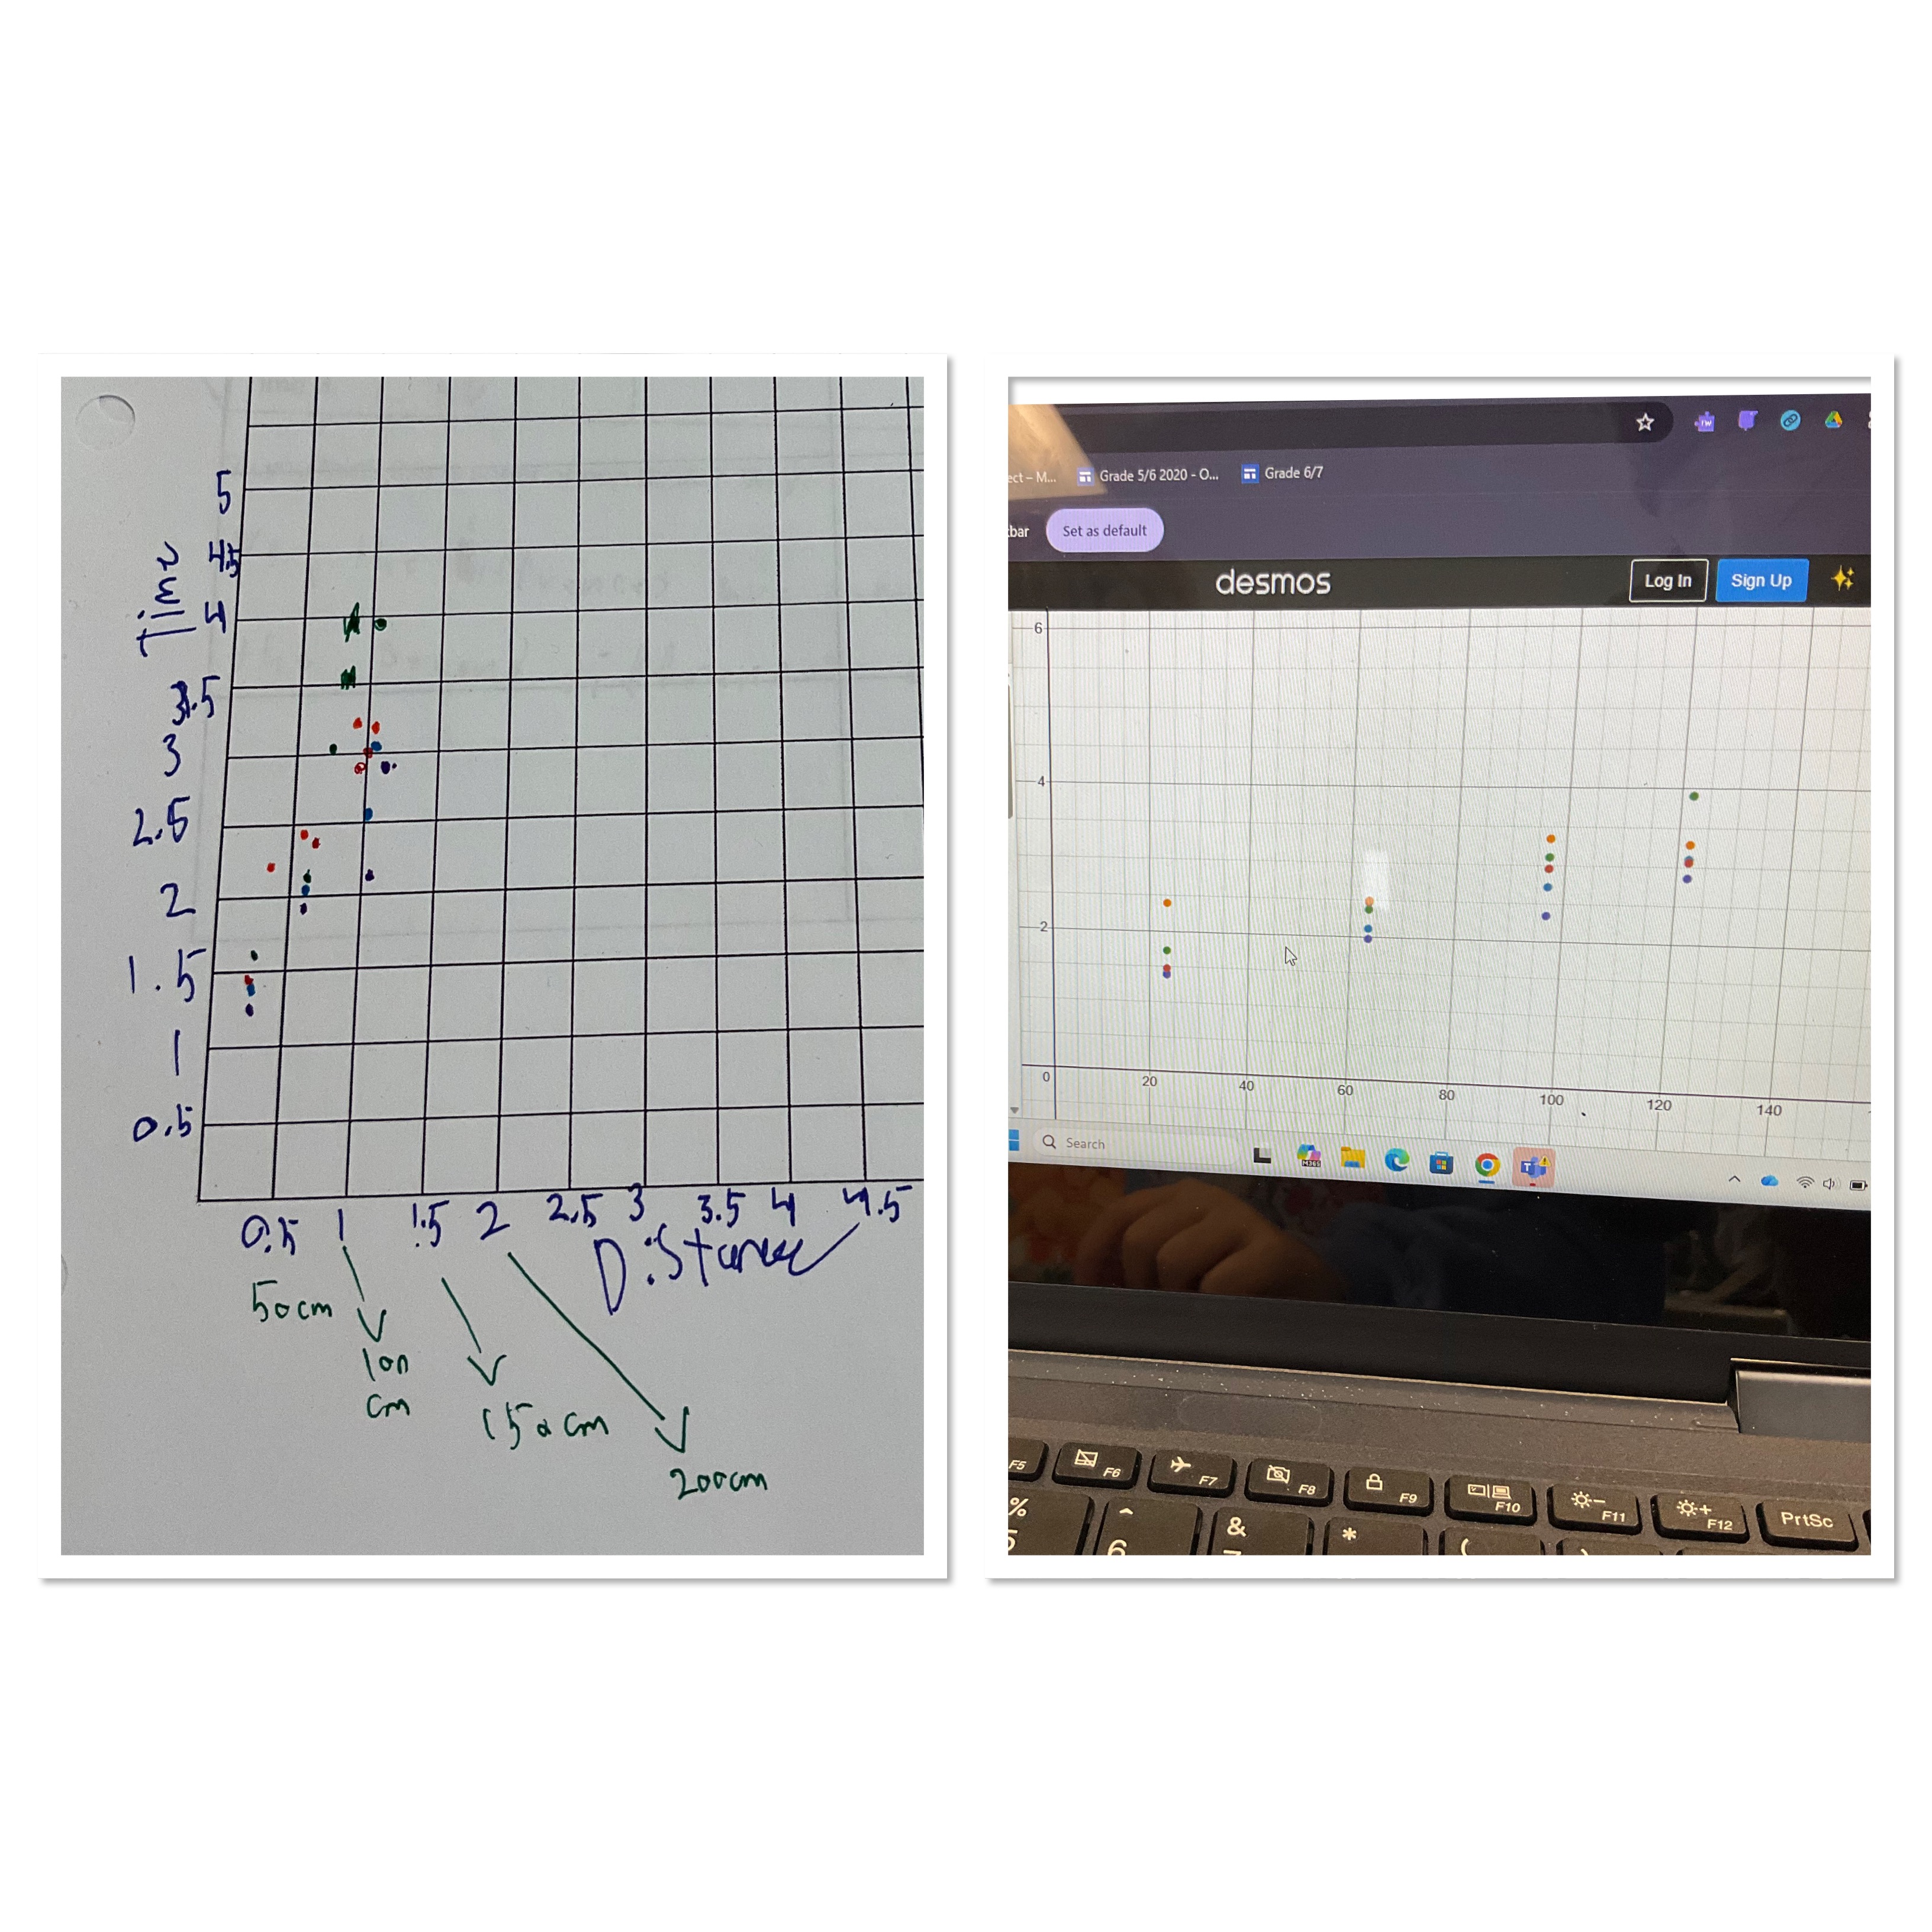
There are a few challenges we’ve noticed. Some of our boards are not straight, so for some, the tennis ball will stop part way down the ramp, because the ramp momentarily goes up. For next time we’d try to get thick boards that wont curve, and to check that they are as straight and flat as possible. We also noticed that the timing can cause some challenges. Since the ramps are short, a small error in timing will be a big percentage of the time value that we get, which is likely why our data is looking linear-ish. Having only 4 points for each ball also might not be enough to see a real trend. In any case, we’re going with the idea that they might be close enough to be linear.
Groups are using Desmos to get lines of best fit, and then Monday they are going to make predictions about how long it will take for the ball to go down the 8m ramp. We’ll hopefully be able to get the final race done on Monday as well, and we can use the final results to evaluate our models to see if the real world race is modelled by linear equations, or whether it might be more complex.
Many thanks to Pathways to Education for sending a grad connector to help with some of the groups. This is a task that takes a lot of coordination and checking in. We are much more on task now than we were in September though which is a great development.
Ramp Race Day 1
Today we are starting our culminating task inspired by Al Overwijk (blog)
We have a 3 degree ramp at our school that is 8 meters long. We are going to race 5 different balls down the ramp. To predict which one will win, we are modelling the ramp in our classroom with 6 different lengths of board.
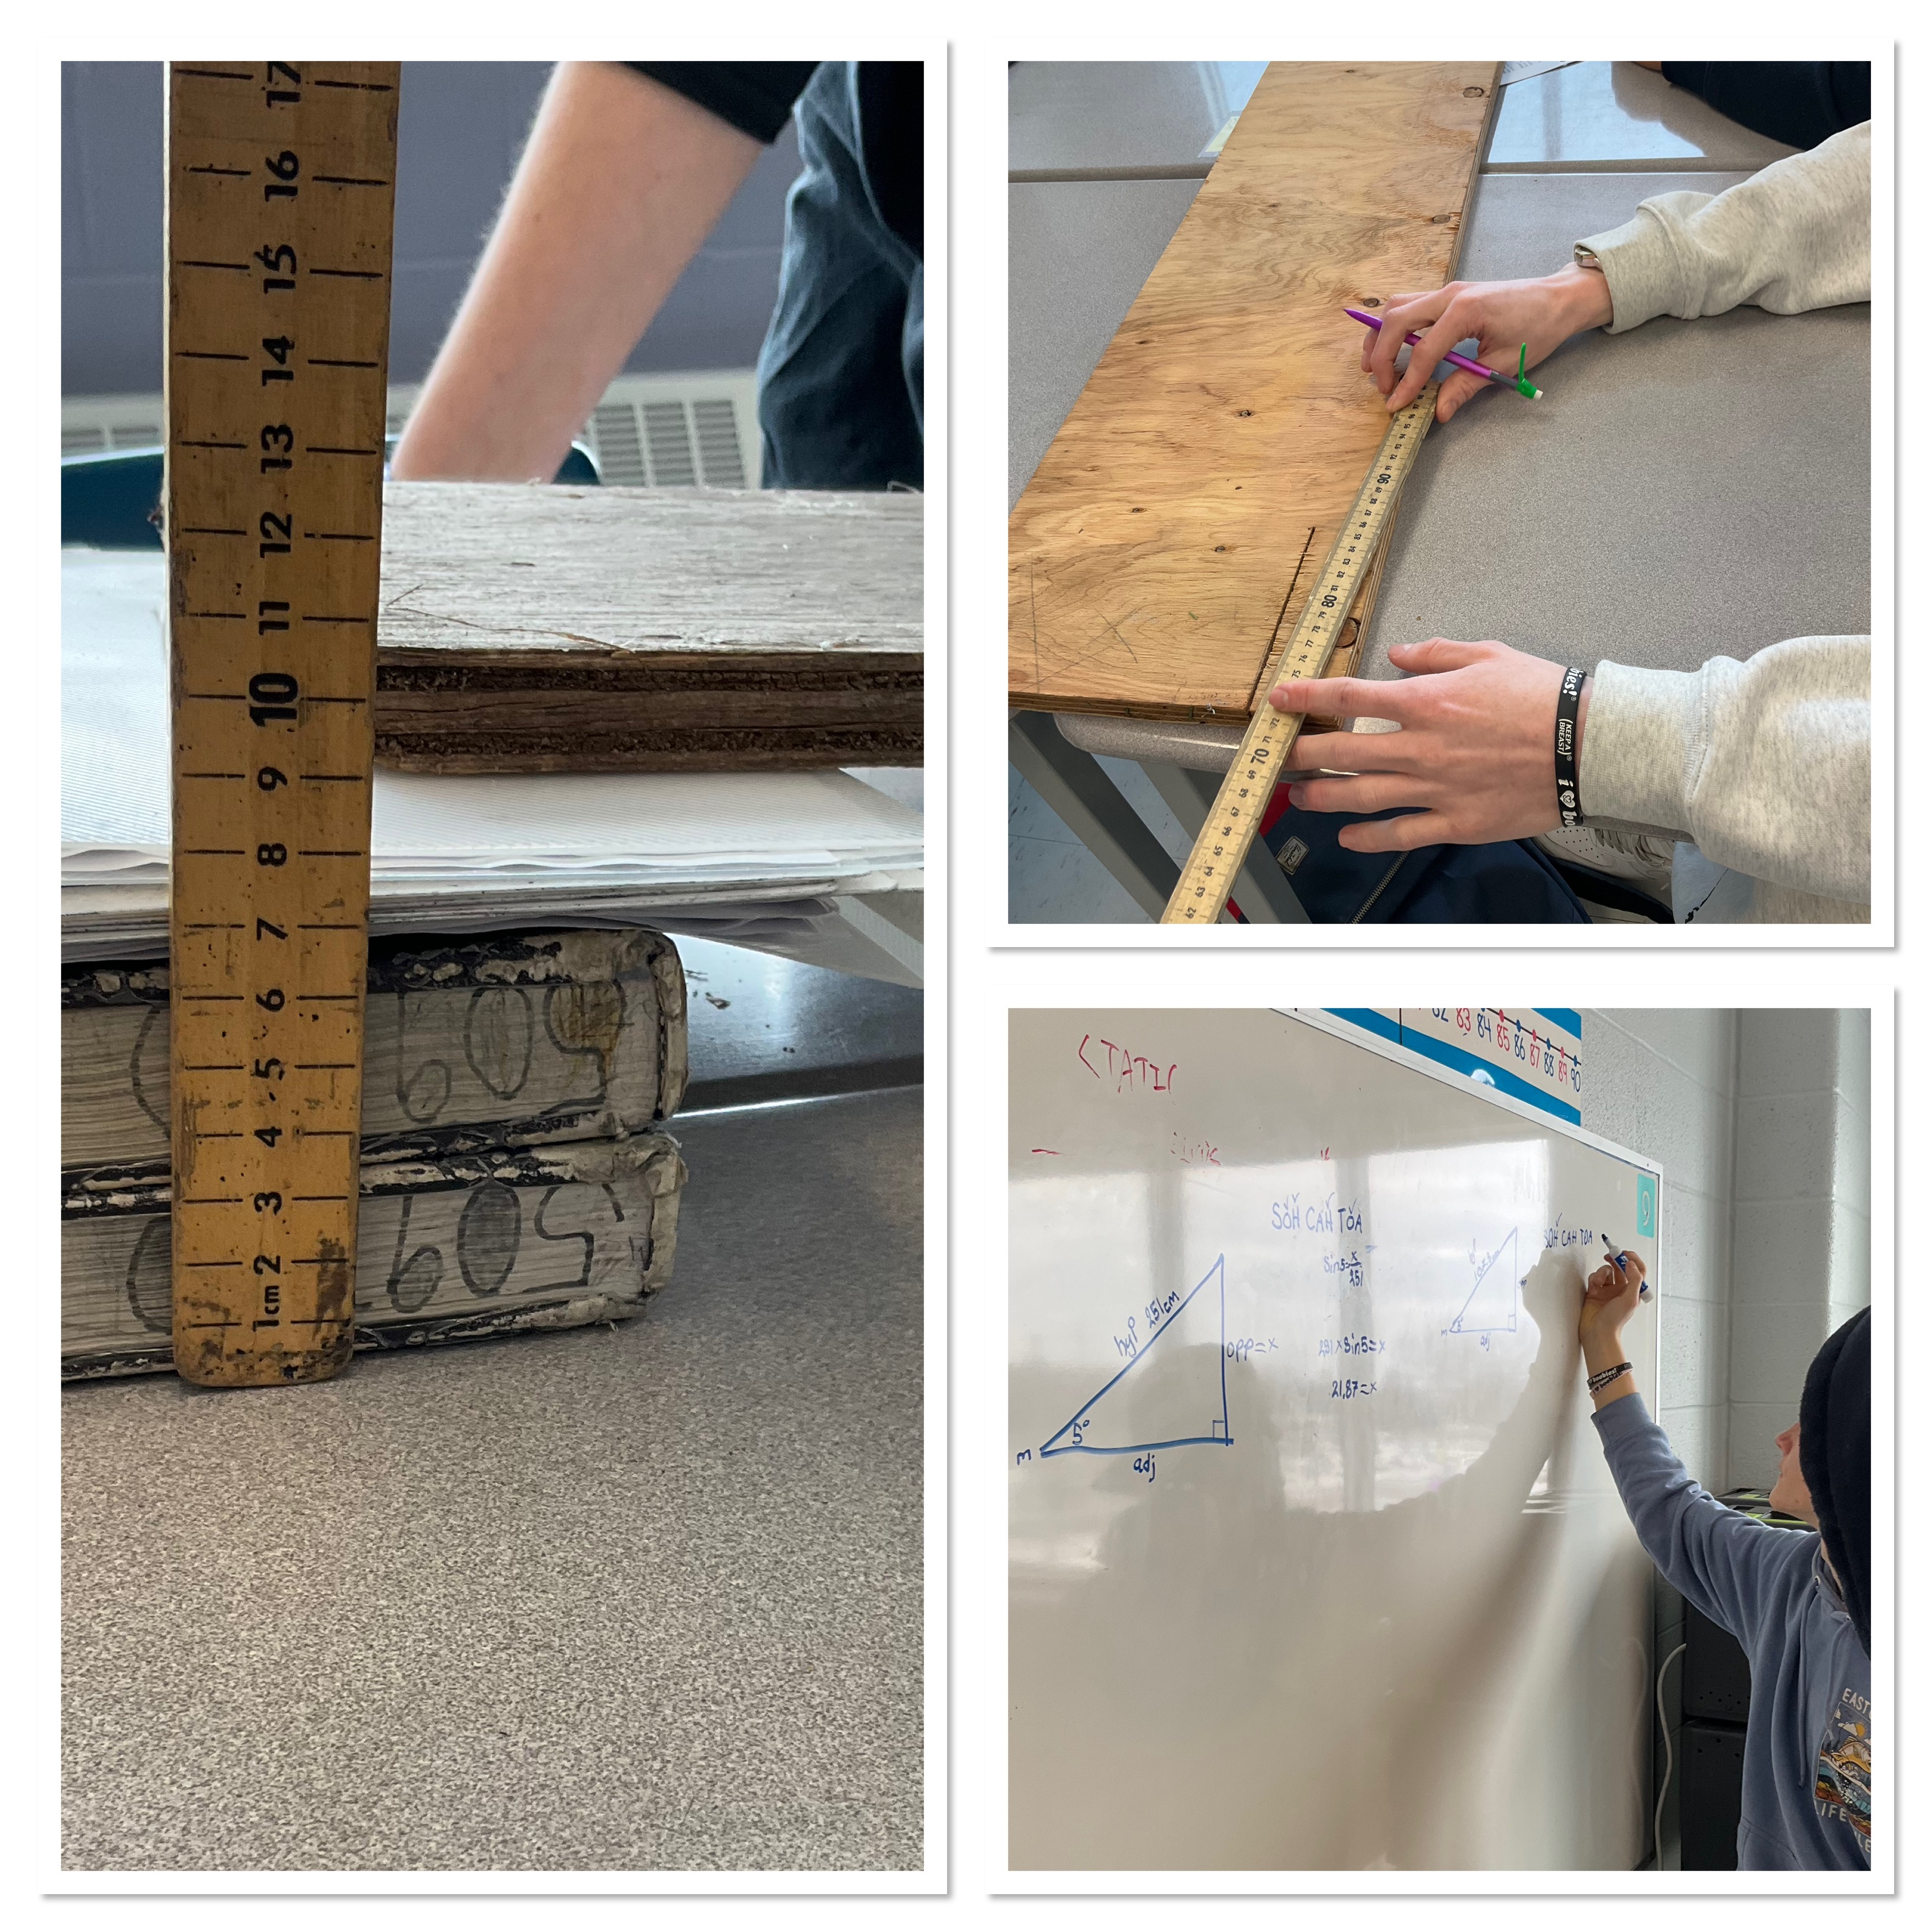
We had to calculate how high up the rise should be. We had to figure out how to elevate the board, and keep it stable.
Once the ramp was made, we chose 4 locations along the board to start rolling the ball. Each ball will be rolled 3 times from each location and averaged.
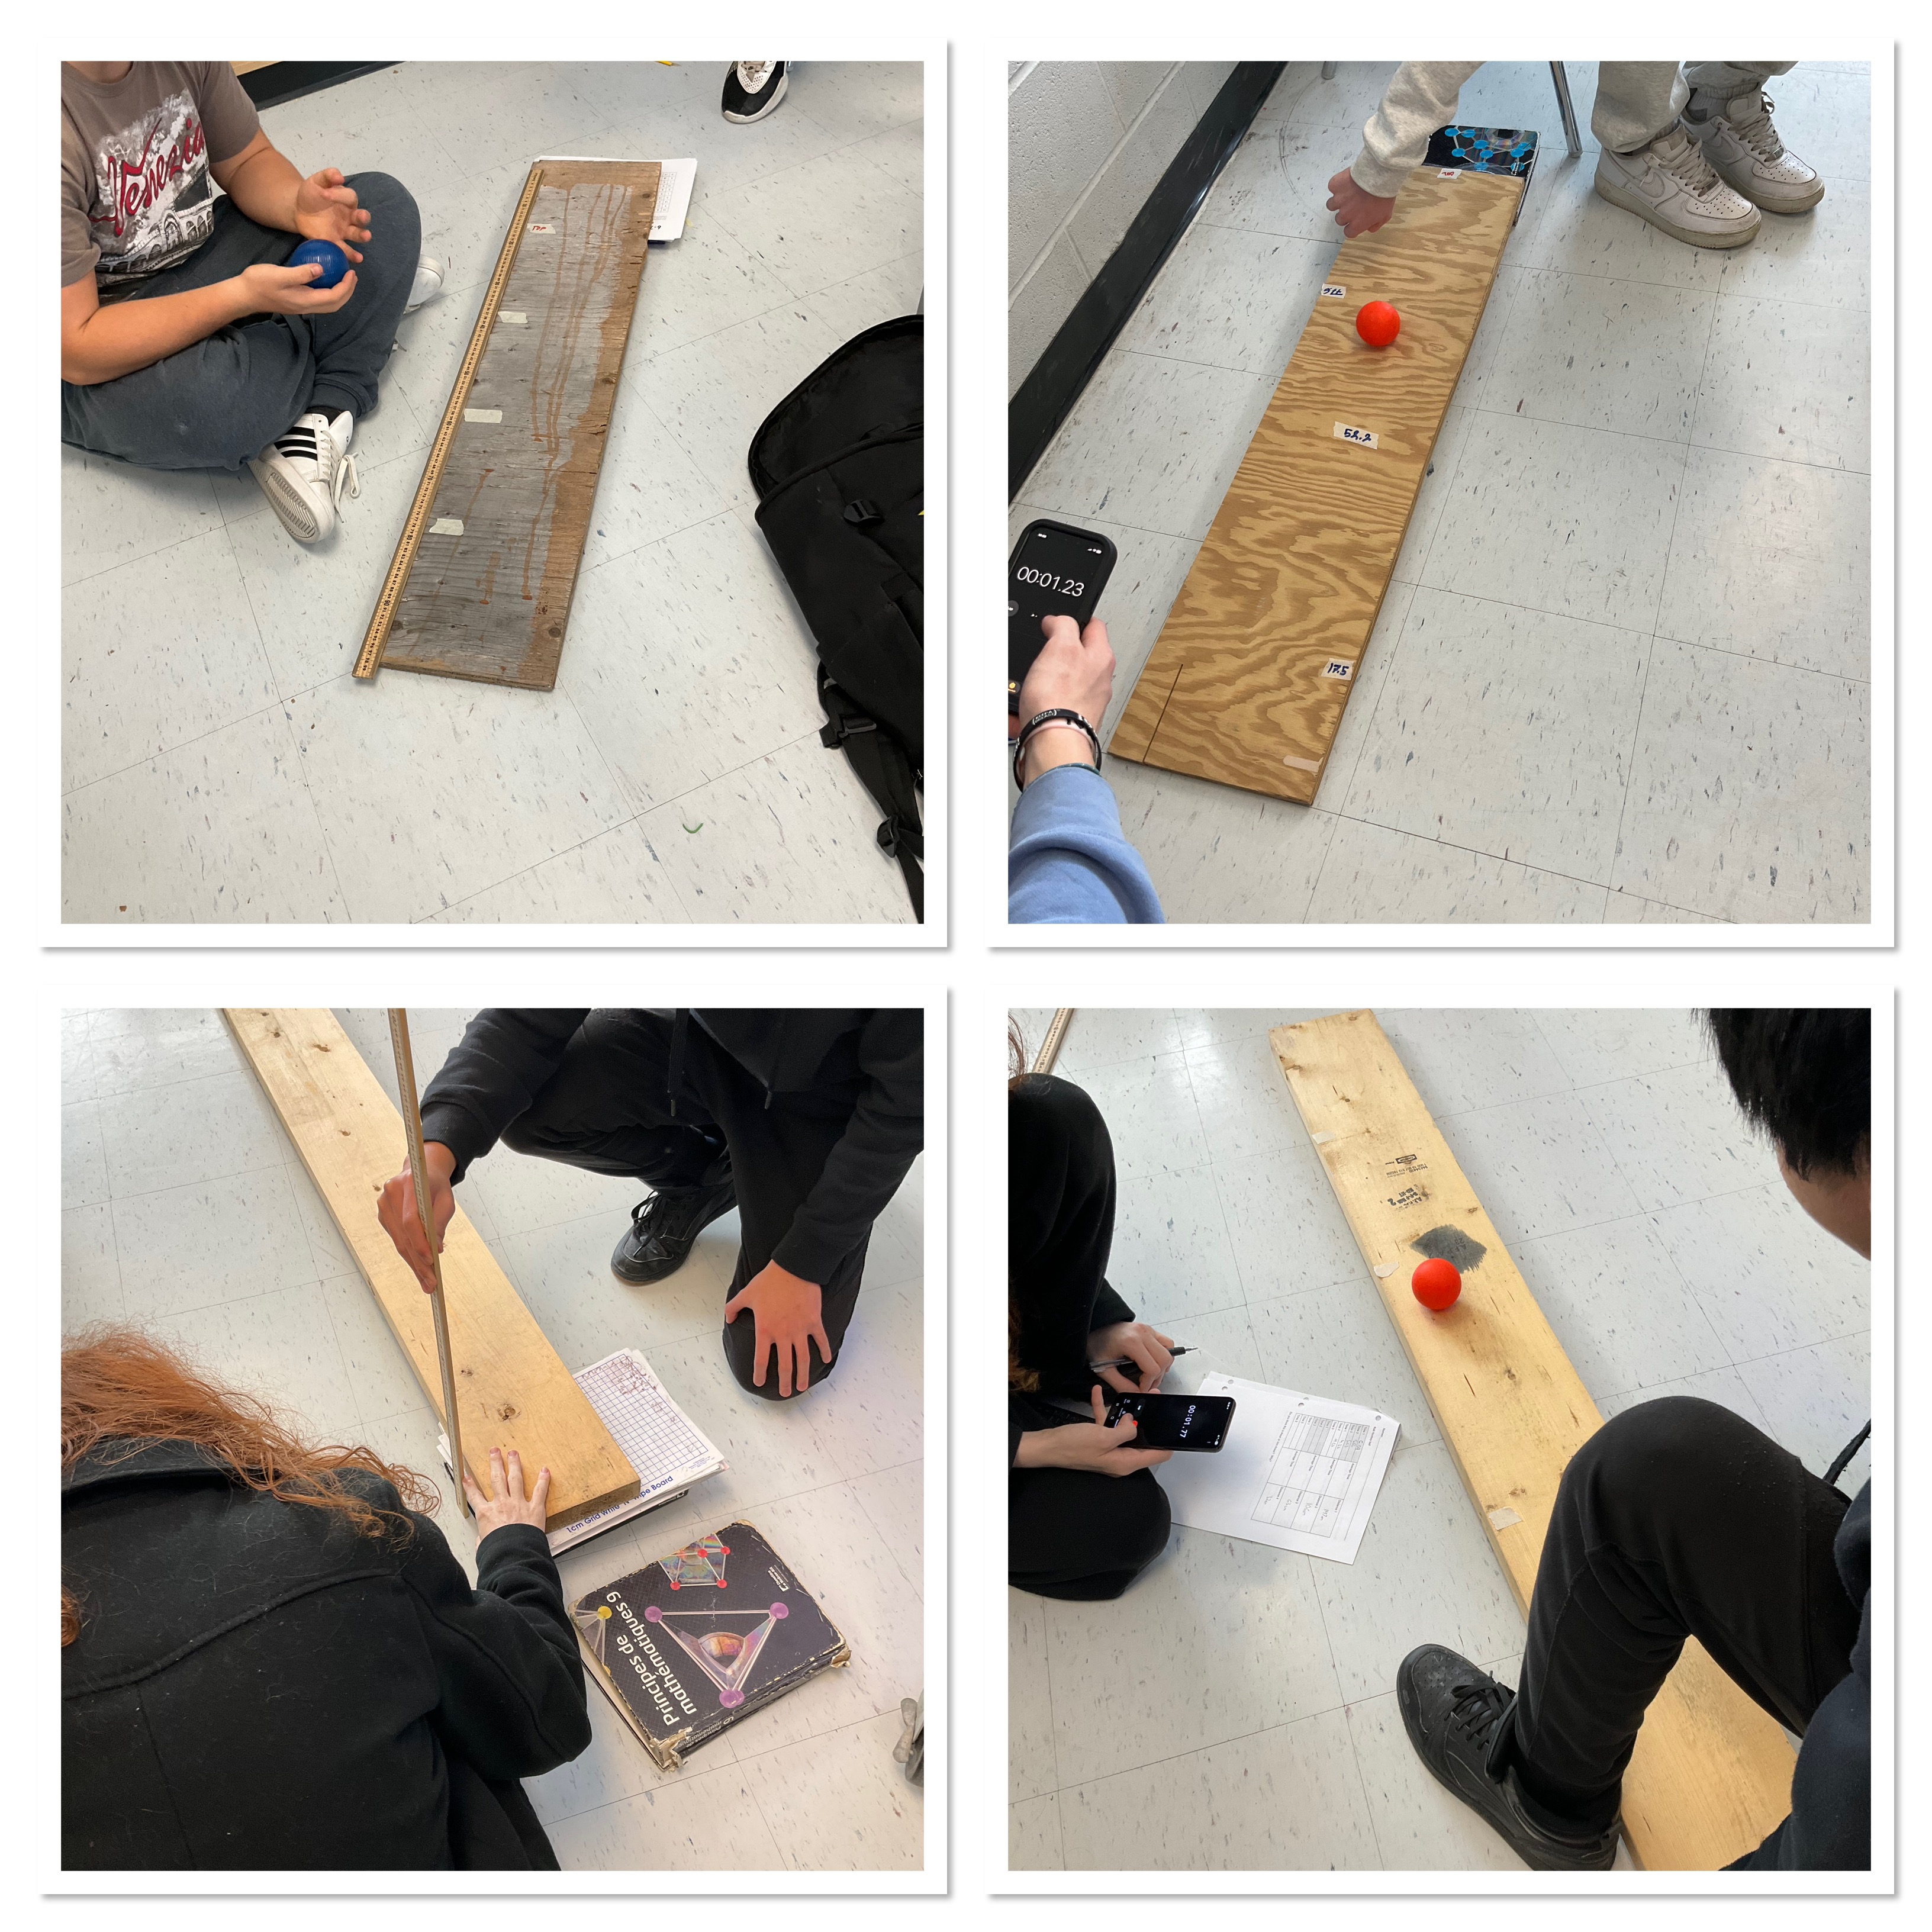
We’re busy filling data into our table of values.

We’ll keep working tomorrow, to get through testing all 5 balls at each location, then we’ll do some analysis to figure out how to model the relationships.
Heat Loss House Day 2
Day 2 of the project includes building the houses and using the insulation choices from day 1. Insulation choices were fibreglass, rockwool, or foam, and window choices were single, double or triple pane.
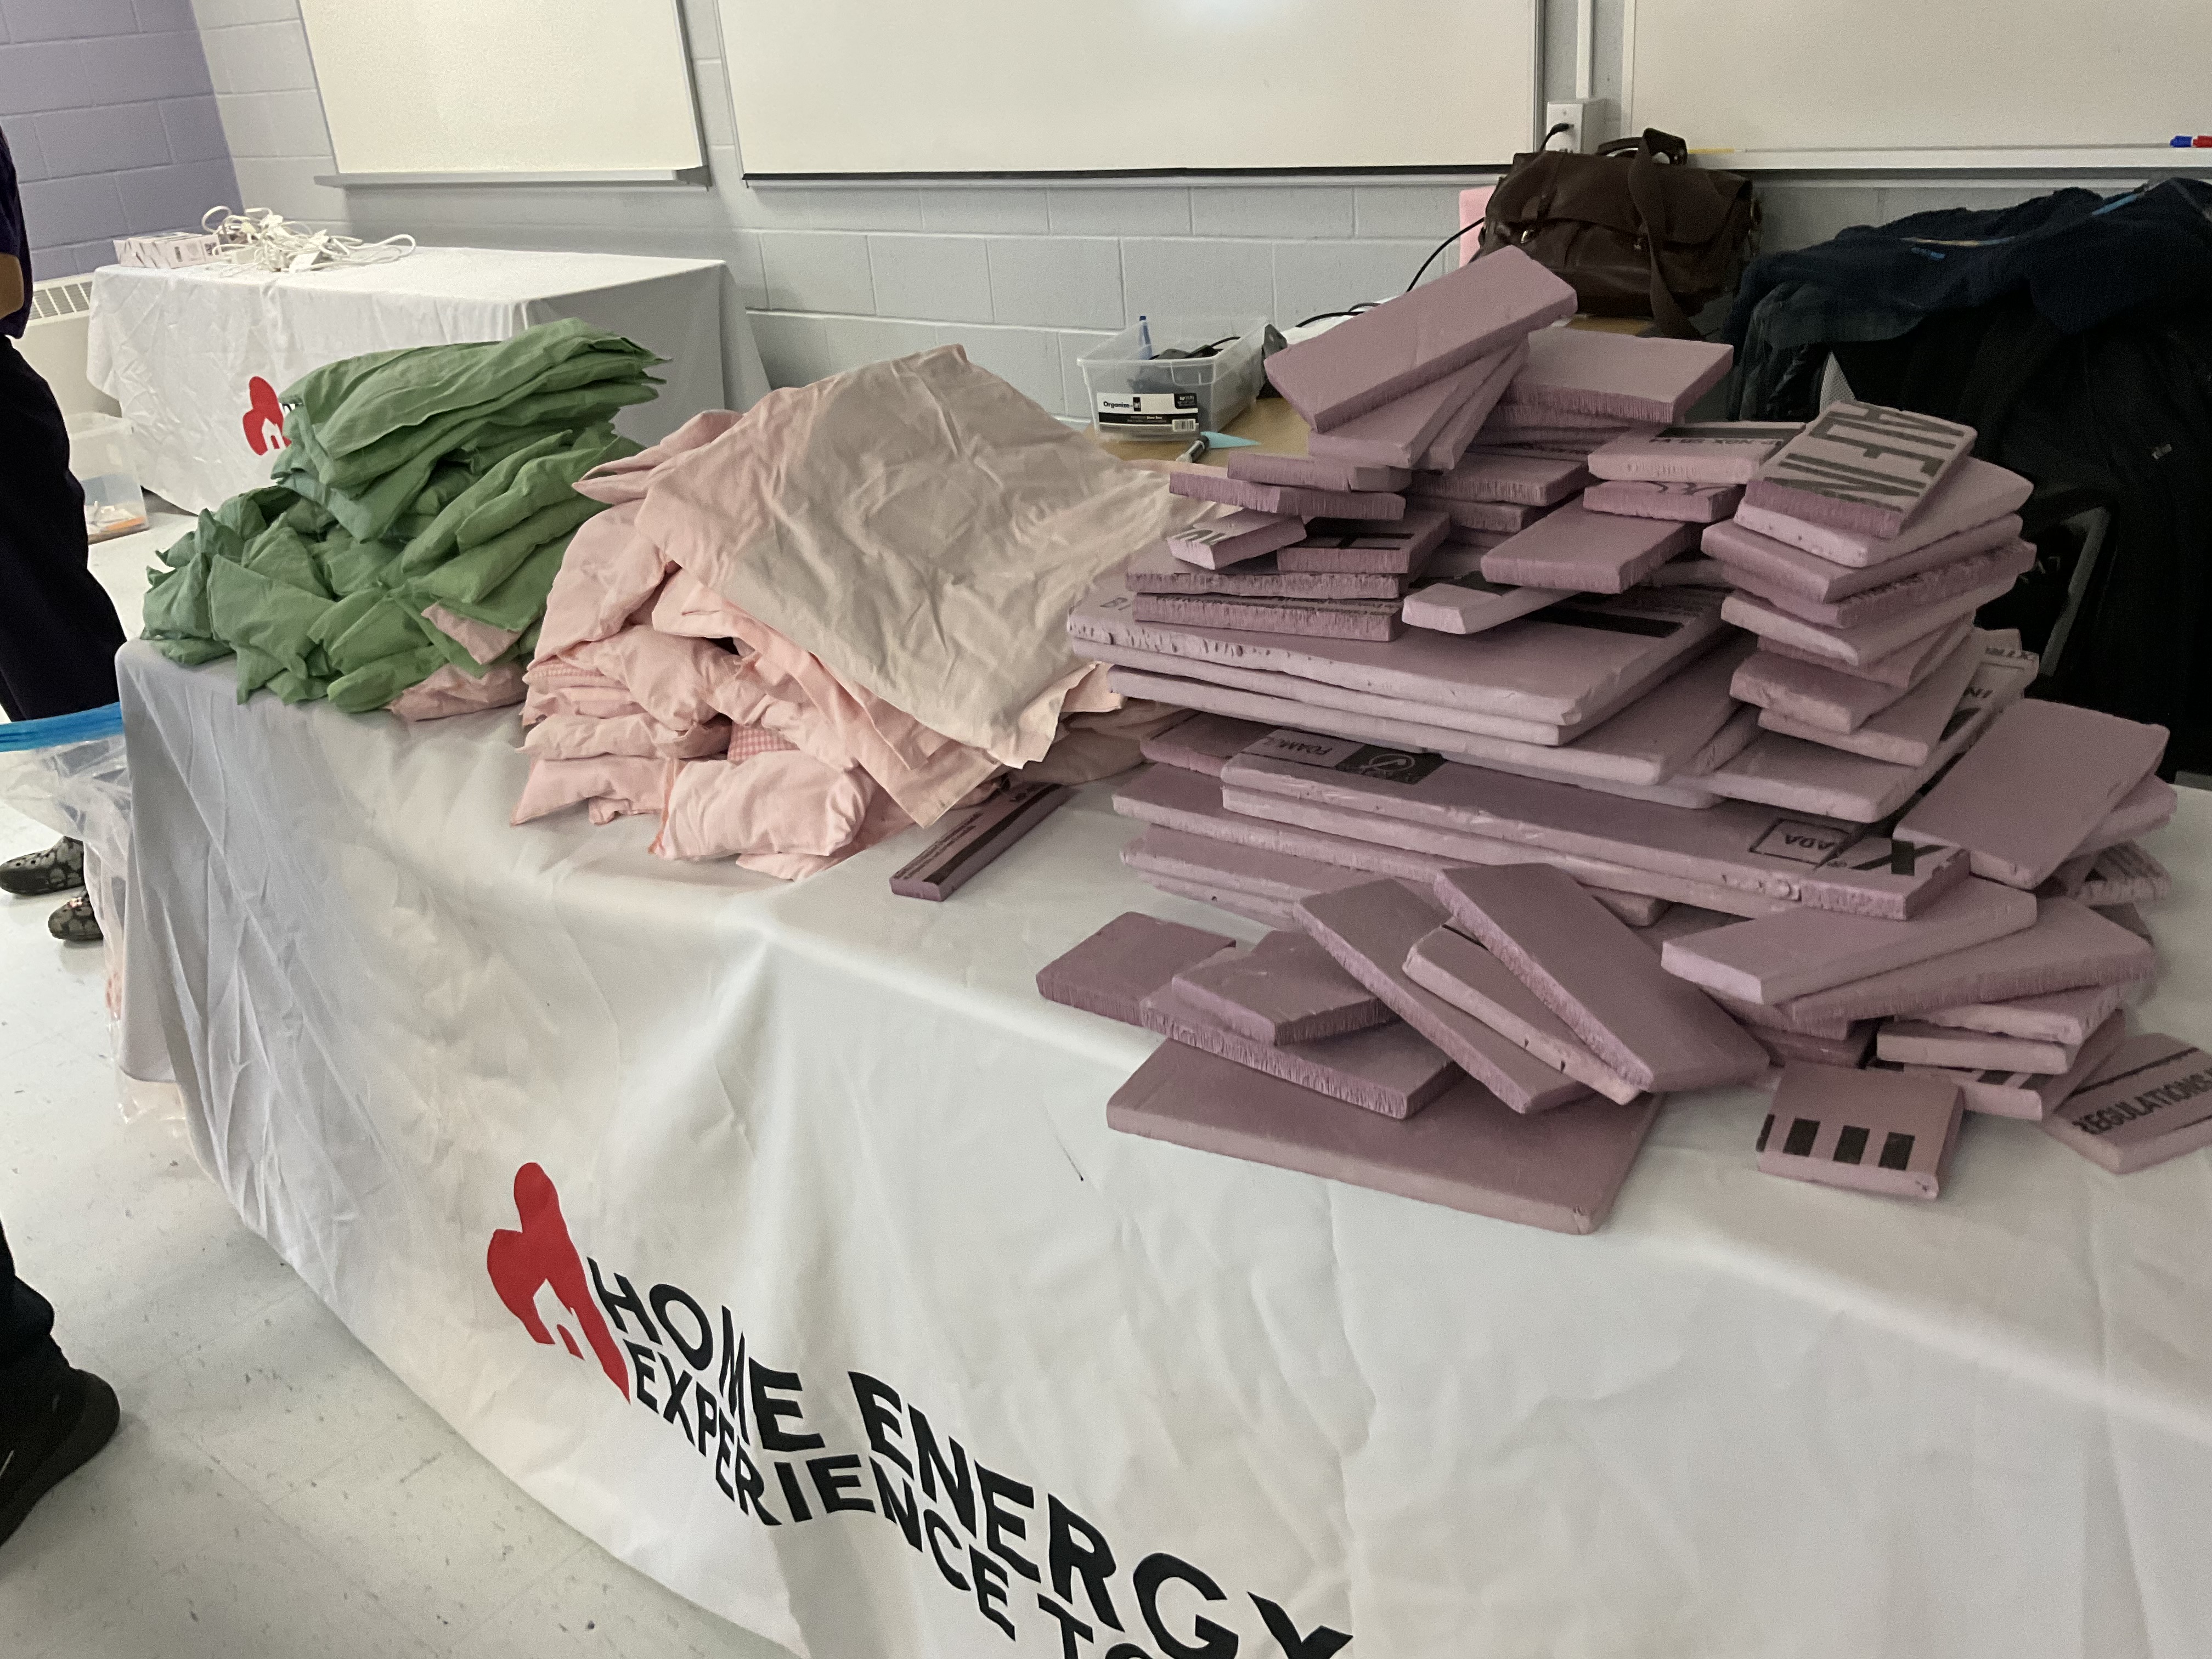
Groups worked together to get the houses built. The kits included sensors and a “furnace” walls, doors and windows which all clipped together with 3D printed parts.

In the end, the houses were set up and turned on at the same time. They will run all night with a calculator tracking the sensor output.
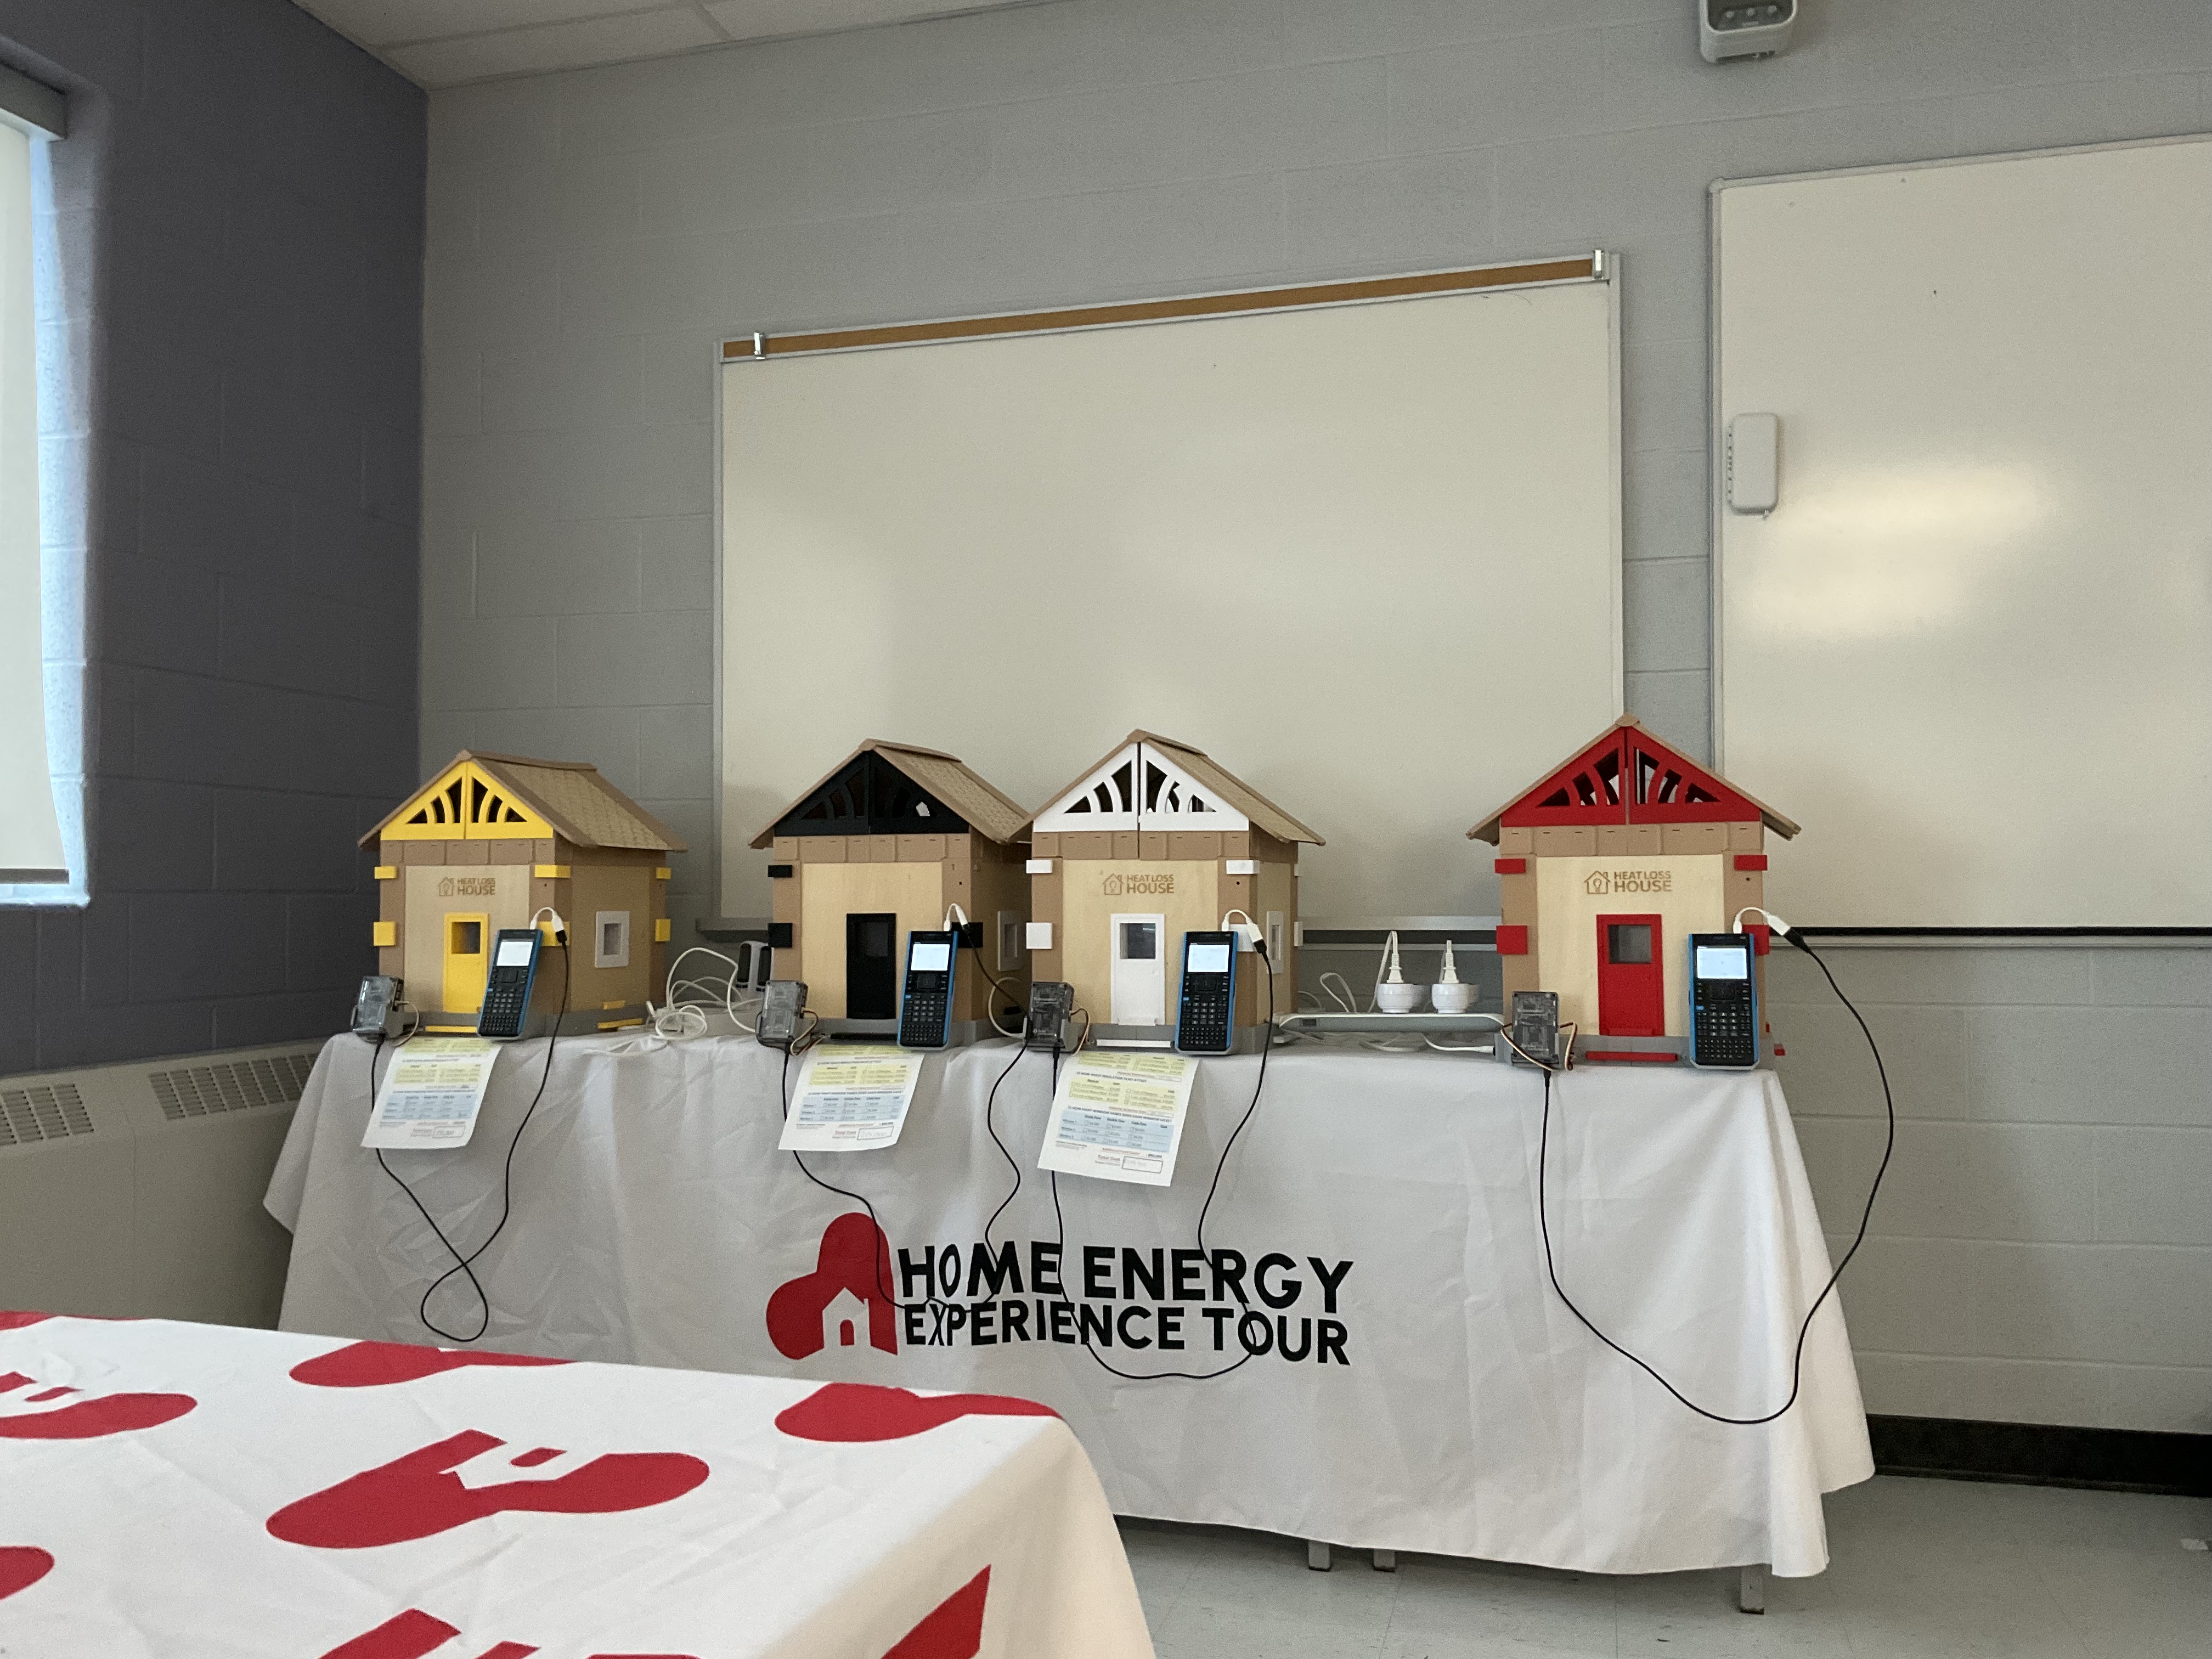
We look forward to seeing the results tomorrow.
Many thanks to St. Lawrence College for providing this opportunity for our students.

