Goodbyes are tough
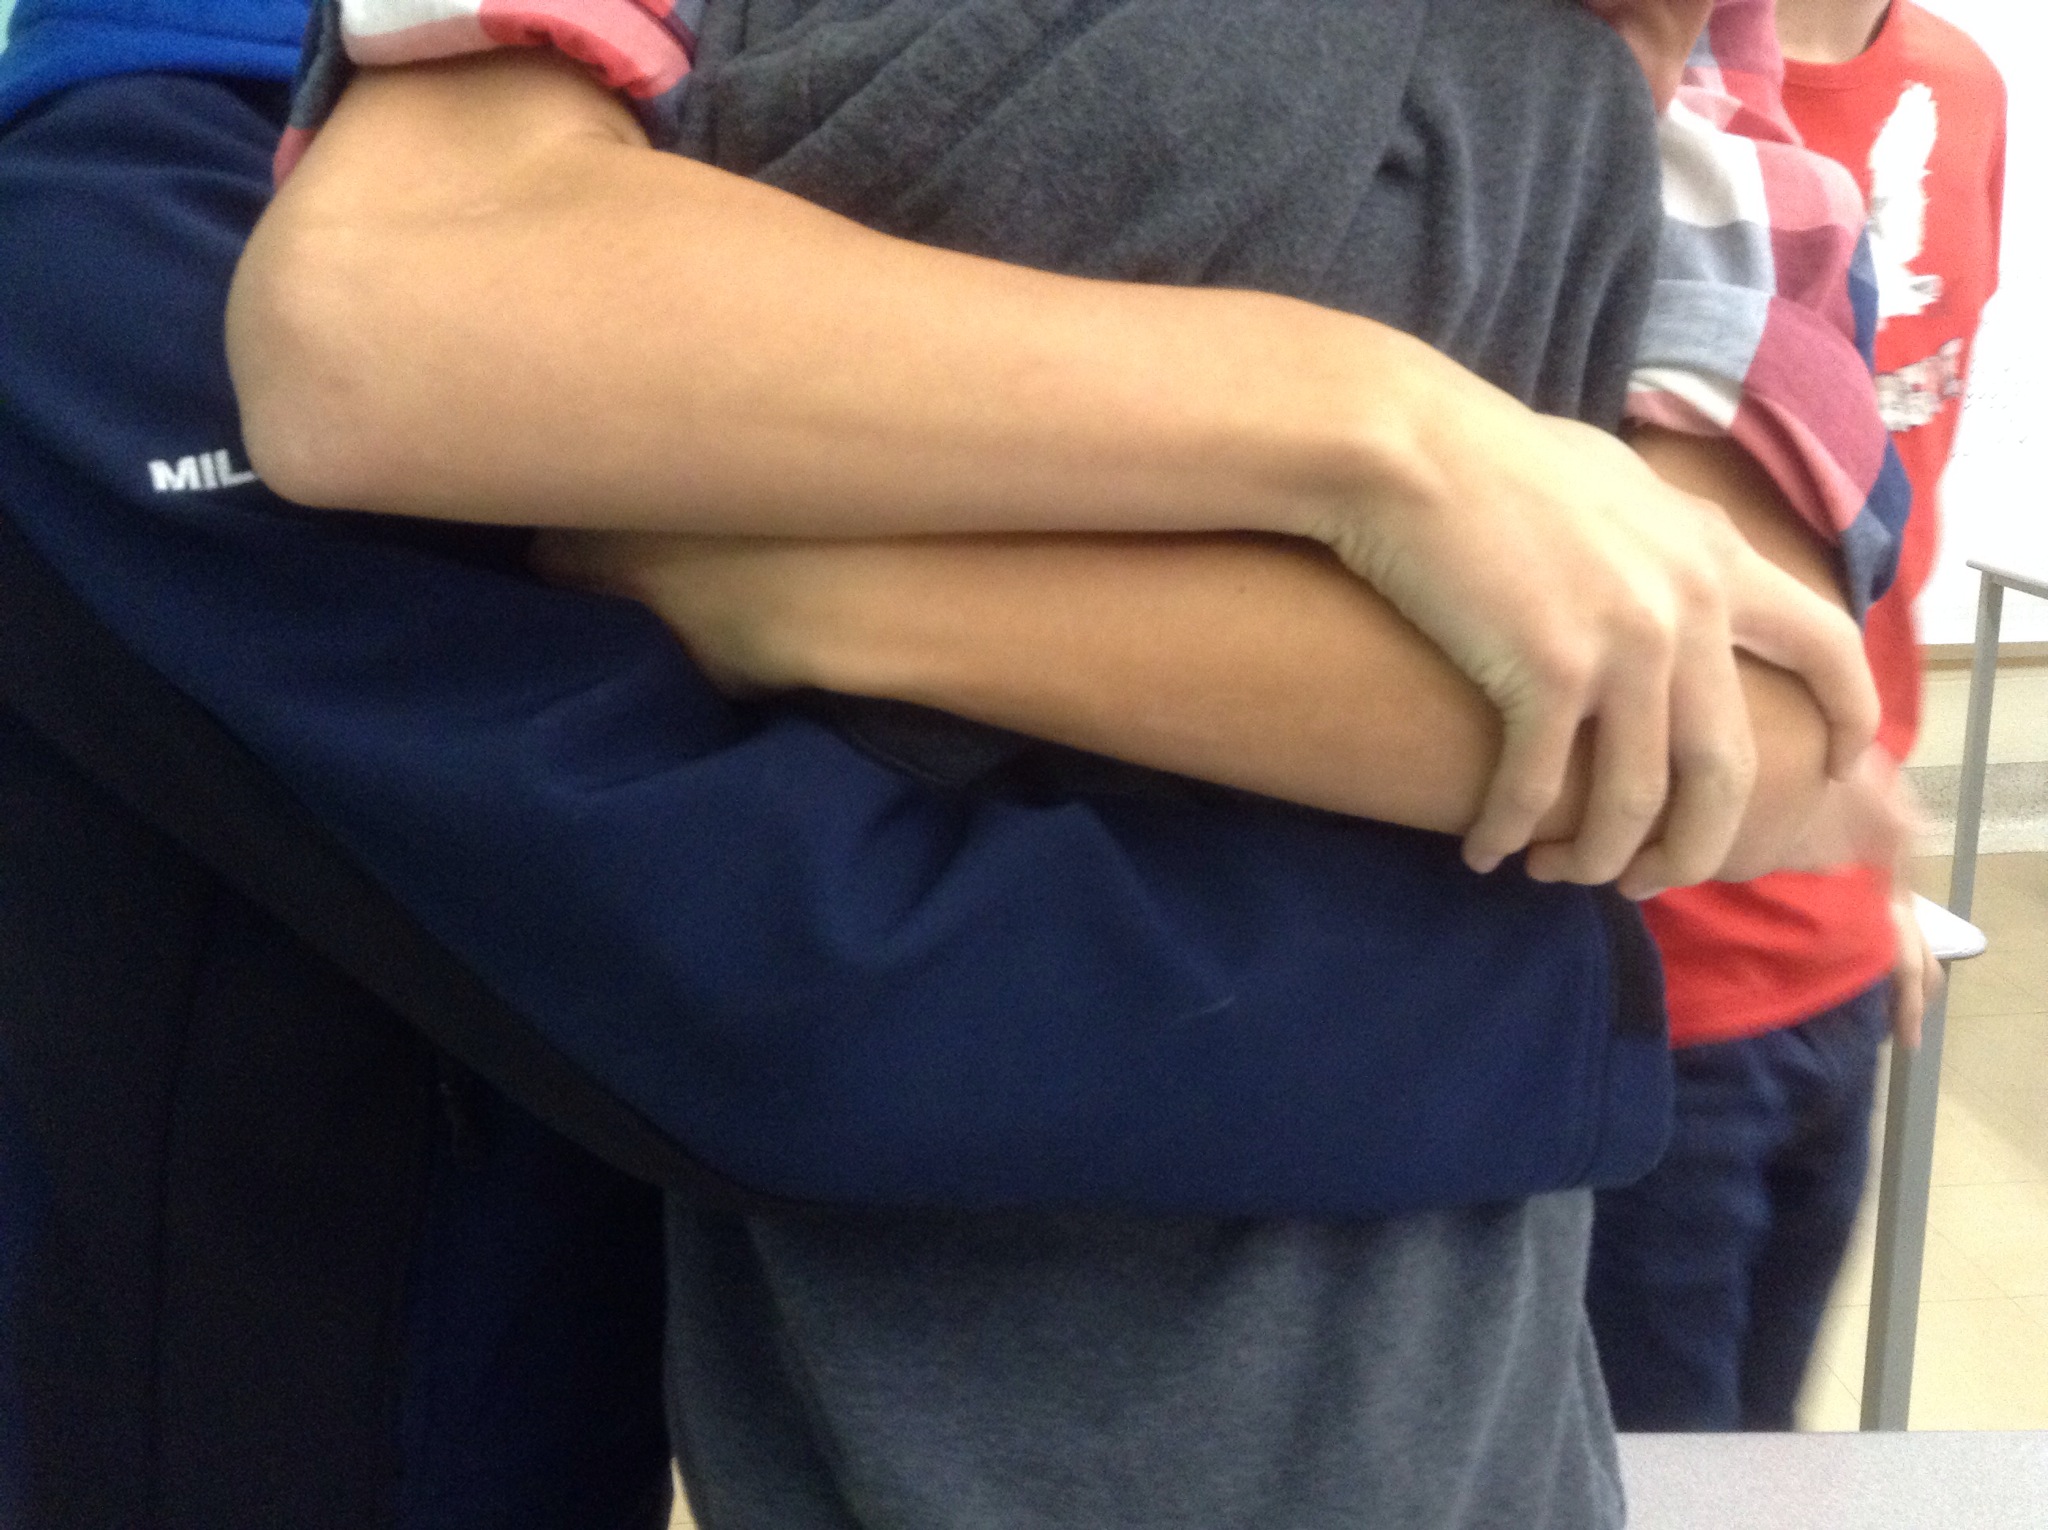
One of the members of our period D math family is transferring schools tomorrow. We had a little farewell party, and lots of hugs.
You’re Never Too Old For Story Time

We have read a few of these books about Sir Cumference. They introduce good math concepts, and have lots of math puns. This particular book was about Perimeter and Area.
Afterwards we made tables of values to compare side length and perimeter, and side length and area, for squares. We graphed the data to see if it’s linear or not, and then modelled the data with equations.
It’s fun when geometry, data analysis, graphing, and equations all come together. In grade 9 we are finding out that the strands are not so separate as they were in elementary school.
Engineer for the year
Period C is in for a treat. We have an engineering student, Ali, who will be in our class every 2 weeks showing us some of the connections between math and engineering.
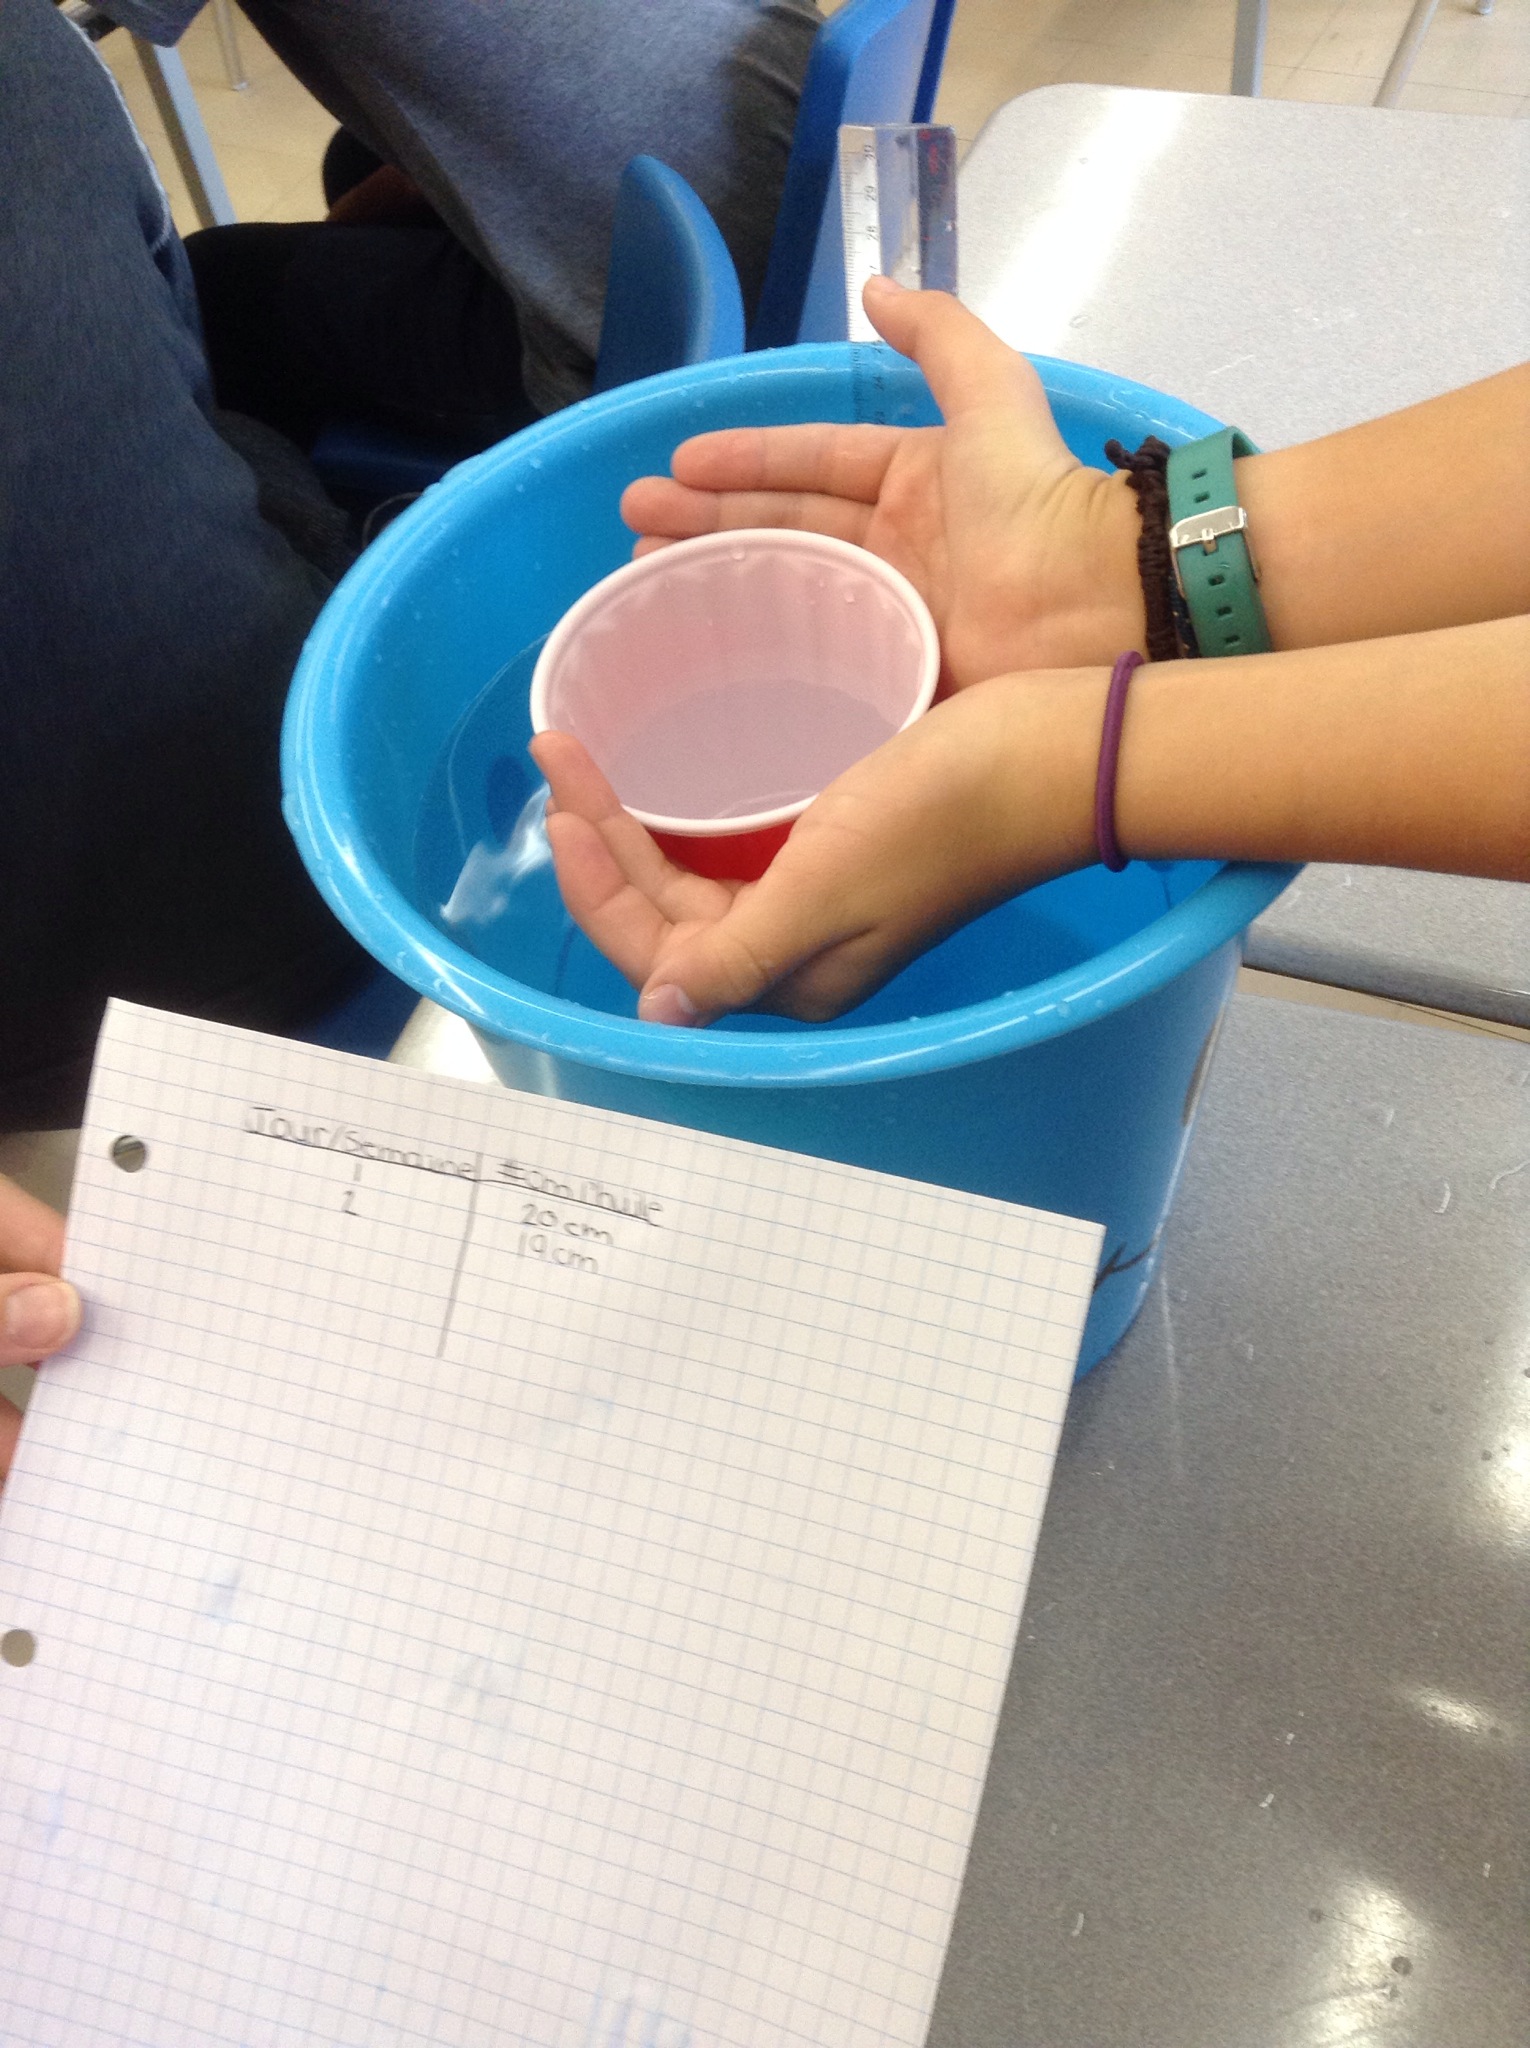
This week we modelled an oil problem by using buckets as “oil wells” and cups as our “machines”.

Each group was hired to get all of the oil from their well in 6 months.
Groups had to measure the initial height of the “oil” in their “well”. Each “month” (several minutes) the “machine” could be used 4 times. Each “month” the height of the “oil” was measured and recorded, and the data put on the graph.
At the end of the 4th month we looked at the graphs to see if we were likely to meet the 6th month deadline.
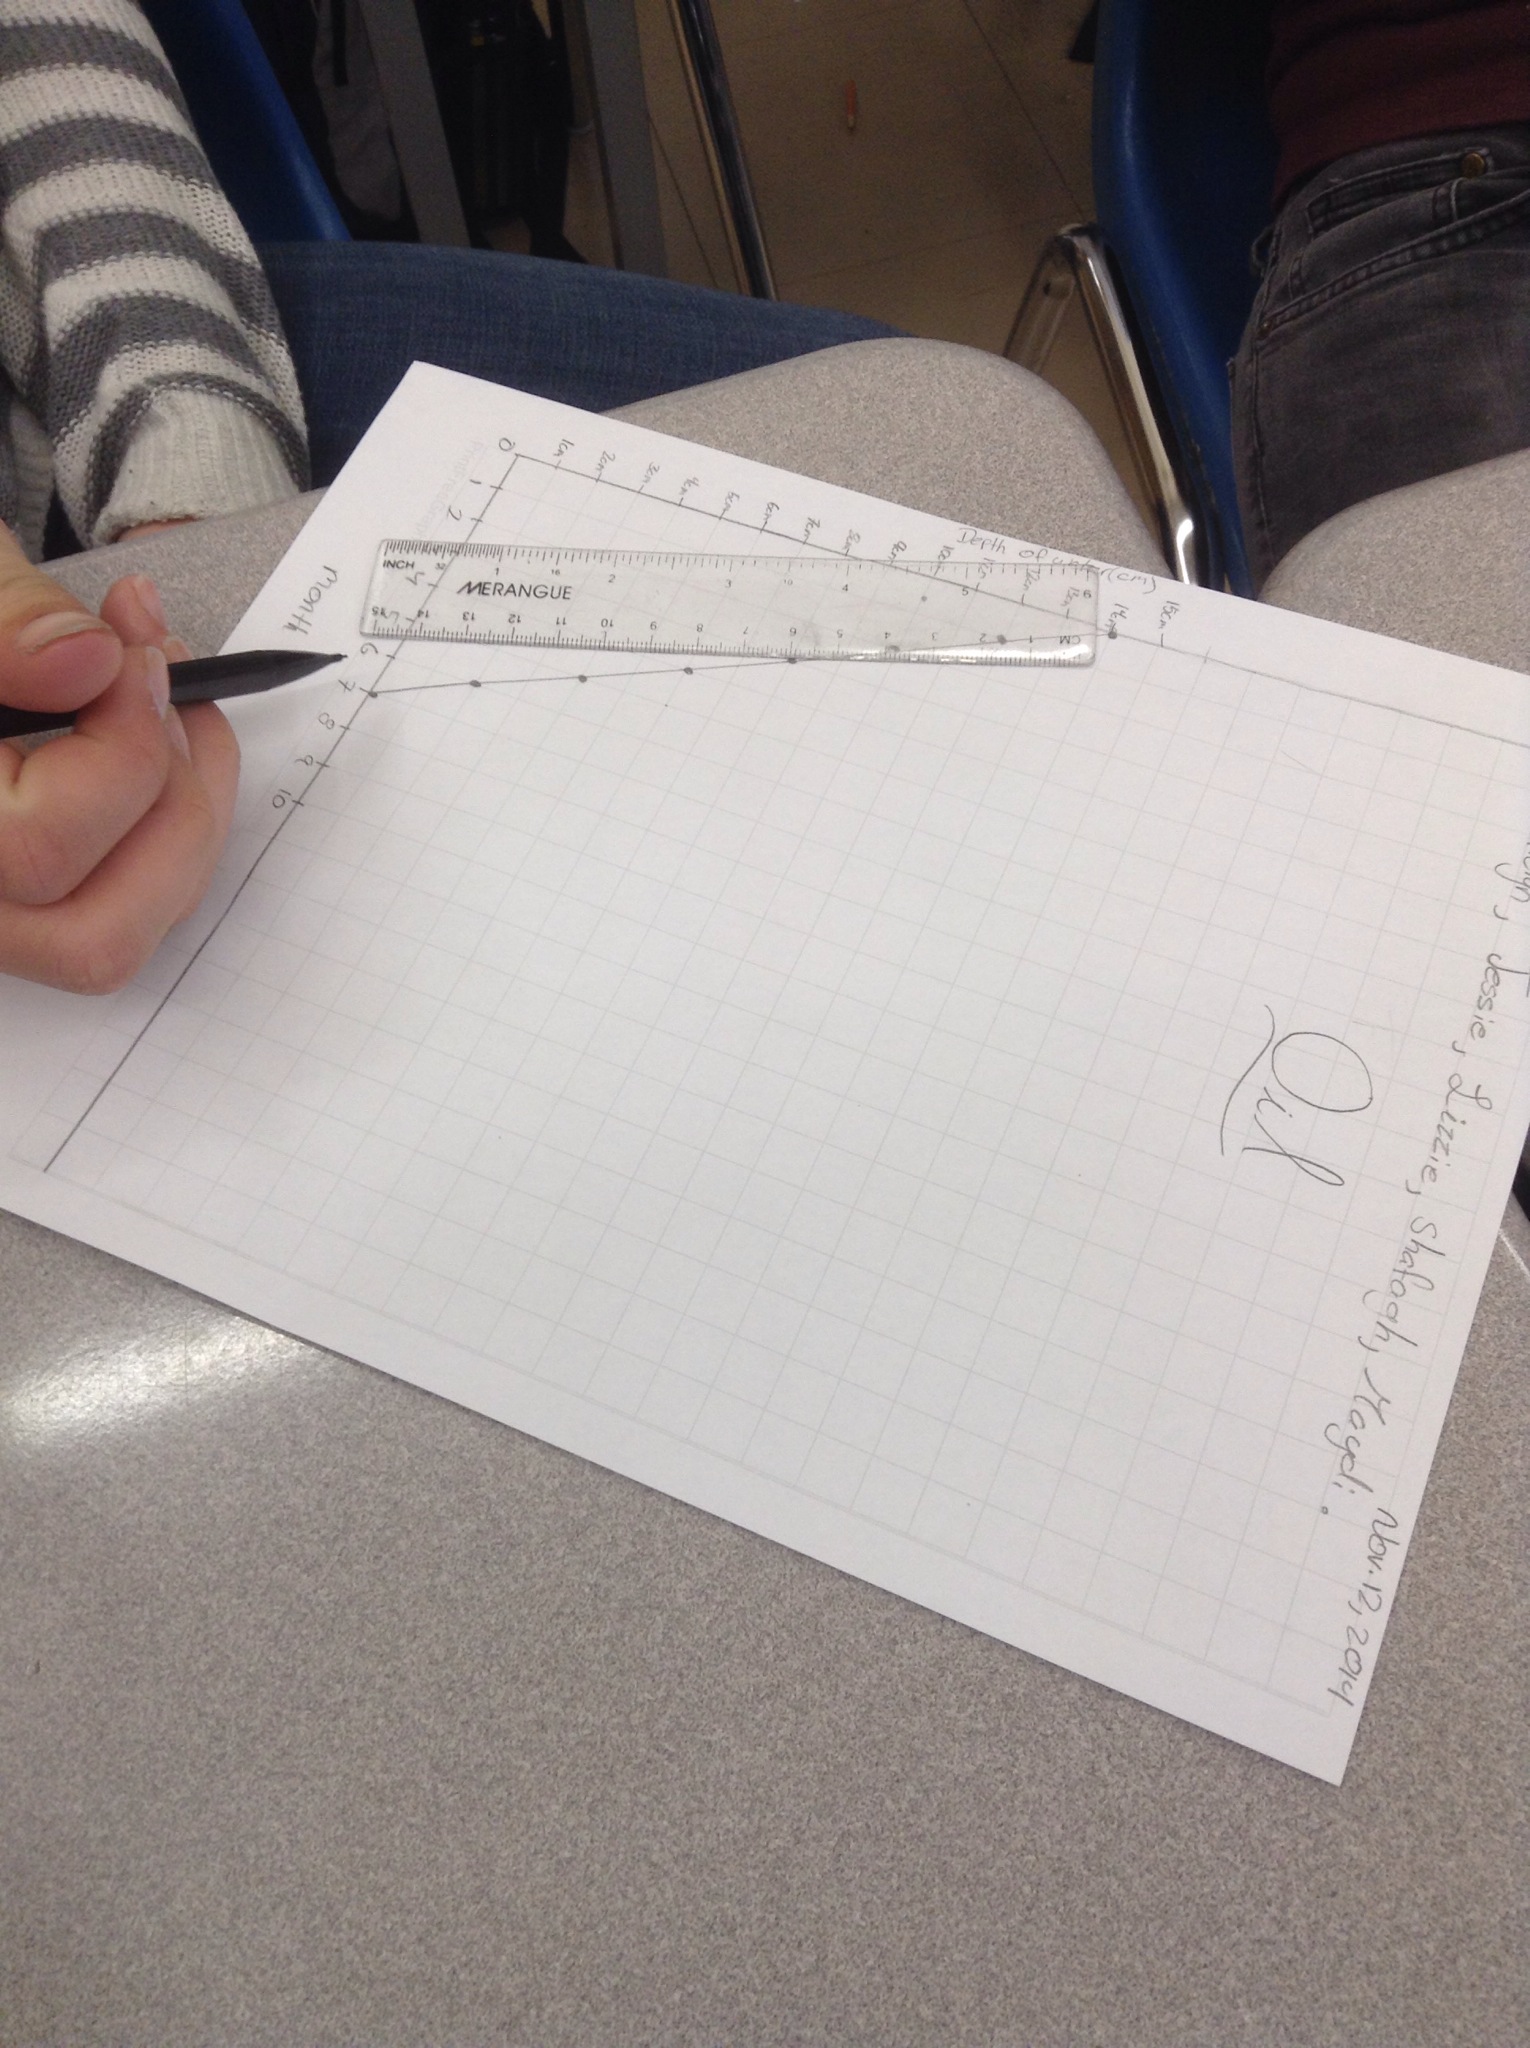
We drew lines of best fit, and discussed whether the data was linear or not, what the slope was and what it represents. We talked about the x and y intercepts and what they represent.
Each group was given a challenge to come up with ways to change the machine or the process to drain the “oil well” faster. After brainstorming a list of ways to change the process, each group used their knowledge of 3D shapes to design a better “machine” (cup) to scoop out the “oil”.
Groups presented their designs to the class.
Ali shared with us how our activity related to engineering, design and problem solving. She also told us of some interesting ways companies have solved problems by thinking outside the box.
It was great to have Ali as a part of our class. We look forward to more activities with her in 2 weeks.
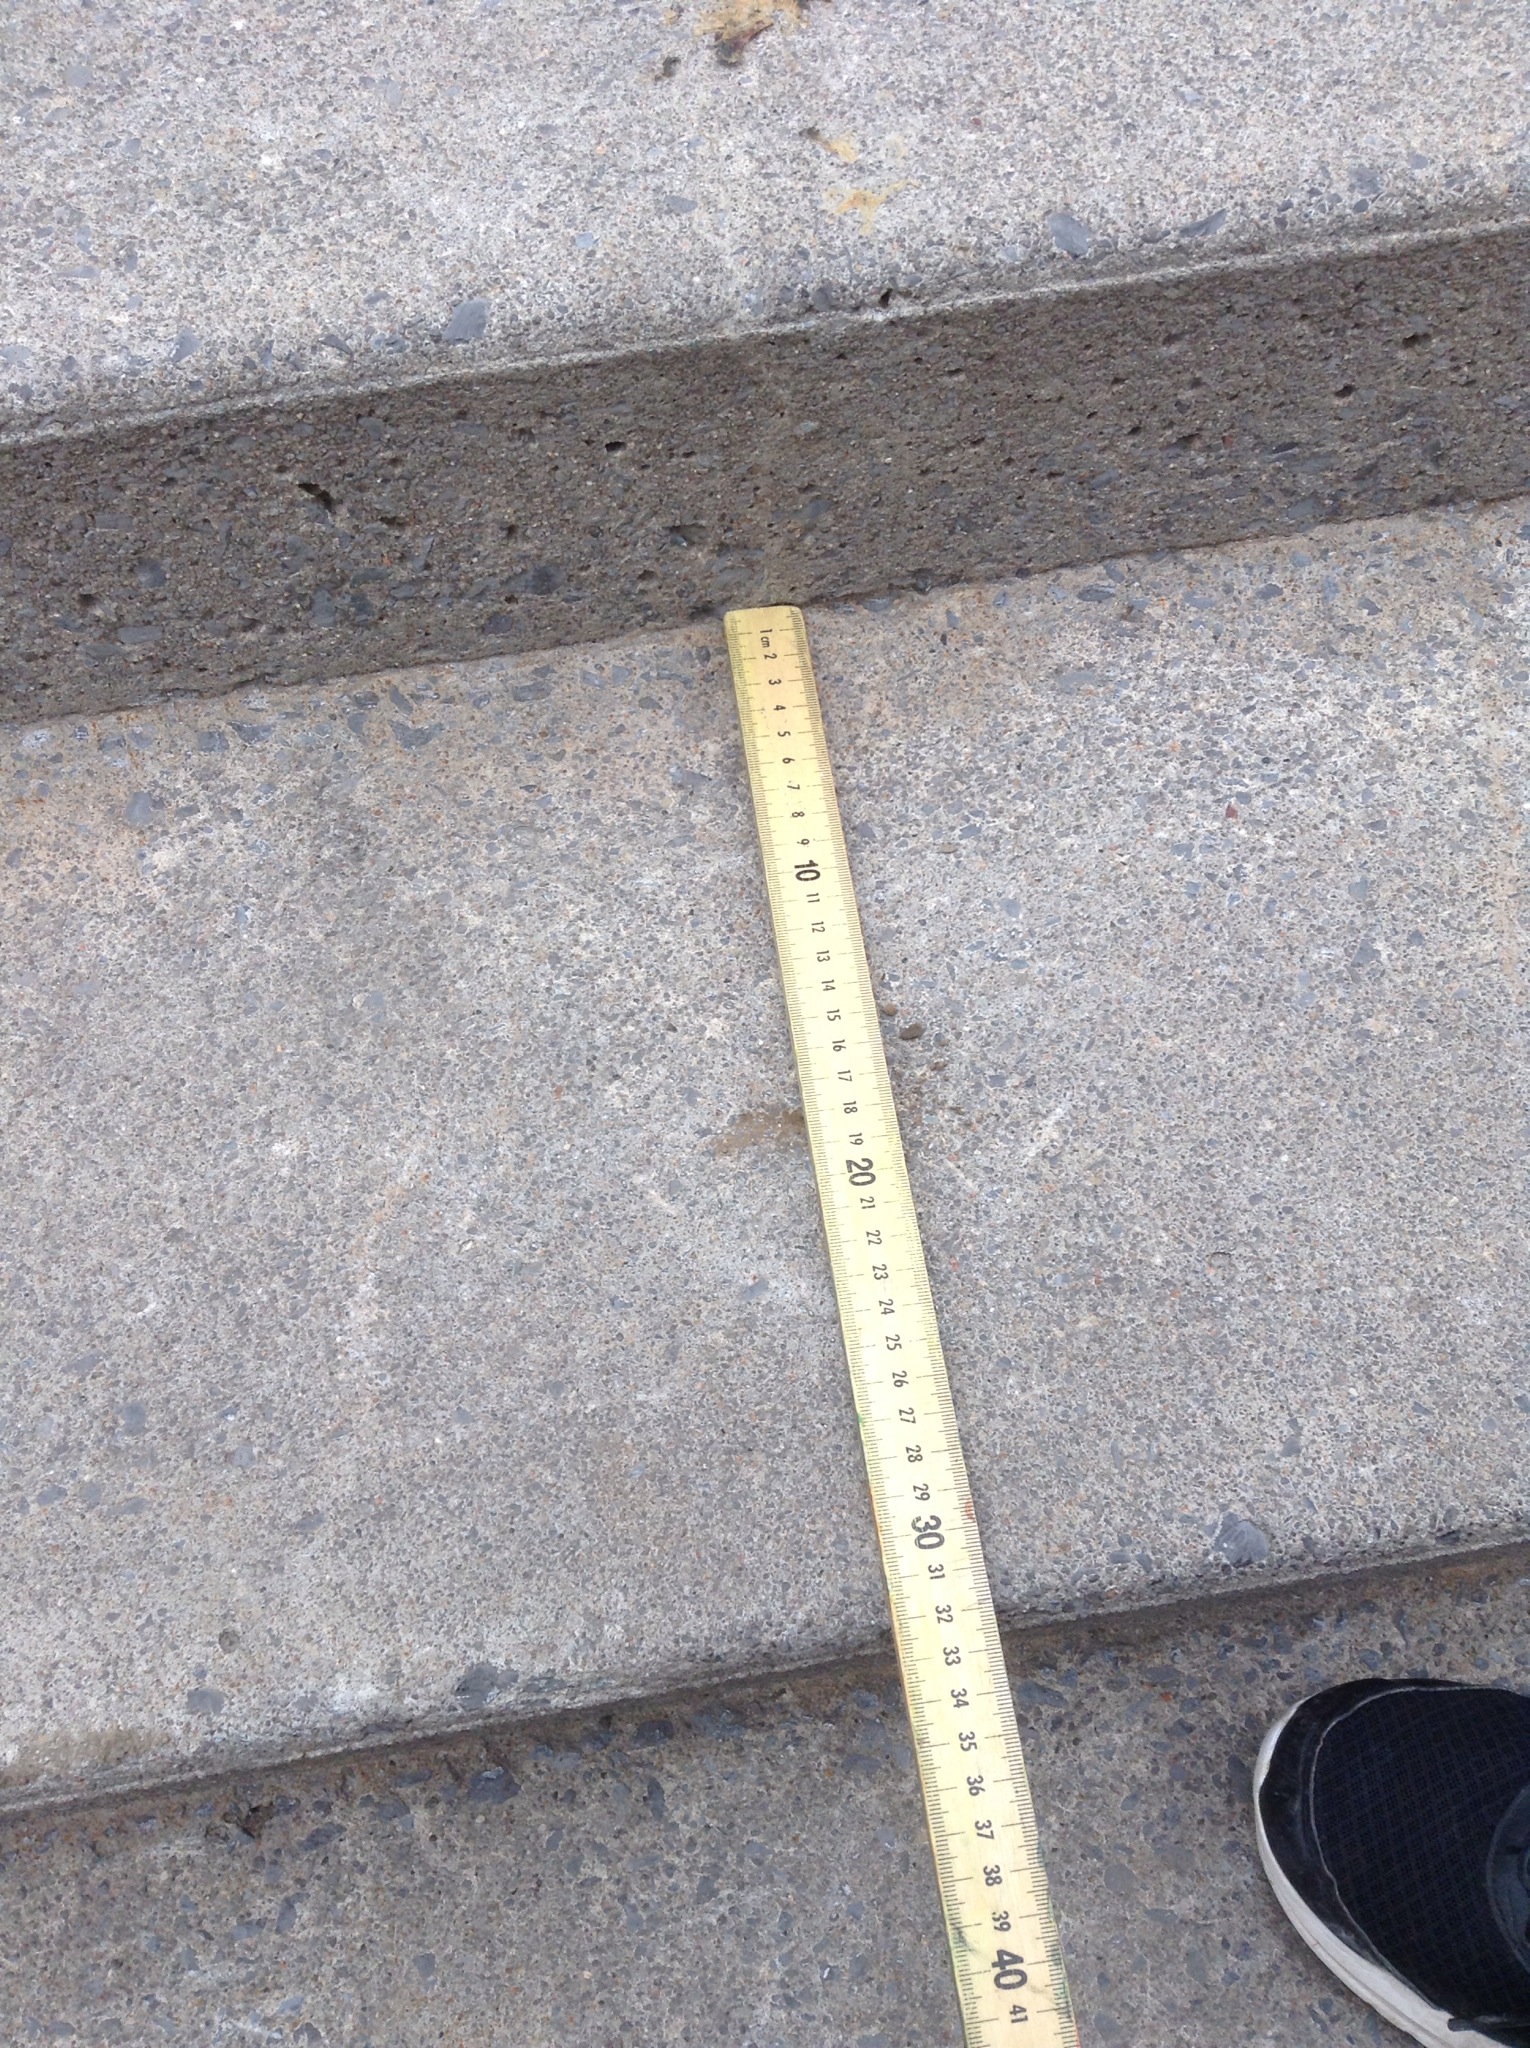
Field trip
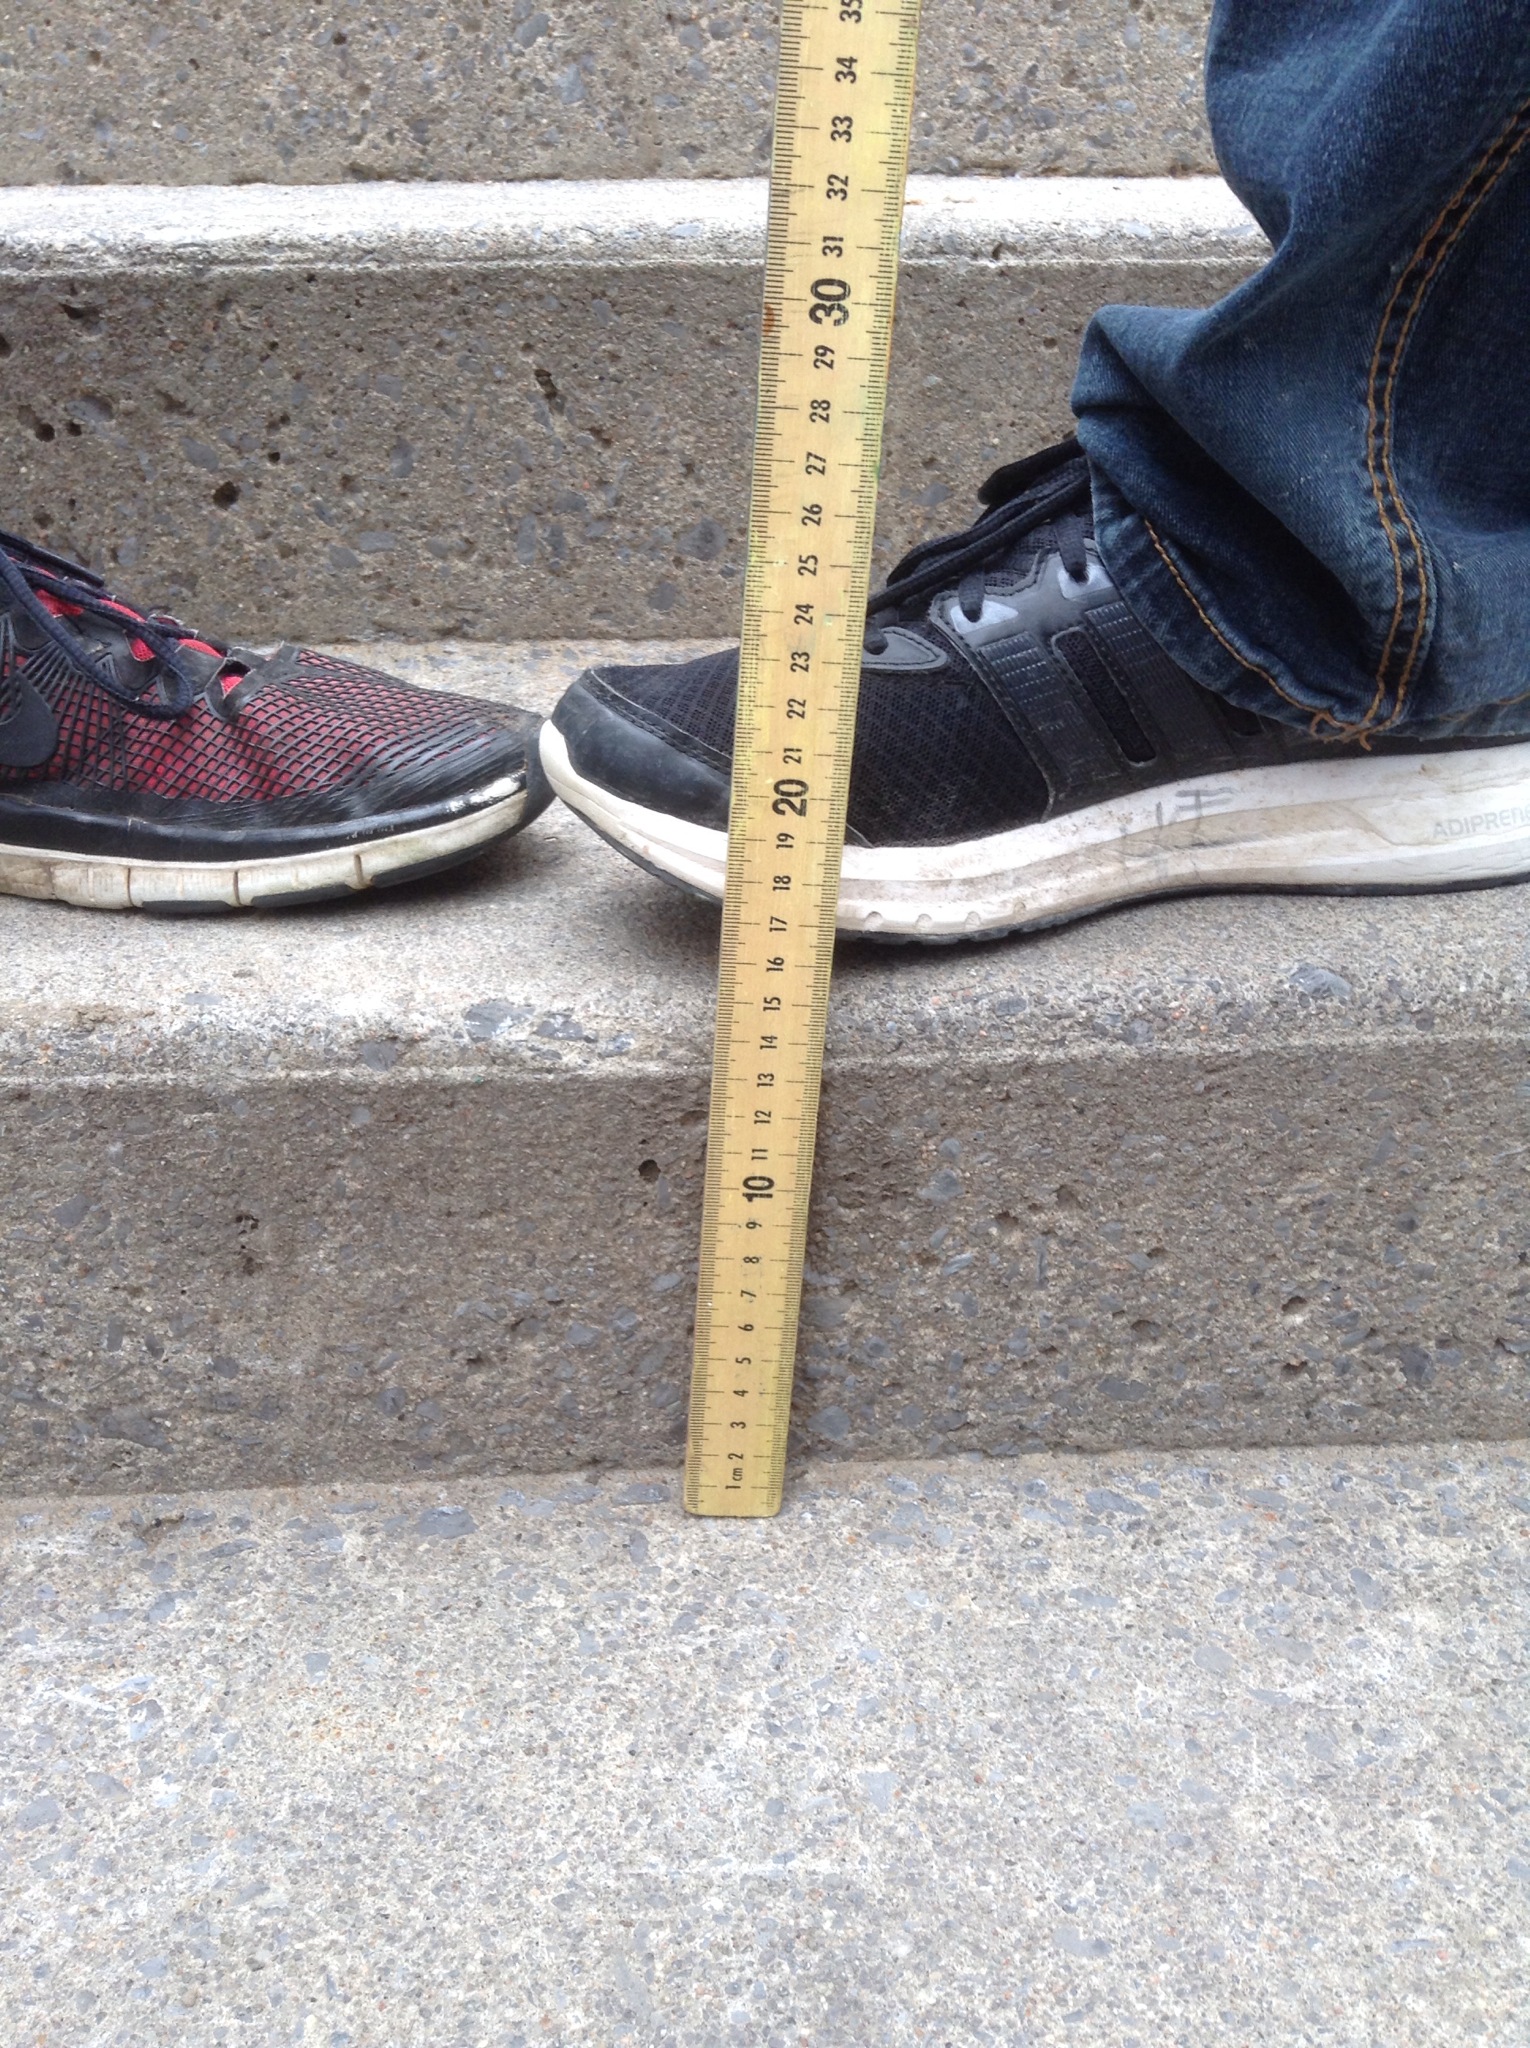
We went for a walk and measured the rise and run of several staircases on Queen’s campus.
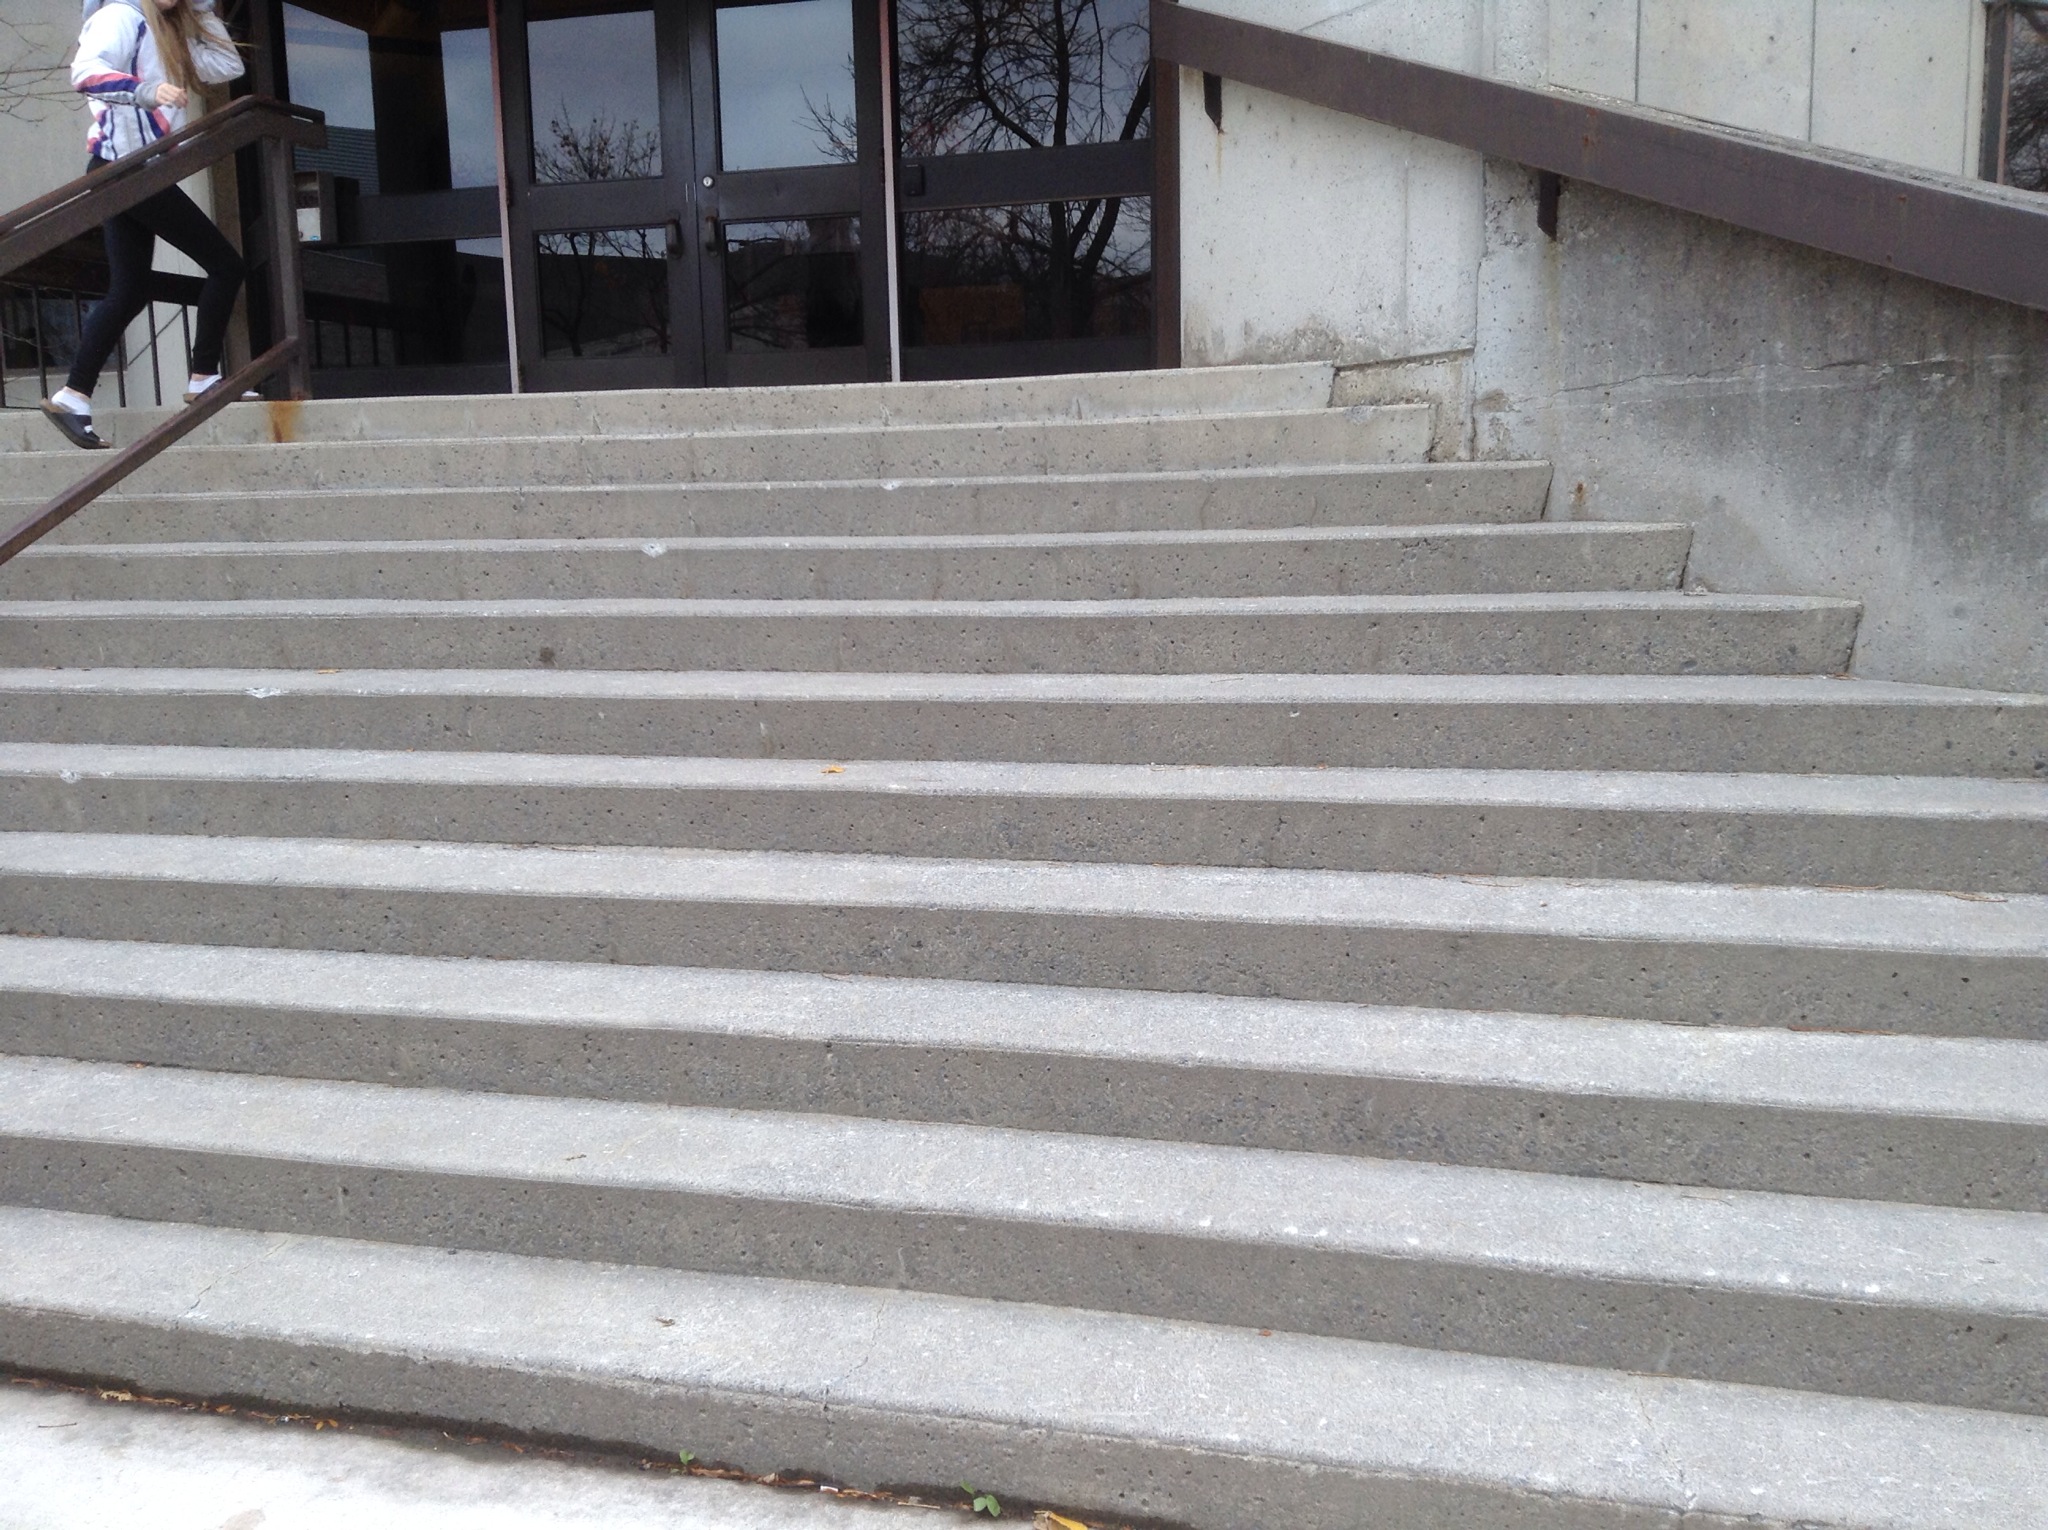
The steps up to the Bruce Wing of Miller hall have a shallow slope.
And next door at Jackson hall, the slope is steeper.
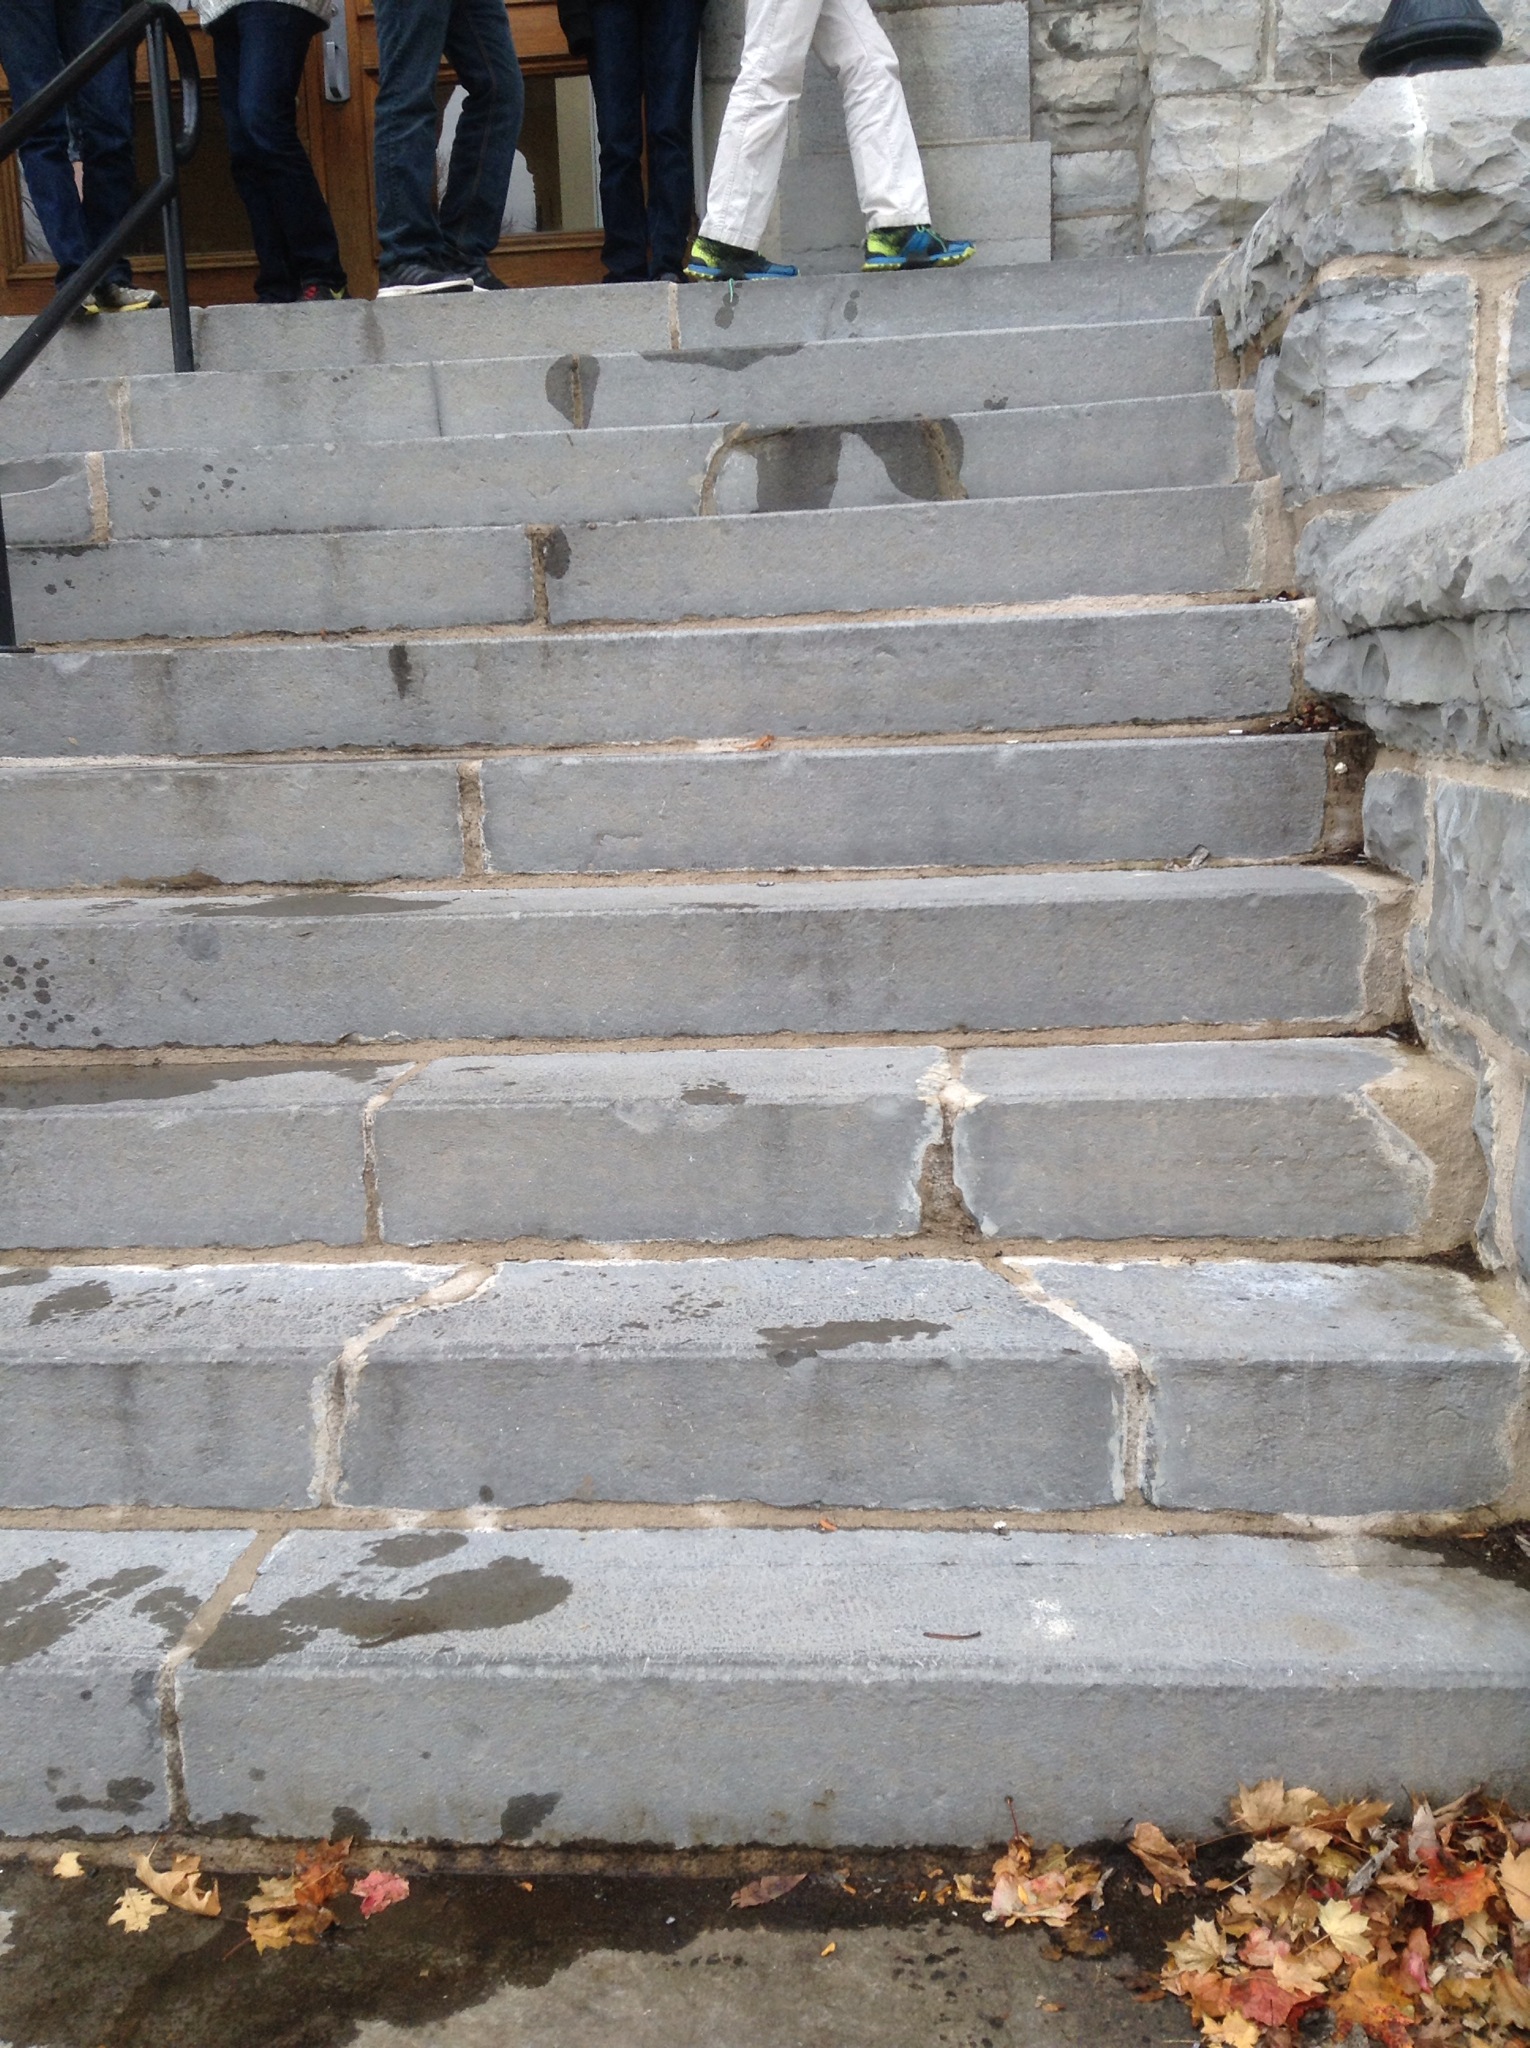


The slope shows the relationship between the vertical change and horizontal change.
What’s the slope of your stairs at home?
Finding Slopes
Today we calculated the slope of the stairs by measuring the rise and run.

We next looked at how we could find the slope of the railing.
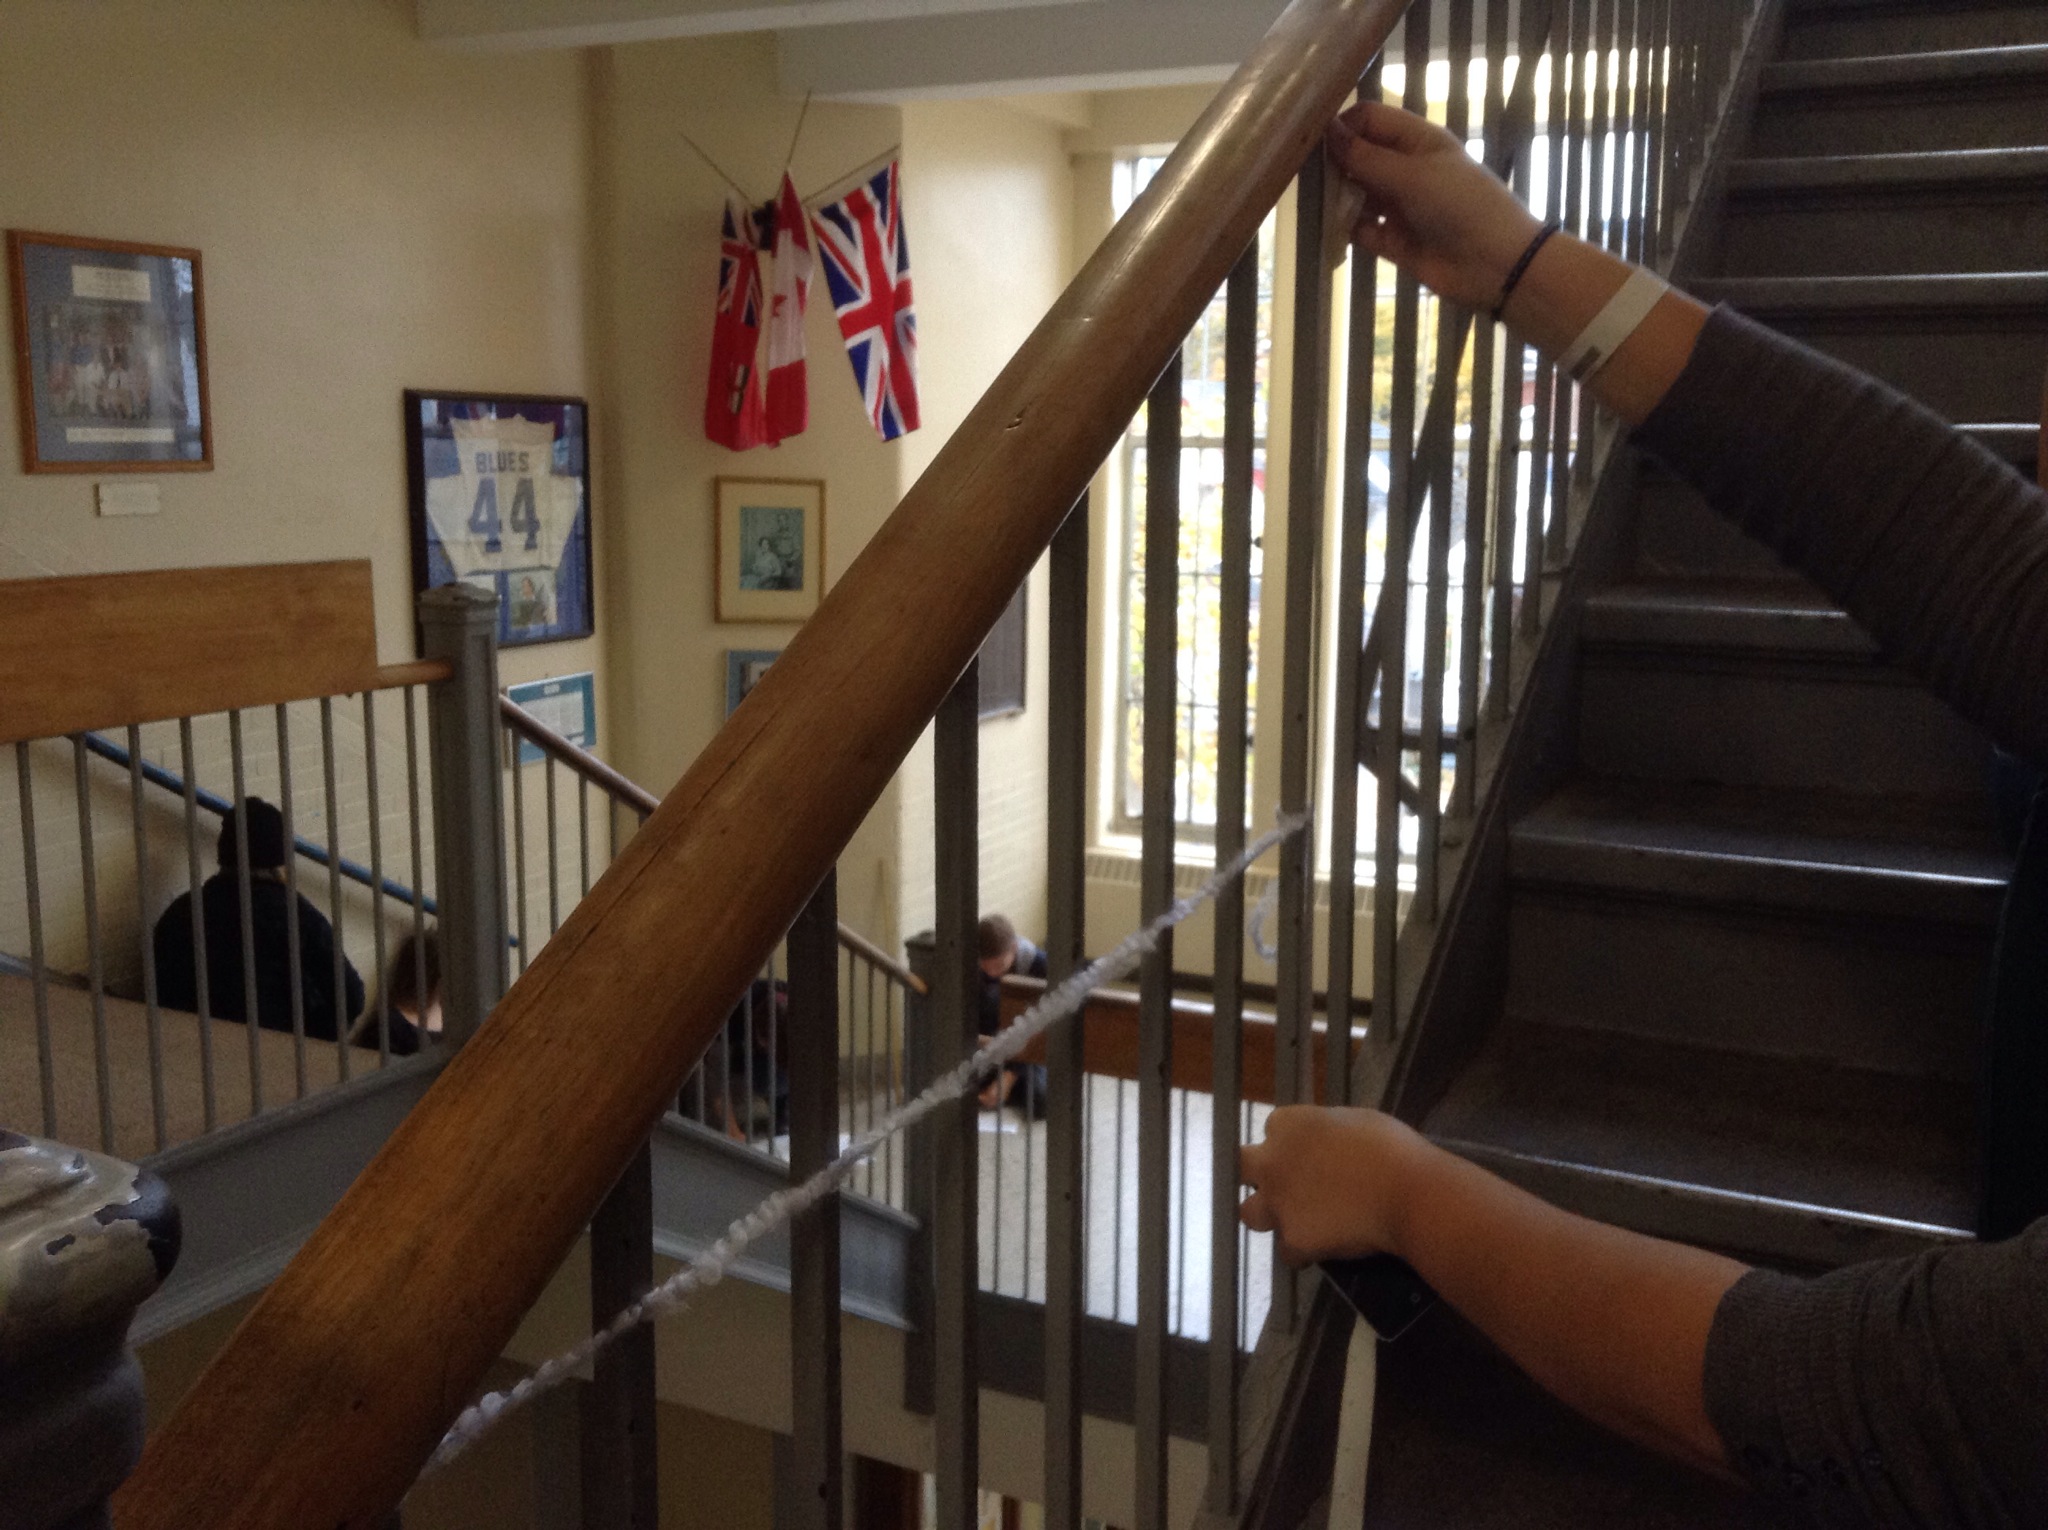
We made slope triangles with string.

Then we calculated rise divided by run to figure out the slope.

We proved that the railing and the stairs have a slope of 0.5.
Plotting points and making lines
We were plotting points that follow patterns, like the y values are double the x values, or the y values are 3 more than the x values.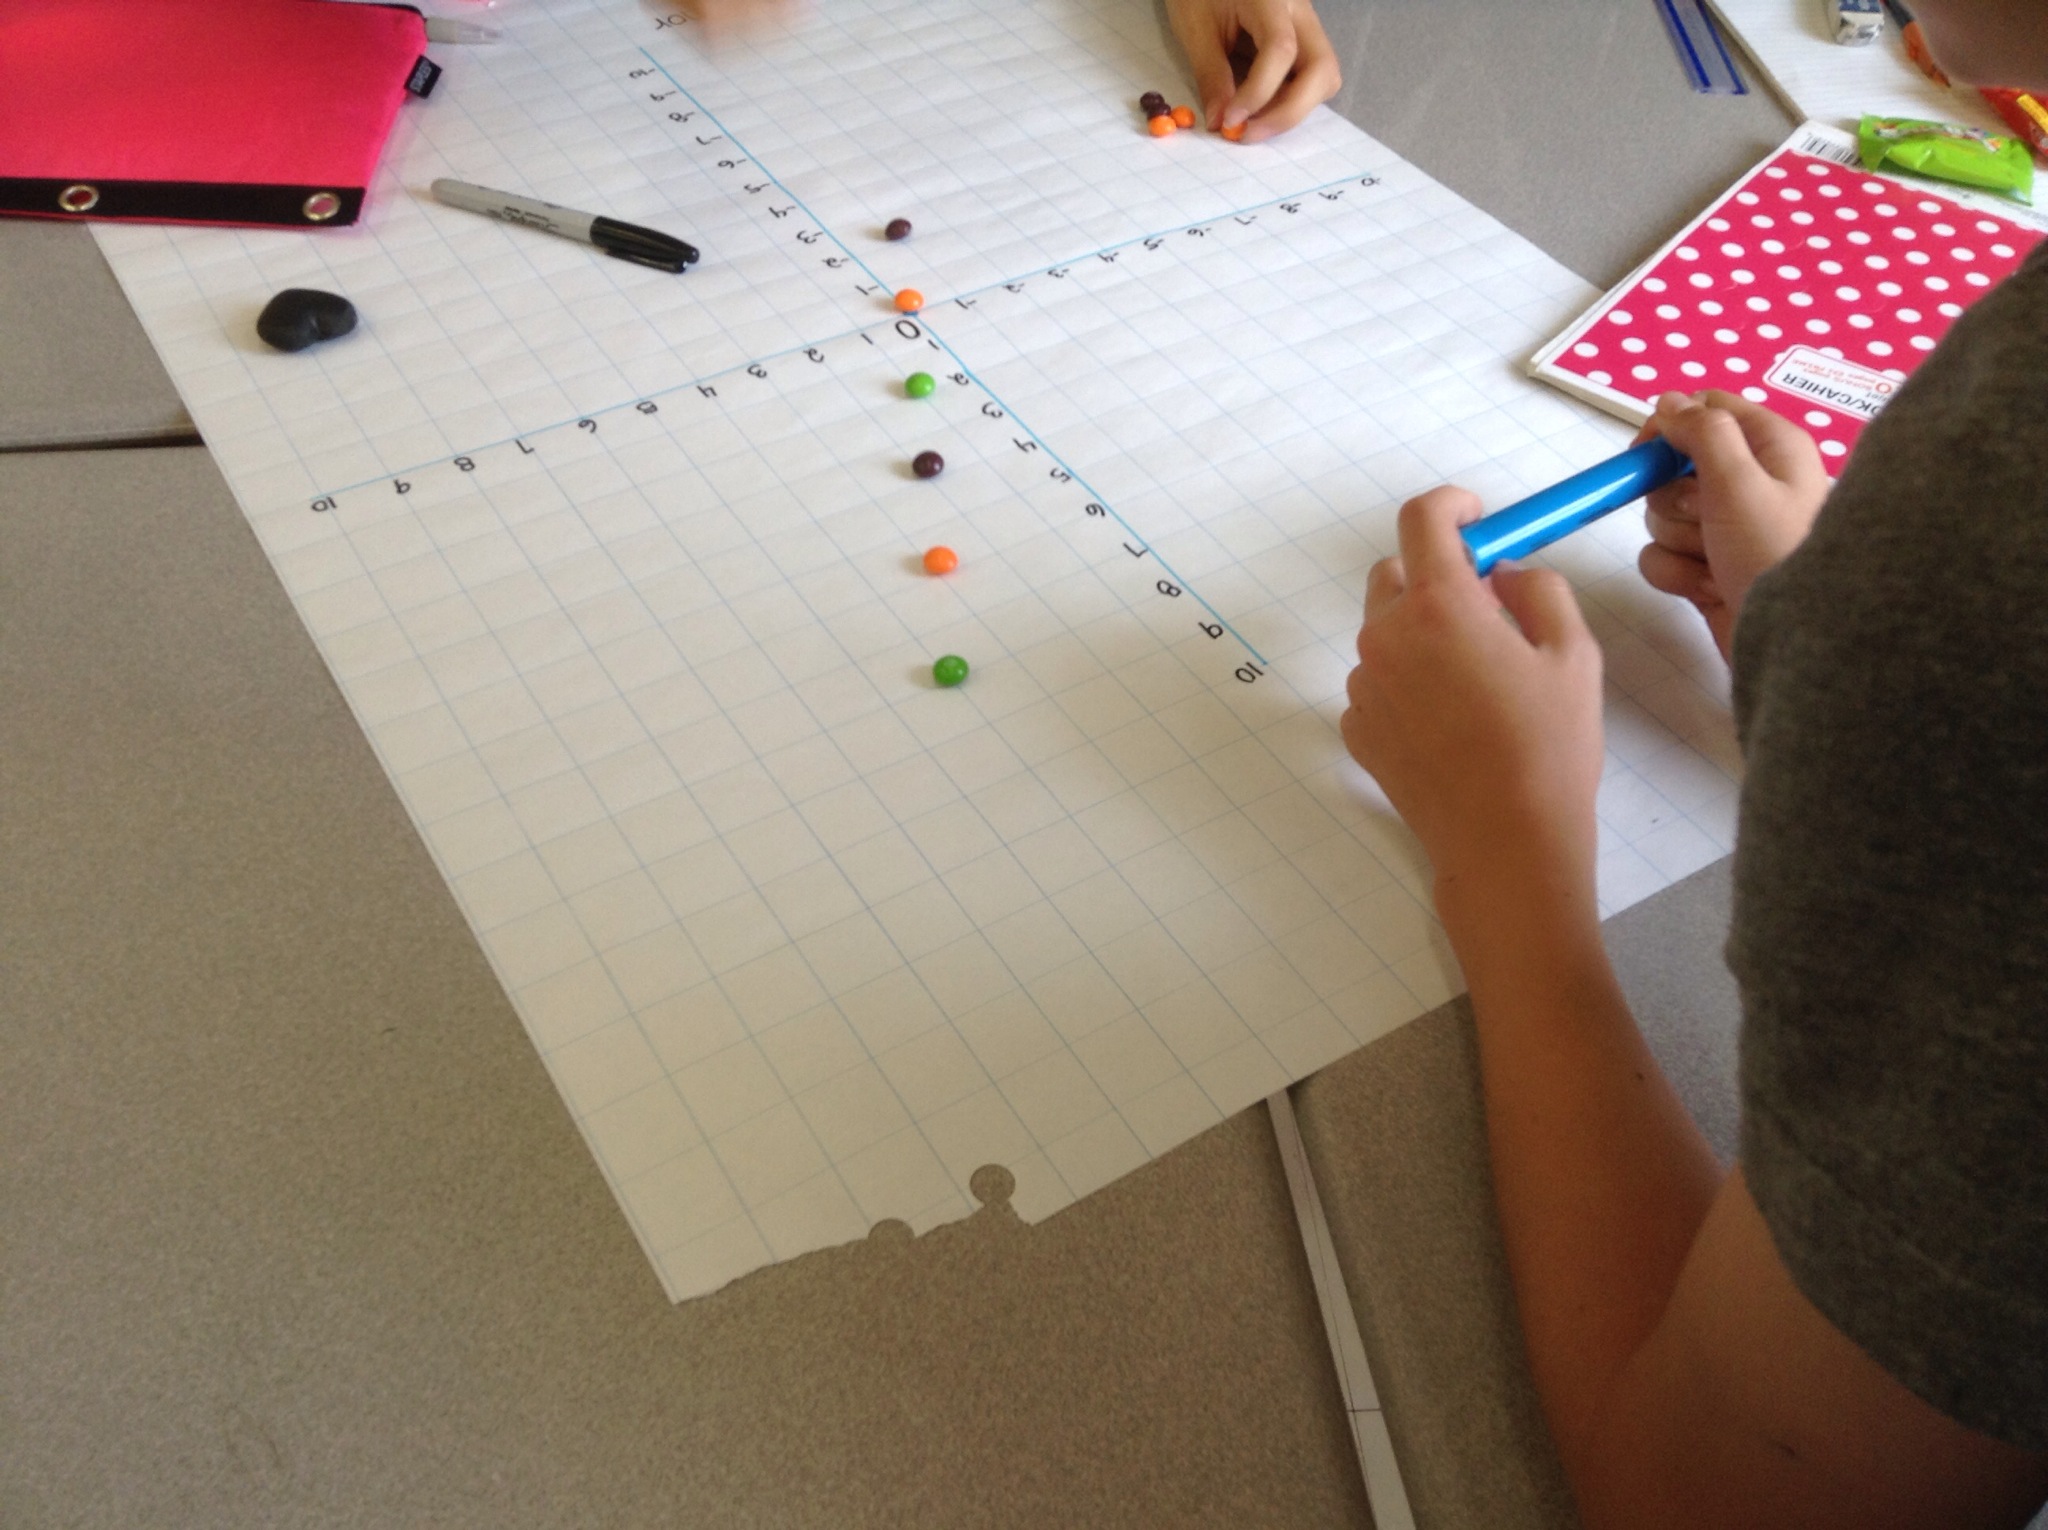
We also plotted points that make different patterns, like the y values that are the square of the x values.

We will explore the data and equations and graphs more in the coming days.
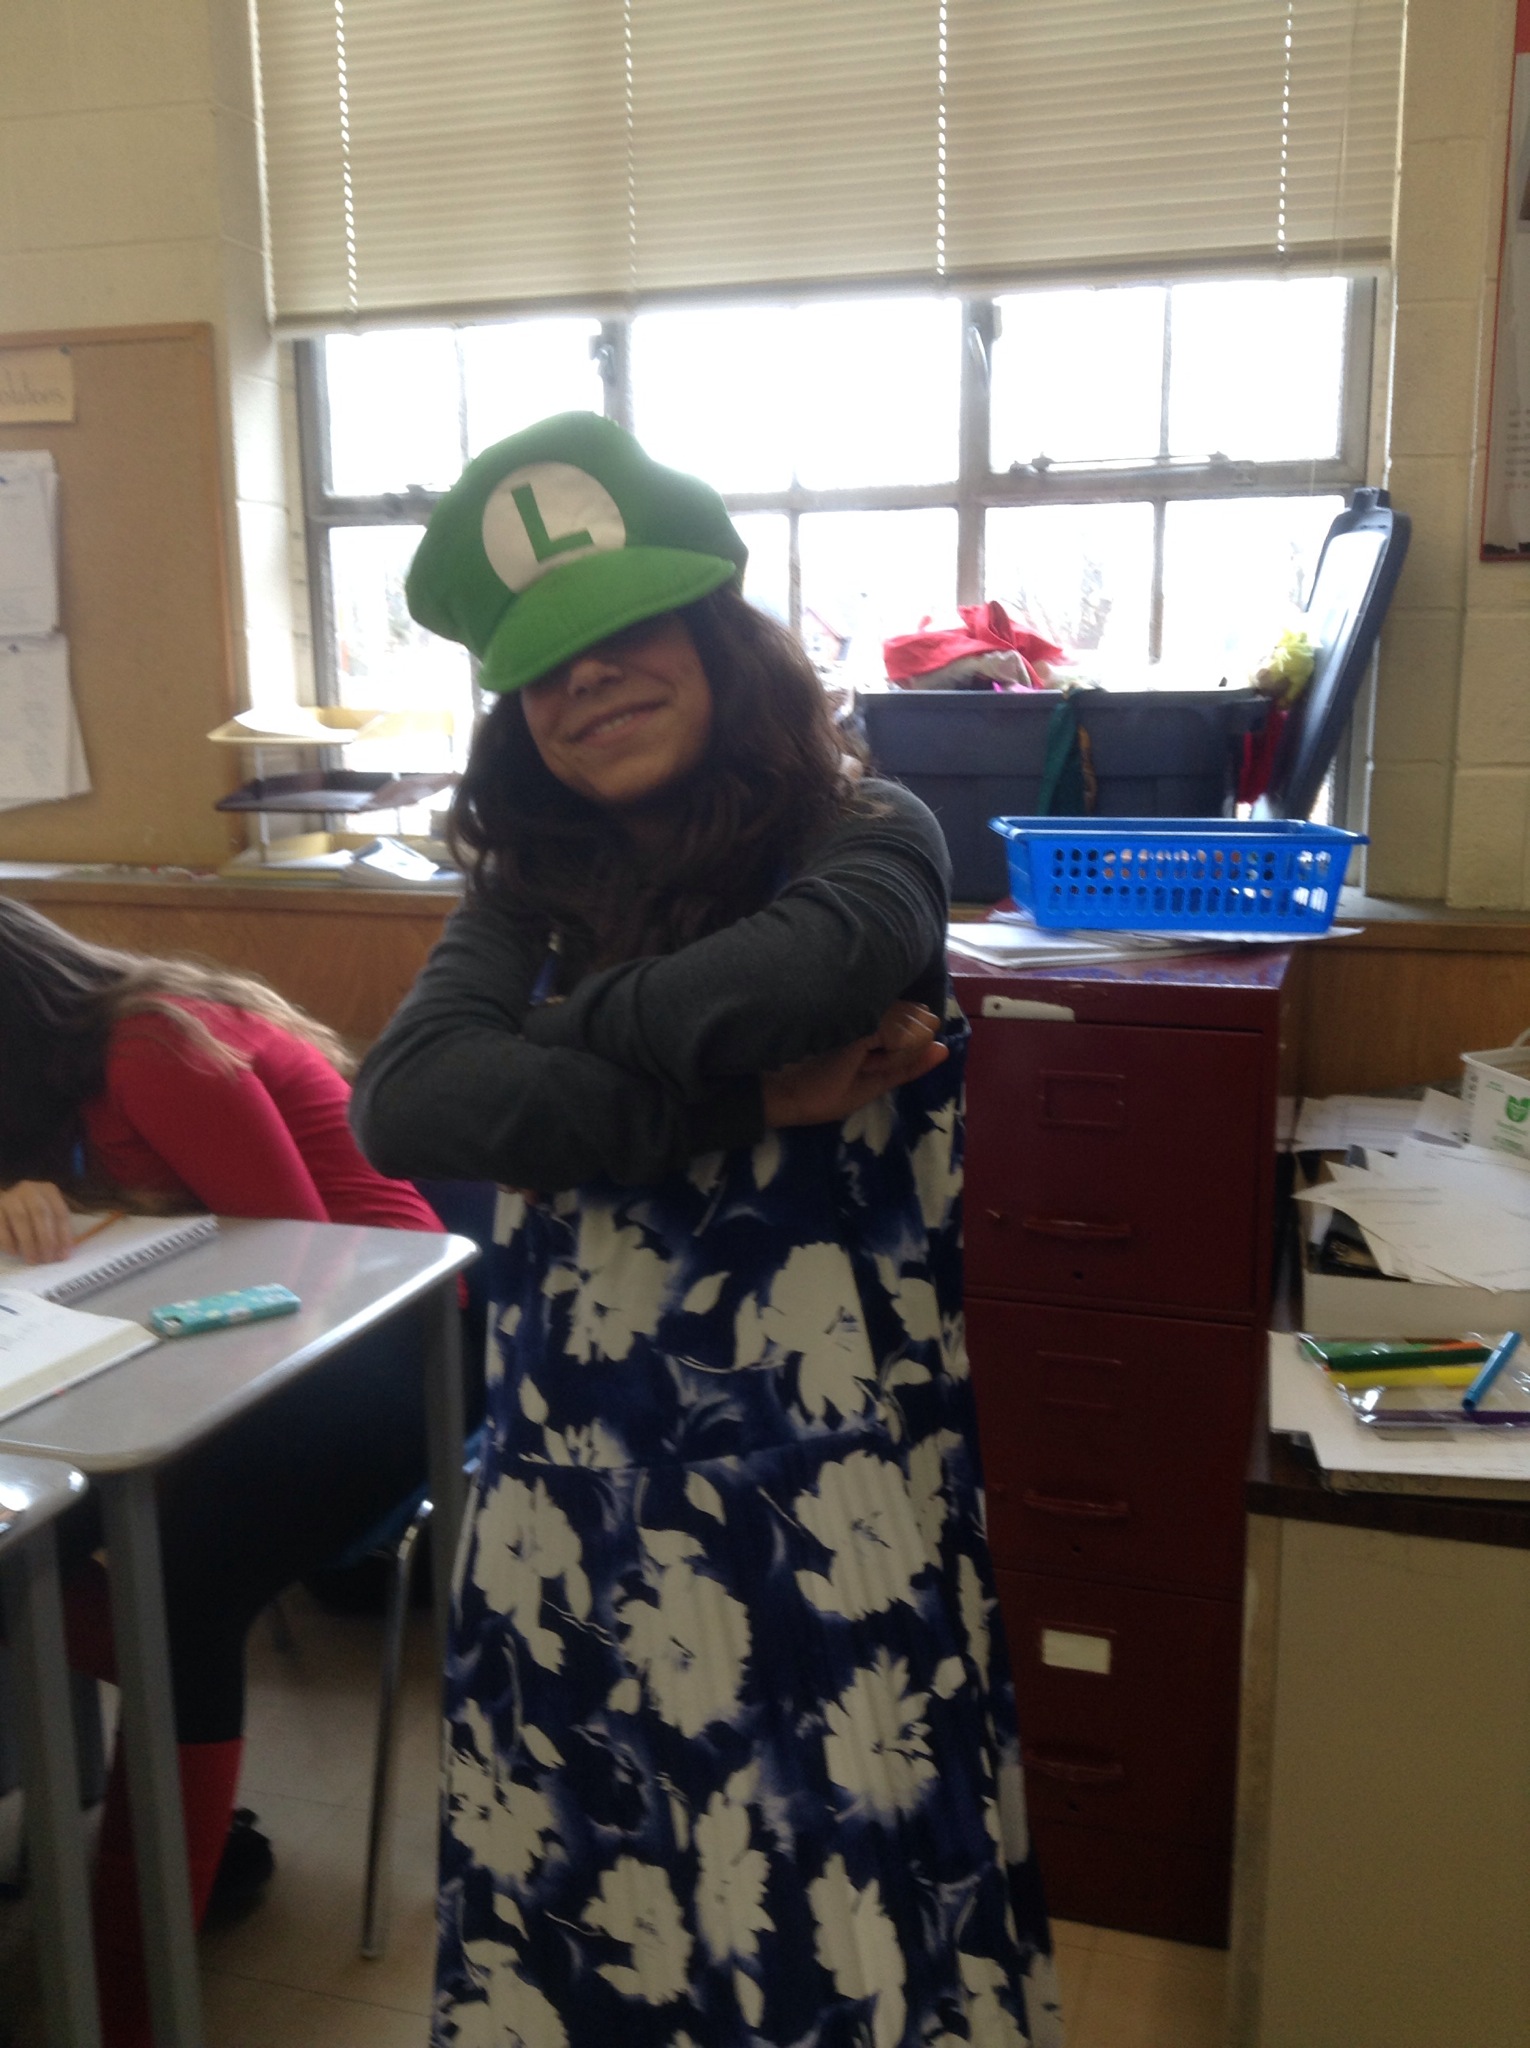
We had a happy hallowe’en, costumes and all 🙂
Tigers!

Sometimes we have moments of panic during a test where you panic. It’s like the fight or flight reaction like if you were to see a tiger.
Carving pumpkins
We had a pumpkin carving contest for the school

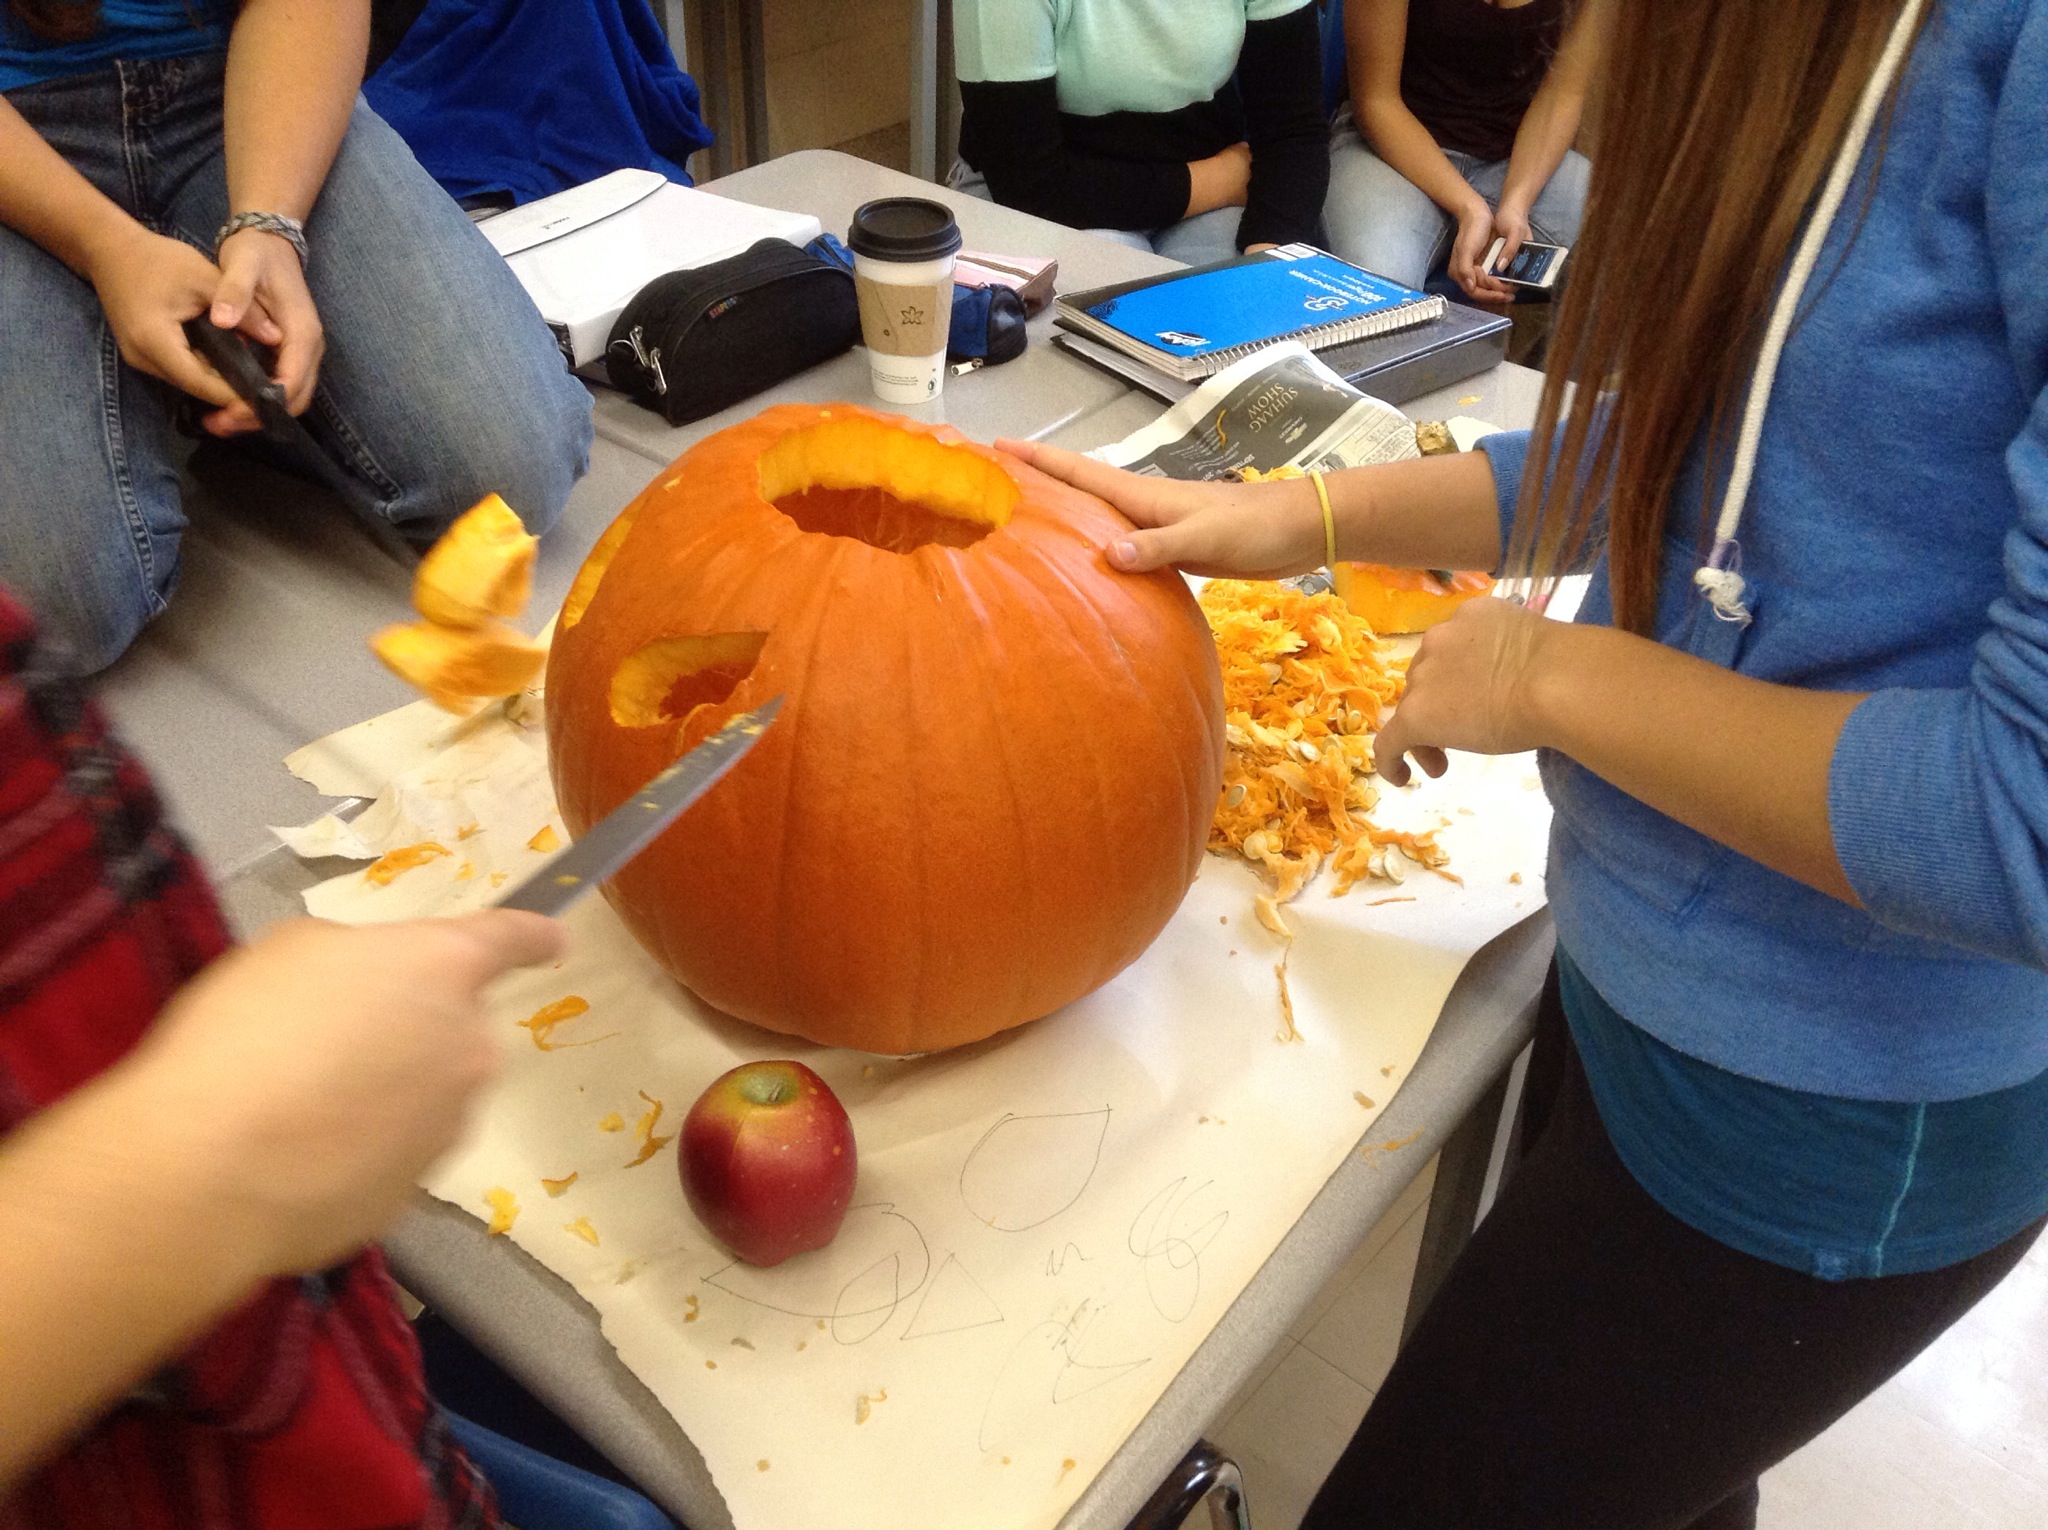
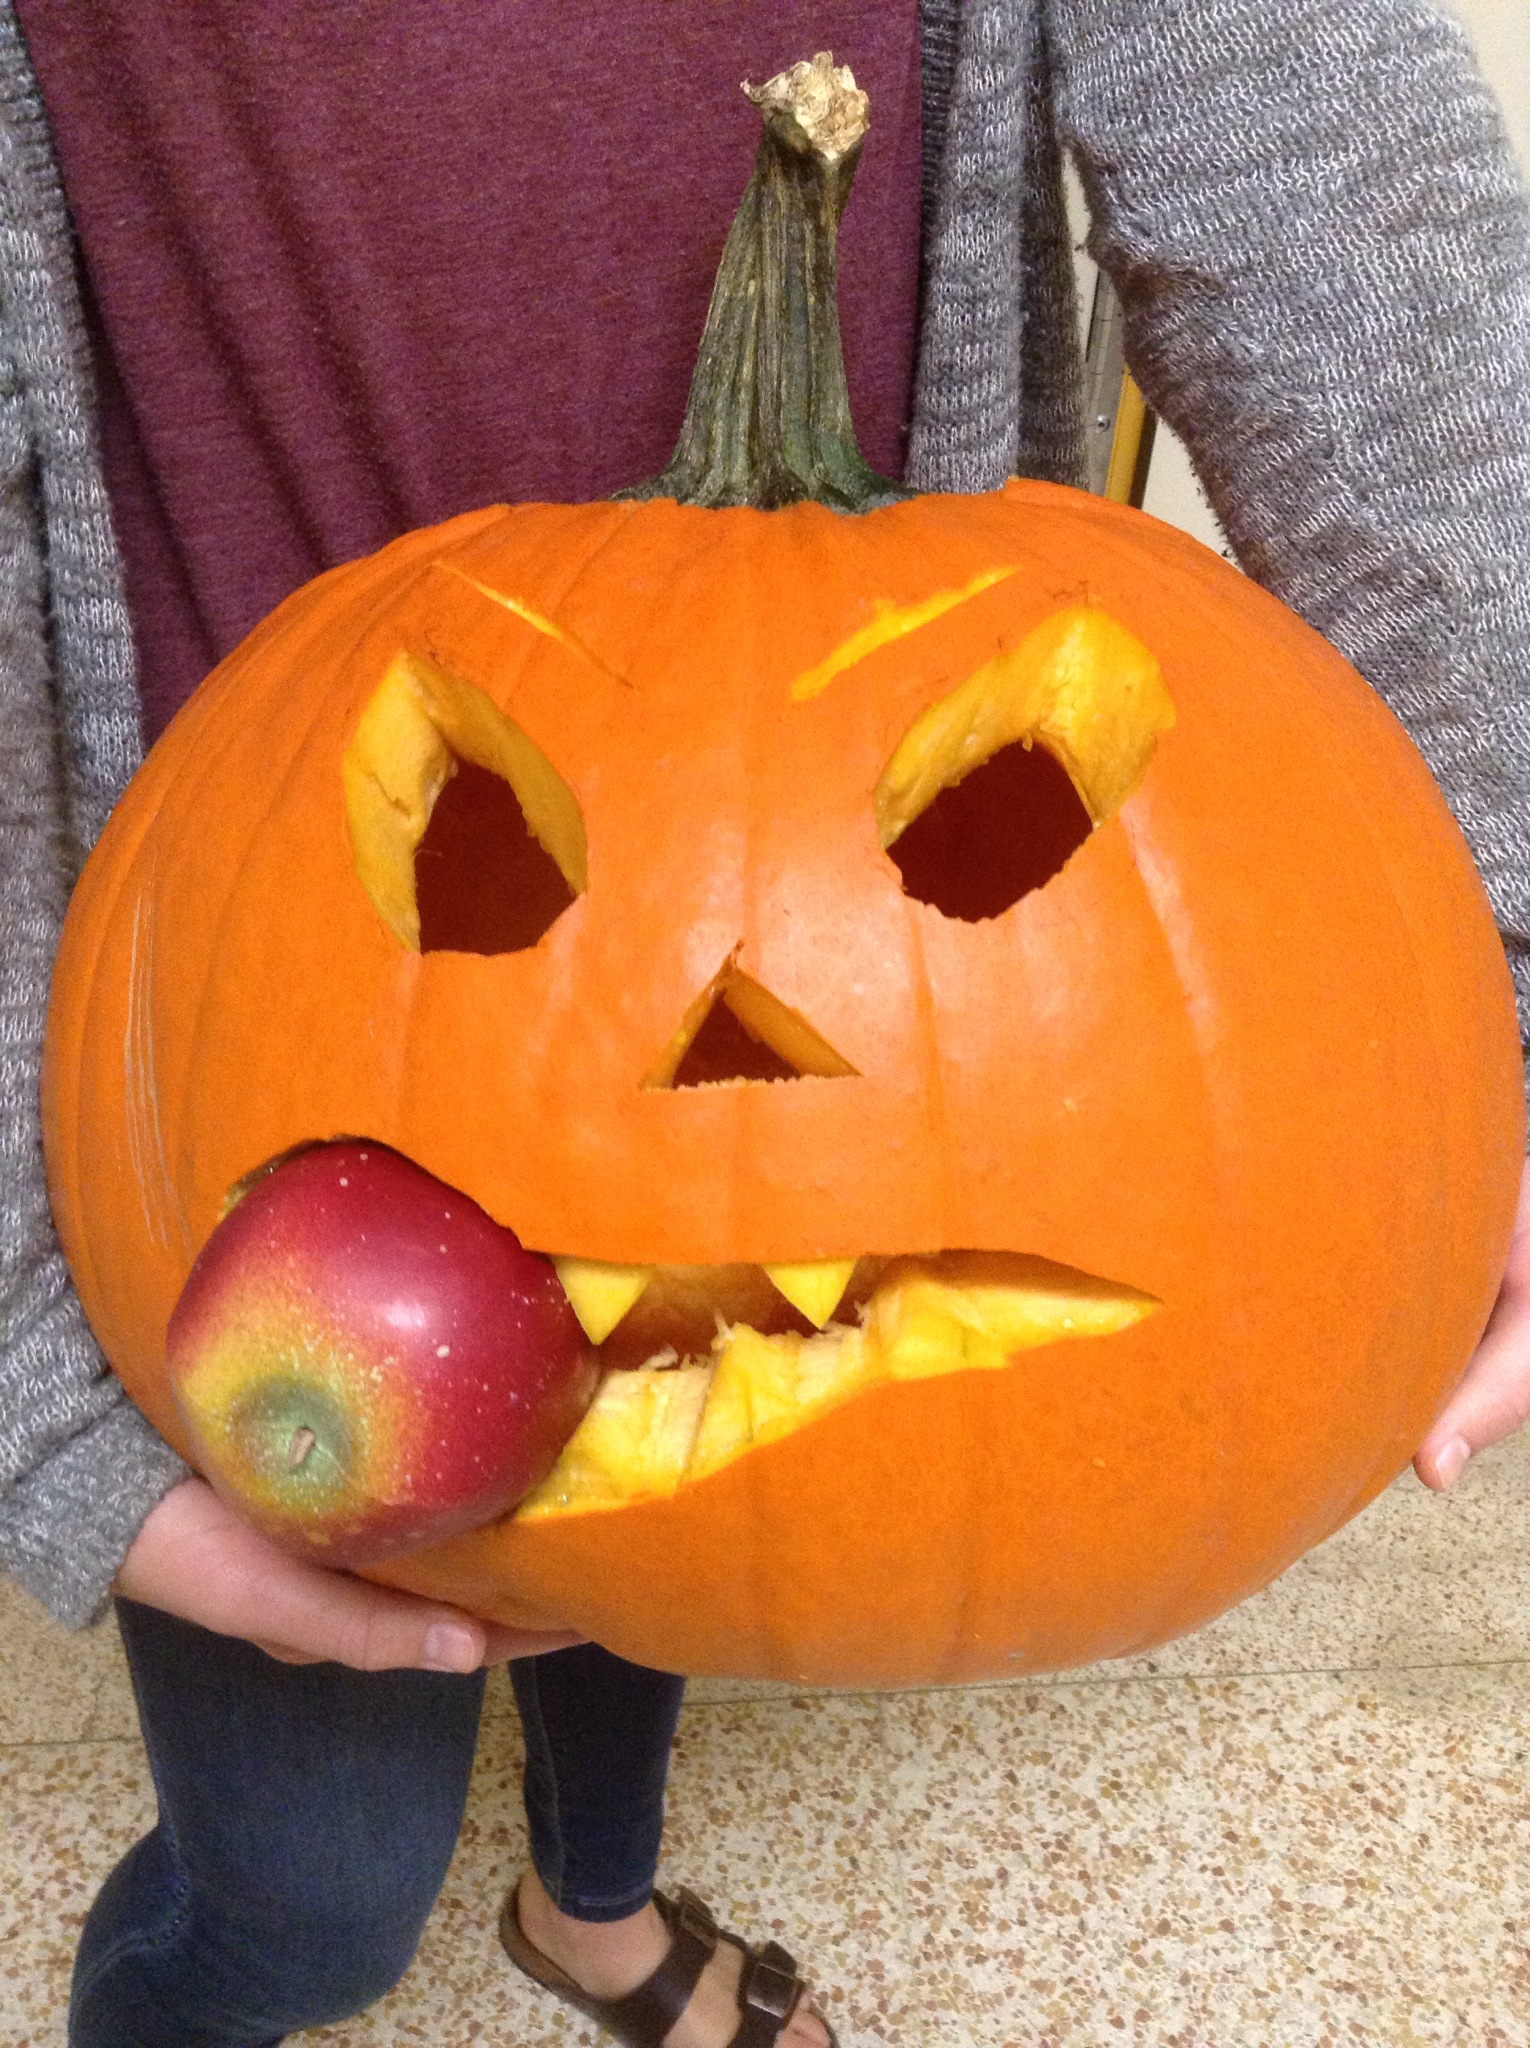
We had a lot of fun, and came up with something creative!
More balancing

Try this at home!
How full is this can?
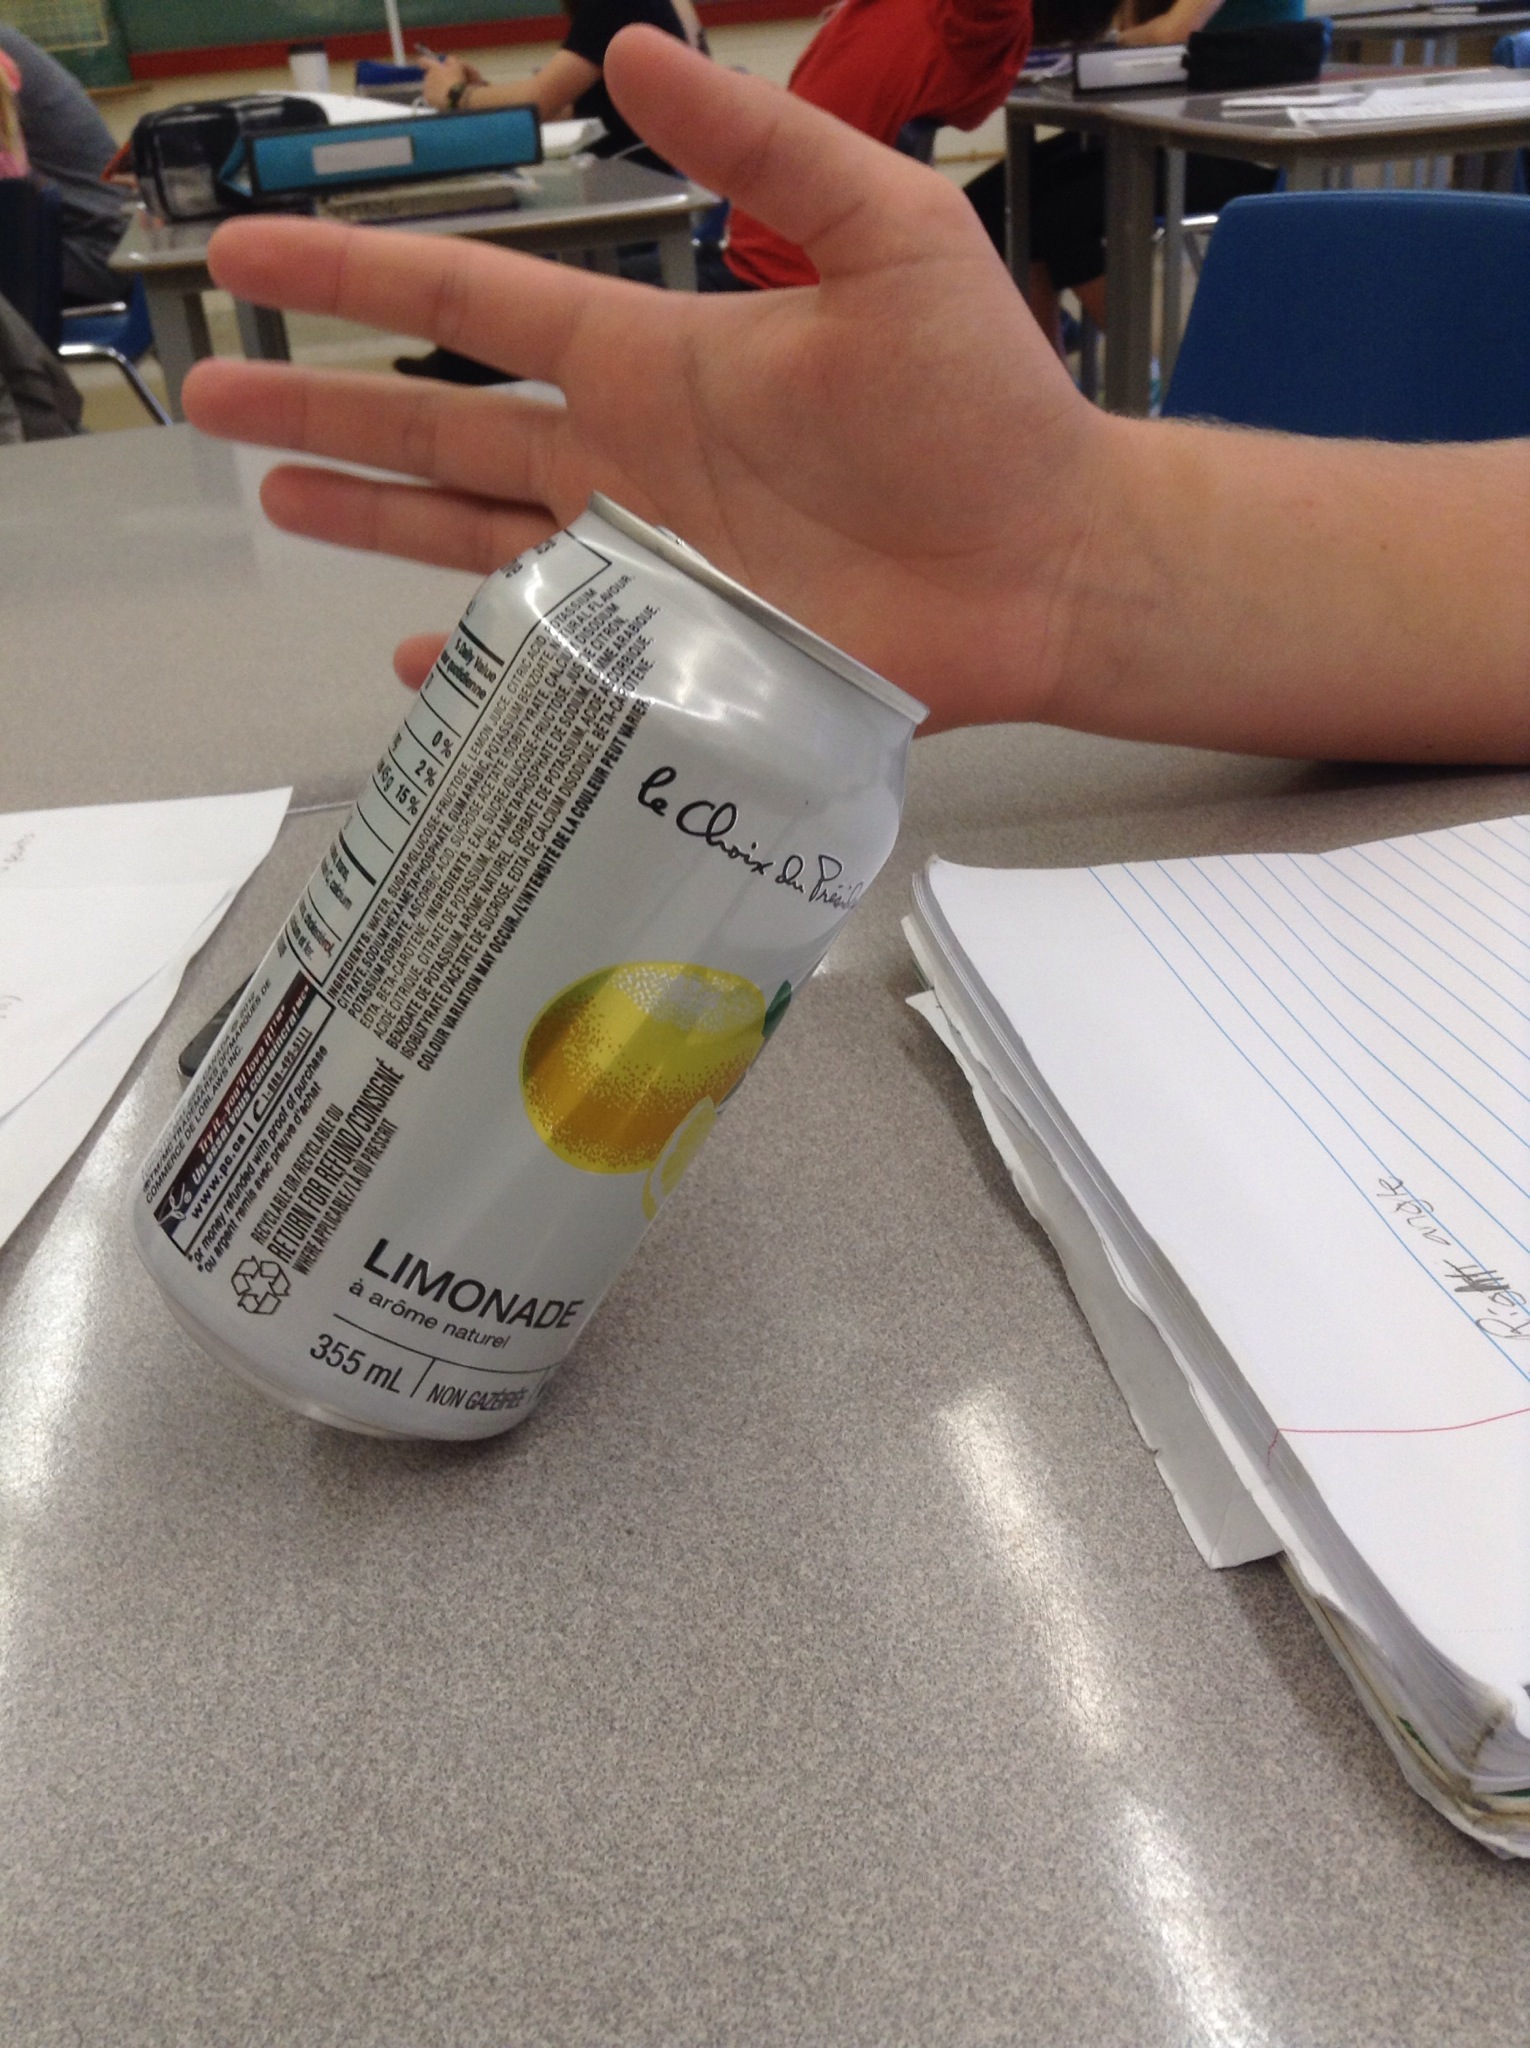
If you touch it slightly, will it fall over or will it roll around in a circle at this precarious angle?
How do objects balance?

Is there math involved?
Answer: yes, math and physics are definitely involved, and the results can be really artistic, and fascinating.
Why not go for a walk to the water and balance some rocks after school?
