Math Club For Grown Ups
We had our 3rd meeting of our math club for grown ups. Many thanks to all who attended and enthusiastically solved (or attempted) problems together.
We looked at 3 problems. The first was sourced by one of our students who needed a good challenge after their work was complete one day. We were led by a colleague who prompted us to think about our feelings as we were faced with this challenge.

We worked at it in small random groups for quite a while. I know that my group struggled with where to start, and if to work forwards or backwards, and we kept getting confused because we were instructed to NOT use BEDMAS which is hard.

We took a pause after about 30 minutes of struggle, and during that moment where we were considering our feelings, one of our groups solved it! (Spoilers ahead)

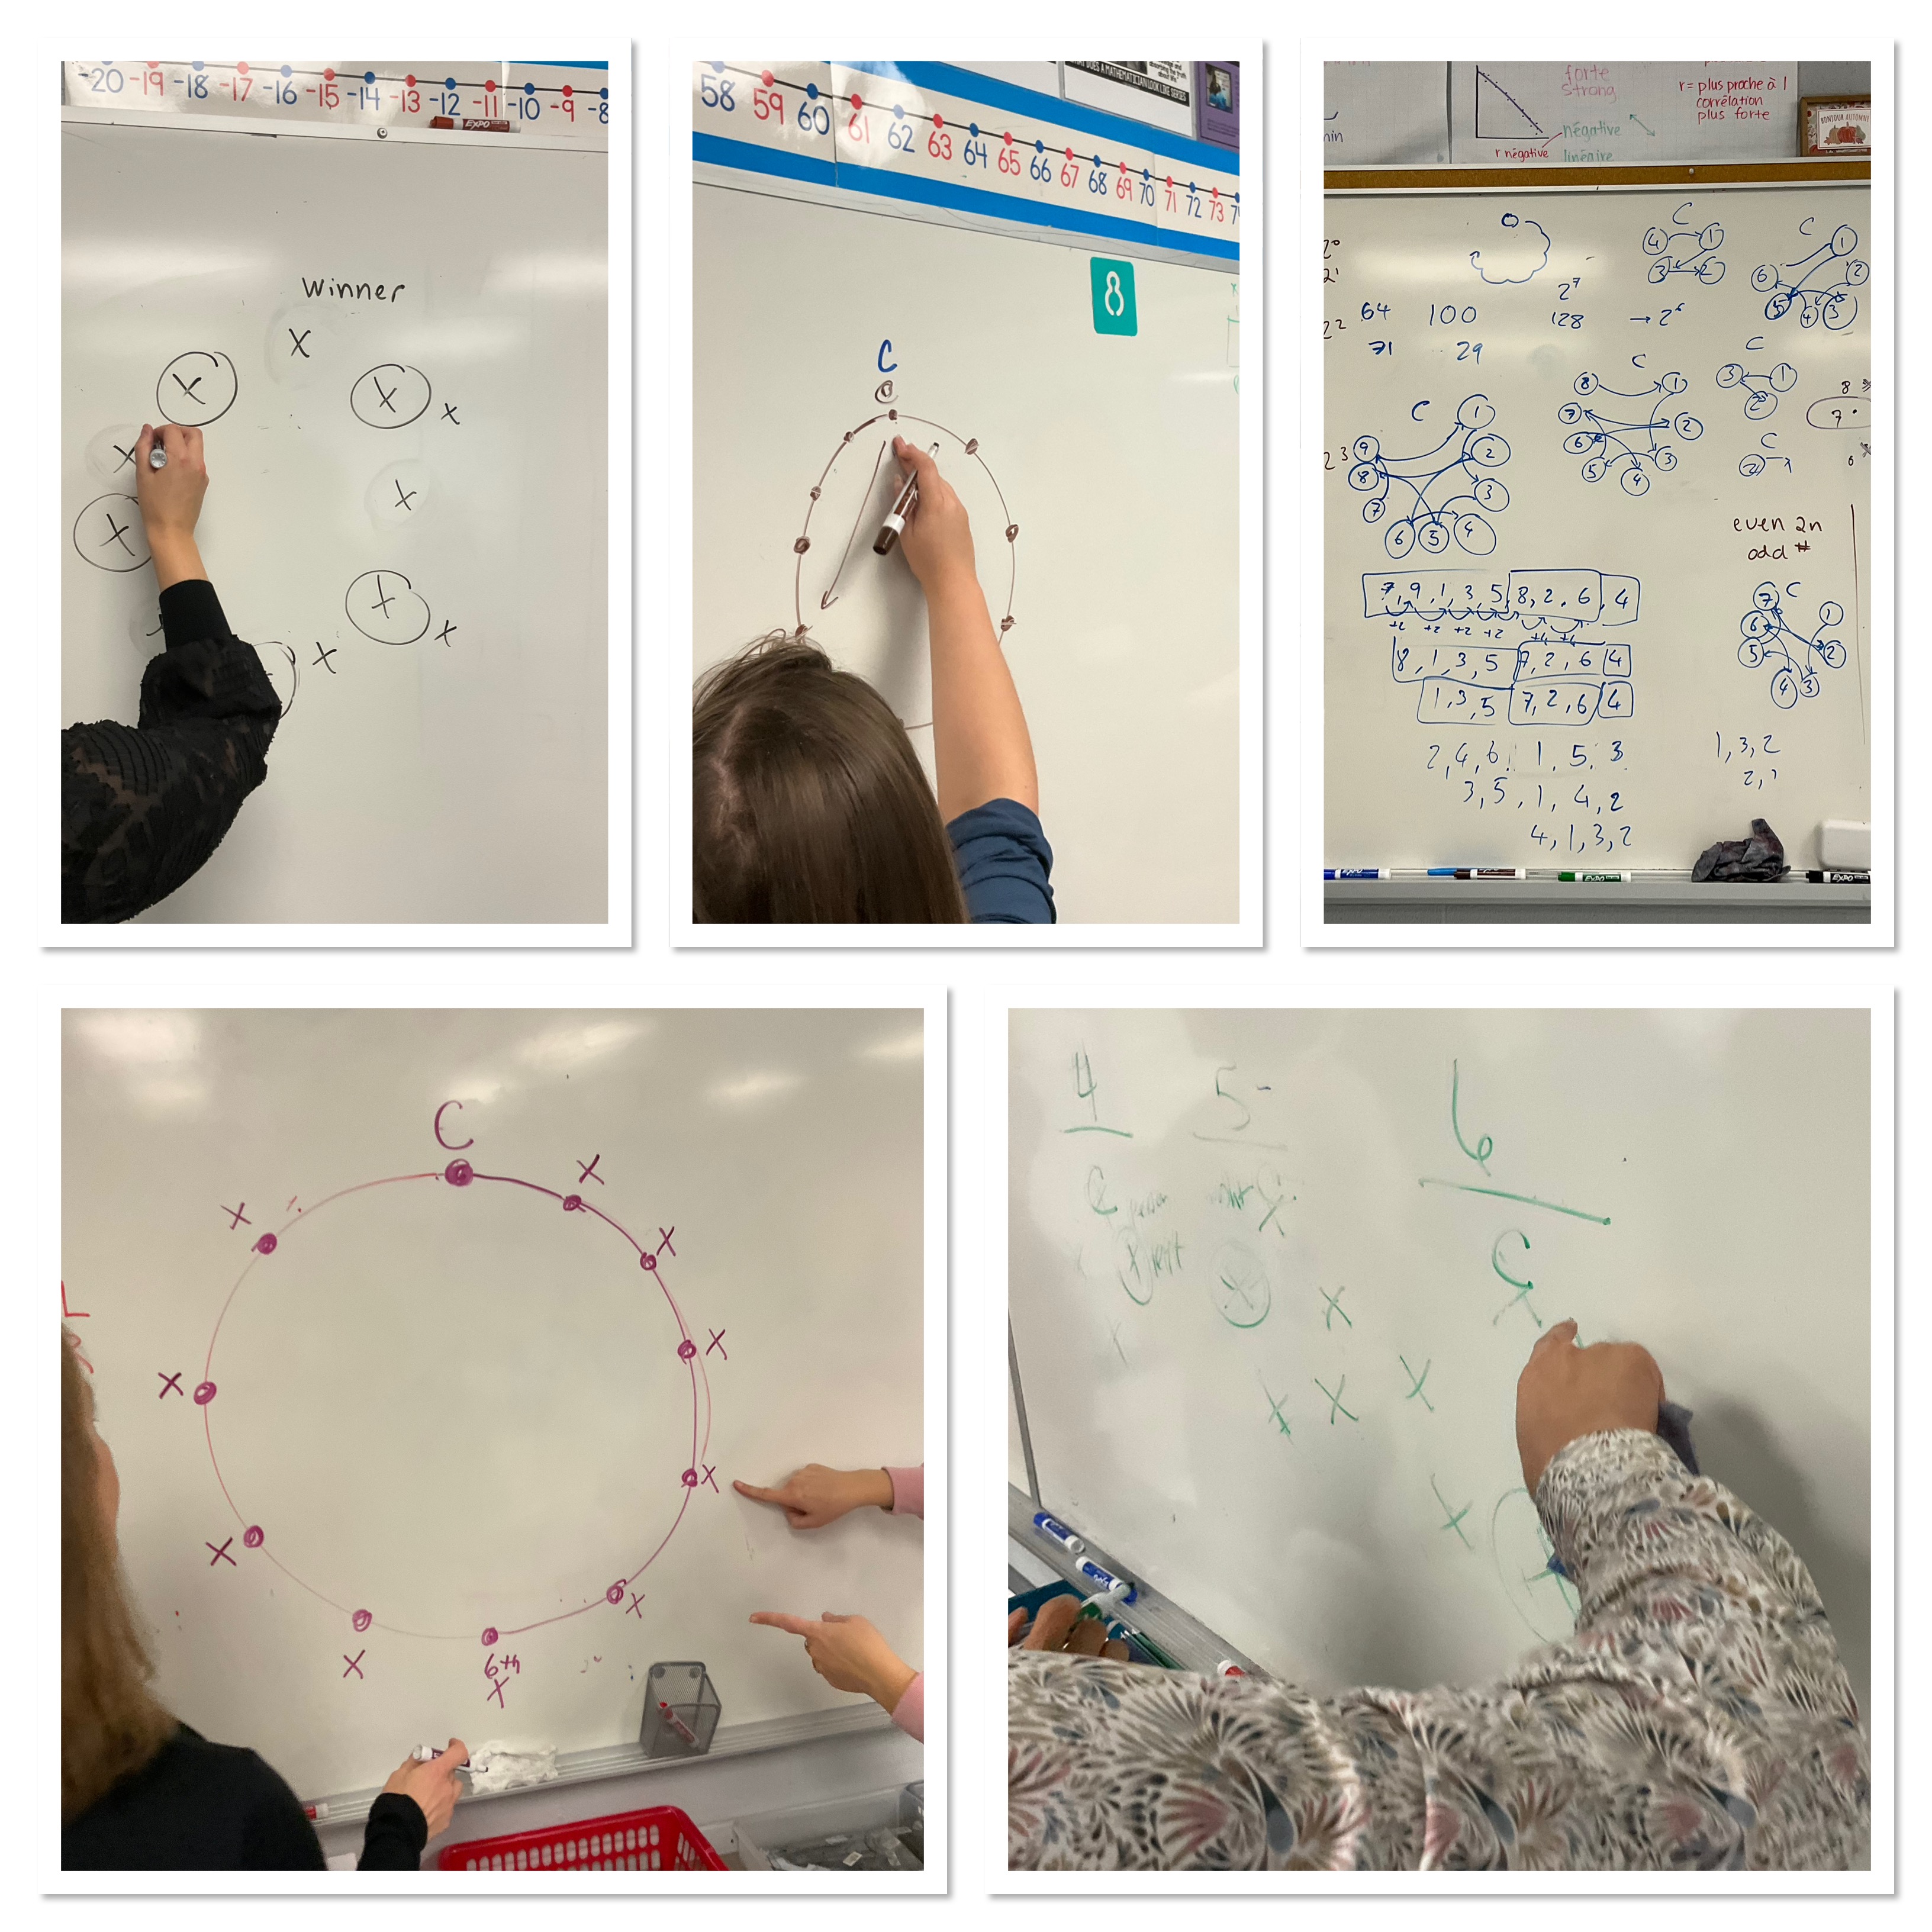
We next tackled the pirate question from Peter Liljedahl’s site.

We took time to explore the problem, and figure out how to keep track of our data and how to extend the patterns that we saw. Some groups didn’t want to start with 10 pirates, they started with a smaller case of 4 or 5 or 6, which in this case doesn’t clarify the situation as much as might be hoped. One group started off with a general case of n pirates which is quite an overwhelming task.
We made good progress, and left with people who were worried they’d wake in the night with new solution ideas!
The final task we looked at is how to use cup stacking in grade 9, 10, and 11/12 math as a way to explore and model linear, quadratic and cubic patterns.
Cups stacked in a single tower are a great linear model. Cups can be stacked from a desk to get a “b” value. If the cups are stacked in a nested fashion from the desk, and an upright/inverted fashion from the floor, you get a linear system that could be solved.
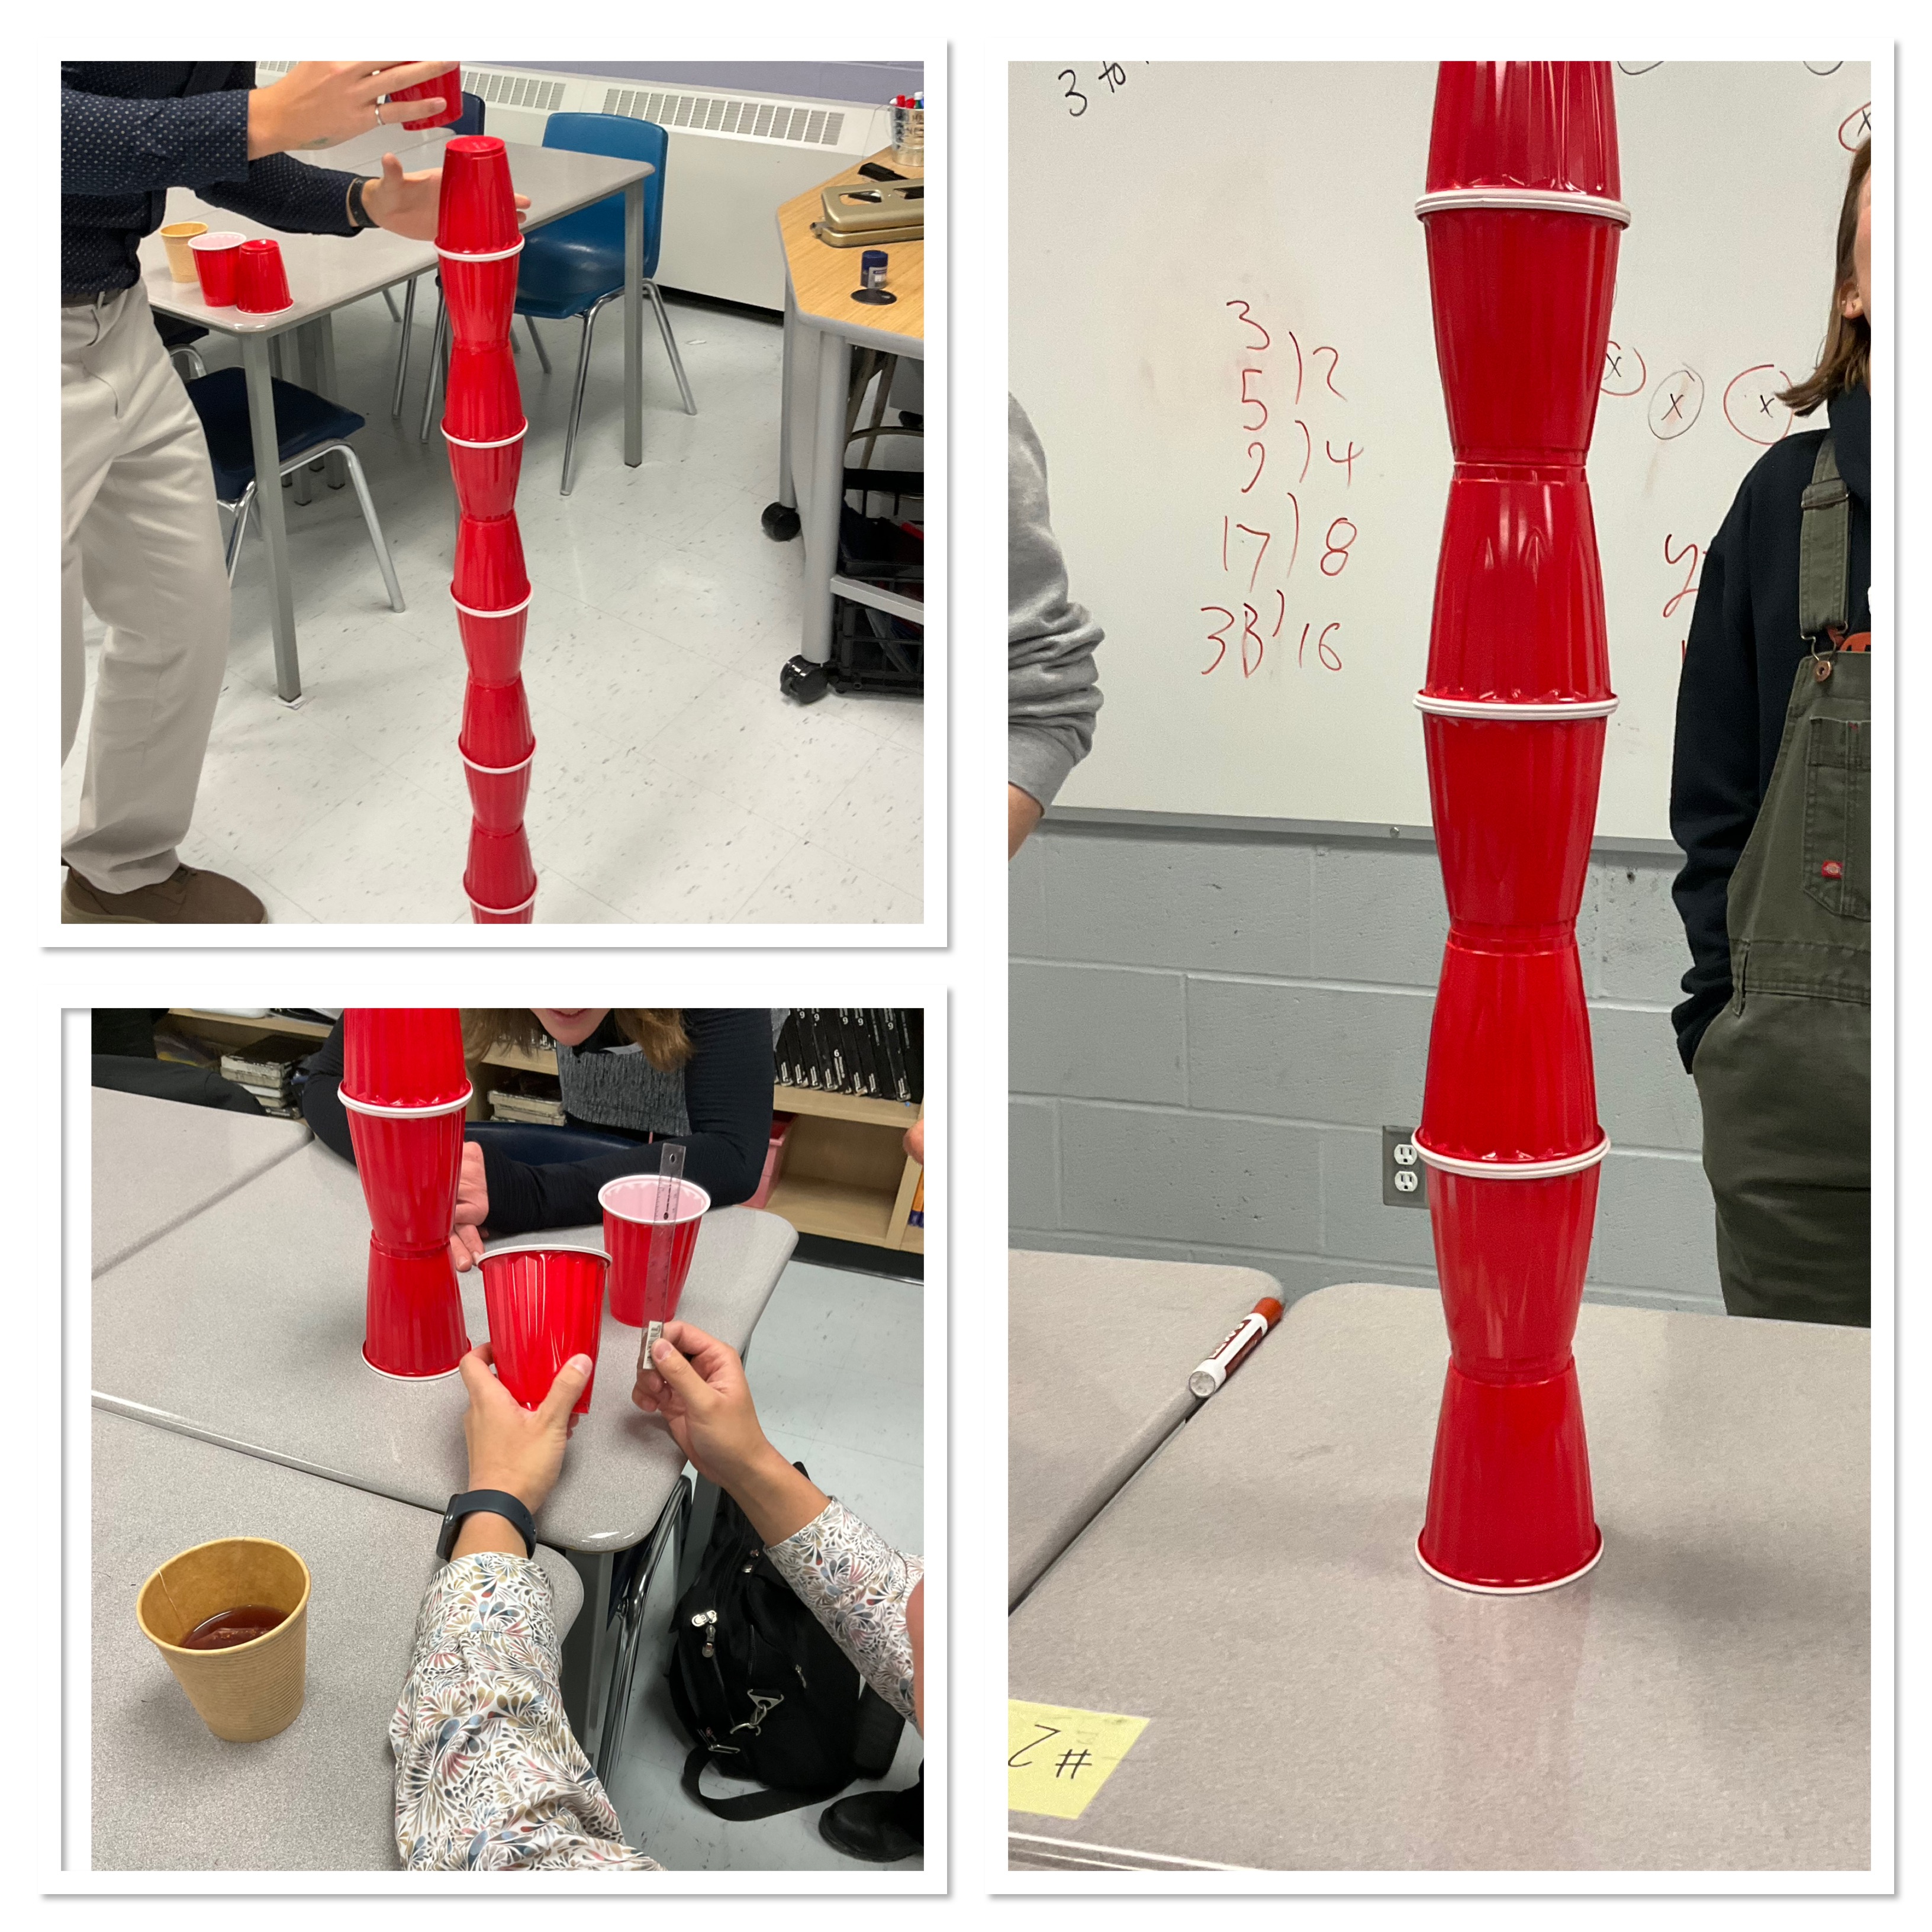
If cups are stacked in a triangle, it’s a quadratic model. Some good prompts would be: “How many cups are needed to make a triangle stack that’s a meter tall?” or “as tall as me?” or “how tall of a triangle stack could you make with 300 cups?”
The modelling could be done by hand for a 2D class or with desmos (there’s a nice regression button available now) for a 2P class.
If the stack is a pyramid (either square or triangle based) the model is cubic. This would be a good question for grade 11/12 functions or advanced functions to explore by hand and confirm with desmos.
It’s fun to be able to see and feel the model that you are making. There’s more sense making when you can see that there are so many more cups needed to make an additional row in quadratics compared to linear, and even more when using a cubic model.
I can see extensions where a cubic, quadratic, and linear model are all explored, looking for intersections. Different types of stacks could be built starting on desks or shelves or the floor to include different vertical translations.
I also brought in paper cups which are exactly half of the red cups (total fluke), but it brings about a nice conversation about the vertical transformation that occurs. The graph has a vertical compression, because each cup is half, so the entire stack would be half the height of the stack made with the red cups. I look forward to the chance to try this with my next sr. math class.
Desmos makes noise!
Desmos makes noise. I let my class know that I remember making graphs tat could be heard, to help people with visual impairments understand what graphs “look like” but with sound. I had forgotten how to do it, but sure enough my grade 10s figured it out within 5 minutes and were exploring what parabolas sounded like. At this point I knew we could either stick to my lesson plan (and have it be derailed every 30 seconds by a “noisy parabola”) or to just go with it, and explore graphs in a very different way than I had ever done with a class.
We used the graph y=(x+2)(x-5) as our starting point and listened to the graph.

It makes a static noise as it traces part of the graph. We had to replay it a few times to figure out when the sounds changed (static is when the graph is below the x axis, negative y values). It make a brighter sound for part of the graph, we figured out when that happens (positive x values). We then figure out how to make the static sound longer or shorter by changing what’s in the brackets. Students made connections to how the factors control where the parabola crosses the x axis (the goal of my lesson) but achieved in a different way than anticipated.
We looked at how there could be a whole family of parabolas that crossed the x axis at the same spots (we added an “a” value and then used a slider to show how the graph changes as the “a” is positive and negative, big and small, and of course we ended up animating it).
We made connections between factored form and standard form, and looked at what information from each equation is shown on the graphs.
There were some connections made between how factored and standard form are different ways of describing the same relationship, similar to how we can describe area or dimensions of an algebra tile rectangle.
Pirate Math
Today was a snow day for us, and when the school buses don’t run there are far fewer students who come to class. Today I wanted to explore a problem that I hadn’t led before, it’s one of Peter Liljedahl’s good questions.
10 pirates are disbanding, and although they could easily split their gold, they cannot split a very precious diamond. The pirate captain wants to rig a “fair” way to decide who gets the diamond. They all stand in a circle and the pirate captain points to someone in the circle who is out of the running (they take their gold and leave). The person to their left is in the running, but the next in the circle to the left is out. Every alternate person to the left will leave the circle until only one person remains. Who should the pirate captain point to so that he himself ends up with the diamond.
The extensions are: what if there are 12 pirates, or 11 pirates, or 18 pirates, or 5 pirates, or 6 or 7 pirates.
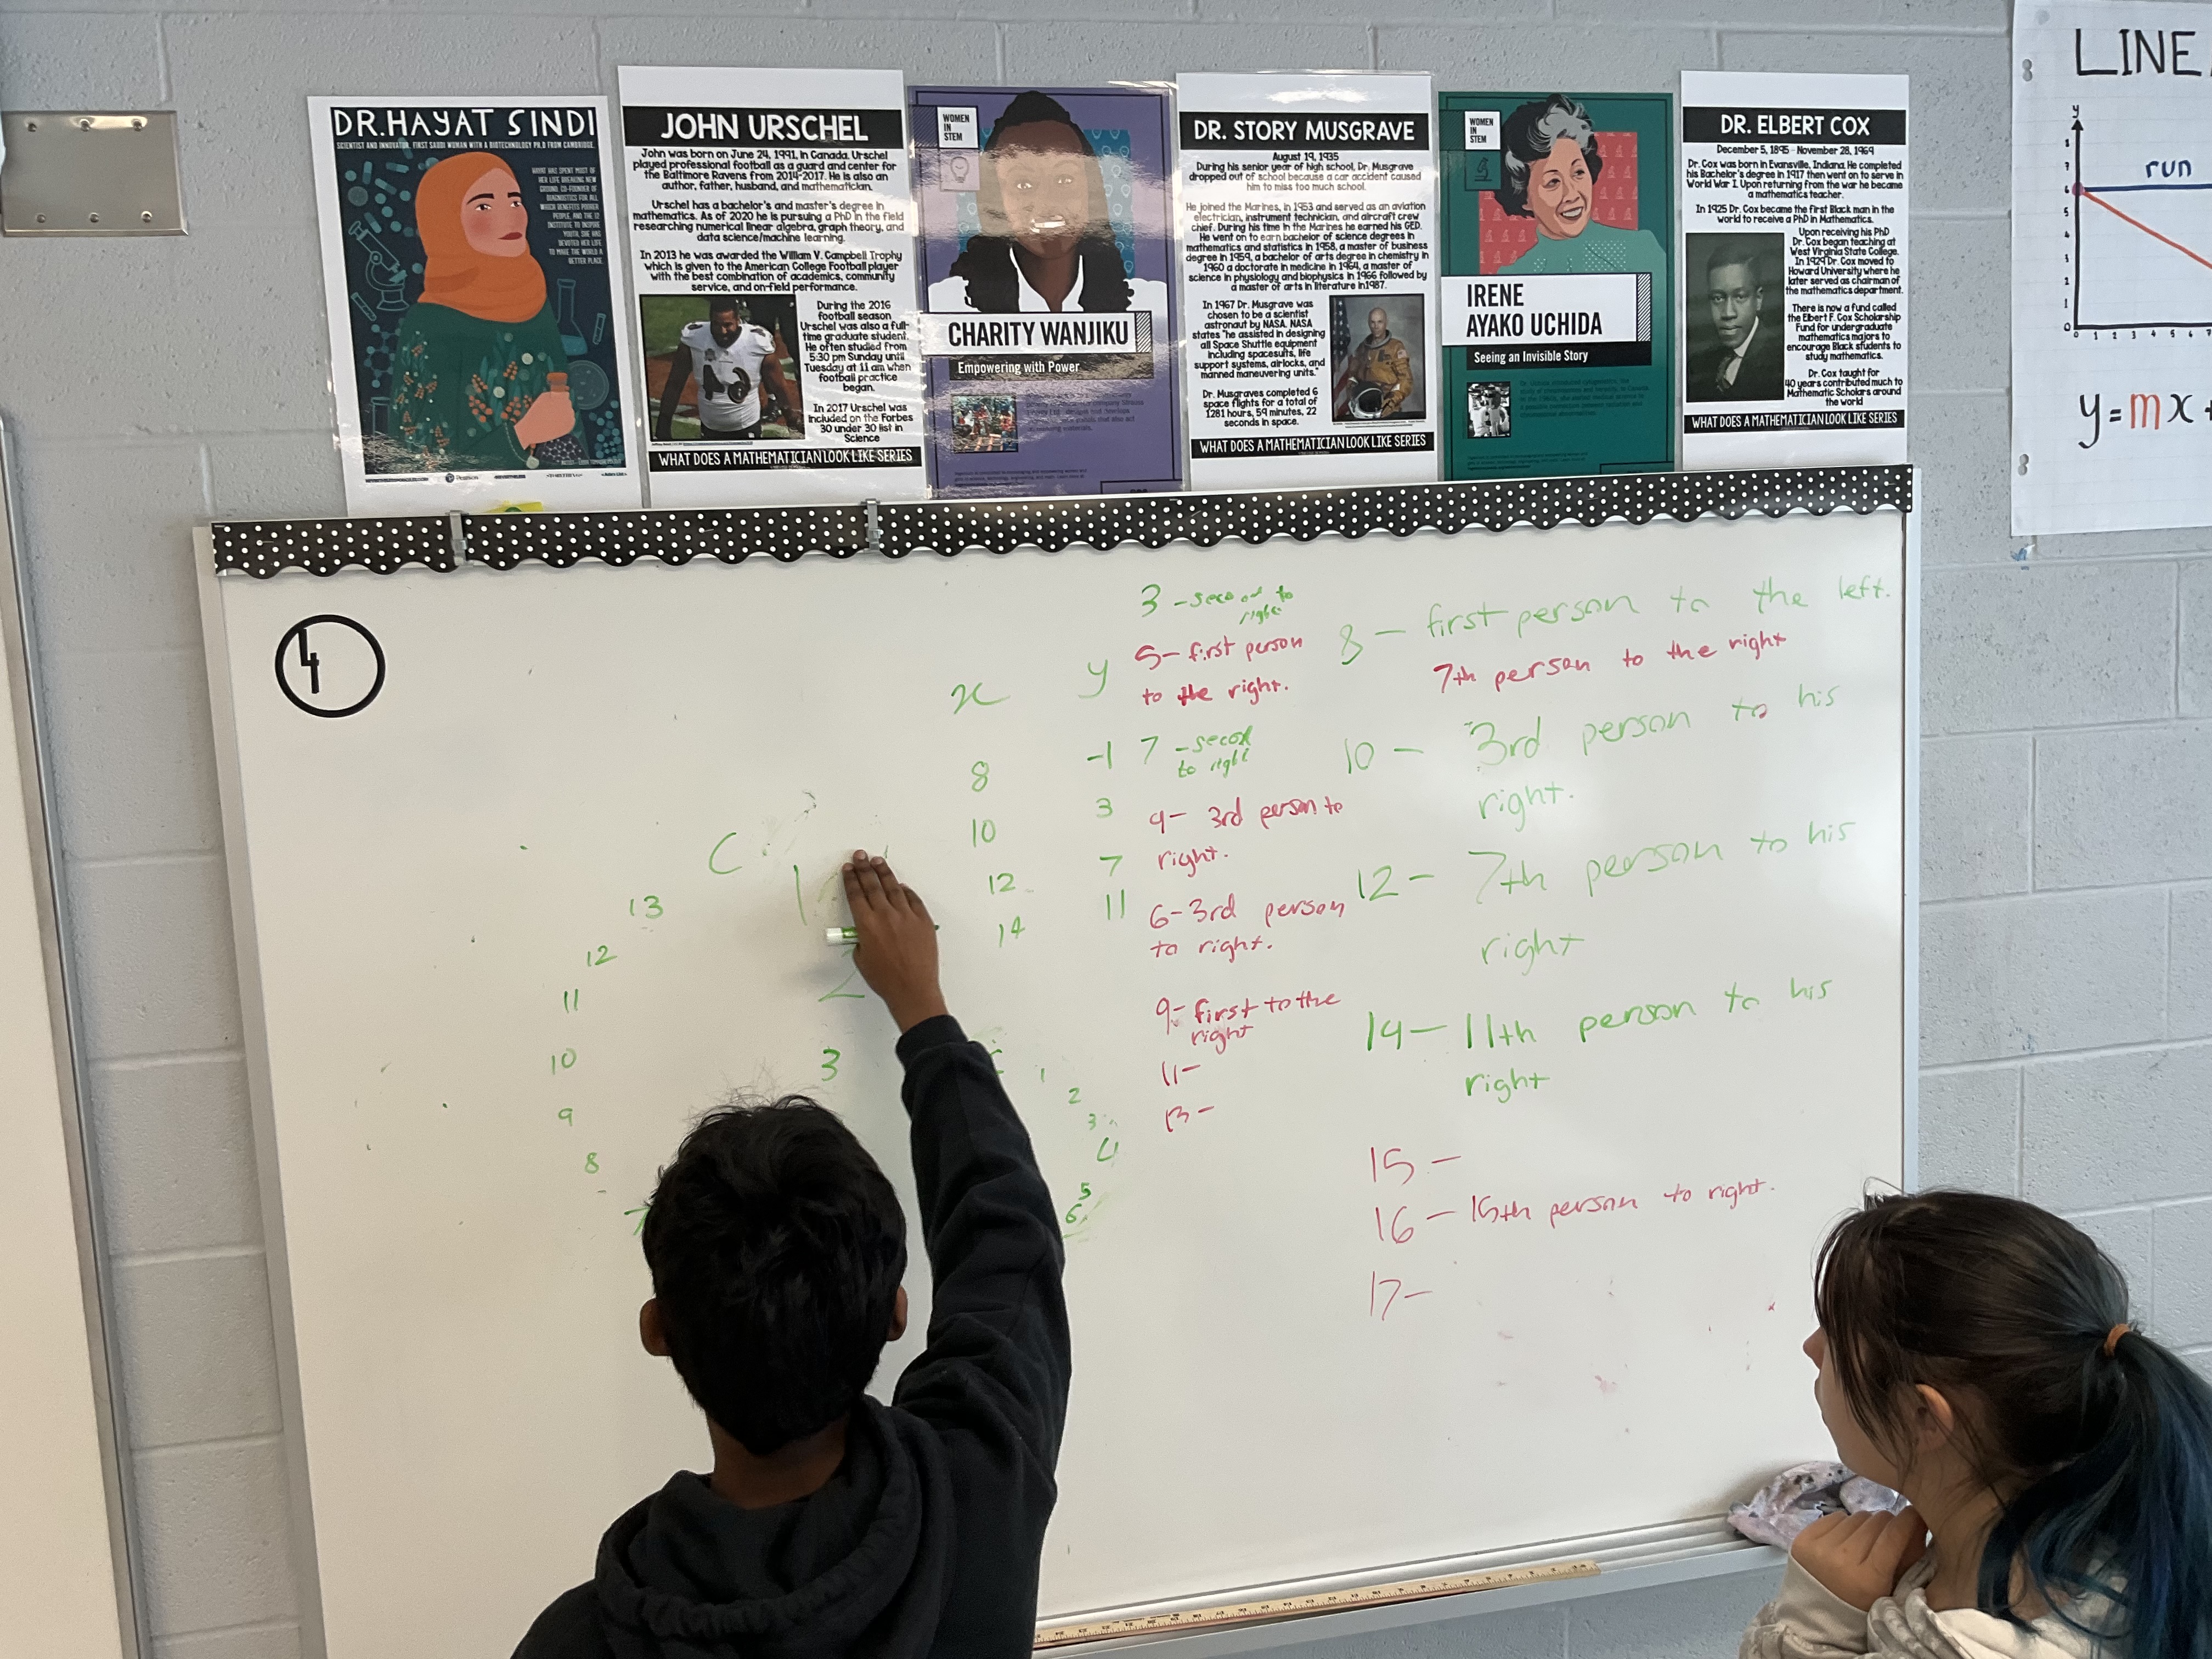
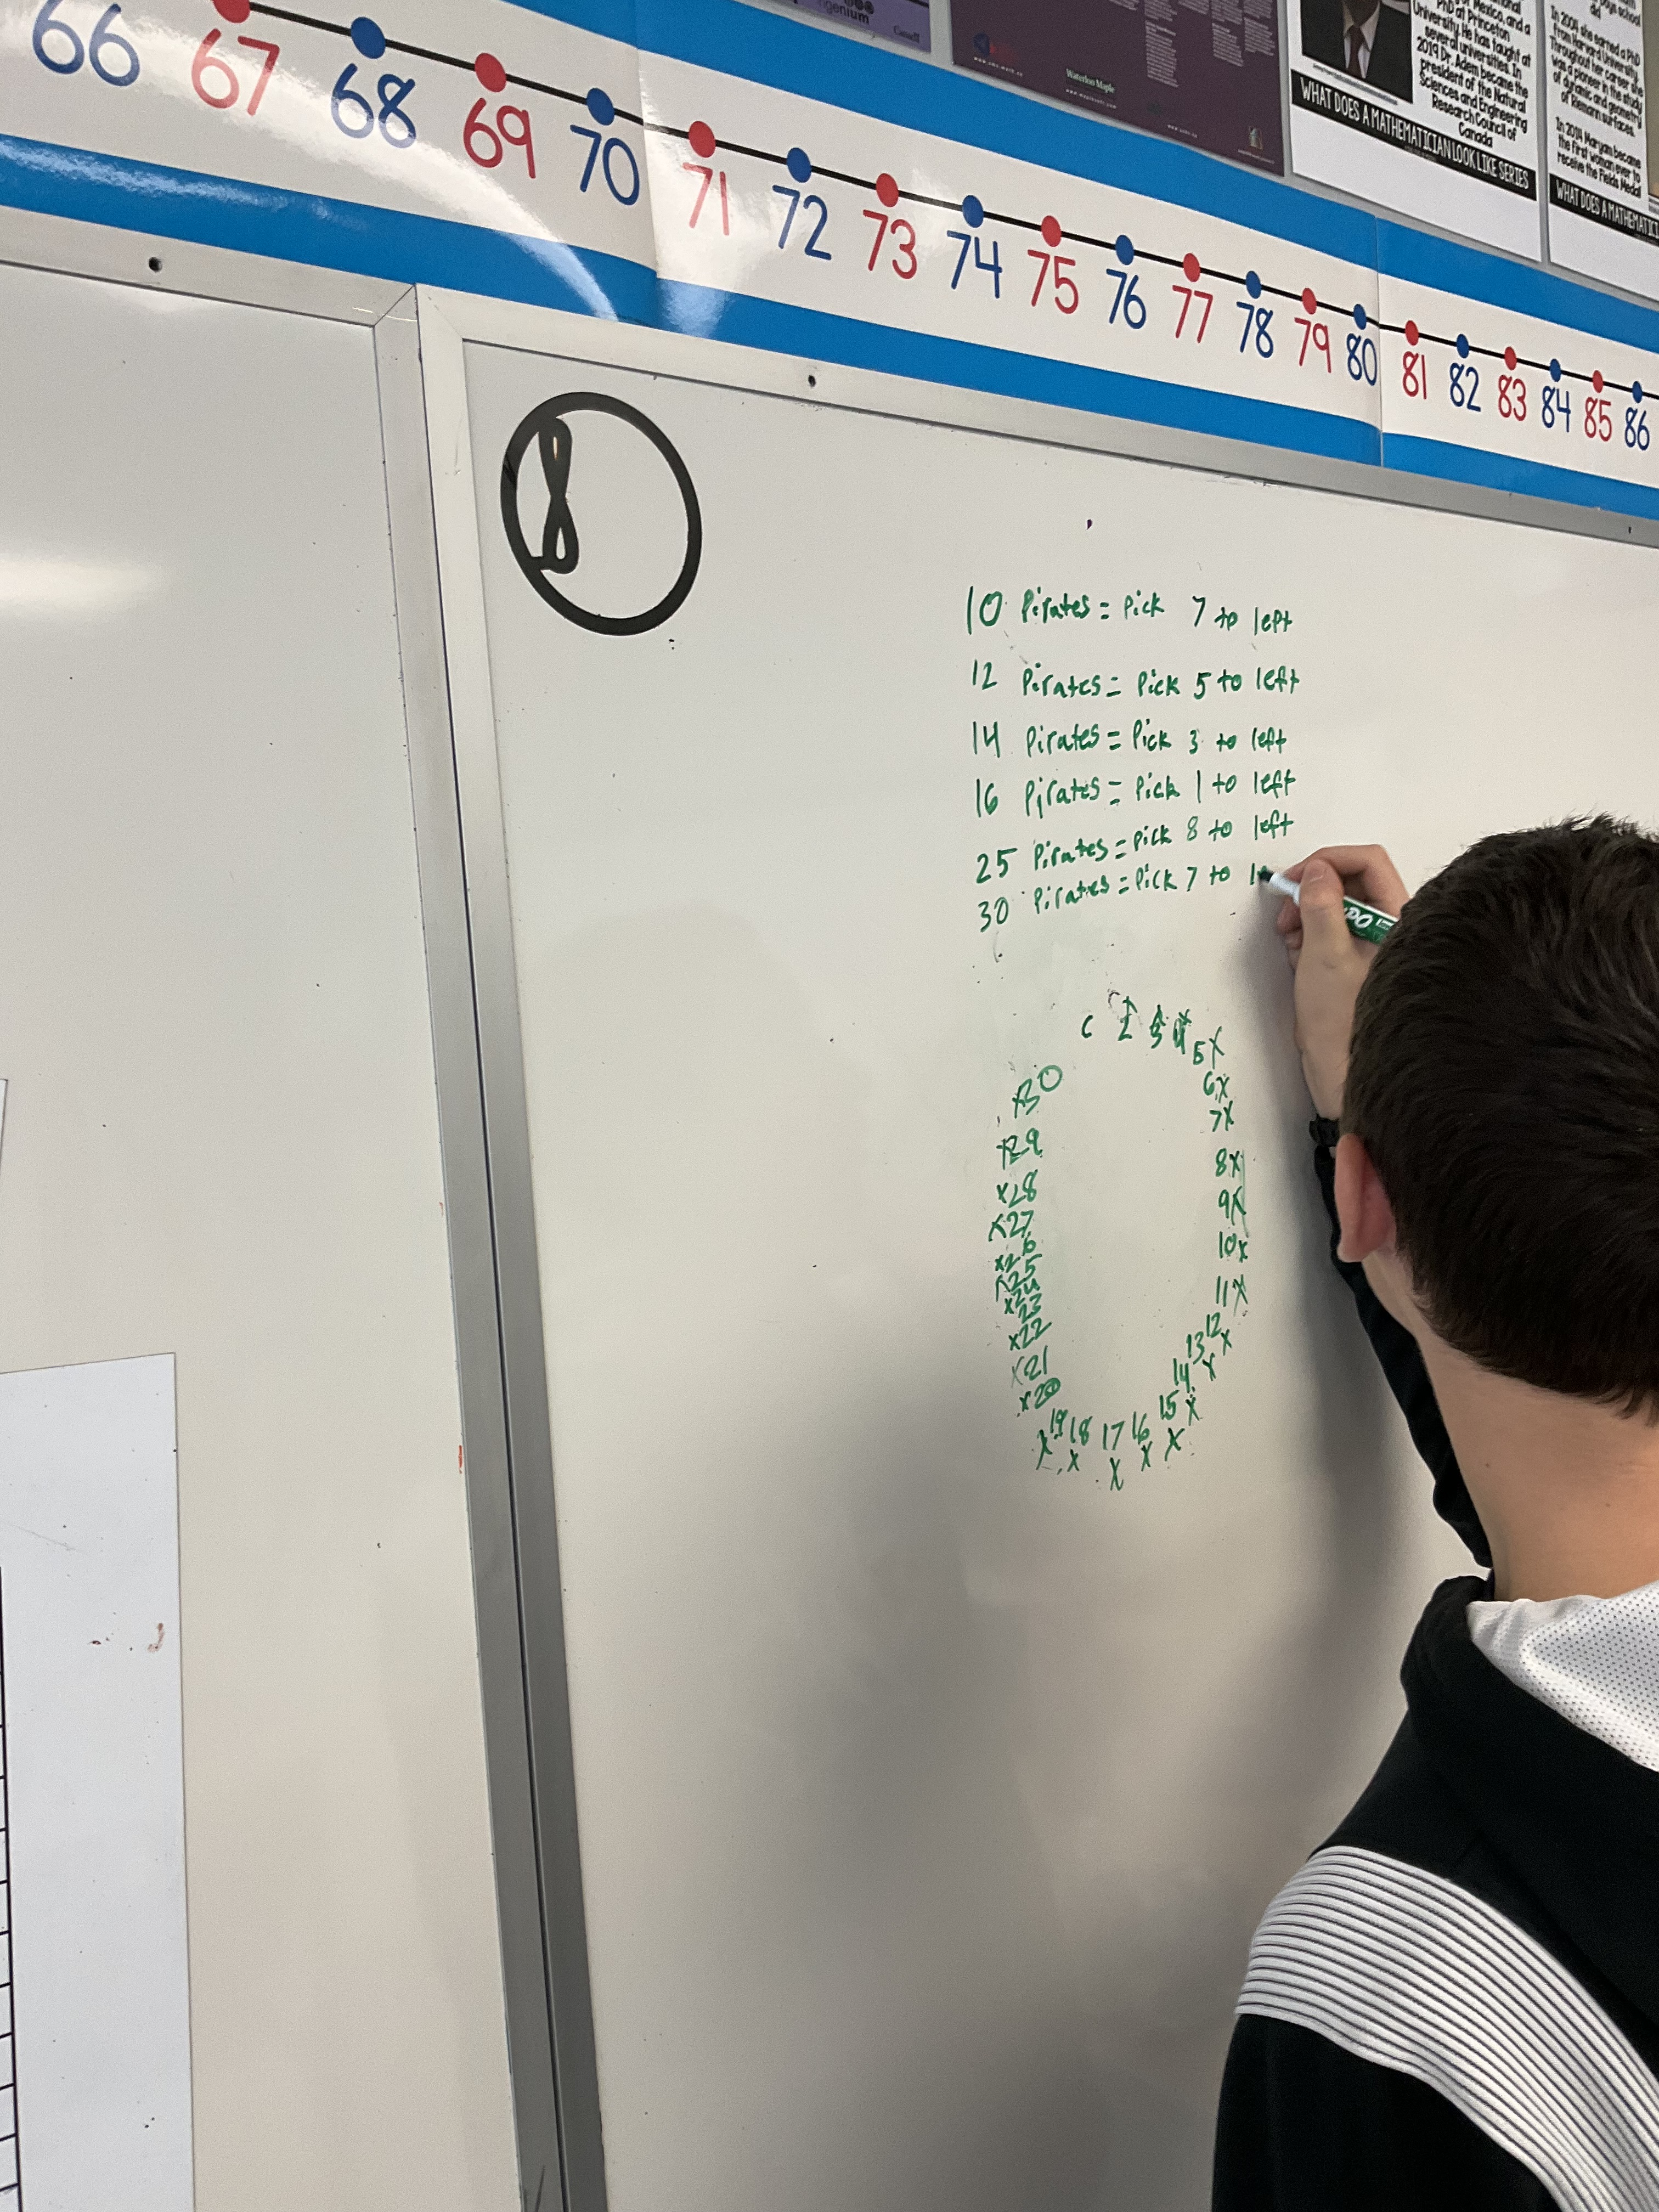
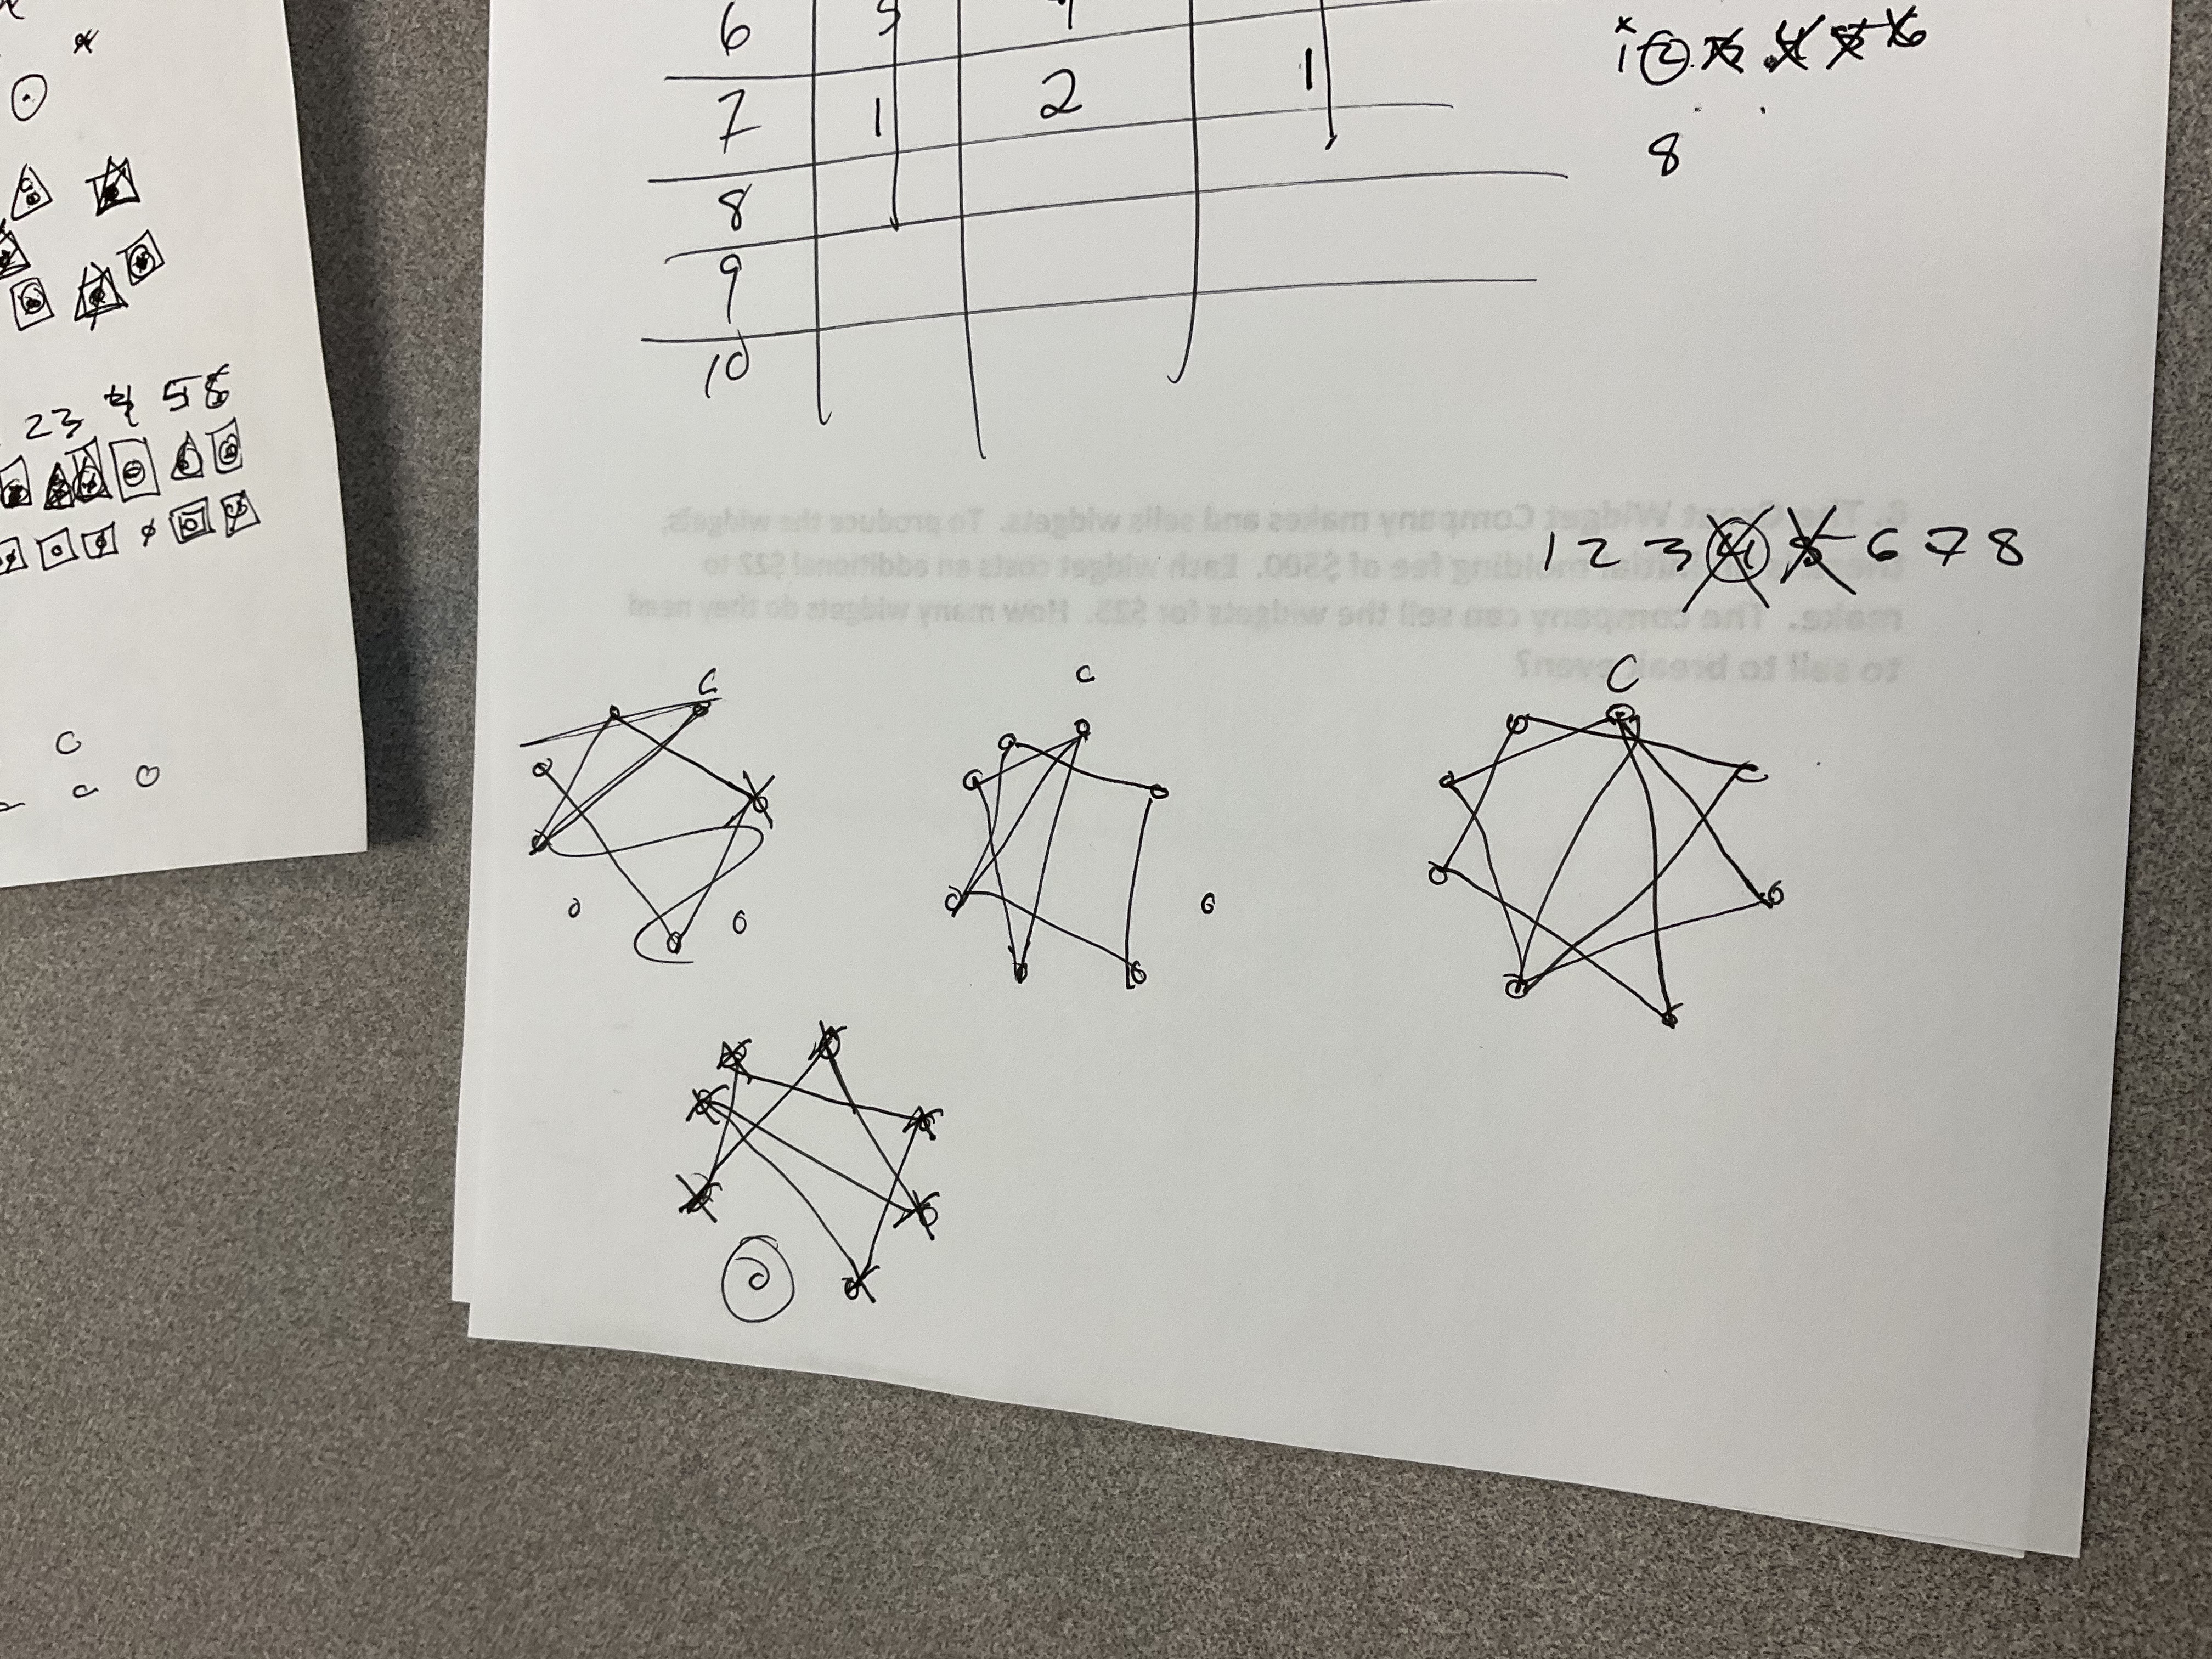
We needed to decide on a common way to discuss the issue, and came up with tracking how many spots to the right or left of the captain that he should point to start the eliminations. We worked on ways of drawing and tracking information, and then looked for patterns.
Without too much prompting students (grade 9 and 10s and 12s) dug in and modelled the problem, then made some connections. Some tried to make equations and graphs and extend their thinking and test predictions. We ran into some challenges, but persevered! Some teachers even came to try out the pirate math.
Pretty good for a snow day!
Solving Systems By Elimination
We were solving up a storm in grade 10 today.
We did several 3 act tasks
and
It was great to see the progress that groups are making in modelling the questions, and solving, as well as their communication.
Equation Solving
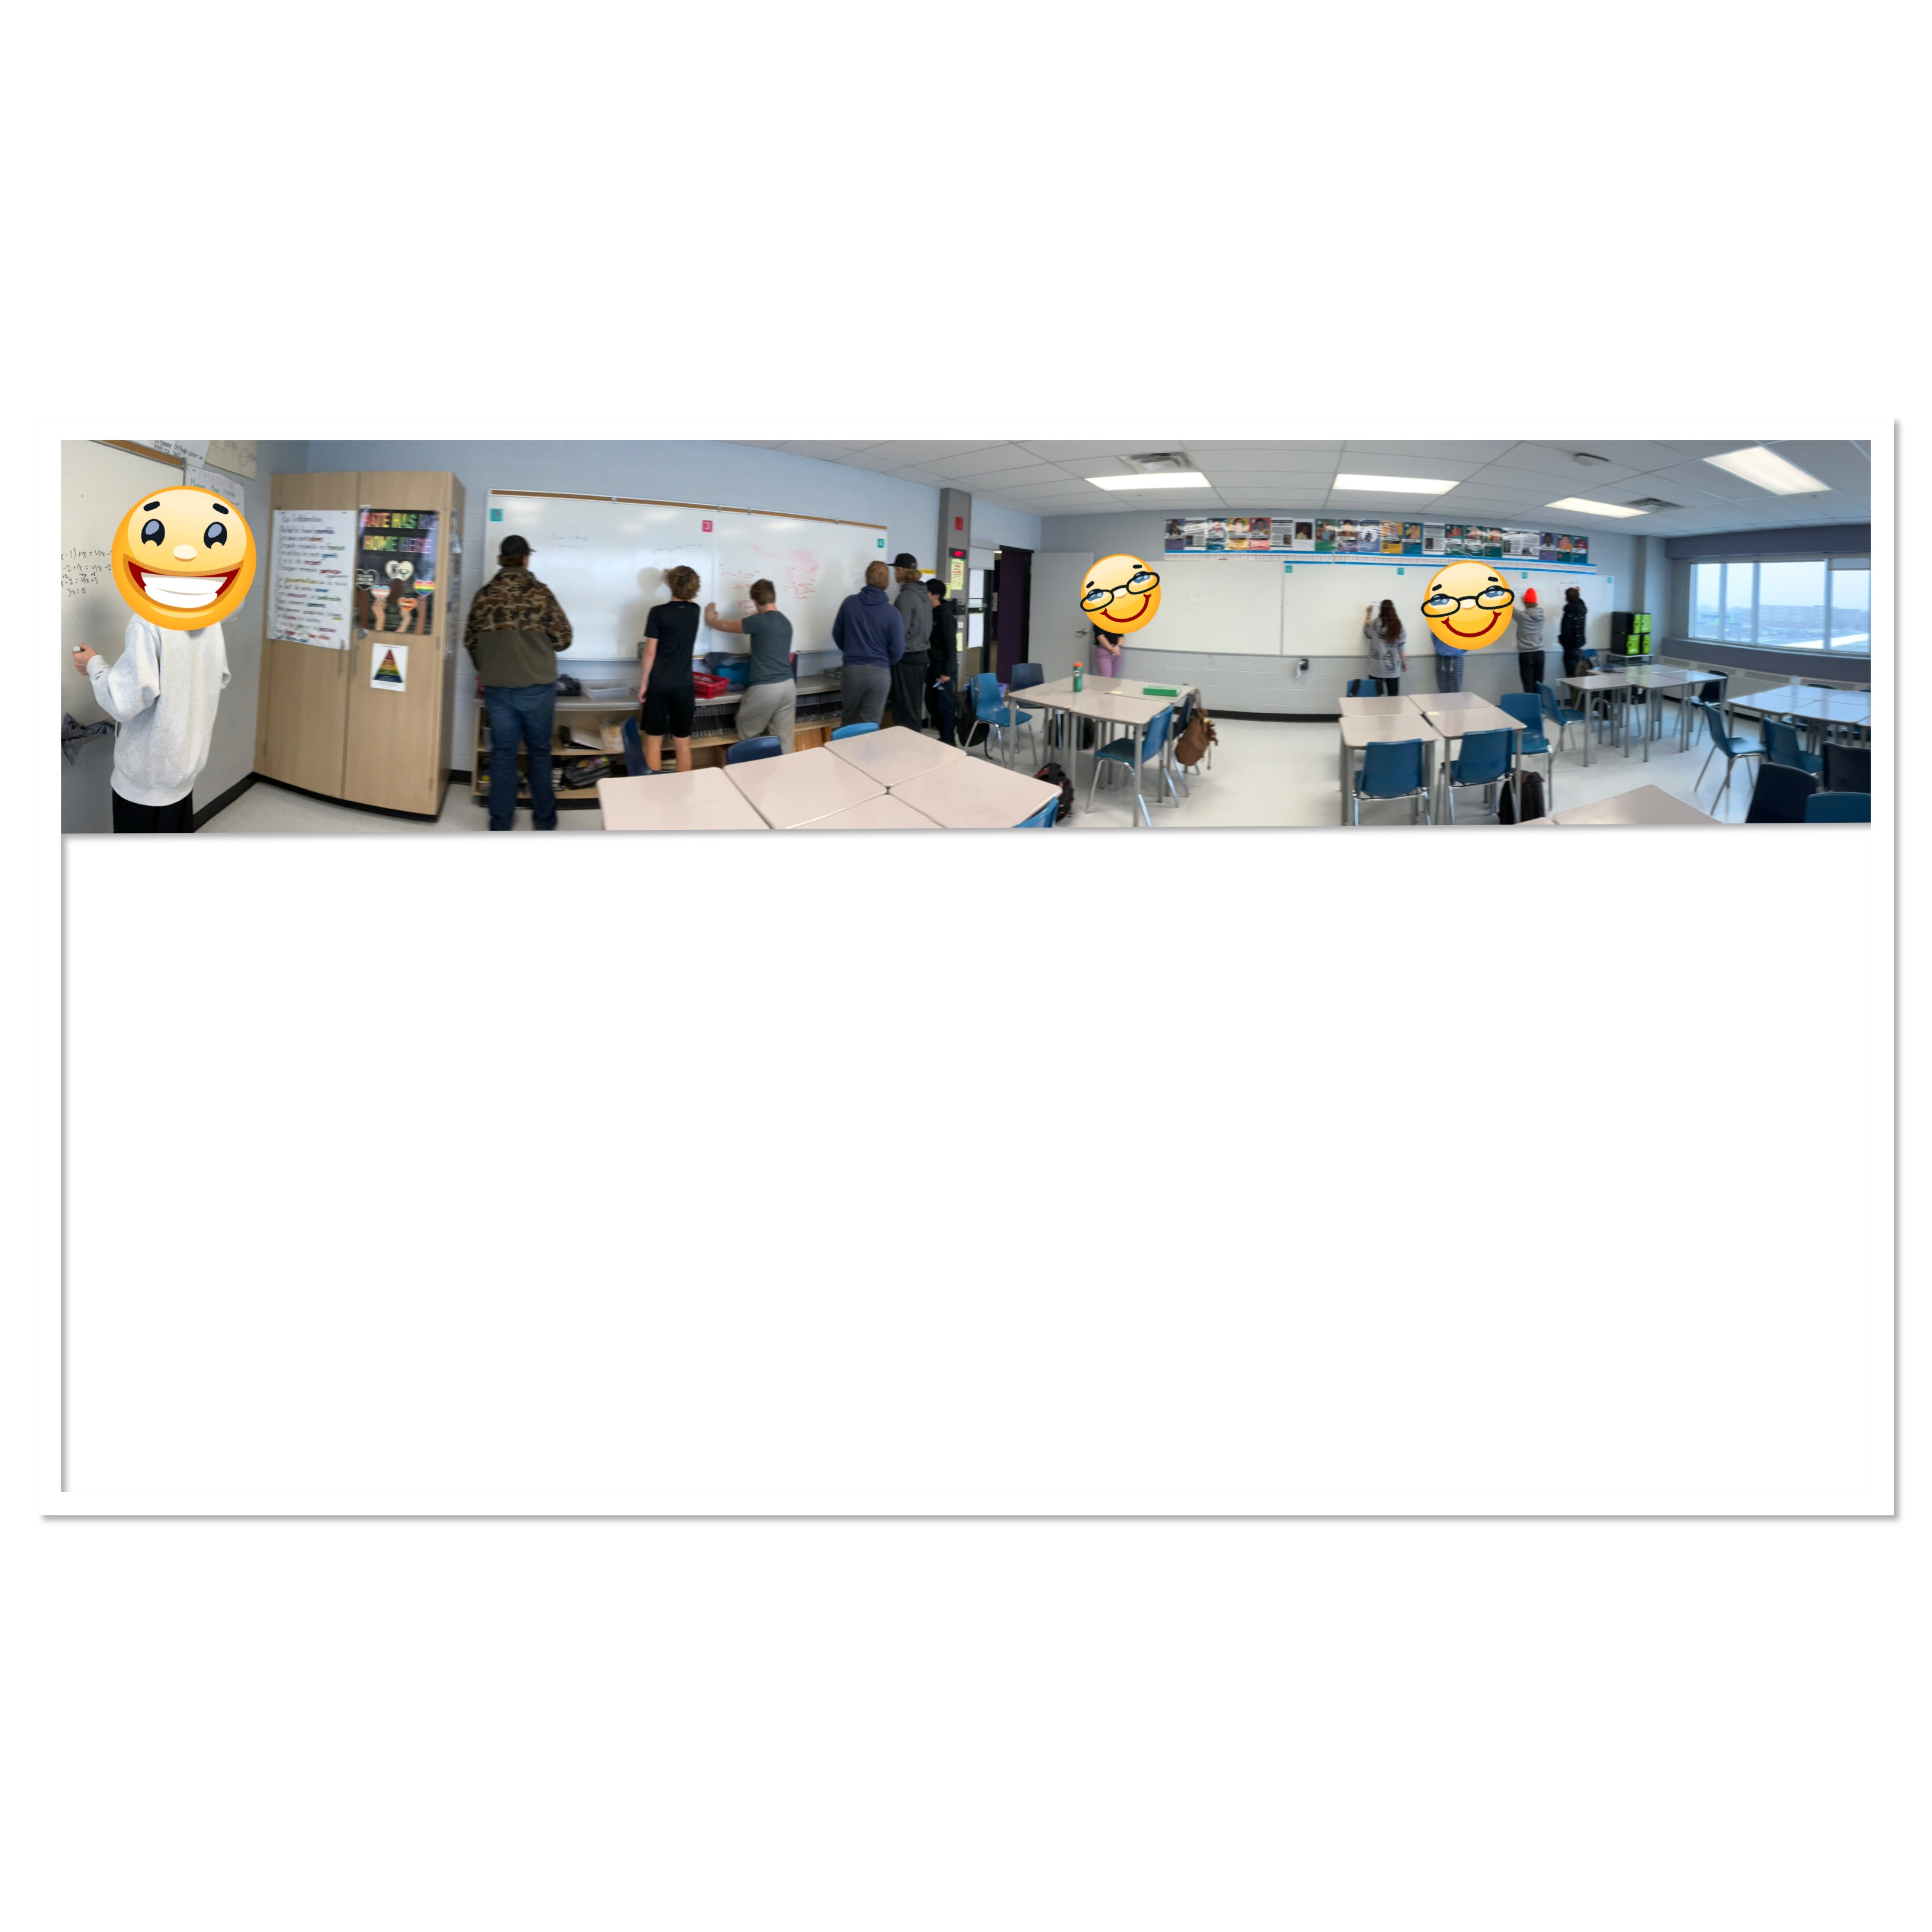
Today in grade 10 we started off by solving equations at the walls. We had enough space and markers for each student to write and practice solving. We solved equations with x on both sides, and worked our way up to solving equations with distributive property as well.
Our next challenge, since we were ready to try something new, was a word problem.

We noticed that there were 3 bananas in both situations. The change in price must be related to the change in number of apples. 2 apples is 1.50, so each apple is 0.75. We can use that information to calculate the price of a banana now.
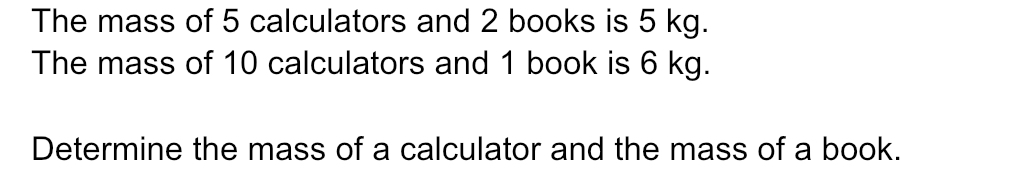
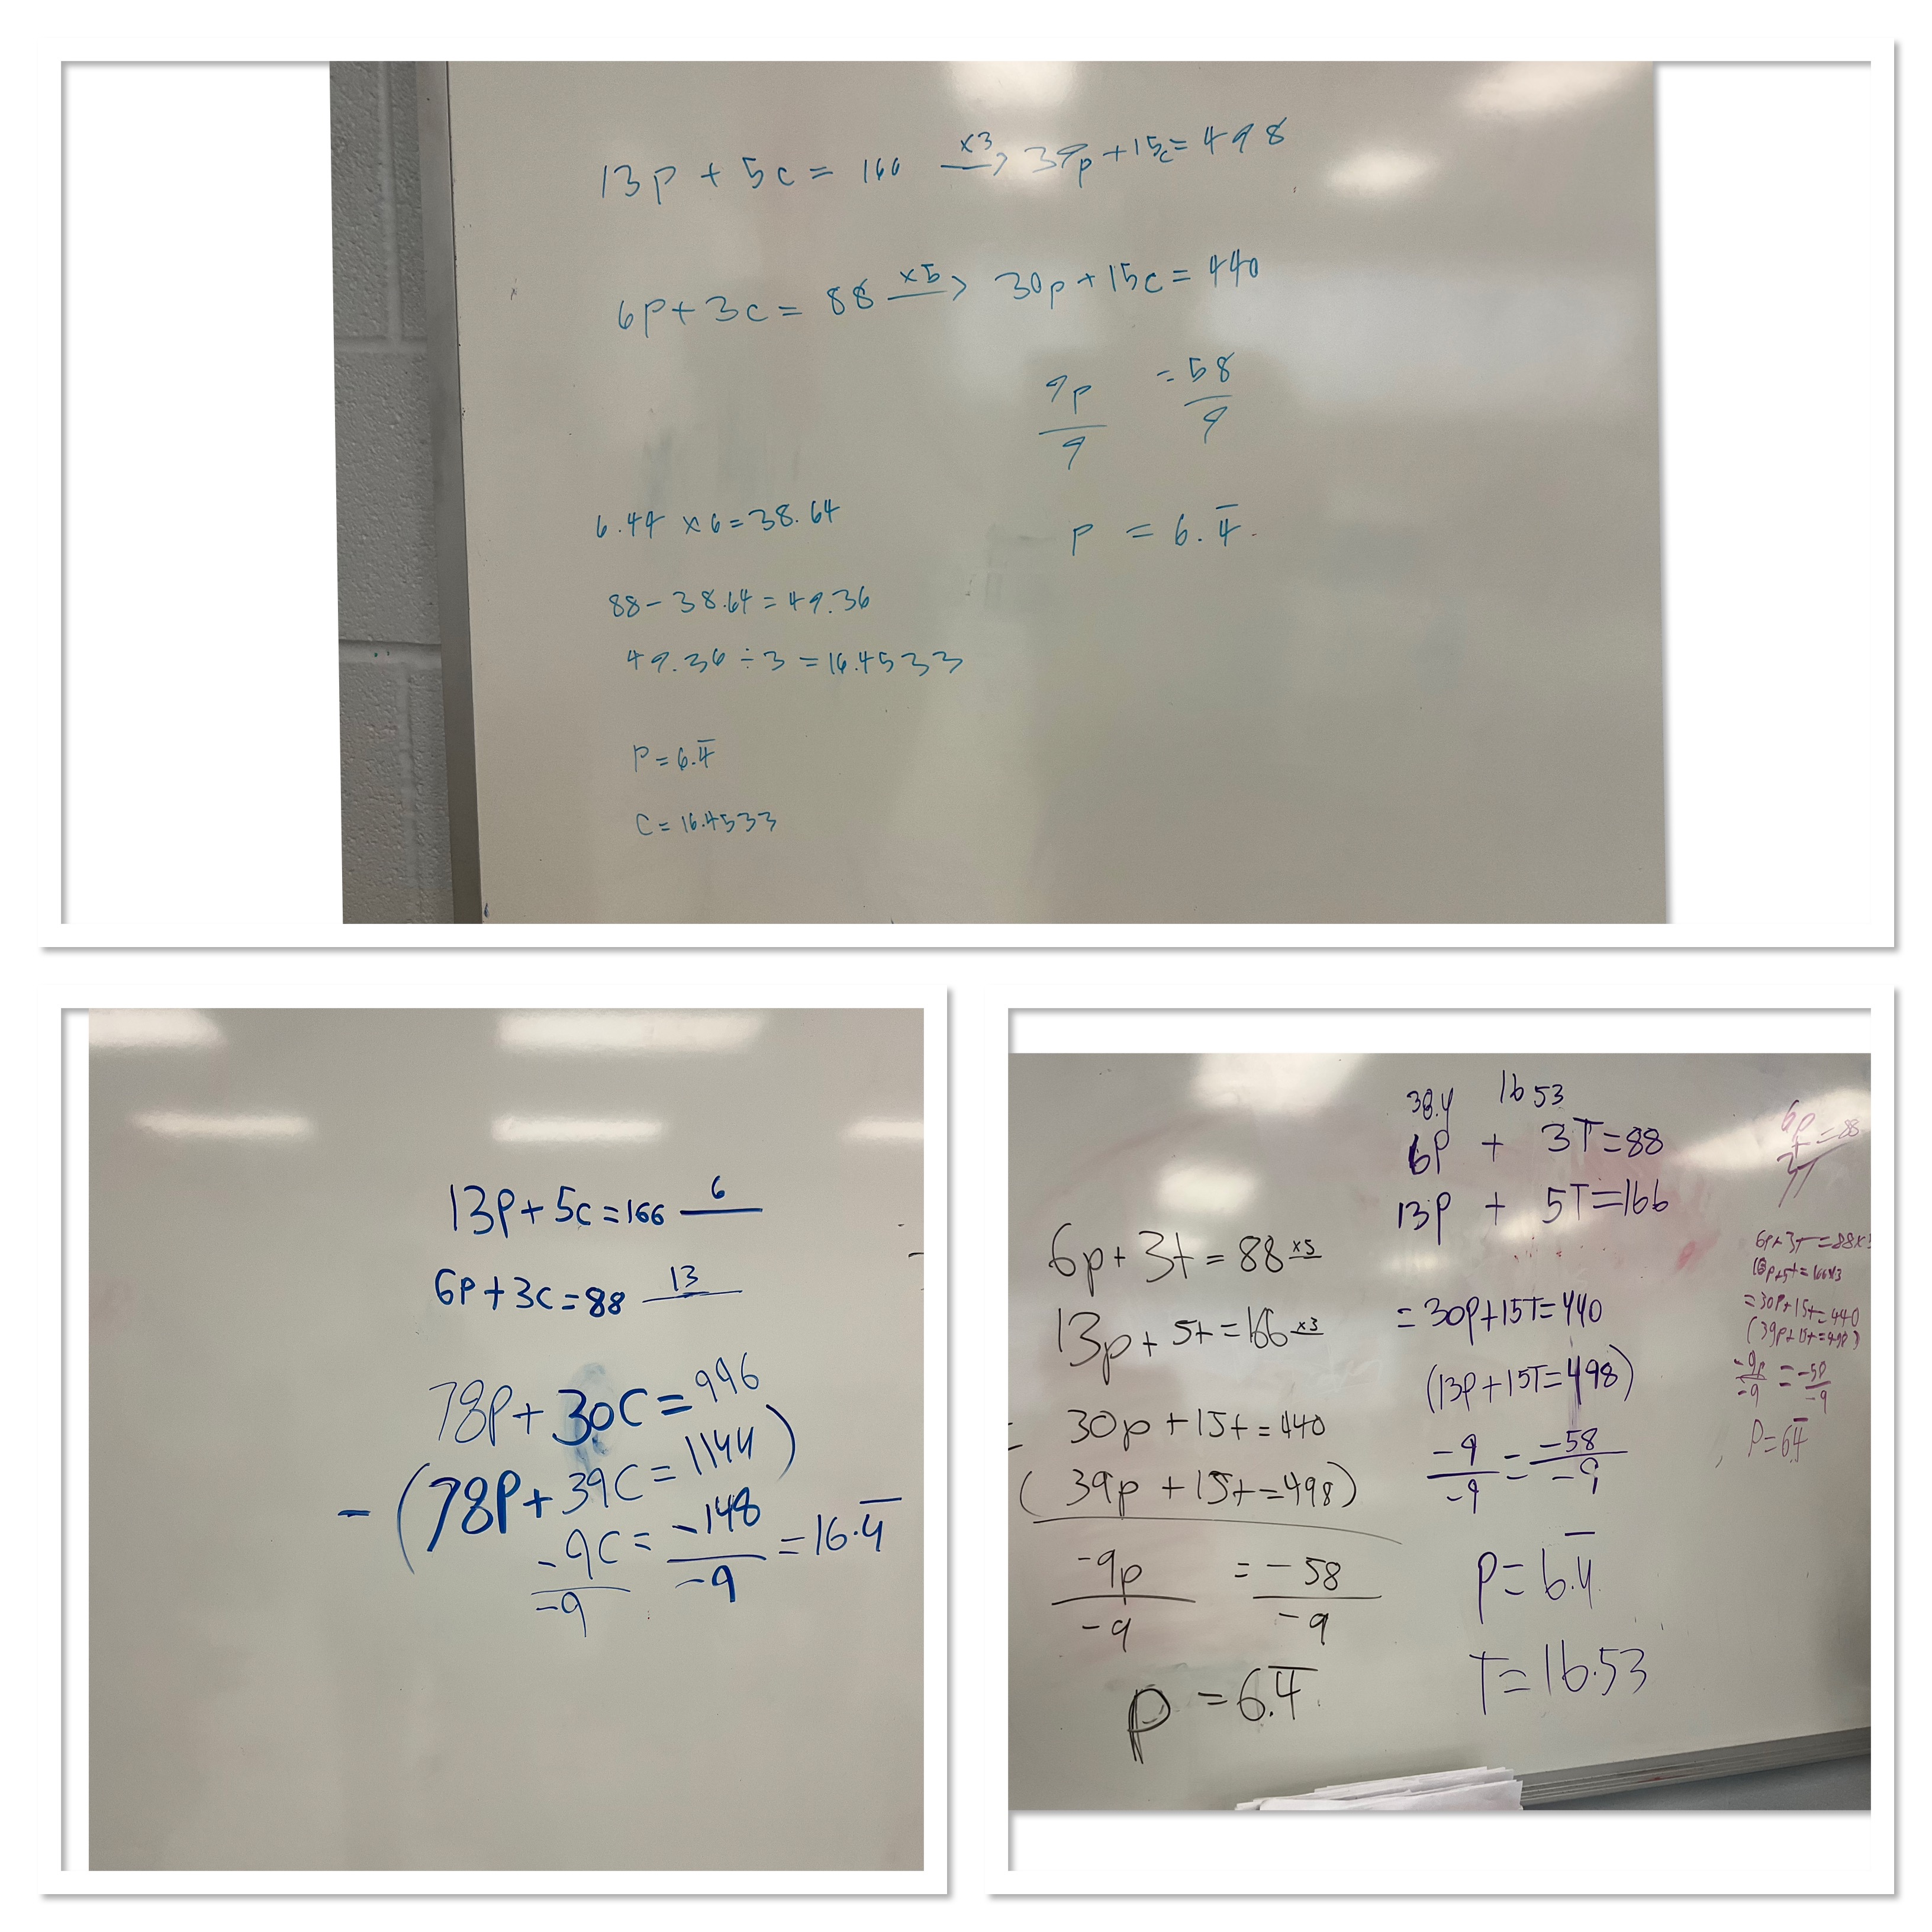
For this question we didn’t have the same number of calculators or books, but we notice that we could double one equation to make the number of books or calculators be the same. We solved this problem, then went on to solve this 3 act task
This required us to multiply BOTH equations to get a common coefficient, and then we could solve from there. Overall a very productive class, too bad only half of the students were present. We’ll do more of the same tomorrow to catch everyone back up.
The Great Cookie Stacking Competition
This activity is quickly becoming a favourite. It’s a nice way to revisit mean, median, mode and range, and also introduce the idea of quartiles and a box and whisker plot.
There are very strict rules for this challenge. People use one hand and stack one cookie at a time to build a freestanding cookie tower. I gave each group a box of cookies to use (I get the cheapest cookies I can find that are not sandwich cookies because they stack too well).
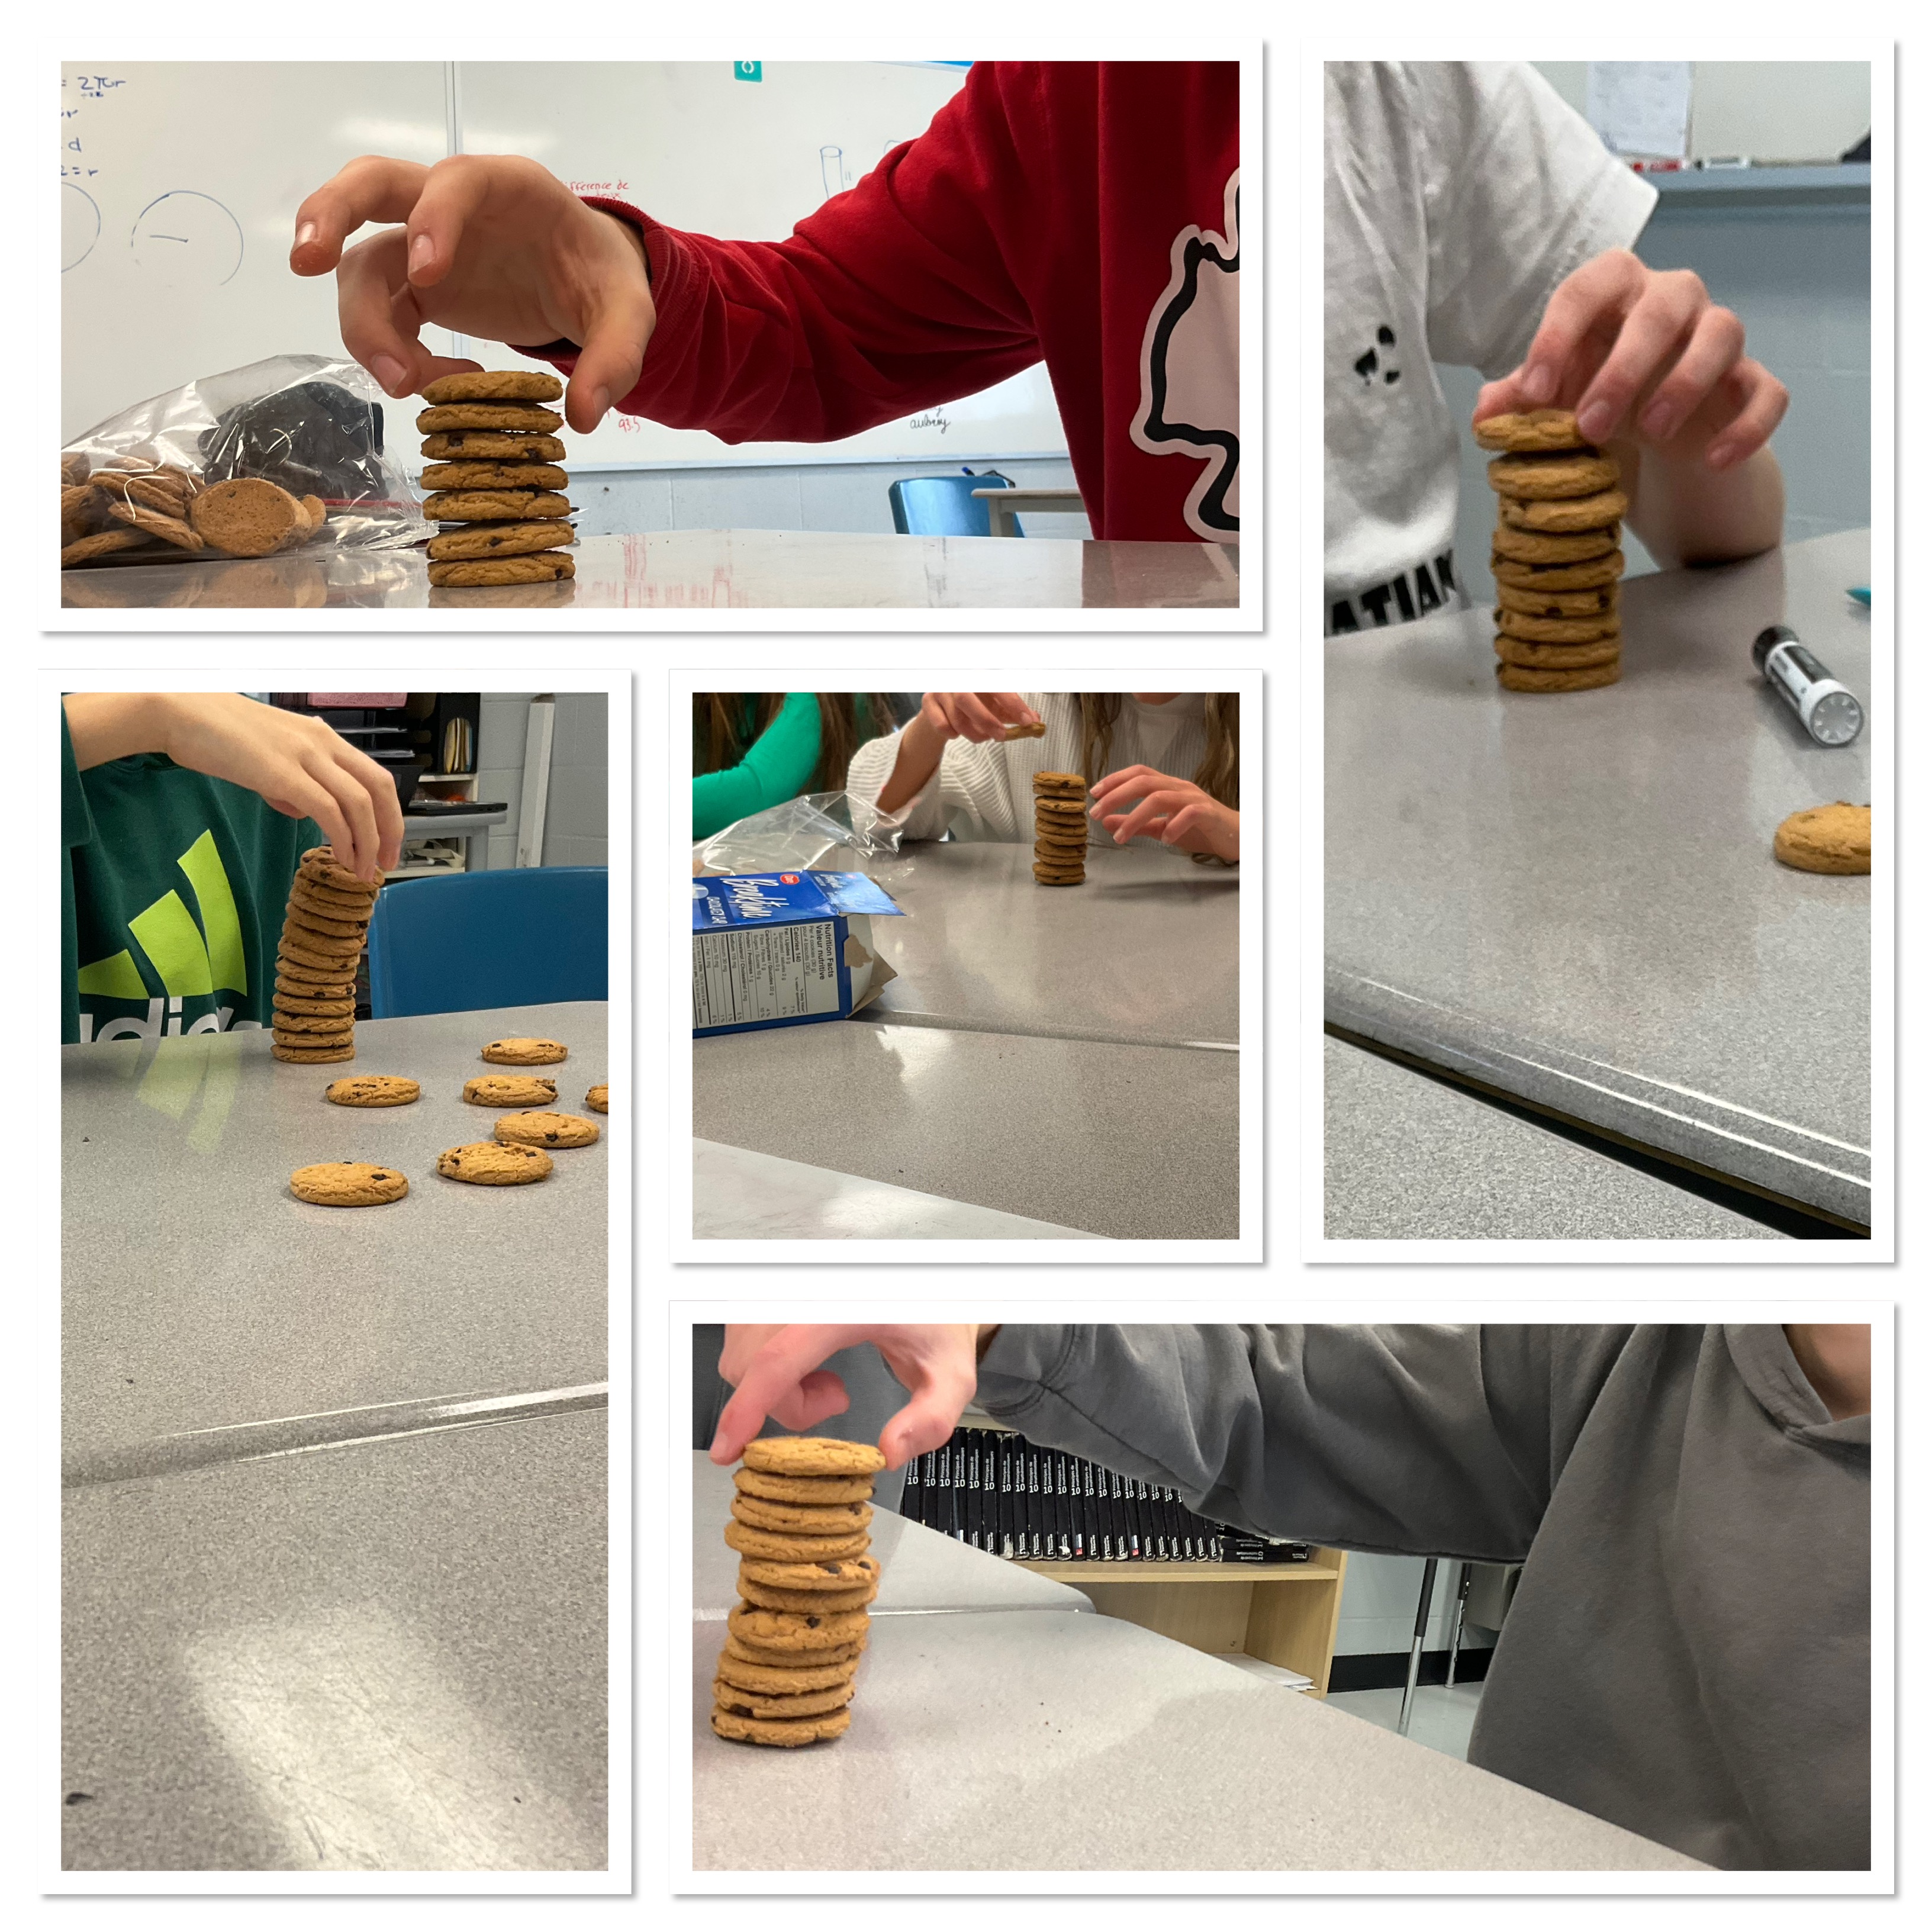
There’s high drama as everyone stacks towers. We keep going until each group has 12 data points. The best stack of the day was 19 cookies. I didn’t get a picture of that one, but here’s a pretty good one.

When we all have our data written down, the next step is to calculate the mean, median, mode and range.

and after that, we took a pause to explain what quartiles are (we cut the halves in half), and then we made box and whisker plots of our cookie tower data.

It’s nice for the class to see that data in a table has all the information, but it’s harder to compare the data between groups by looking at the table. We can make comparisons easier by looking at the box and whisker plots. We’ll come back to this again tomorrow with some practice.
Popcorn Picker
I was invited to run a 3 act task with a colleague’s class this morning. We did popcorn picker. Here’s act 1
Each page was 8.5×11 inches. One was made into a tube by joining the short sides. The other was made into a tube by joining the long sides. The question is: which one holds more popcorn, or are they the same?
Students worked at the boards in random groups of 3. Some struggled to engage in the task at first, but others gave it a solid effort right from the start.

The task involves calculating volume of a cylinder, but before that happens there’s some calculations needed to get the radius of each cylinder. A major misconception that I noticed today was that students thought that the radius was half of the circumference. When I brought over a paper and made a tube and gave a ruler to check, it was easy to see that we needed a different approach. Some made a breakthrough when we got the equation for circumference. Others needed a bit of prompting, but we got there eventually with most groups.
We had a good chat at the end, looking around the room, we saw where we could add some clarification to the work (some needed some arrows and a starting point indicator, some needed equations written, or titles and sub headings).
In the end, we know that if two cylinders have the same lateral surface it does not mean that the volume is the same.
Scientific Notation
Today we had a fun time exploring the universe of really small things, and really big things.
We used this website
we noticed the difference in units, and that when quantities get to be very big or very small that there are a lot of zeros, so as a shortcut we use scientific notation.
we made good connections to our exponent law practice yesterday where we explored what negative exponents mean.
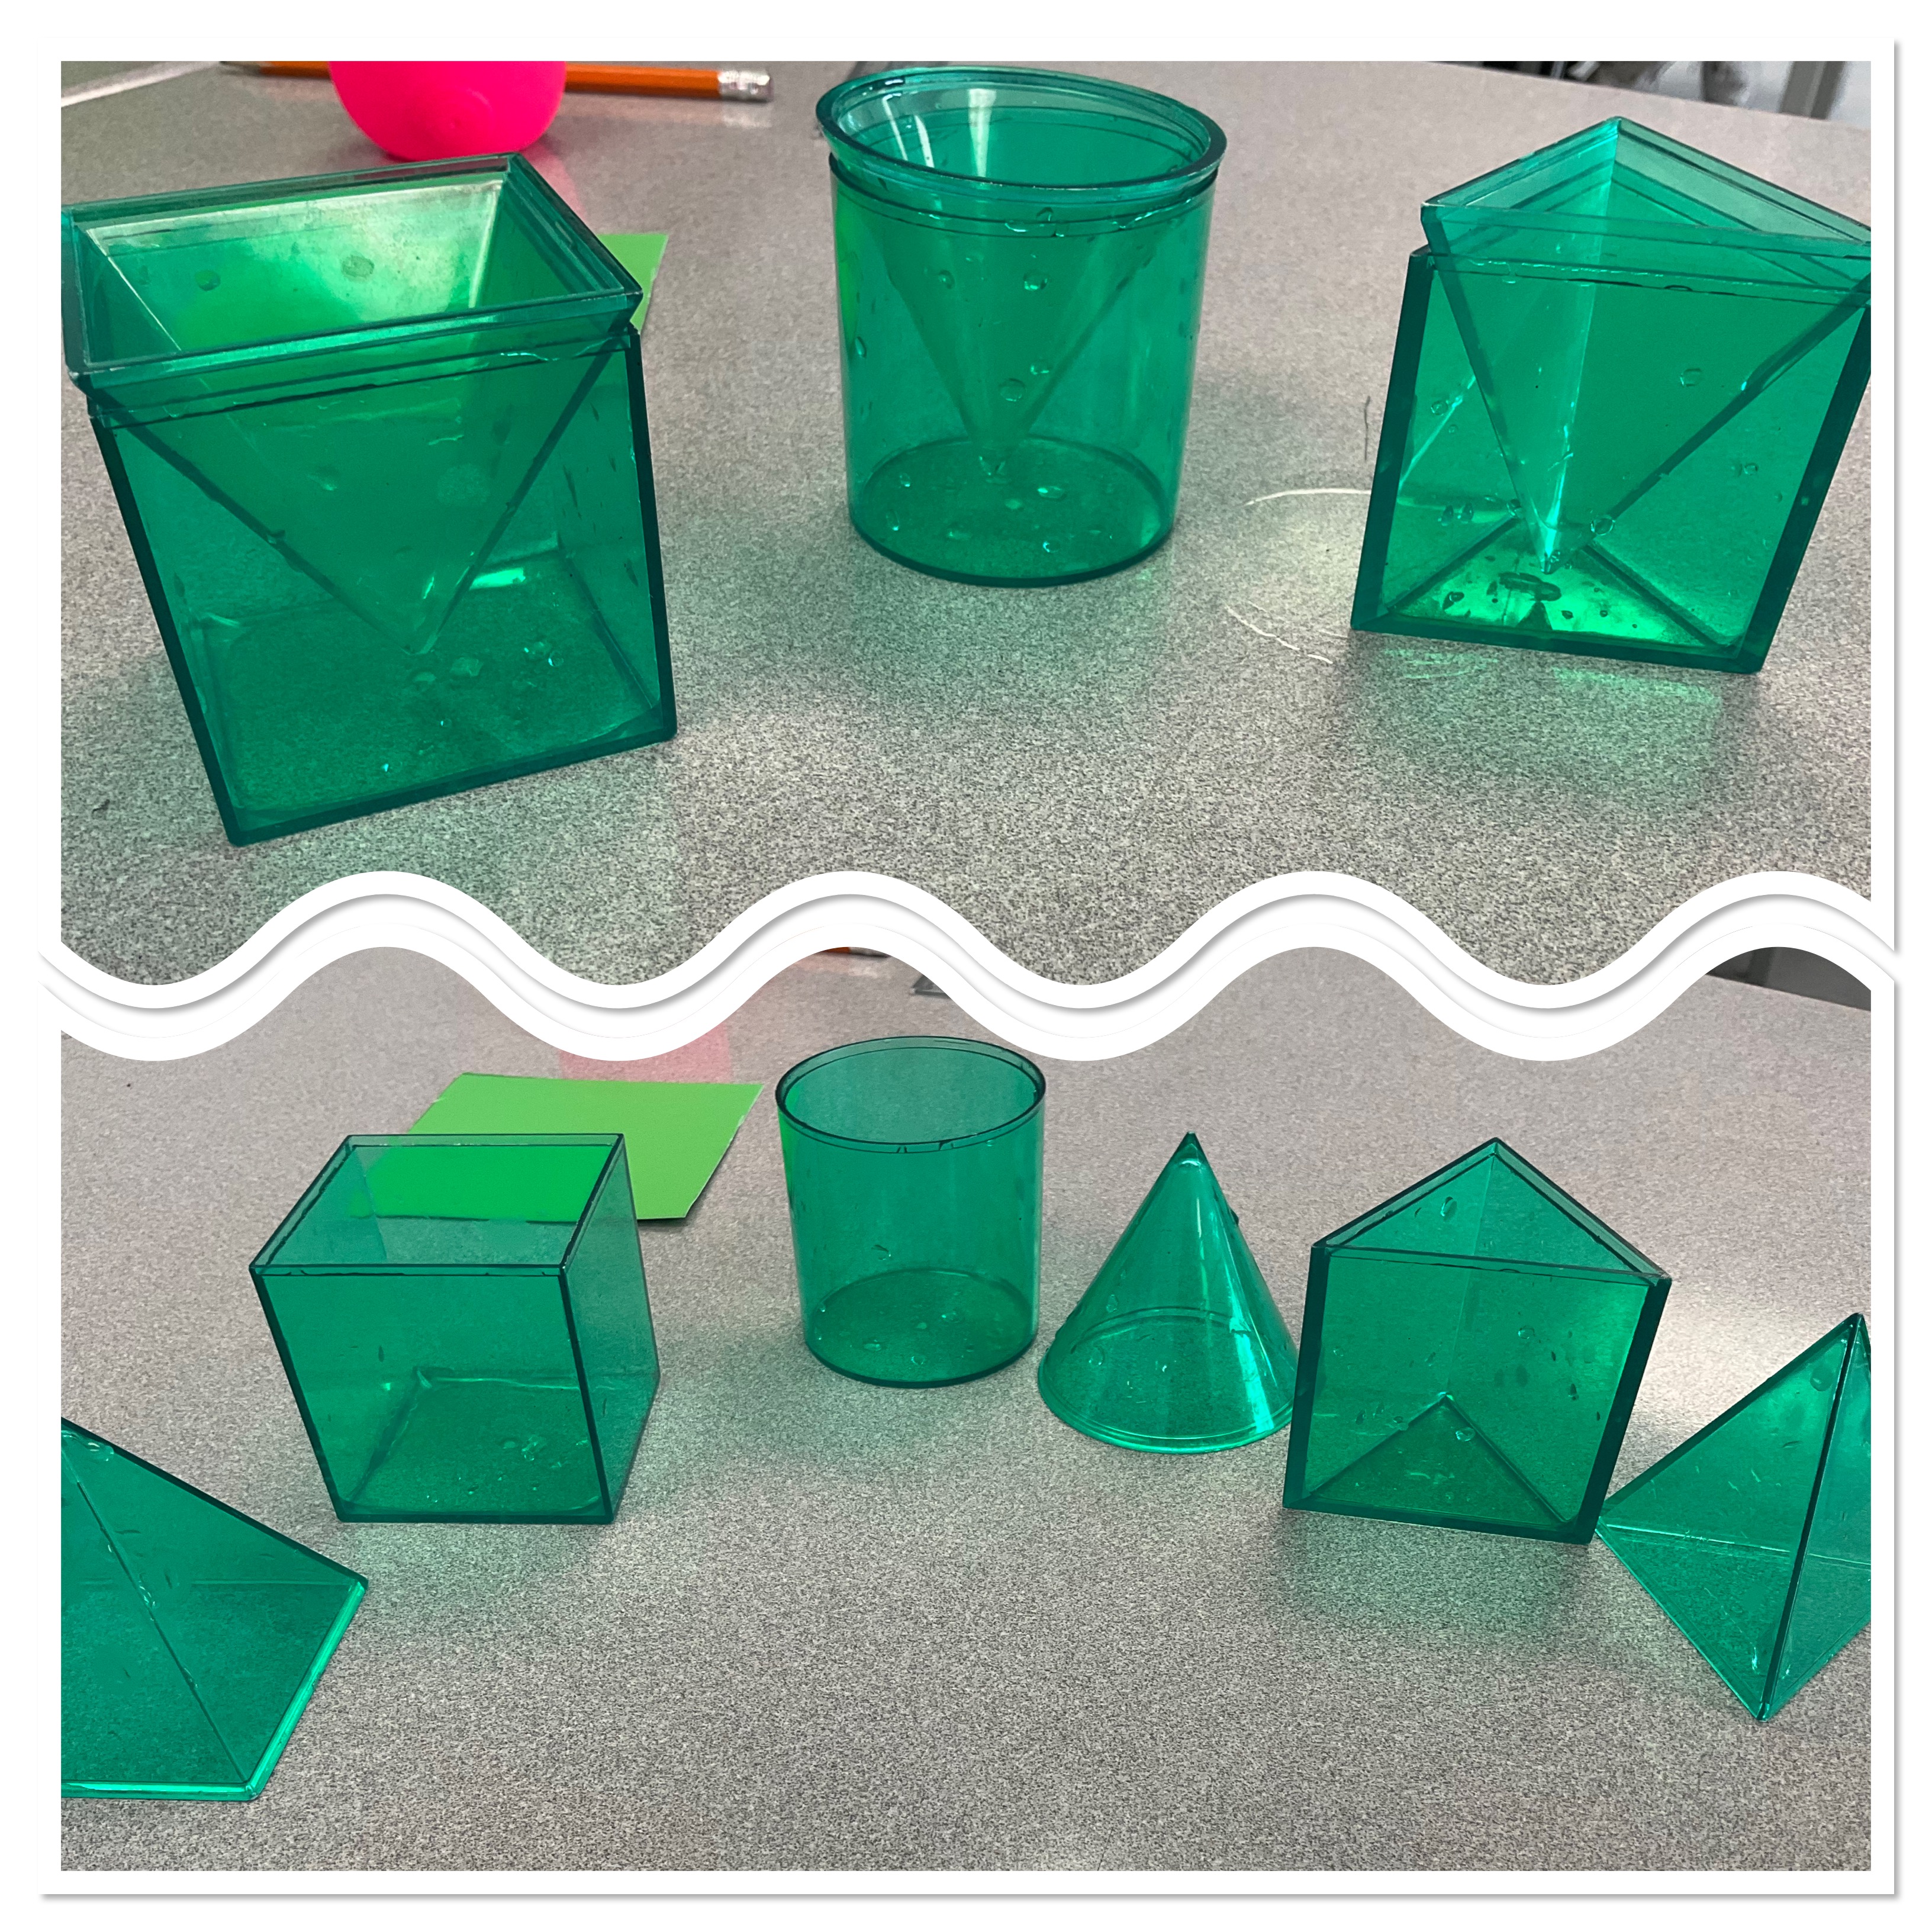
Building Pyramids
Grade 9s today learned about the volume ratio of pyramids and prisms with the same base and height. We used the 3D solids and poured pyramids full of water one at a time until we filled the prism. Many guessed that the prism is half the volume of the pyramid at first, but after seeing it 3 times realized that the pyramids are always 1/3 the volume of the prism.
Next we had a design challenge. Students were asked to build square bases pyramids with a volume of 300 cubic centimetres.

Groups had file folders, scissors, rulers and tape, and they were able to make some design choices about their dimensions, but in the end the pyramid needed the correct volume.
I did this task not that long ago with my grade 10 applied class, and noticed that my grade 9s were much more confident with starting the task. They drew a plan, and divided the task up, and worked together to build.
When faced with the fact that many were not tall enough (because usually students do not realize that the slant height and pyramid height are not the same), this class was very resilient and regrouped and made a new plan.

When some group members were frustrated, others encouraged them to keep going. Other groups knew thar I was trying to shake their confidence (because I’ve told them that sometimes teachers inject some doubt into situations to check to see how certain students are with their answers.) so they didn’t want me to shake their confidence and kept spirits high throughout the process.
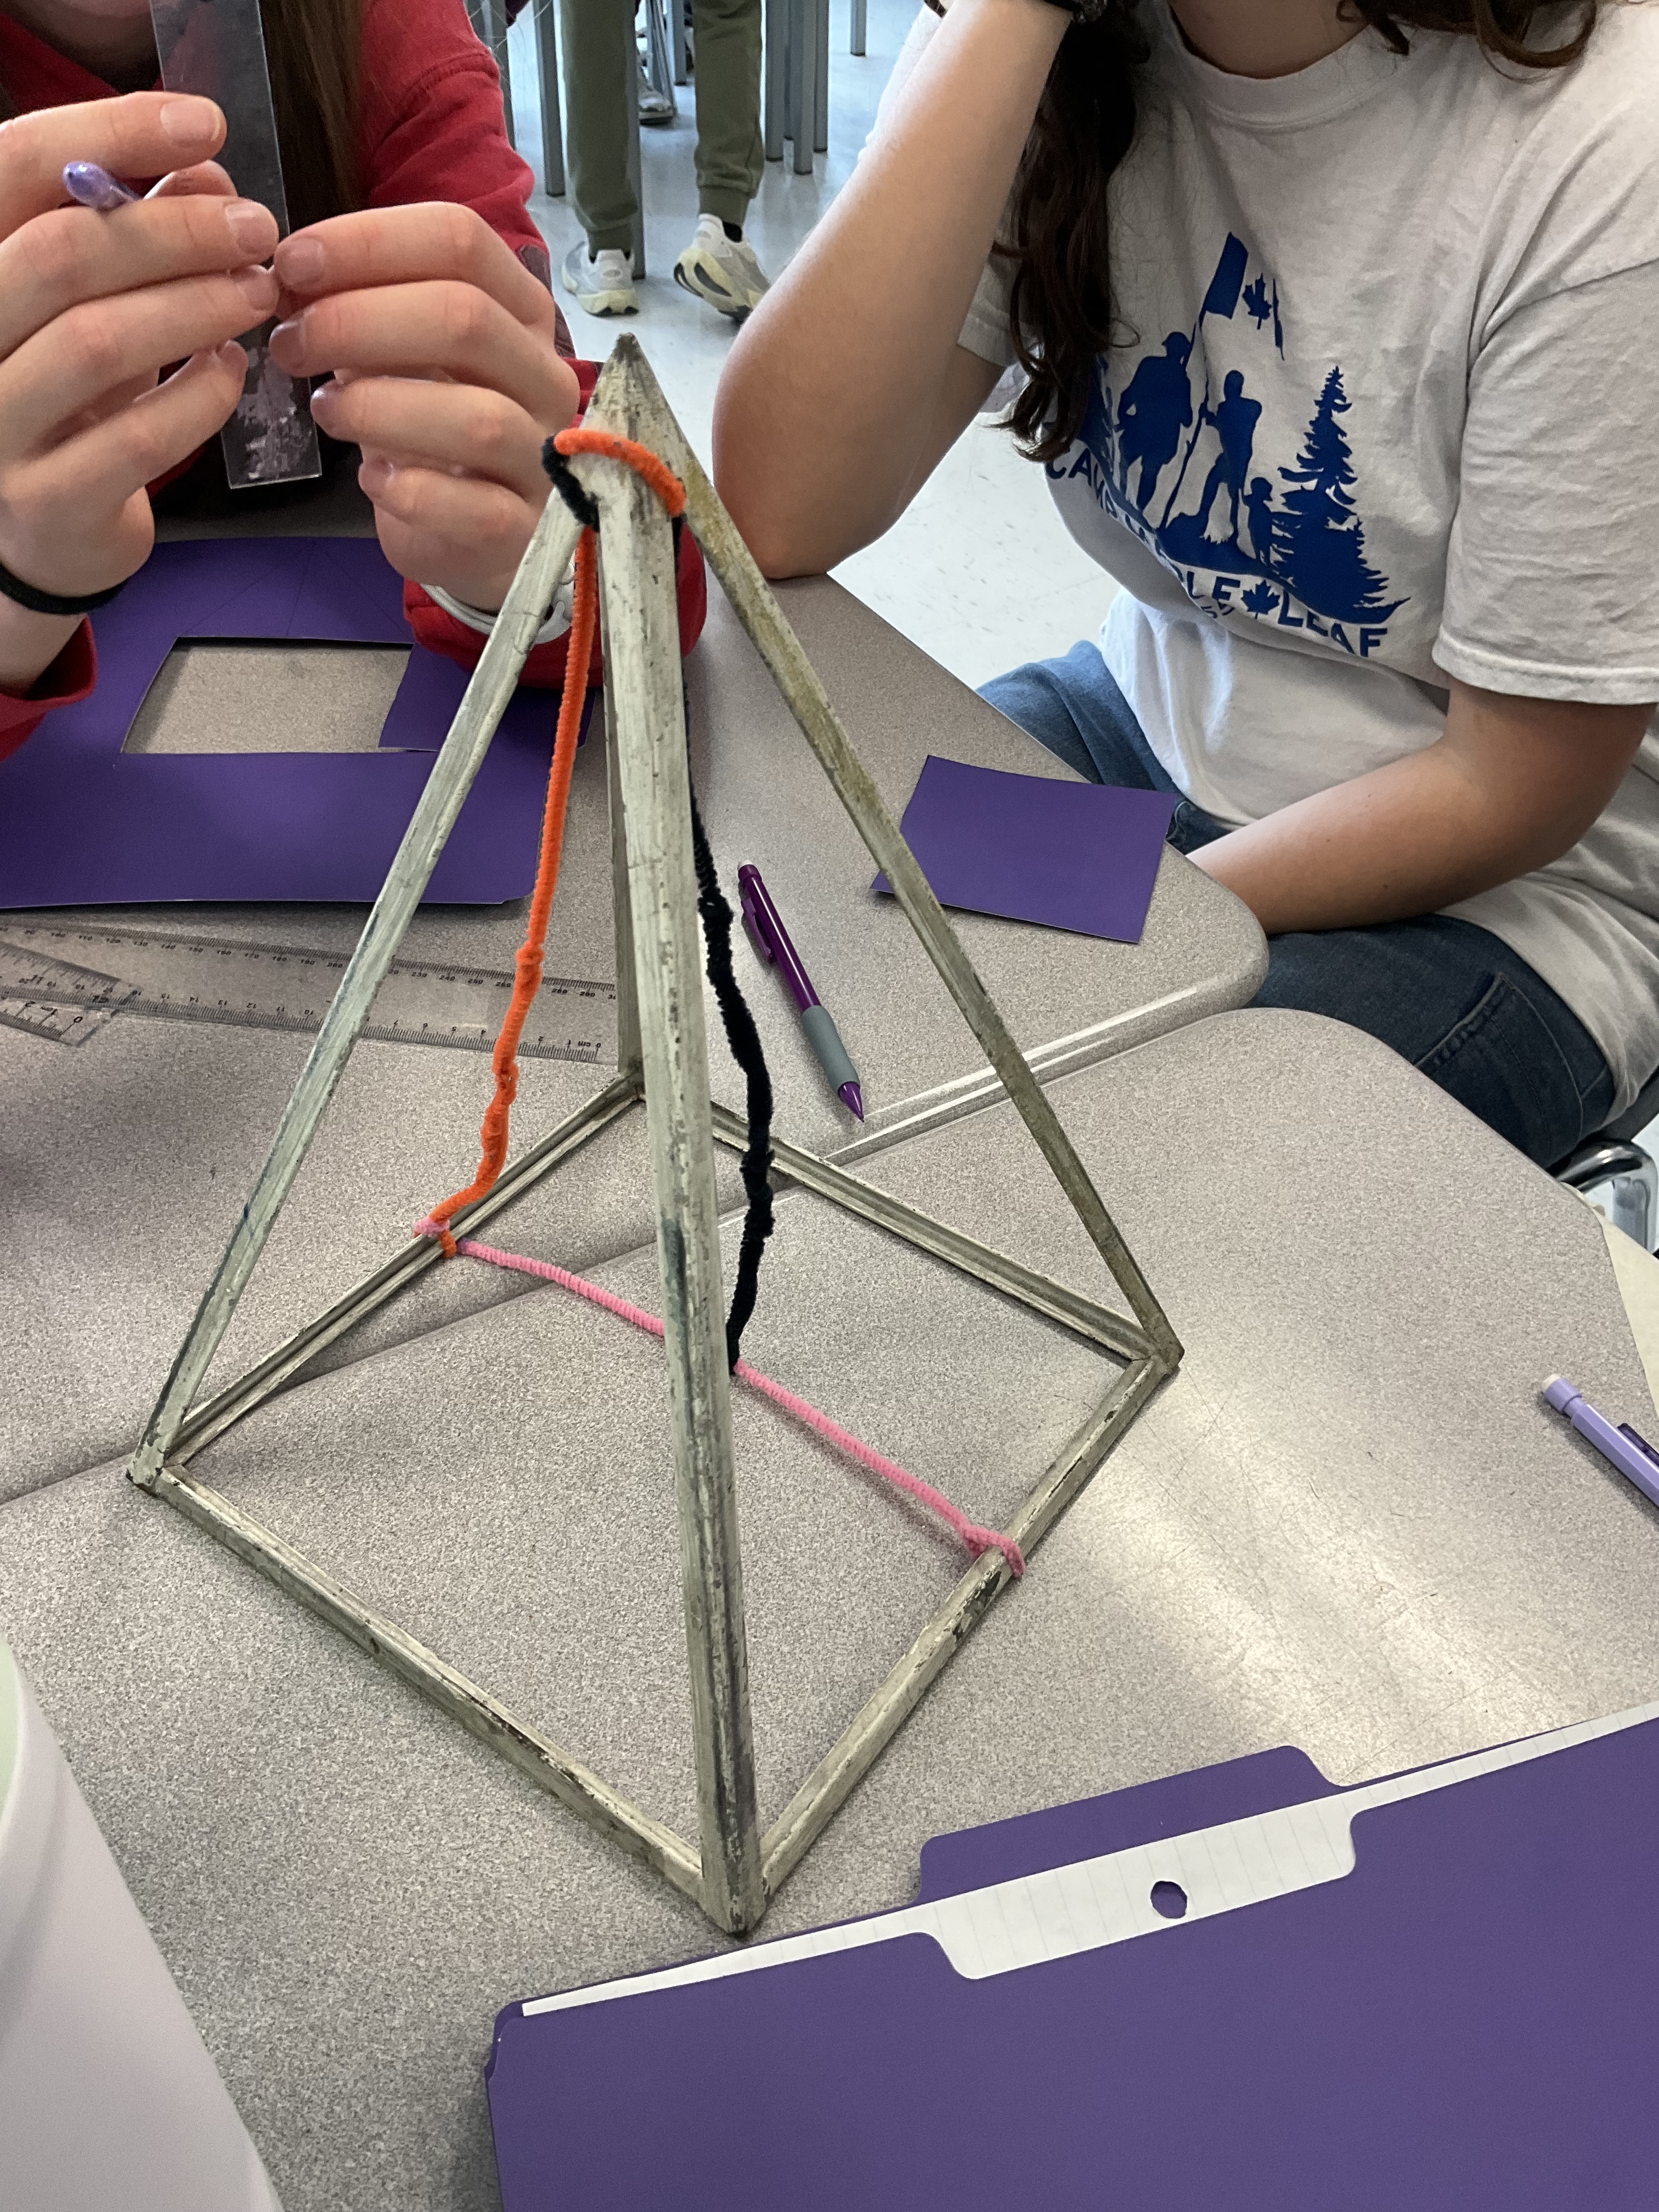
My model helped to illustrate how the slant height (orange pipe cleaner) and the pyramid height (black pipe cleaner) are not the same, but are related though the pythagorean theorem.
One group had such a novel approach to solve the problem that avoided using the pythagorean theorem altogether. They created a skeleton for their pyramid. They knew the height needed to be 9 and their base was 10, so they made 2 triangles like that, and slit one from top to middle, and one from bottom to middle along the vertical axis, and slid them together.

They then measured the slant height that they needed, and built triangles to cover the pyramid. It was the first time I’d seen that approach, and it worked really well.
We debriefed at the end of class about how to calculate the height or the slant height using the pythagorean theorem, and hopefully we’ll remember over the weekend. I enjoy creating memorable moment through activities like this that help students connect to the math in a (hopefully) meaningful way.
How Tall is the Atrium?
Welcome to our atrium.
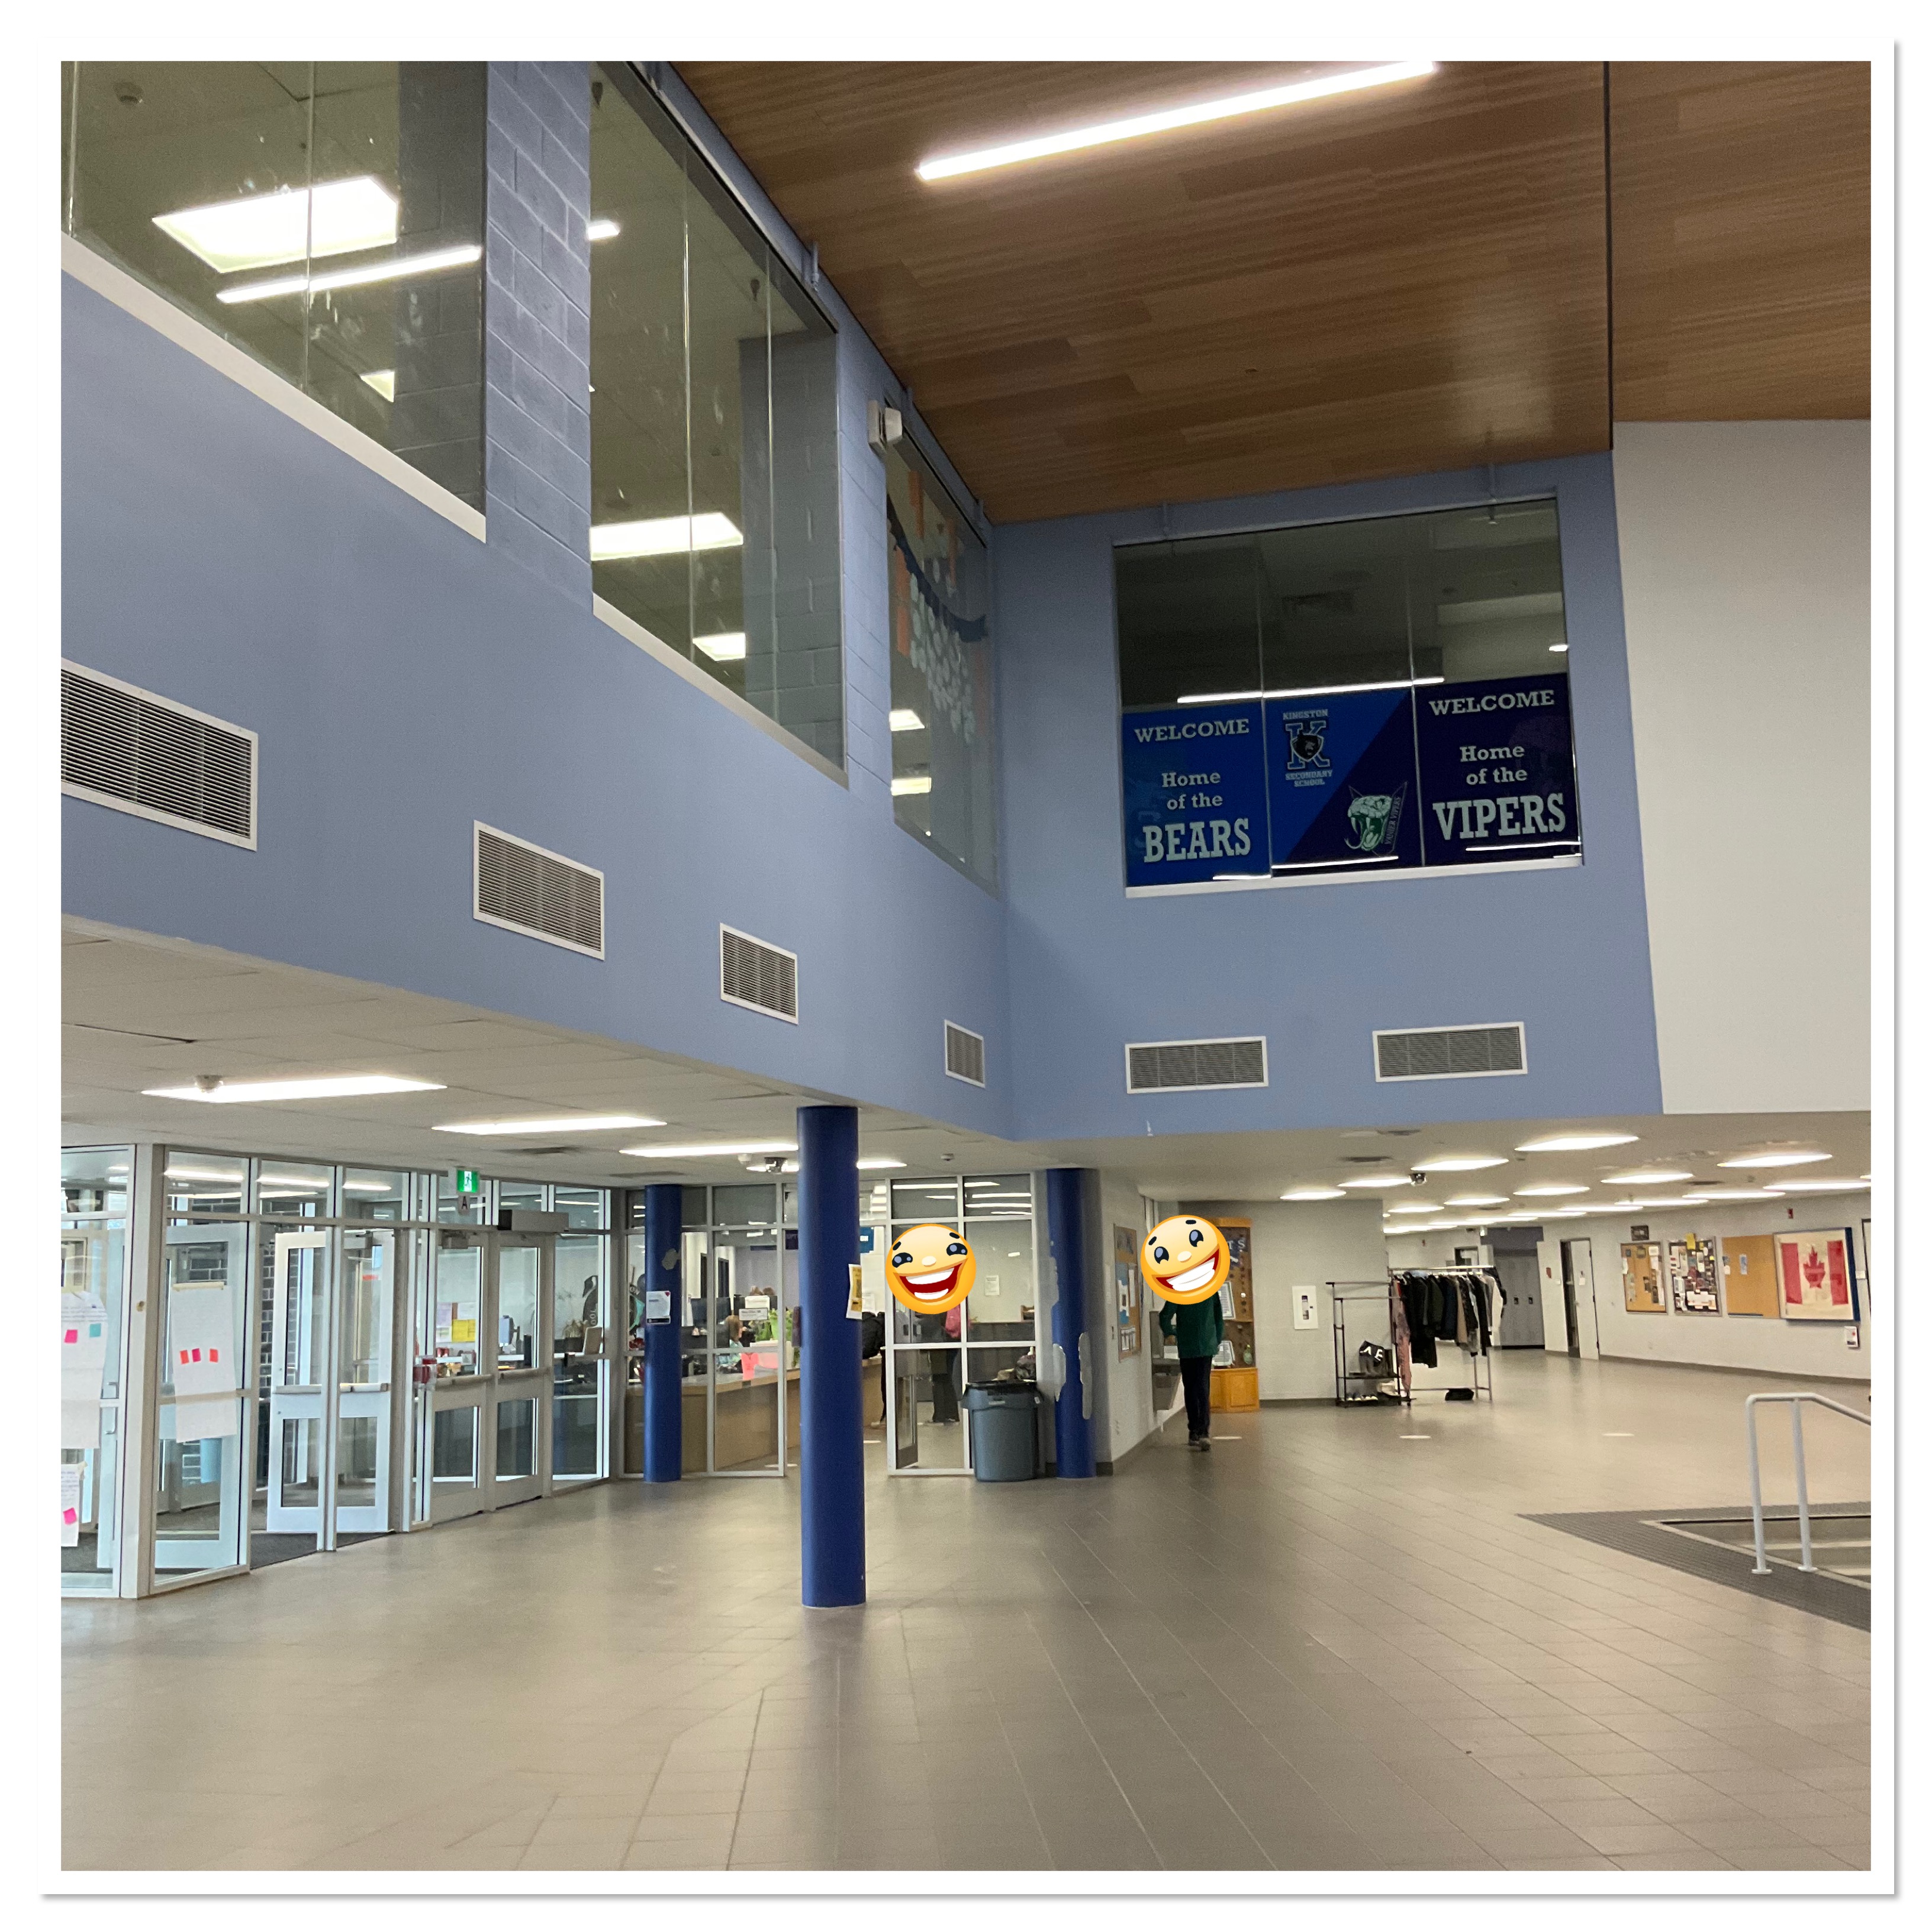
Today the challenge for my colleague’s grade 12 college math class is to determine how tall the ceiling is in the blue section of the atrium.
We started off estimating and justifying our estimates. Guesses ranged from 20-50 feet. Ideas were justified by imagining a 7 foot basement stacked up on itself, or by estimating the height of the classroom using the door frame height or a person’s height, then doubling it since the atrium covers 2 storeys of the school. Interestingly enough the students preferred to estimate in feet, but defaulted to measuring in metric to do our data collection.
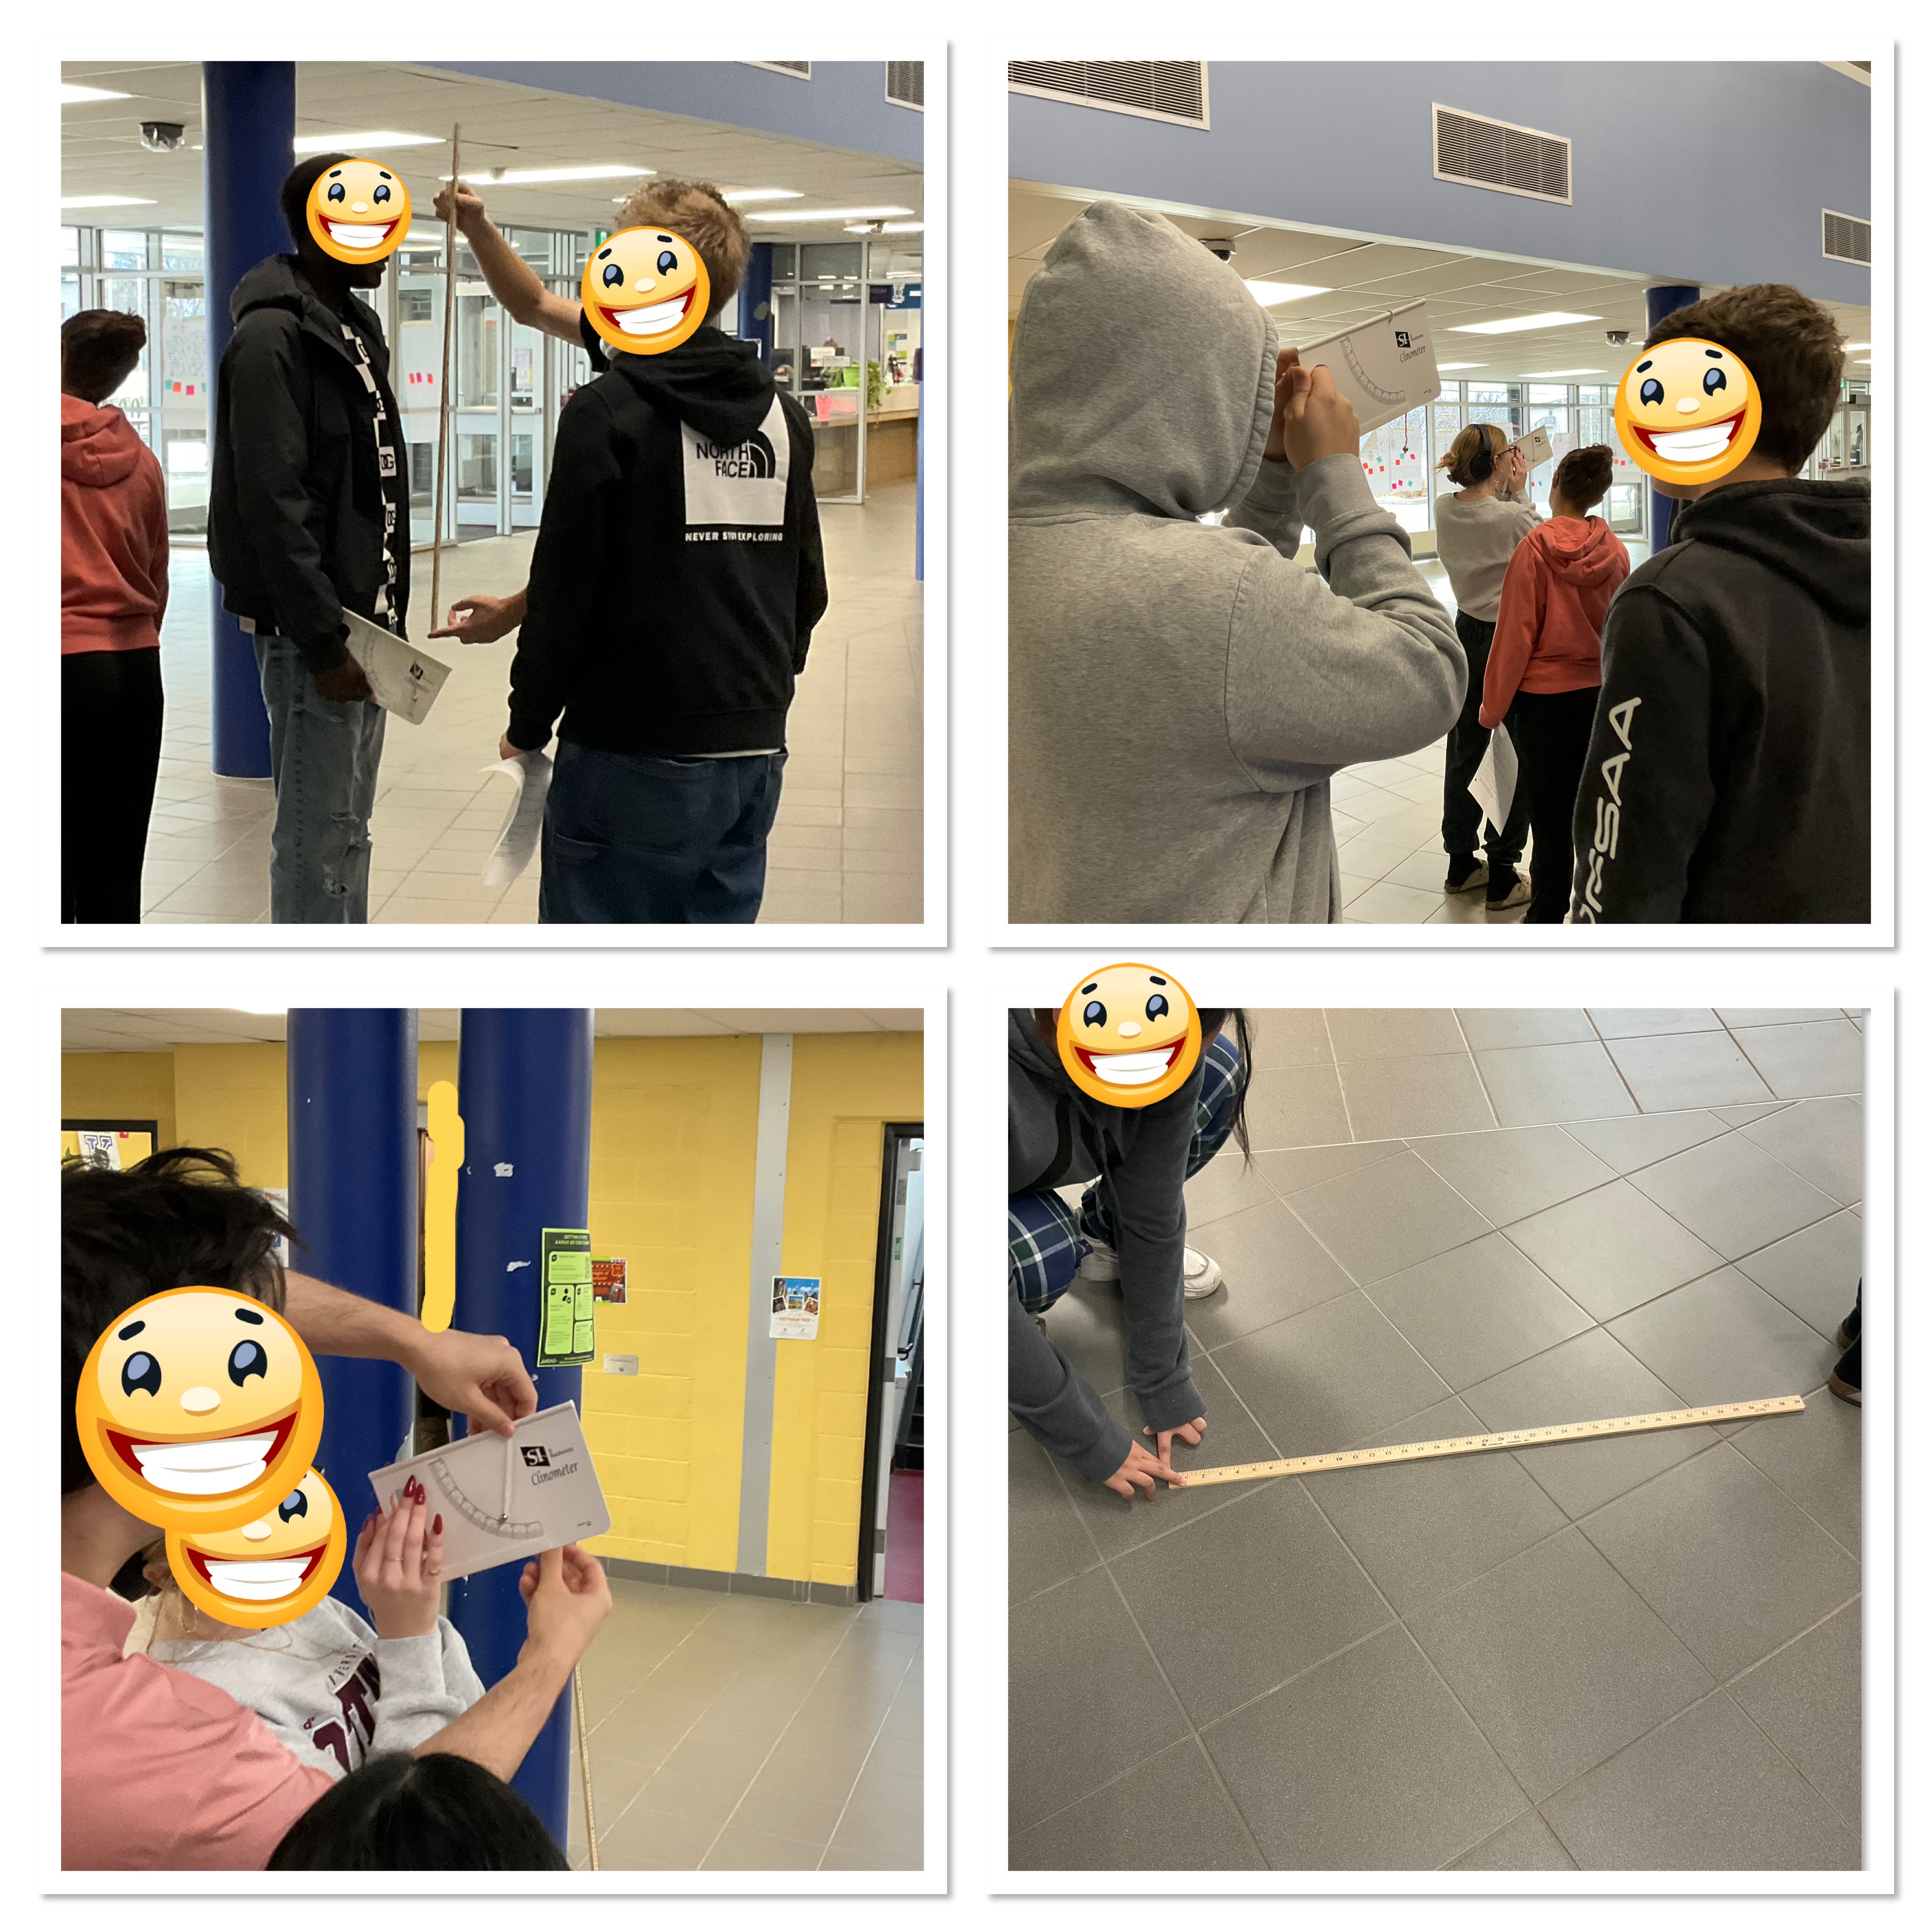
To collect data we stood at the back of the atrium, just at where the overhang ended. We marked our position, then measured with the clinometer. We walked forward by a measured distance, then repeated the process. These 3 measurements, along with the height of the clinometer operator’s eyes were enough to allow the calculation of the atrium height.
The calculations include some supplementary angle calculations, and sine law and sine. We got part way through the calculations and there are some pinky swears given that the calculations will be finished for tomorrow. We’ll see. I’m quite curious to see what the height is, and how that compares to the school height that my grade 10s calculated.

