Visual Patterns
We started a new semester today, and we hit the ground running in grade 10.
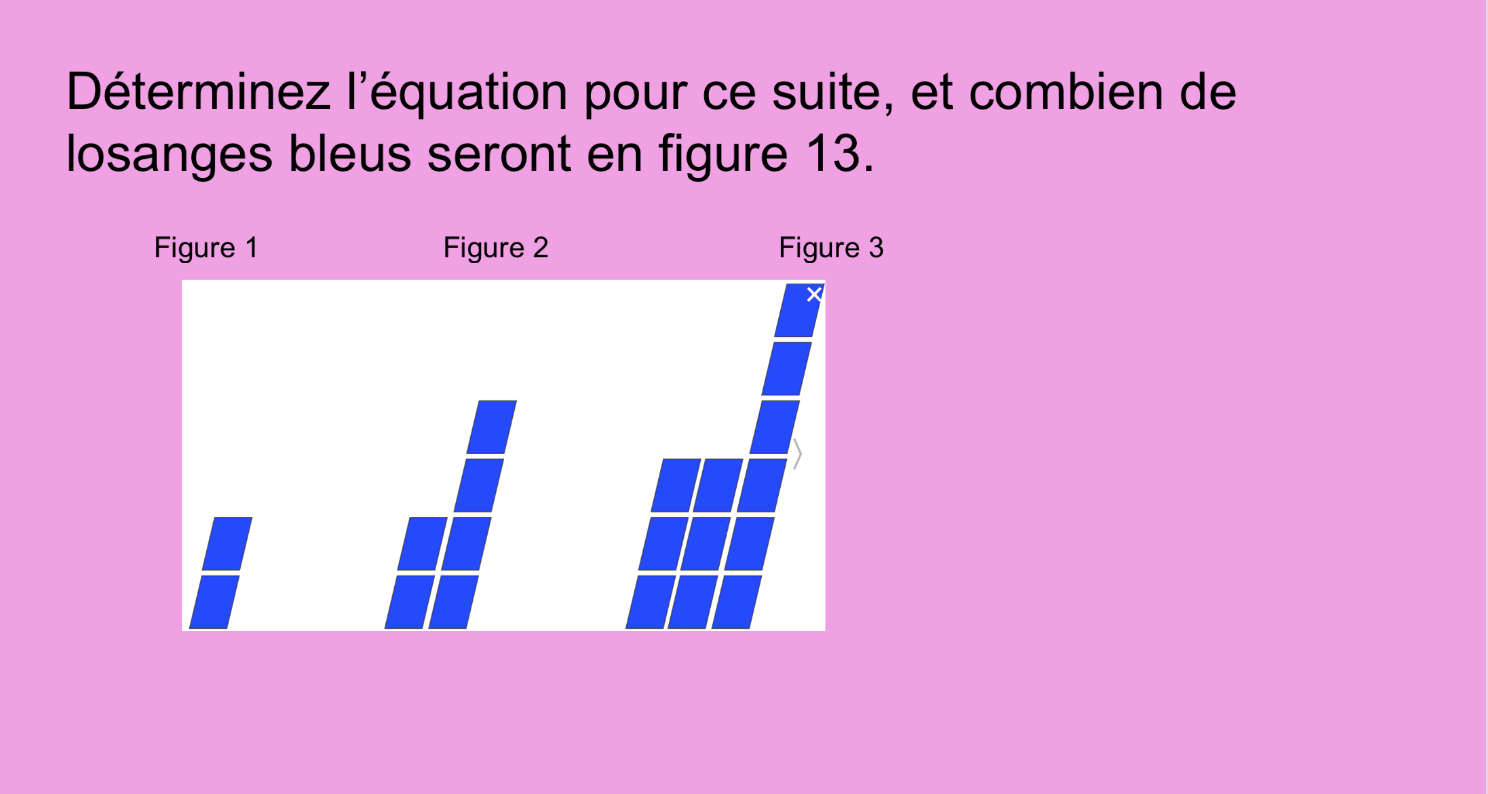
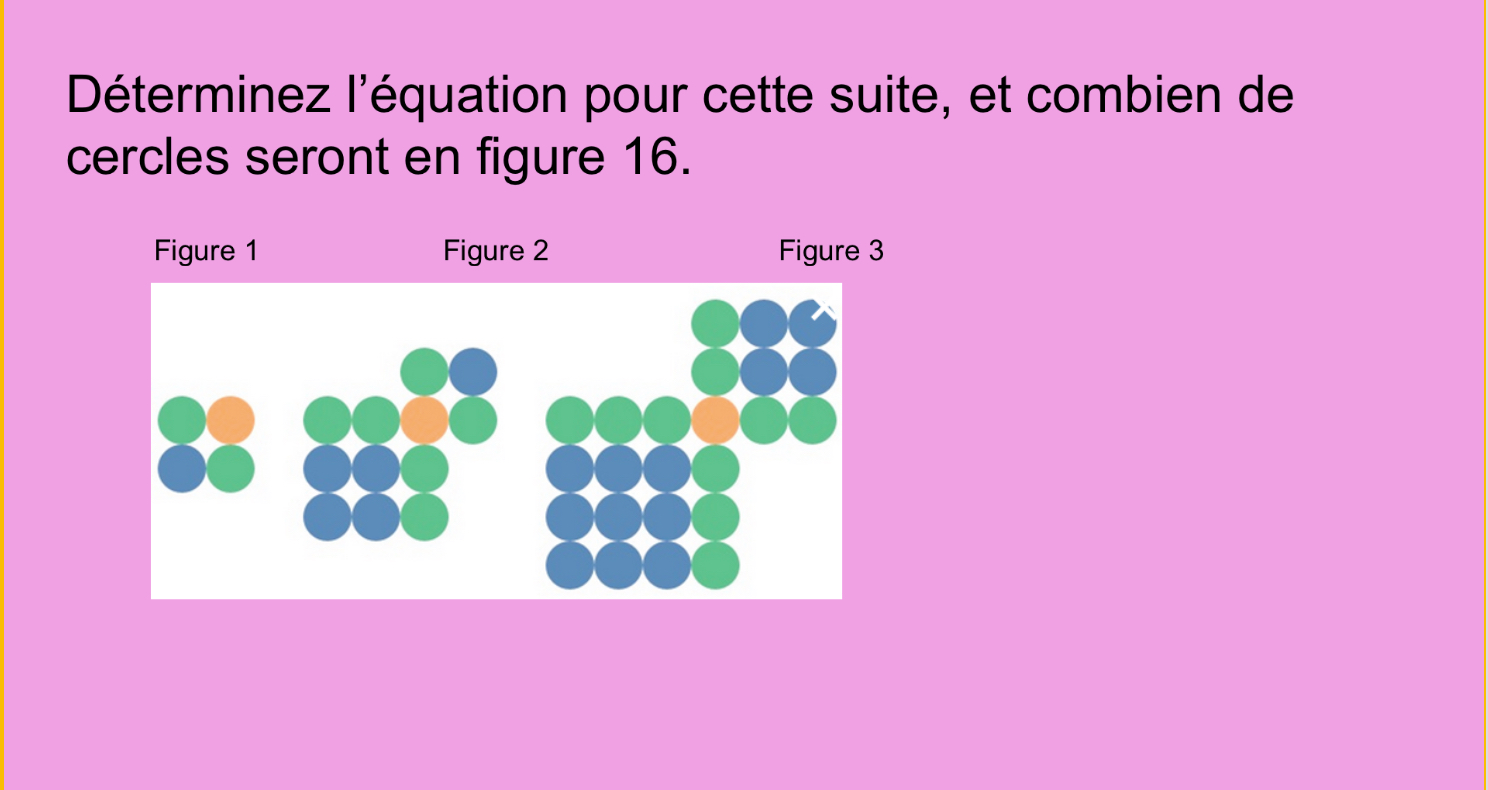
we continued the pattern, made tables of values and equations, and figured out how many’d be in figure 13.

We worked at the boards in small random groupings, sharing a marker, and working together on these tasks.
Some students saw this and ignored the colours. They saw a large square and a small square overlapping.

The larger square is (x+1)^2, and the smaller square is x^2, and they overlap, so they overcount the 1 square that is contained in both, so that’s why there’s a subtract 1 at the end.

others used the table of values to find the common 2nd difference of 4. We had already see that this is double of the “a” value. We can see that the constant is 0, so the next step is to calculate the b value.
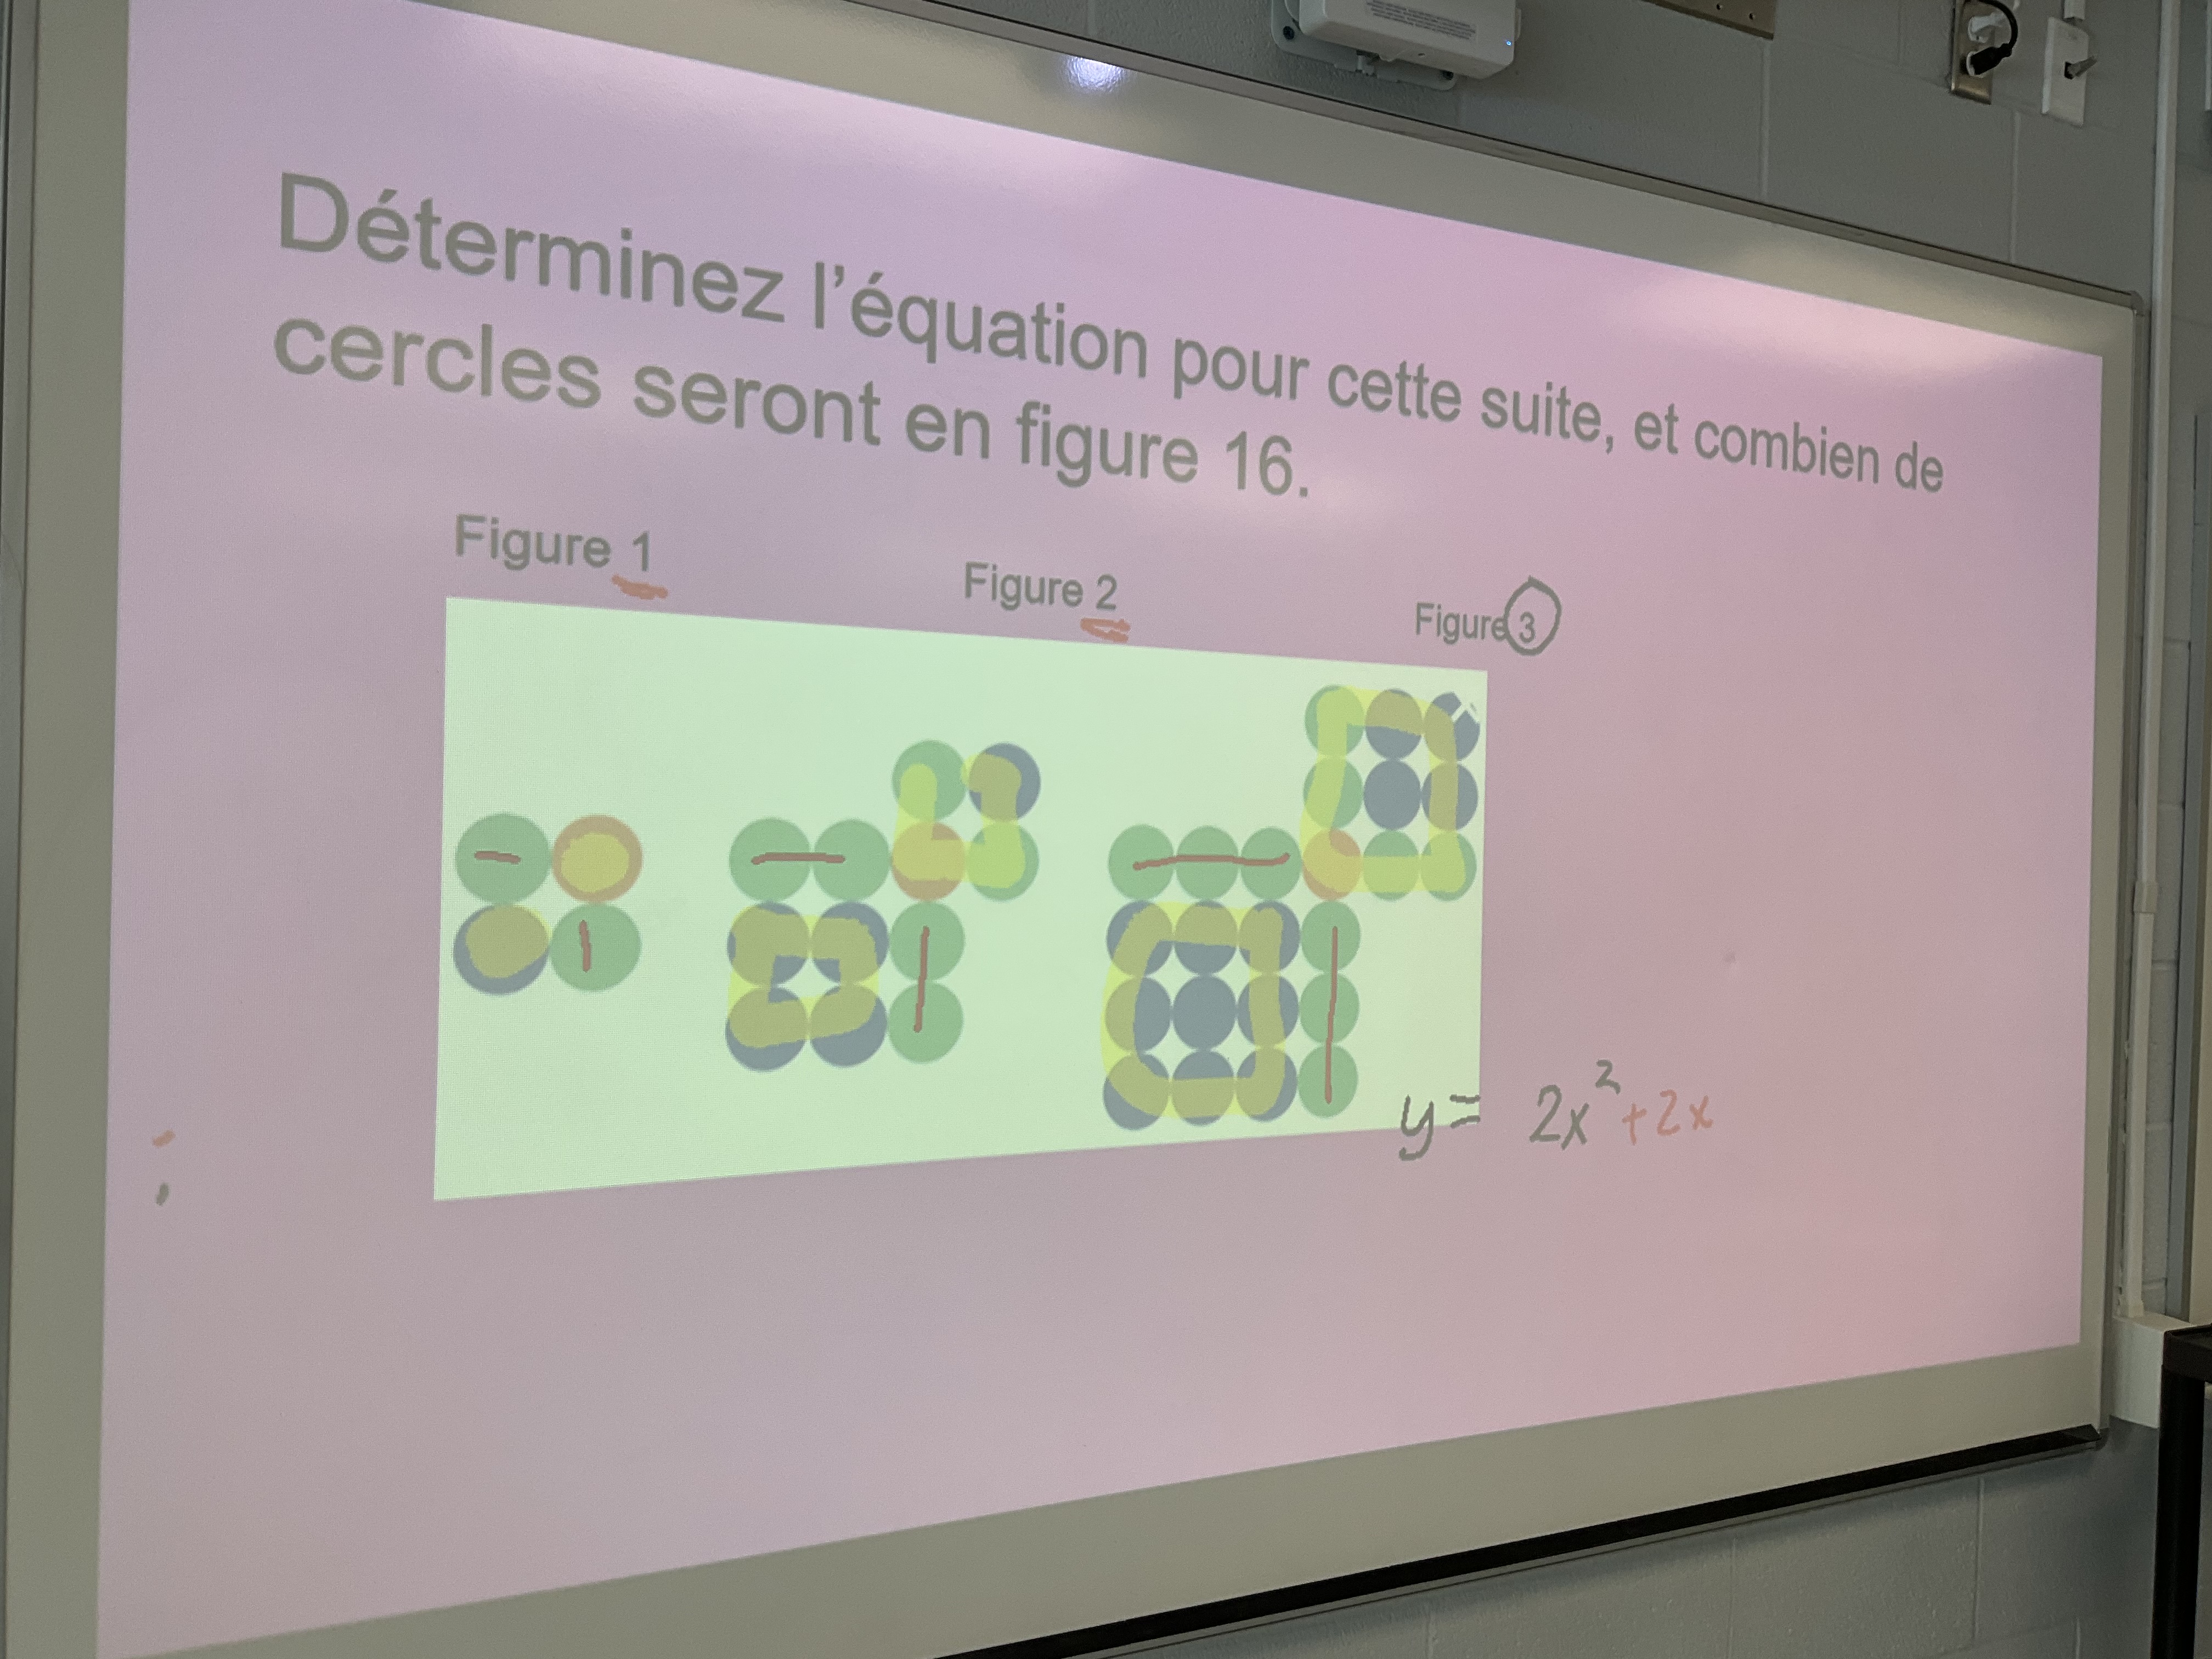
A potentially easier way to find the equation is visually. We see in figure 3, when x is 3, there are two 3×3 squares, in other words, 2x^2, and there are also 2 groups of 3 (2 groups of x) remaining. The equation is y=2x^2+2x.

We also had a look at what linear patterns look like (this is a review from grade 9). Our goal was to make a table, graph, and equation for patterns presented. Some patterns were linear, and some quadratic.
We worked on our math skills and our groupwork skills, and have a little bit of practice to do tonight.
well done grade 10s! A good start to a new semester.
EQAO day 1

Grade 9s worked really hard today on the first part of their provincial testing. Tomorrow is day 2.
Monopoly
Today in MAT1L students were preparing for their exit interviews, and some who were done interviews played monopoly with me!
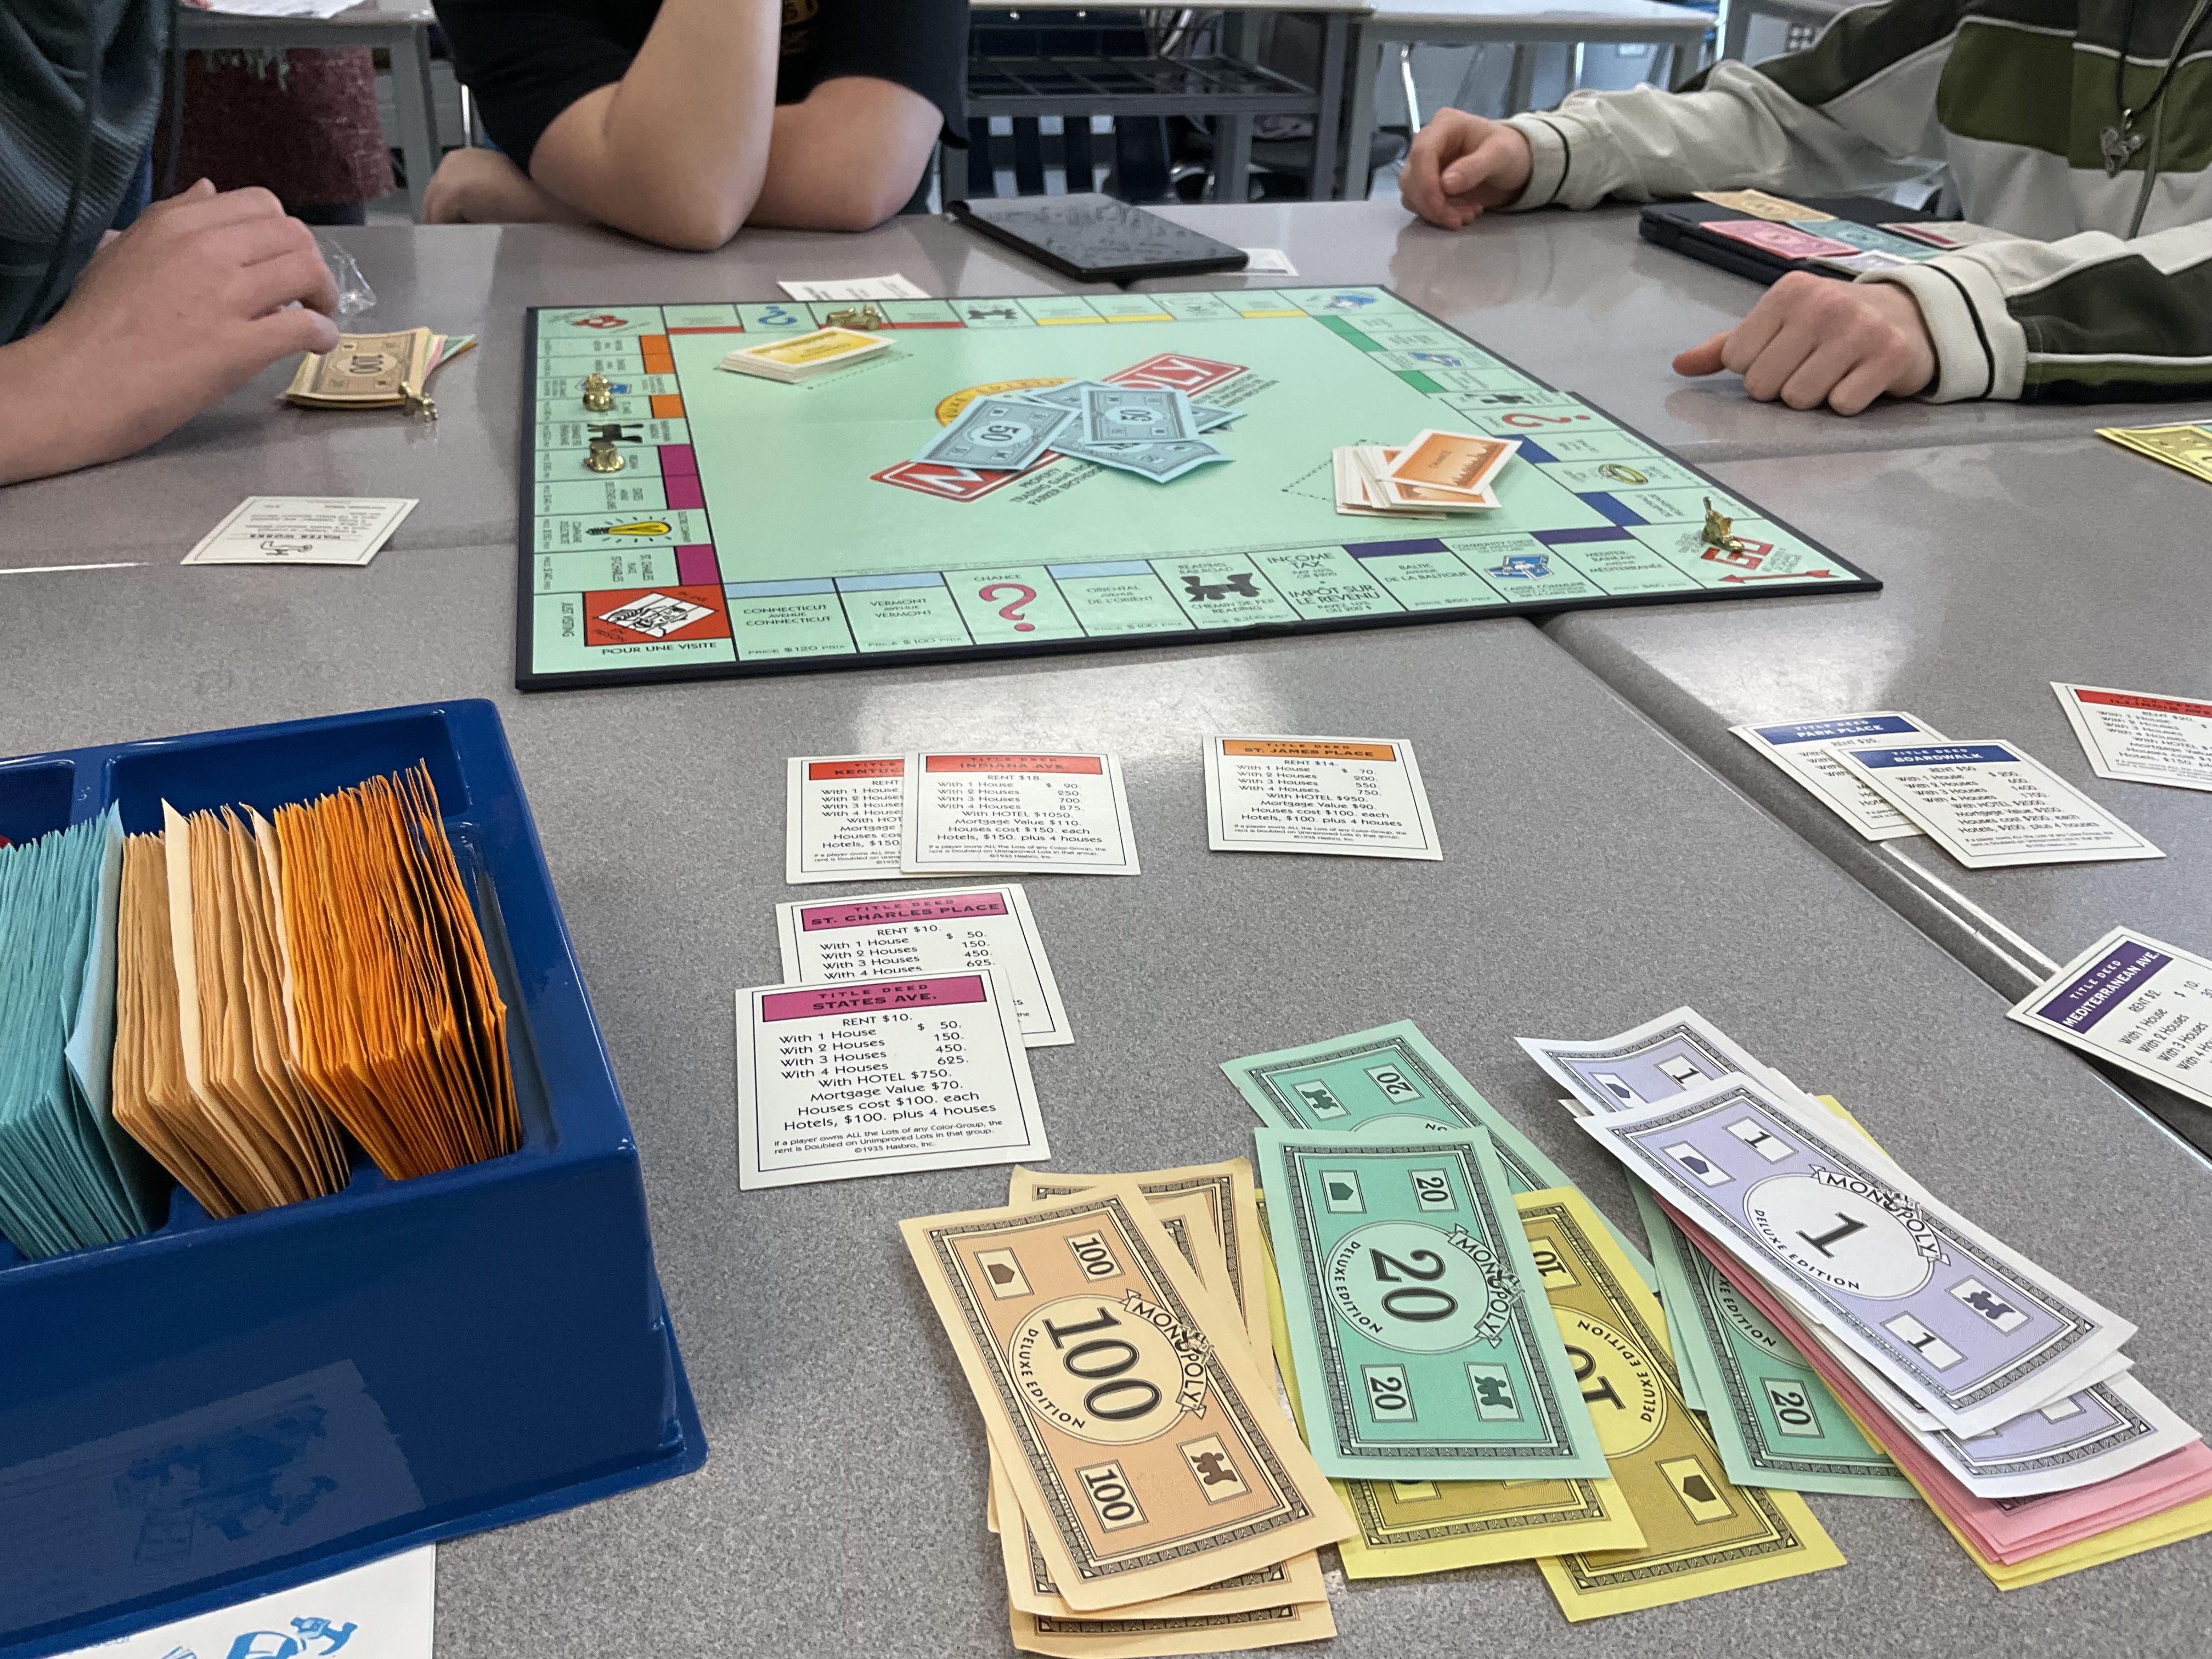
We had good conversations about making change, and adding and subtracting, and if it’s a good idea to buy things if we don’t have a lot of money.
Professional Development Session
I was honoured to lead a professional development session with our in-house feeder school. We looked at various ways to use manipulatives in math class.

We made a concept circle to show various representations with money.
A similar strategy can be used with base 10 blocks to represent integers
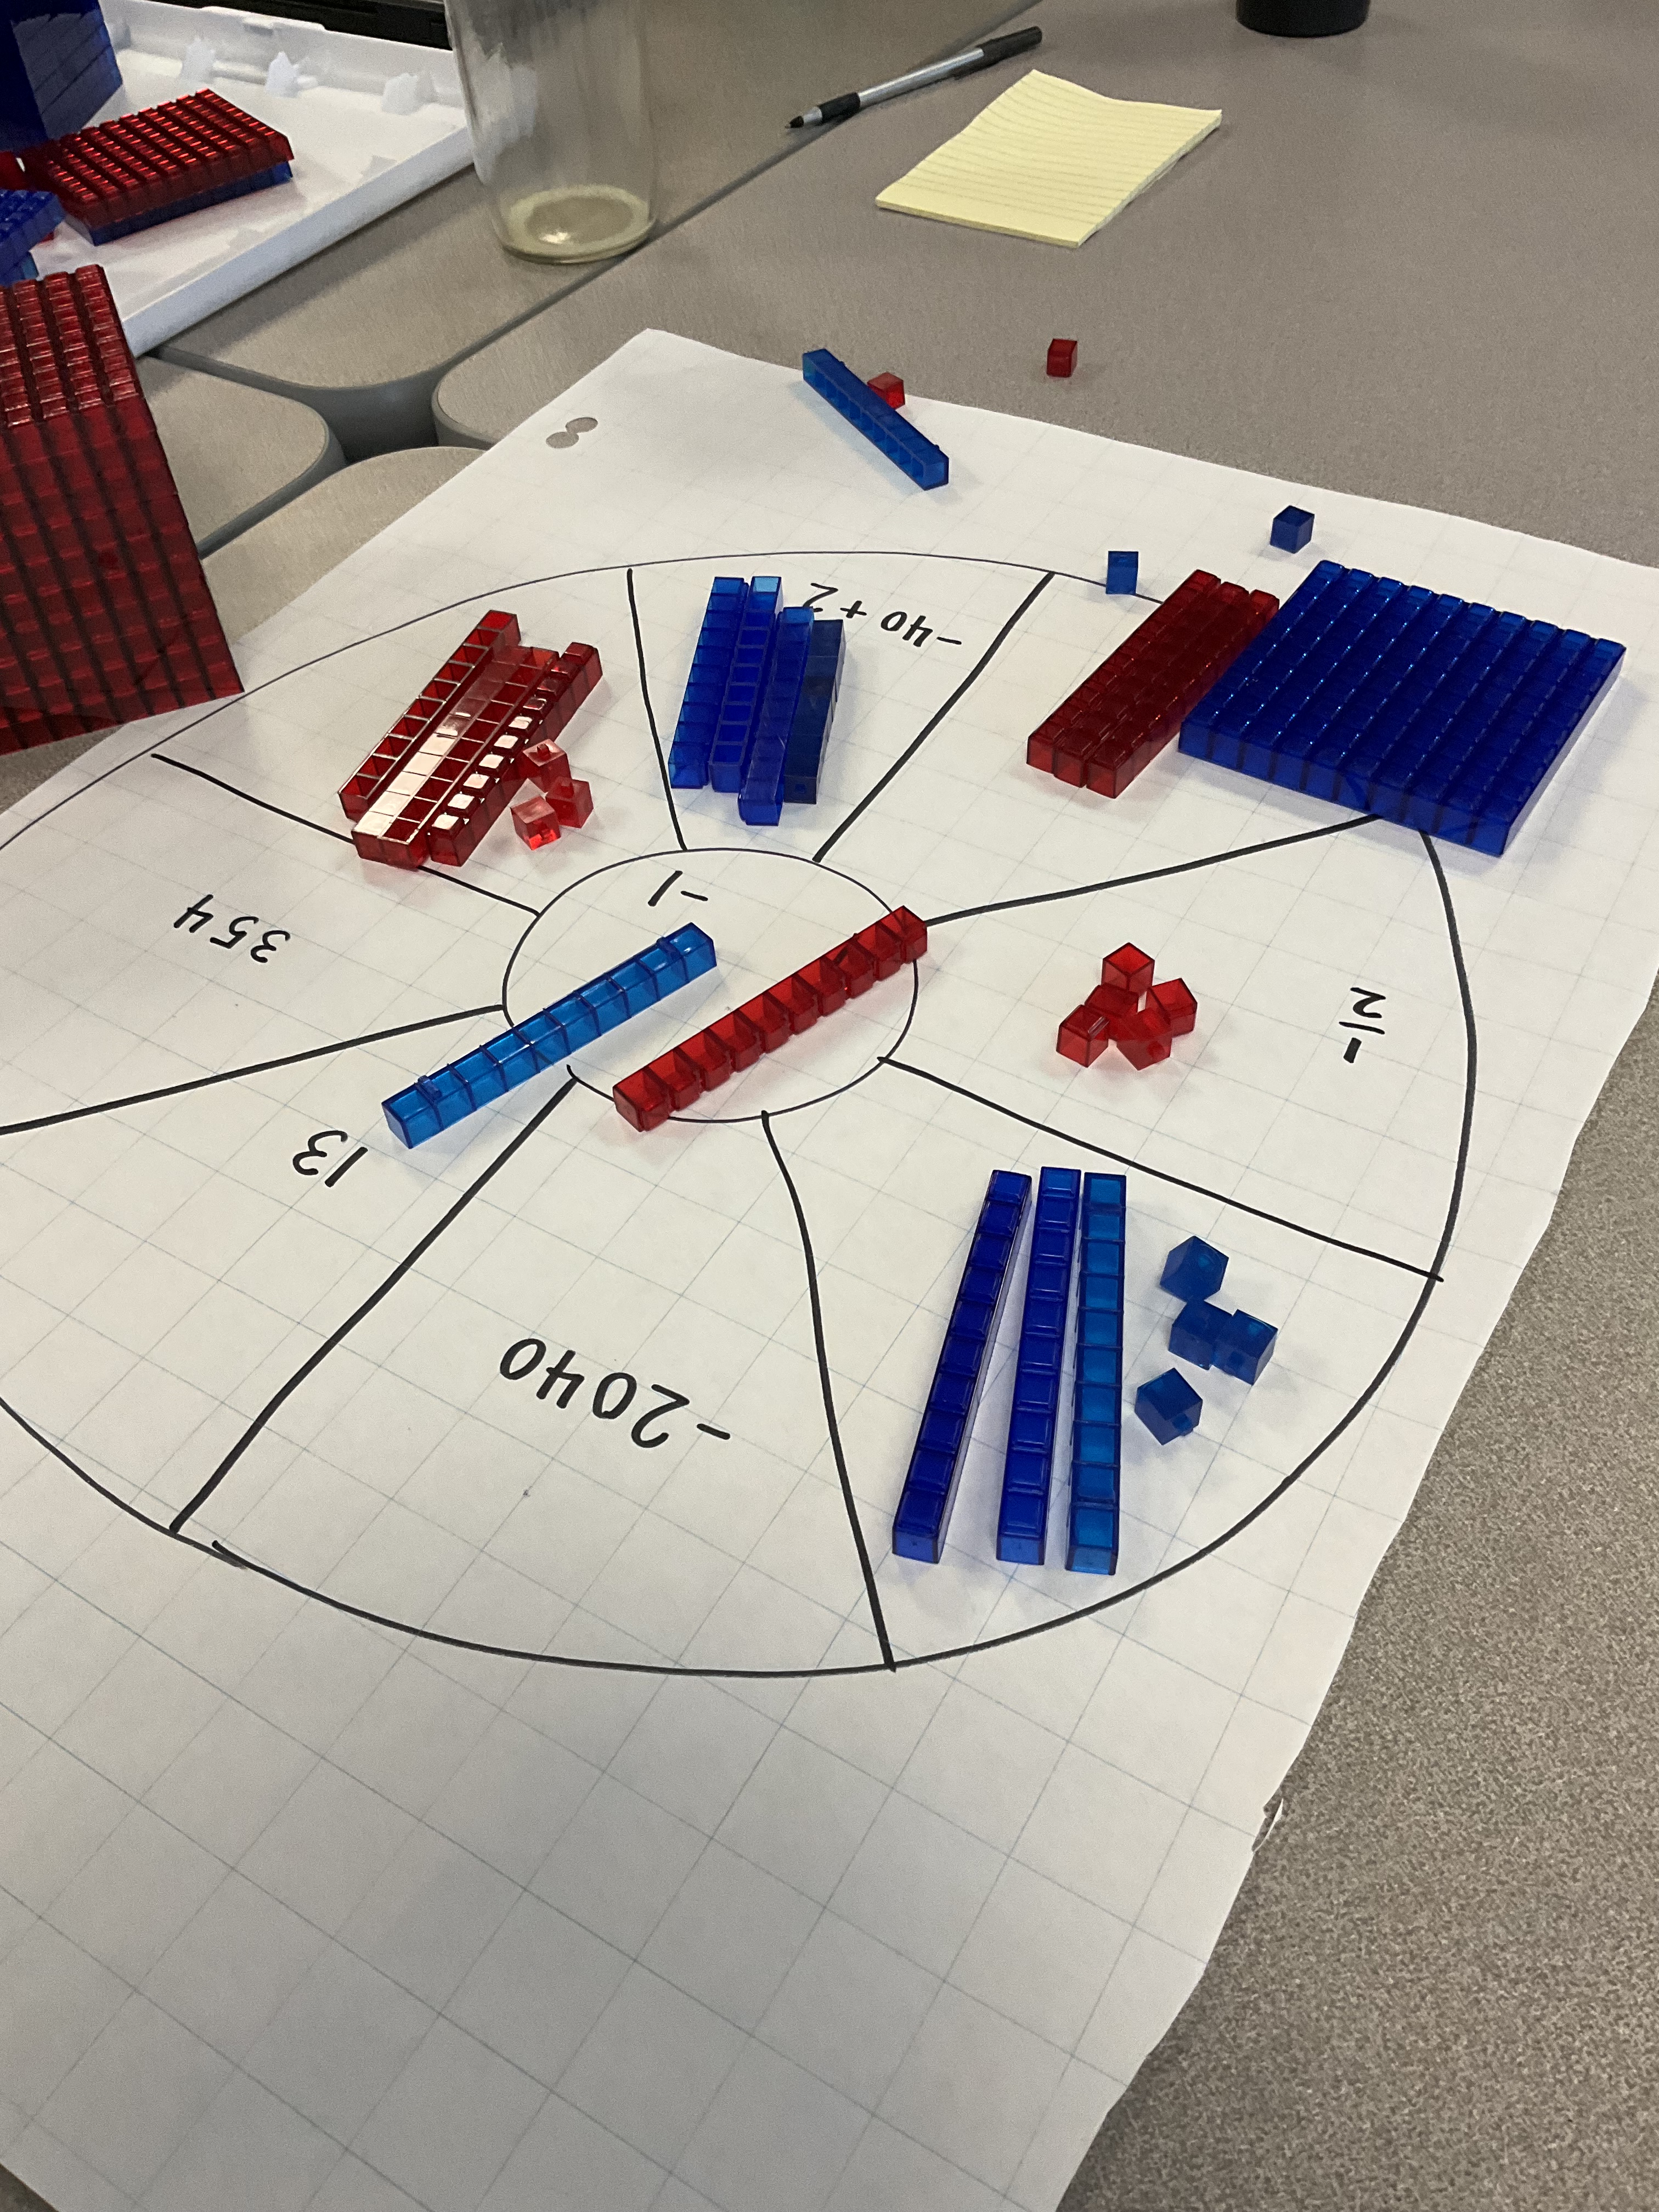
We can change what’s in he middle as well and look at fractions decimals and percents

We then used toothpicks and plasticine to build models of exponents, and see how x squared, x cubed, and x are all very different and can’t be added or subtracted.

next we introduced algebra tiles as another way to show algebra.
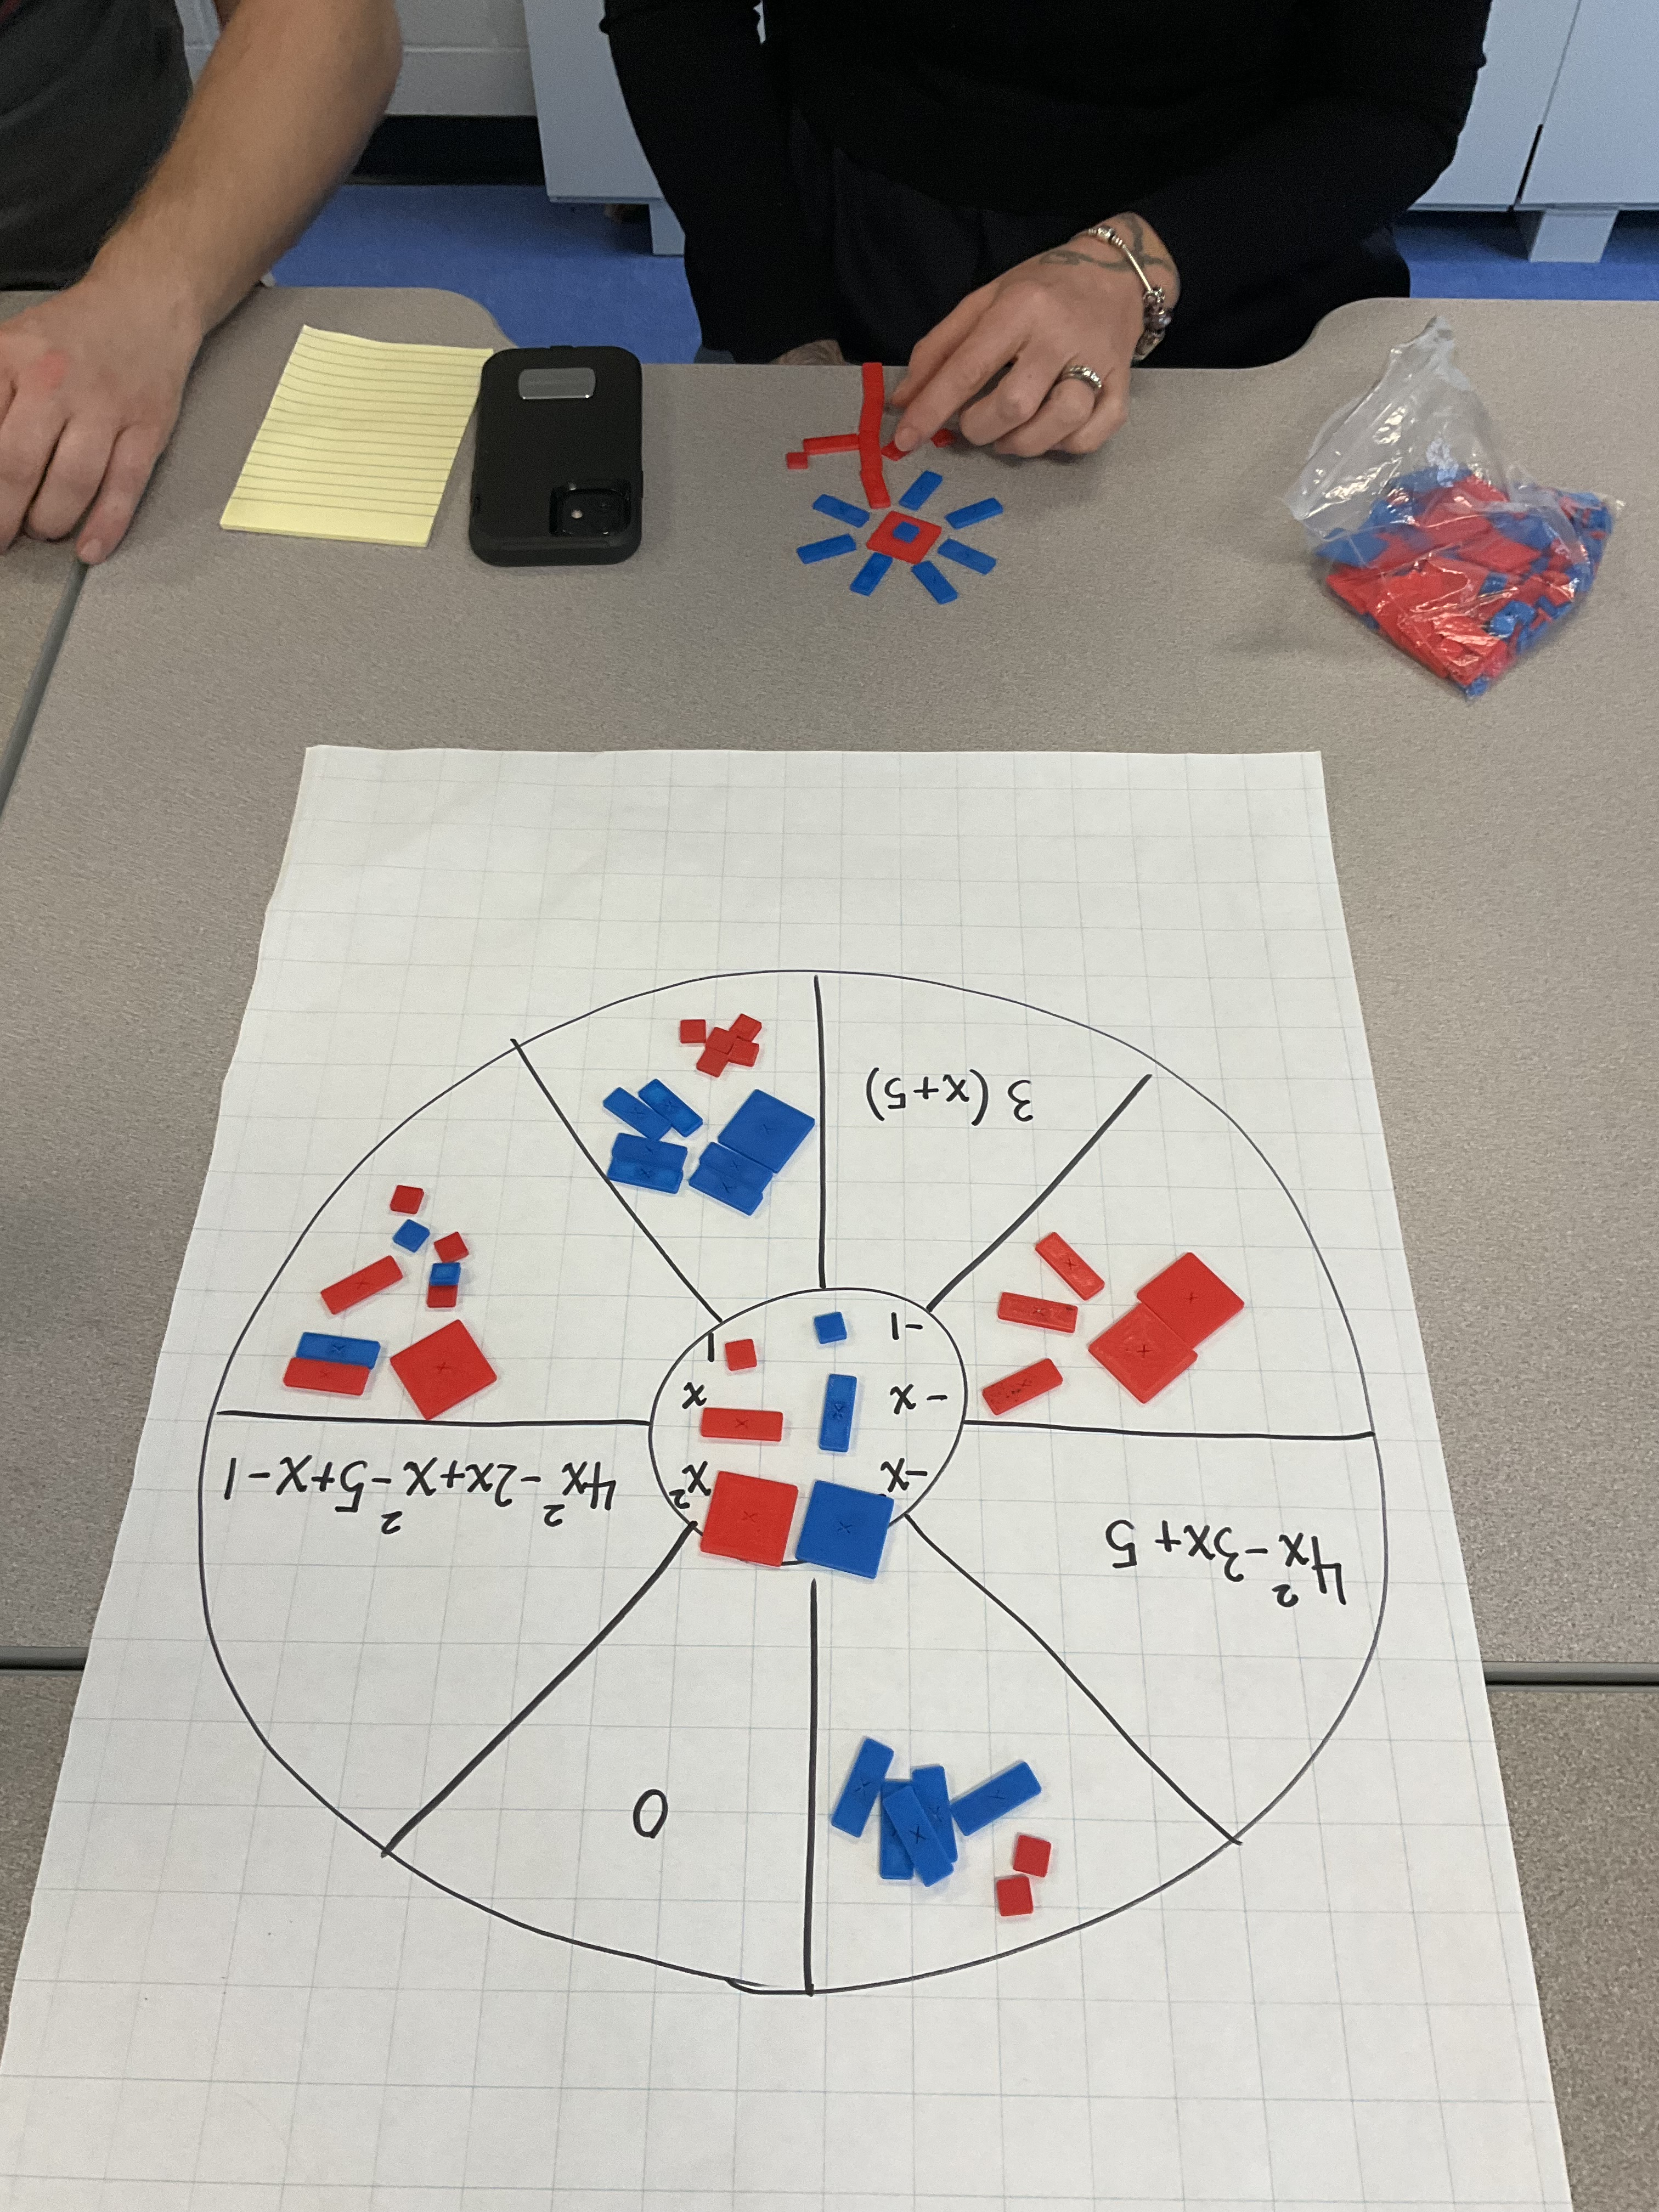
we took a bit of time and worked with tiles and the “bucket of zeros” for adding and subtracting and multiplying integers. Then we also spent time using tiles ro solve equations.
my presentation is listed in the professional development tab on this site if you want to see more! It was a pleasure working with such enthusiastic educators. We look forward to doing something similar next term with our other local feeder schools.
Catapult Culminating
In grade 10 we’ve been working though our culminating task where we build catapults to launch pompoms.
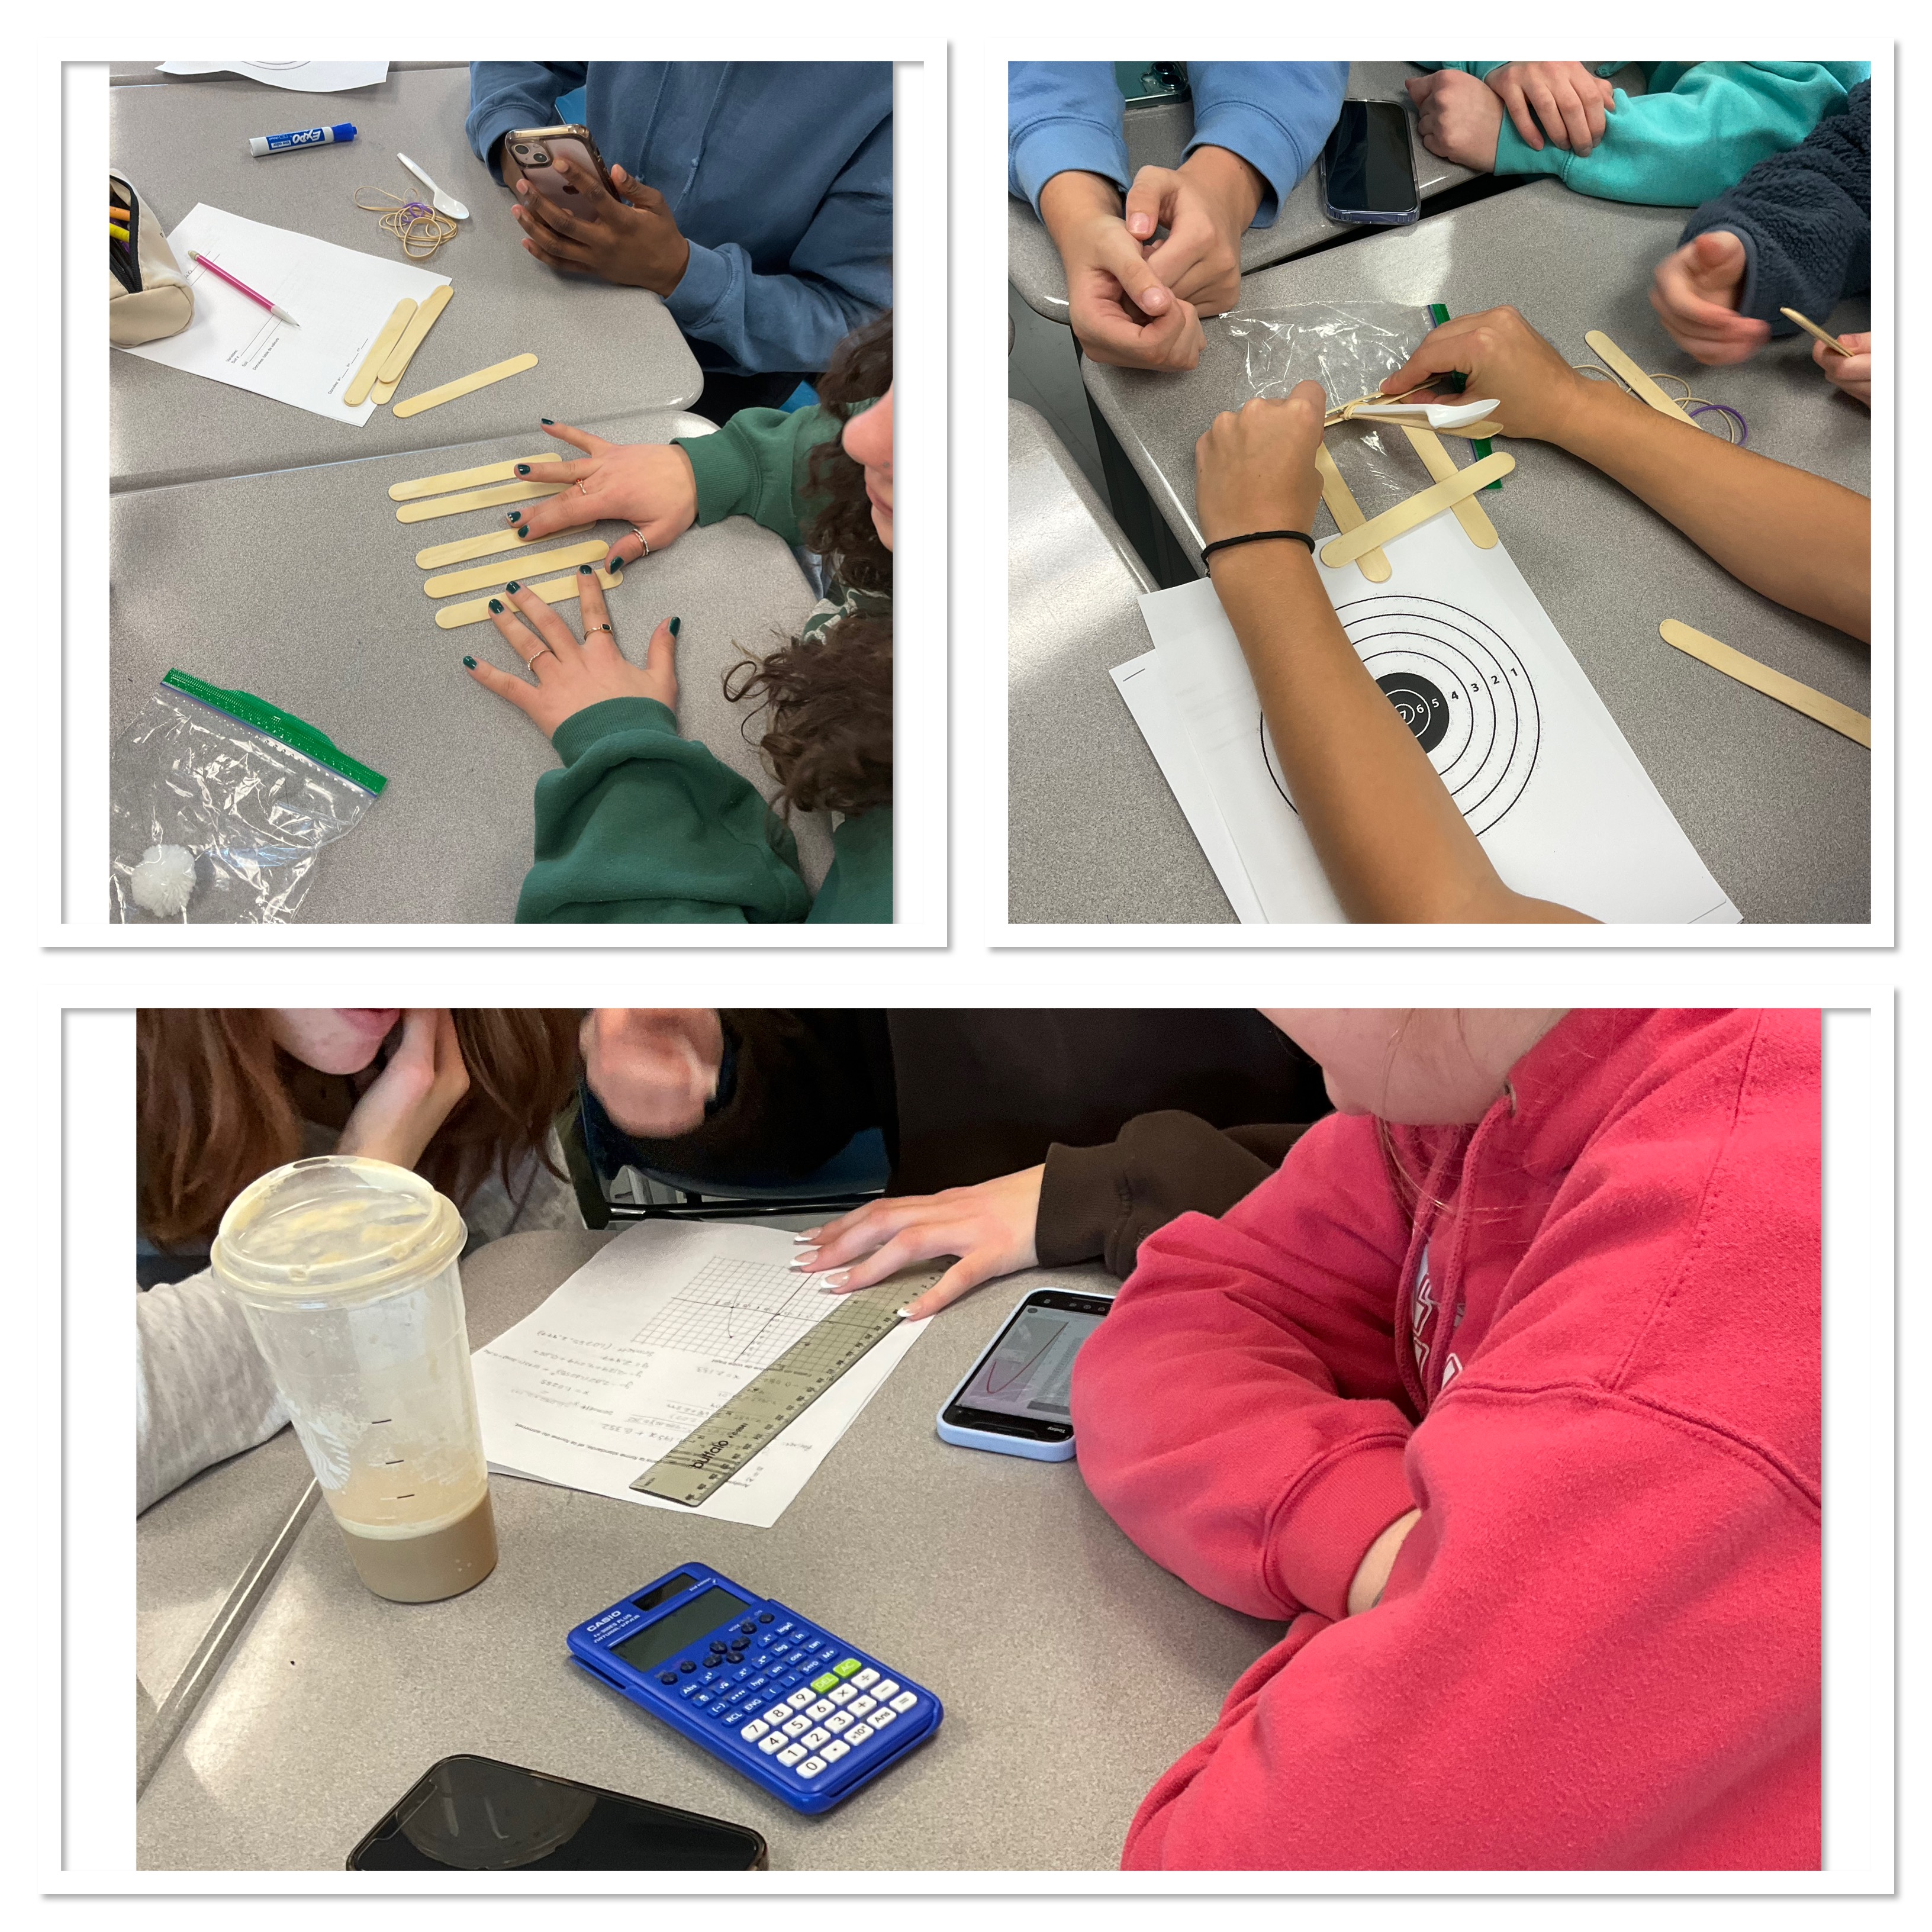
We use the app Visual Physics to help us analyse the trajectory of the launch.
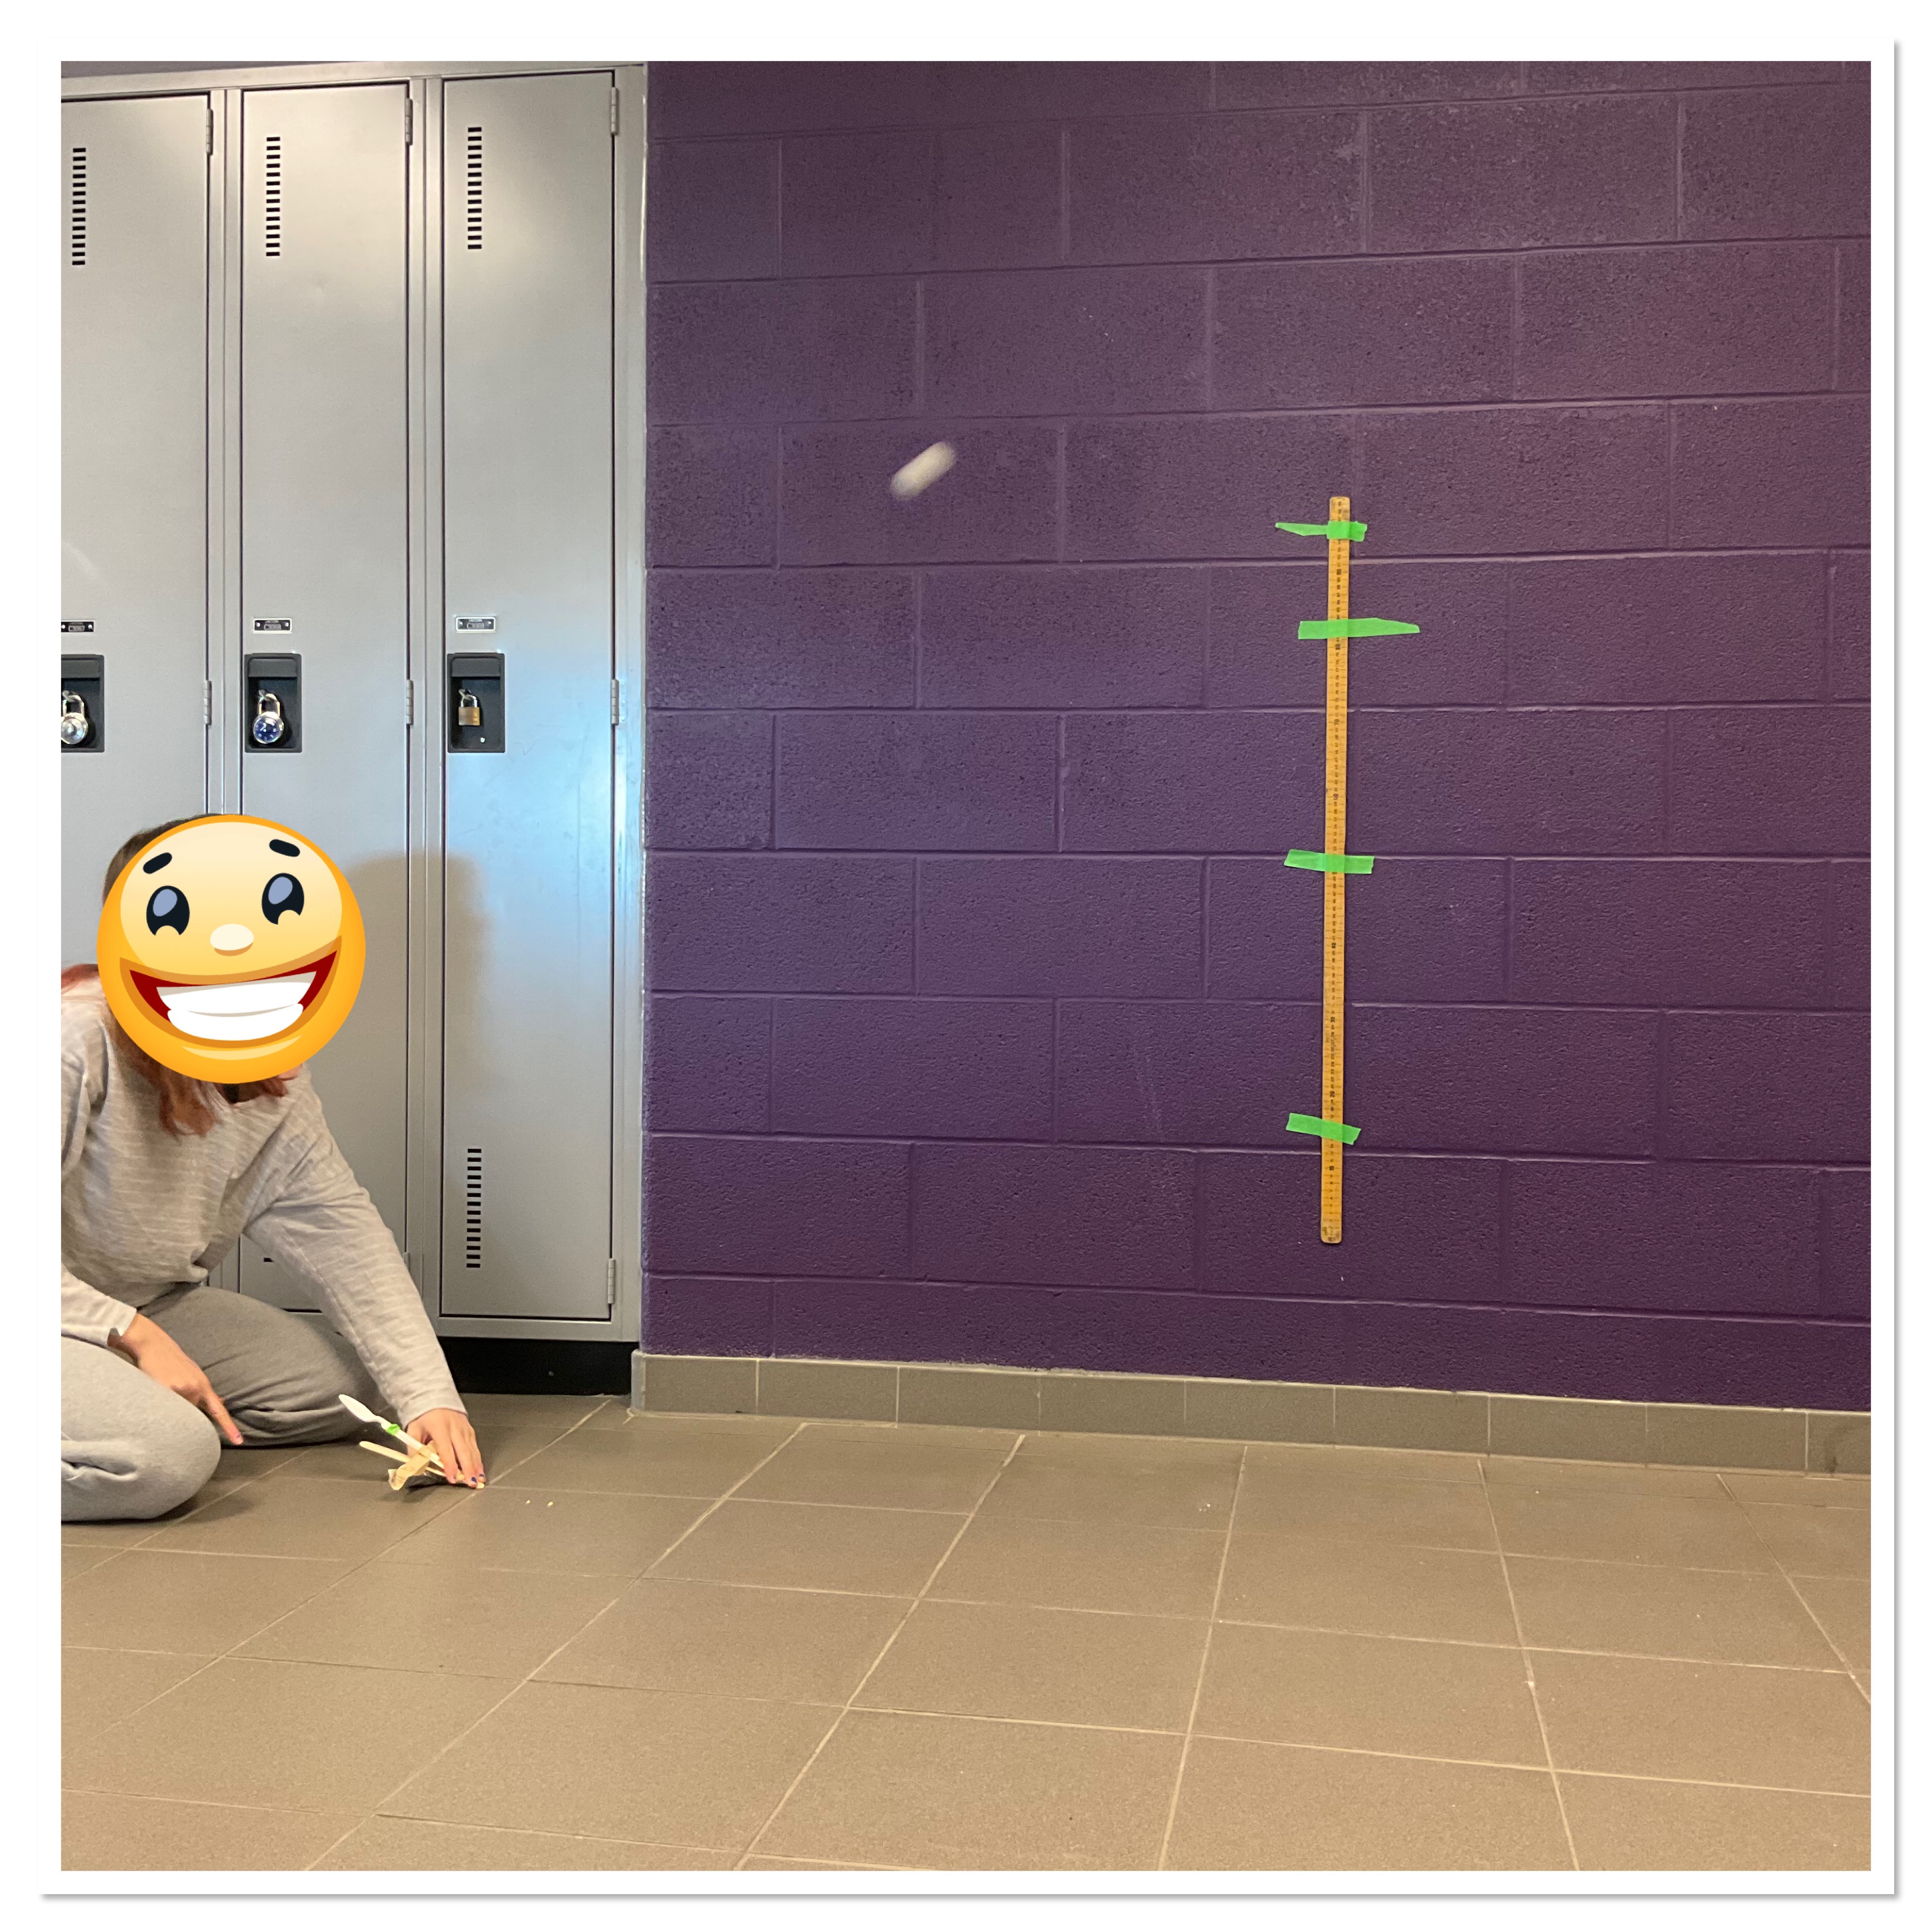
We can identify the axes, the scale, and then locate the pompom over time.

The data can then be interpreted with another app, which can pull the data points into a table of values, and/or a graph which can be smoothed.
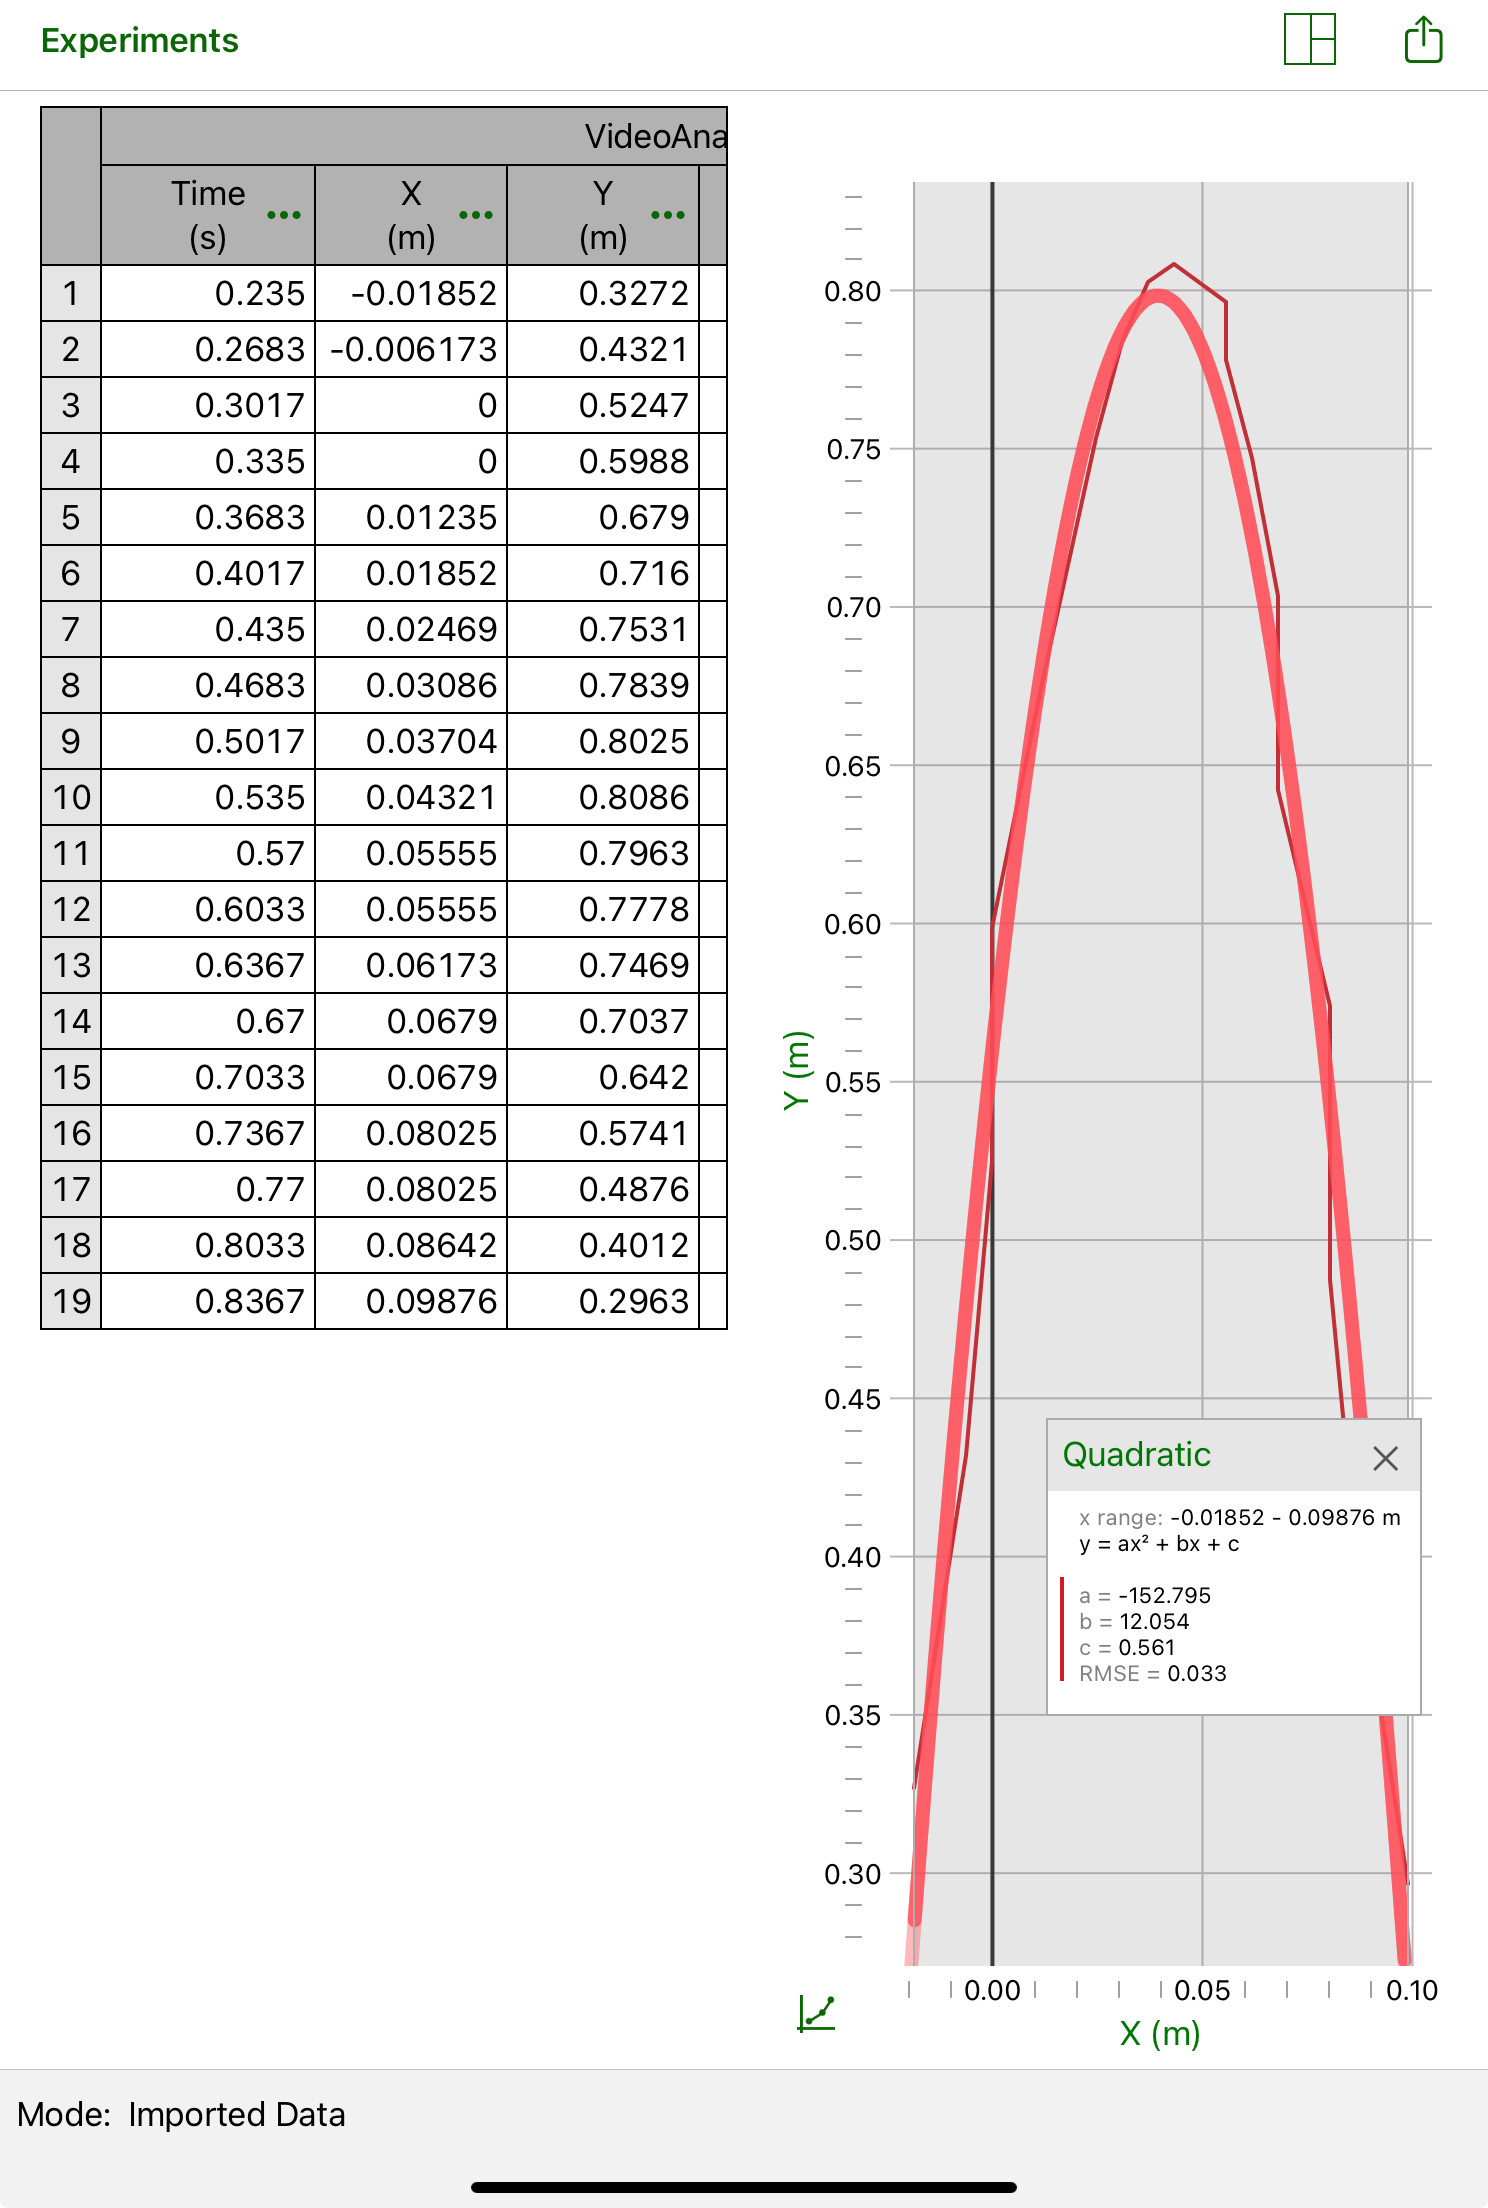
Students then determine the vertex, the x intercepts, the y intercept from the table and the graph, and use this to answer questions like where should a target be placed, or if the catapult is launching from a chair or a desk of different height, where should the target be located on the floor.
Exploring Sine Law
Grade 10s today had a look at relationships in triangles. We measured sides and angles as accurately as we could, and then we looked at ratios.
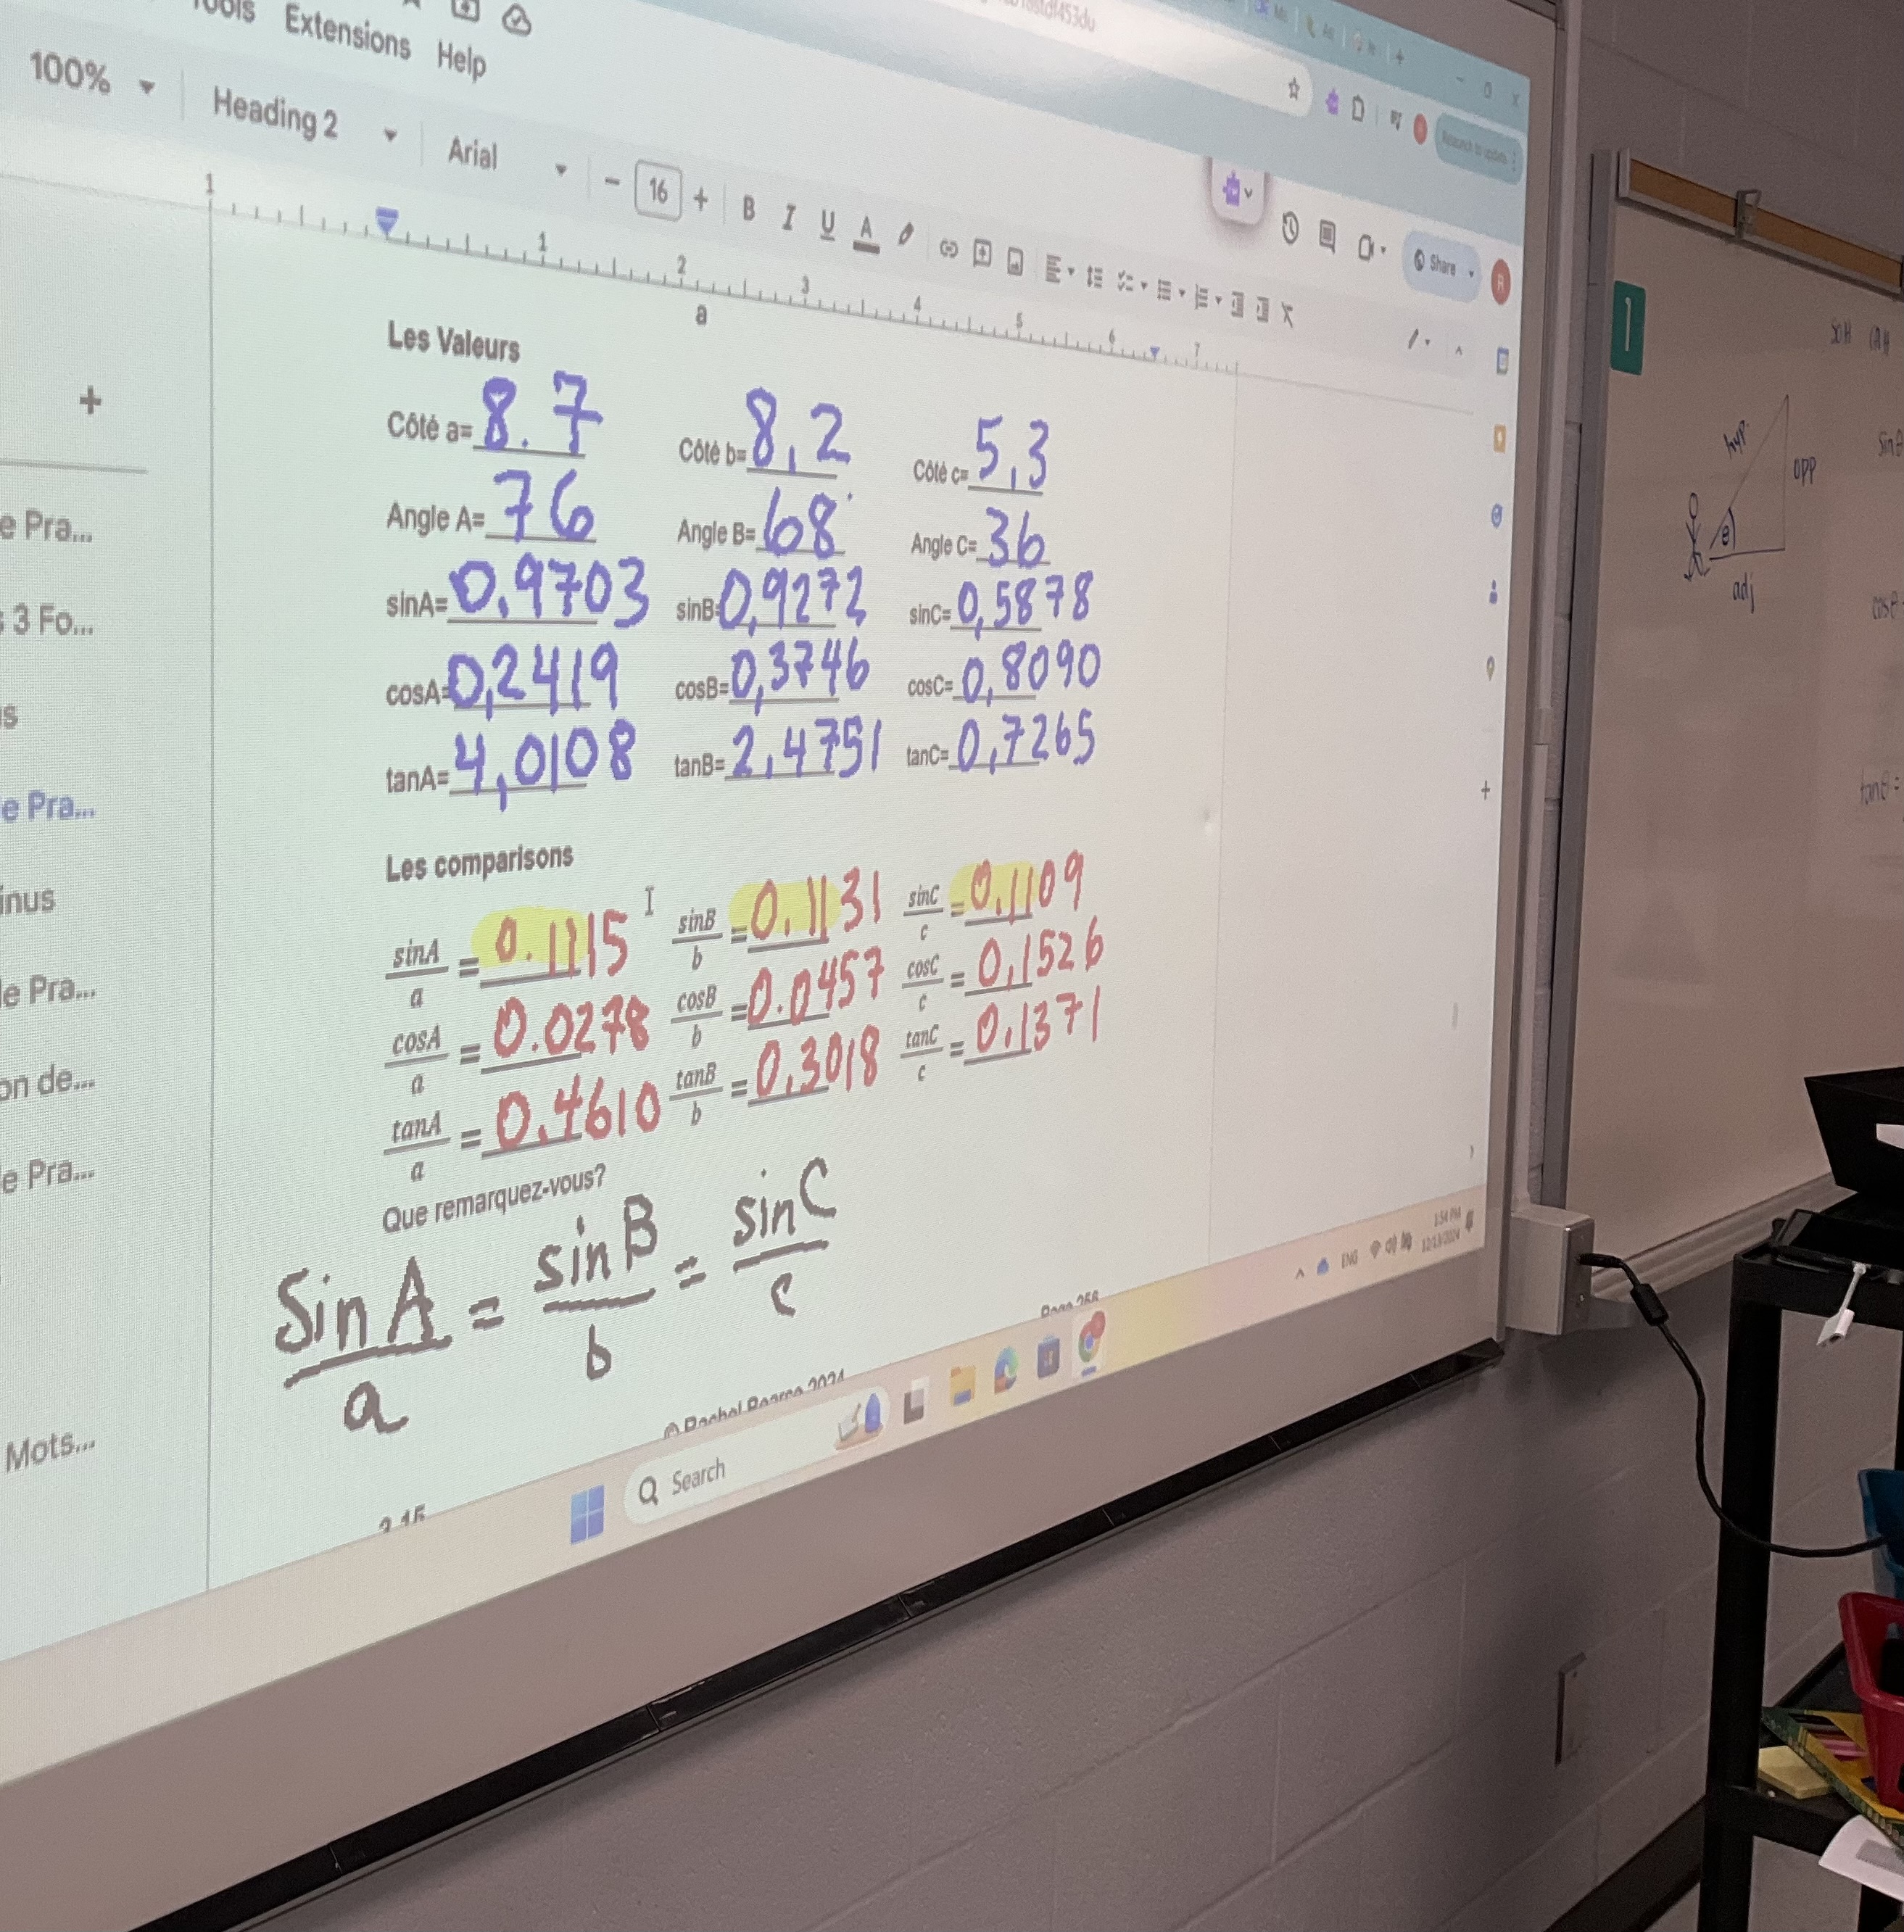
We compared the ratios of sinA/a and cosA/a and tanA/a and the same for B and C. We noticed a lot of things when we looked at the values.
we noticed that tangent is the only ratio that can have values greater than 1. We looked at why that could be the case. Sine and cosine are ratios of opposite and hypotenuse, and adjacent and hypotenuse. The hypotenuse (always the longest side) is always the denominator, so the fraction will be between 0 and 1 when divided. Tangent compares opposite and adjacent, and sometimes the adjacent is the big side, and sometimes the opposite is the big side, so tangent can be any value from 0 to infinity.
We also noticed that the ratios of sinA/a=sinB/b=sinC/c, and we formalized that this is the sine law. We then started using it to solve problems with non-right angle triangles.
Solving Systems By Graphing
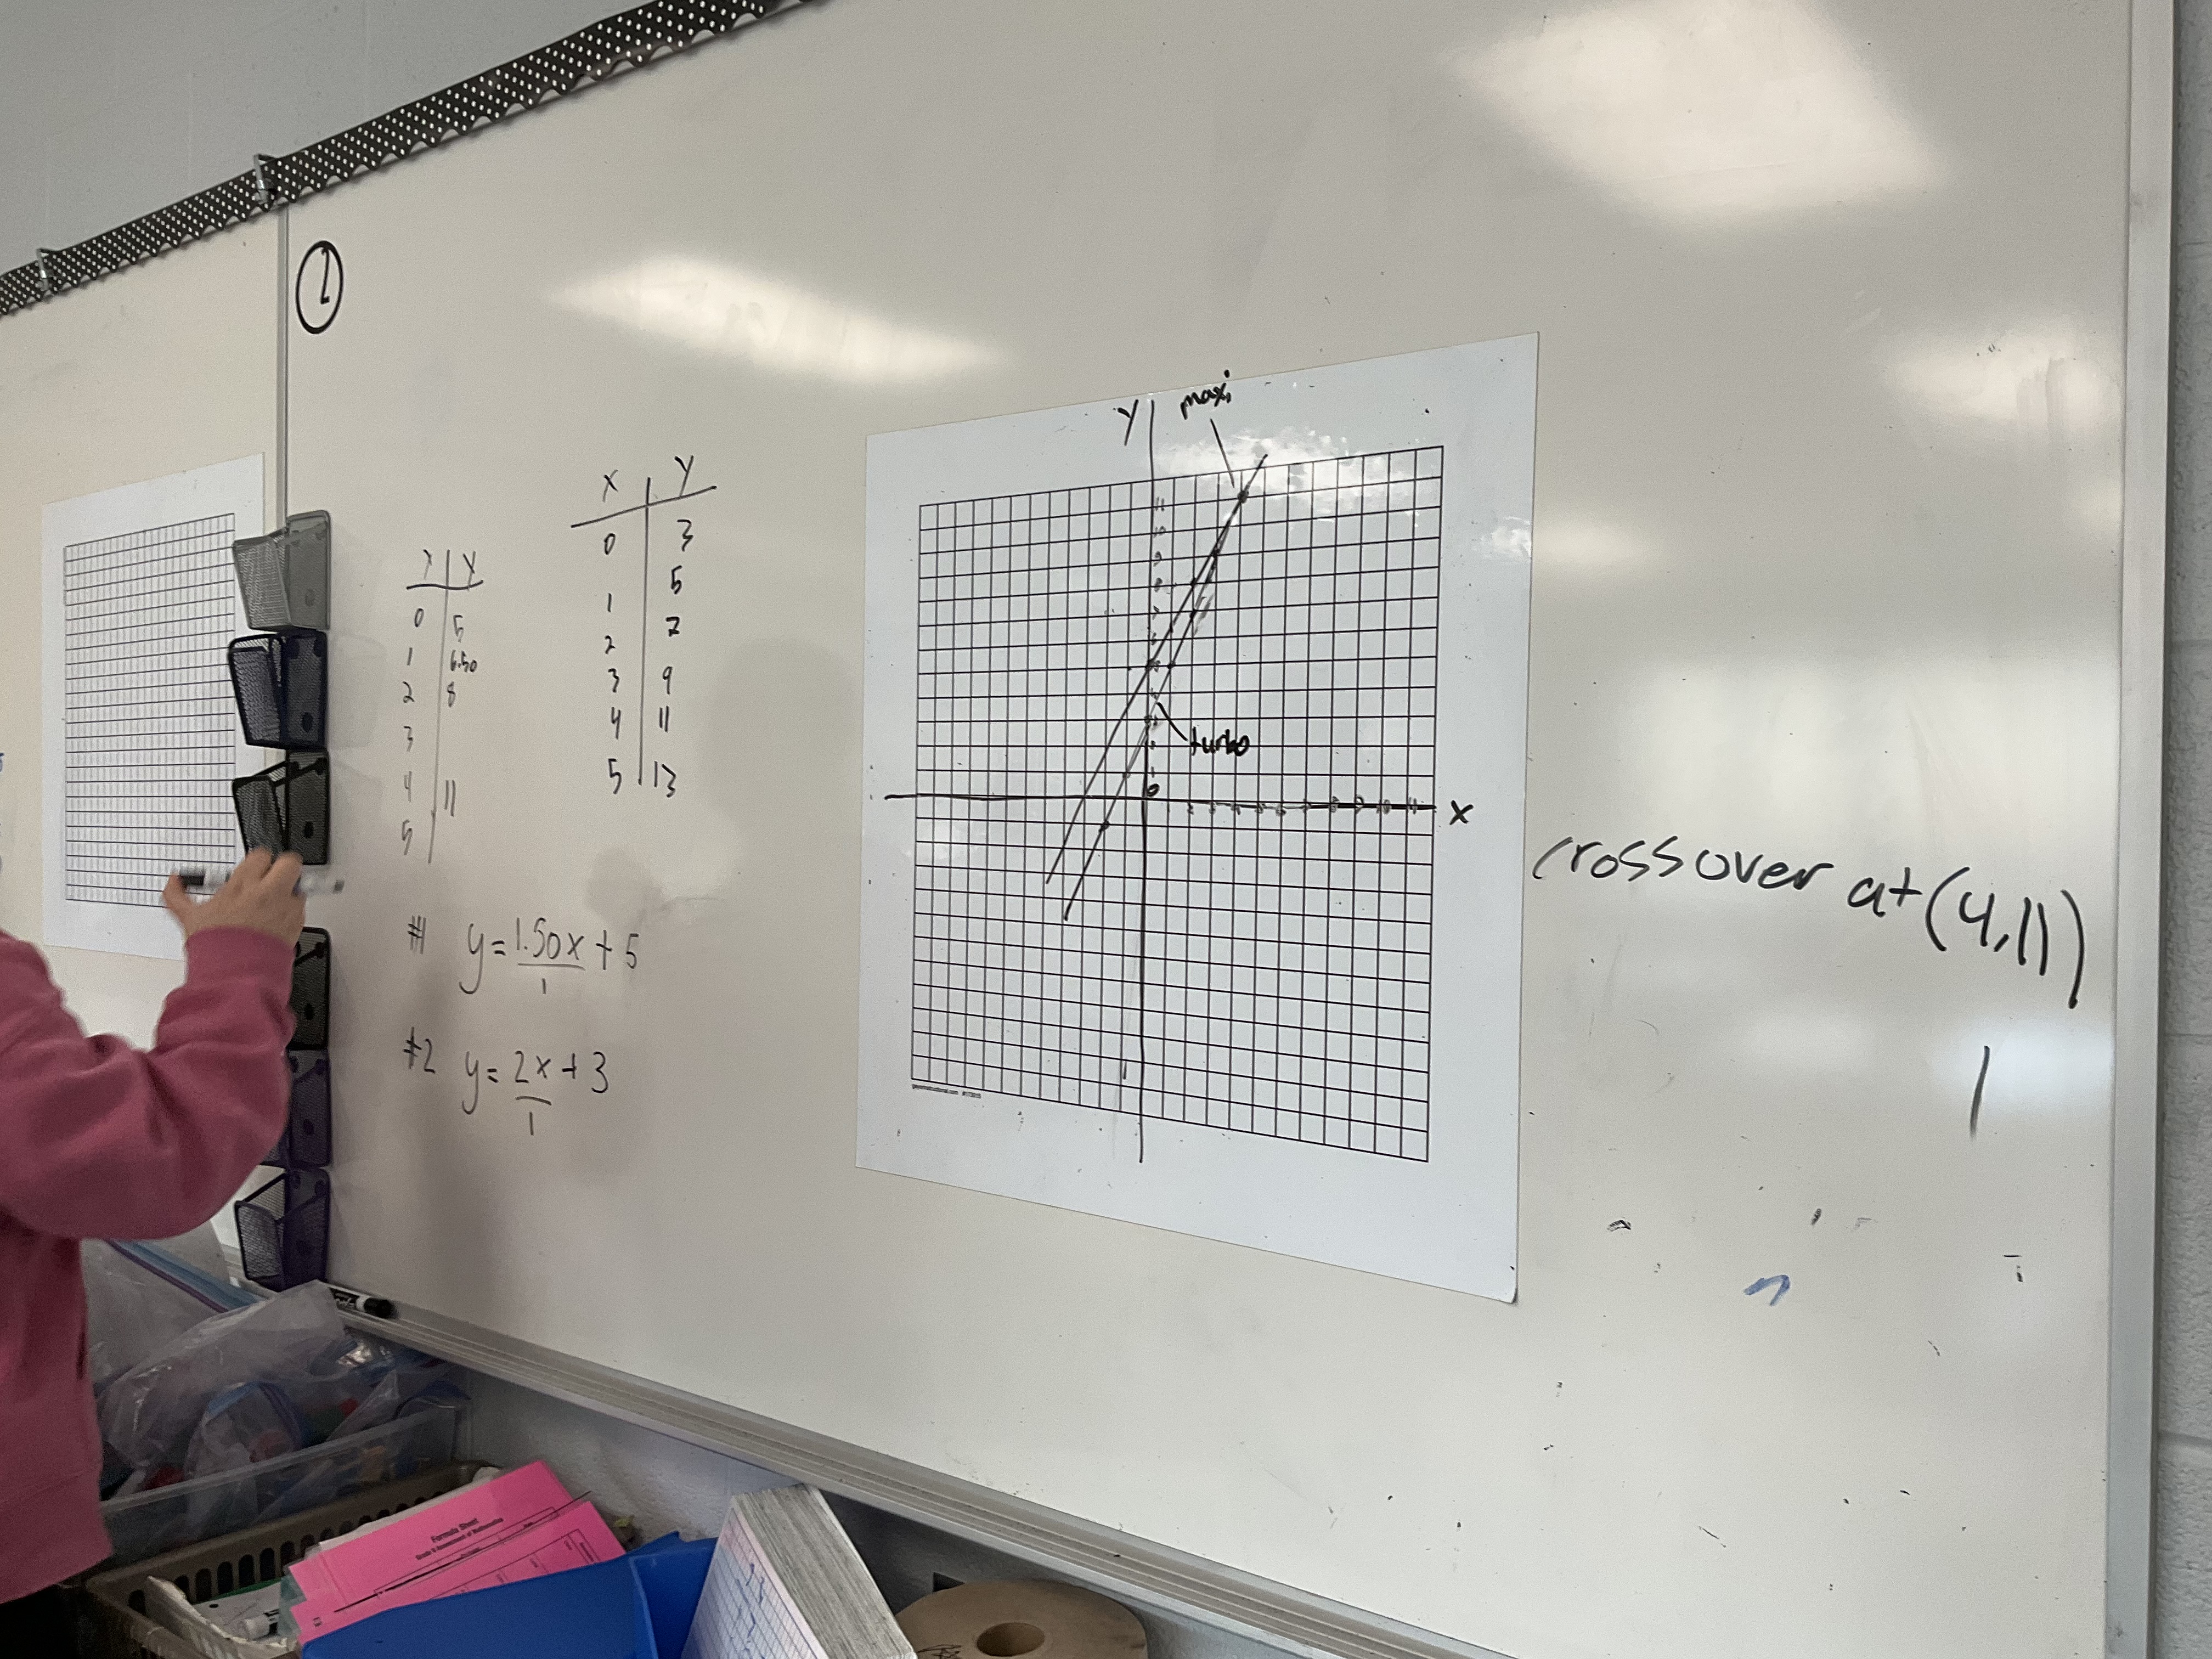
I had the pleasure to be in a MTH1W class that was working on solving systems of equations with tables and by graphing.

In small random groups students tackled the problem with many strategies. Some made equations, then graphed directly. Some groups rewrote 1.5 as 3/2 to show the slope in a fraction form to help graph more easily.

Some made tables and equations and graphs which all showed that there’s a cross over point, or point of intersection at 4km and $11.
A follow up question was regarding the planning of a birthday party. At Tony’s Pizza they charge $150 for the party room and $12 per guest, and at Joey’s Hamburger it costs $180 for the party room and $10 per guest.
Some groups made equations, then used tables and calculated values until they could see a cross over point.
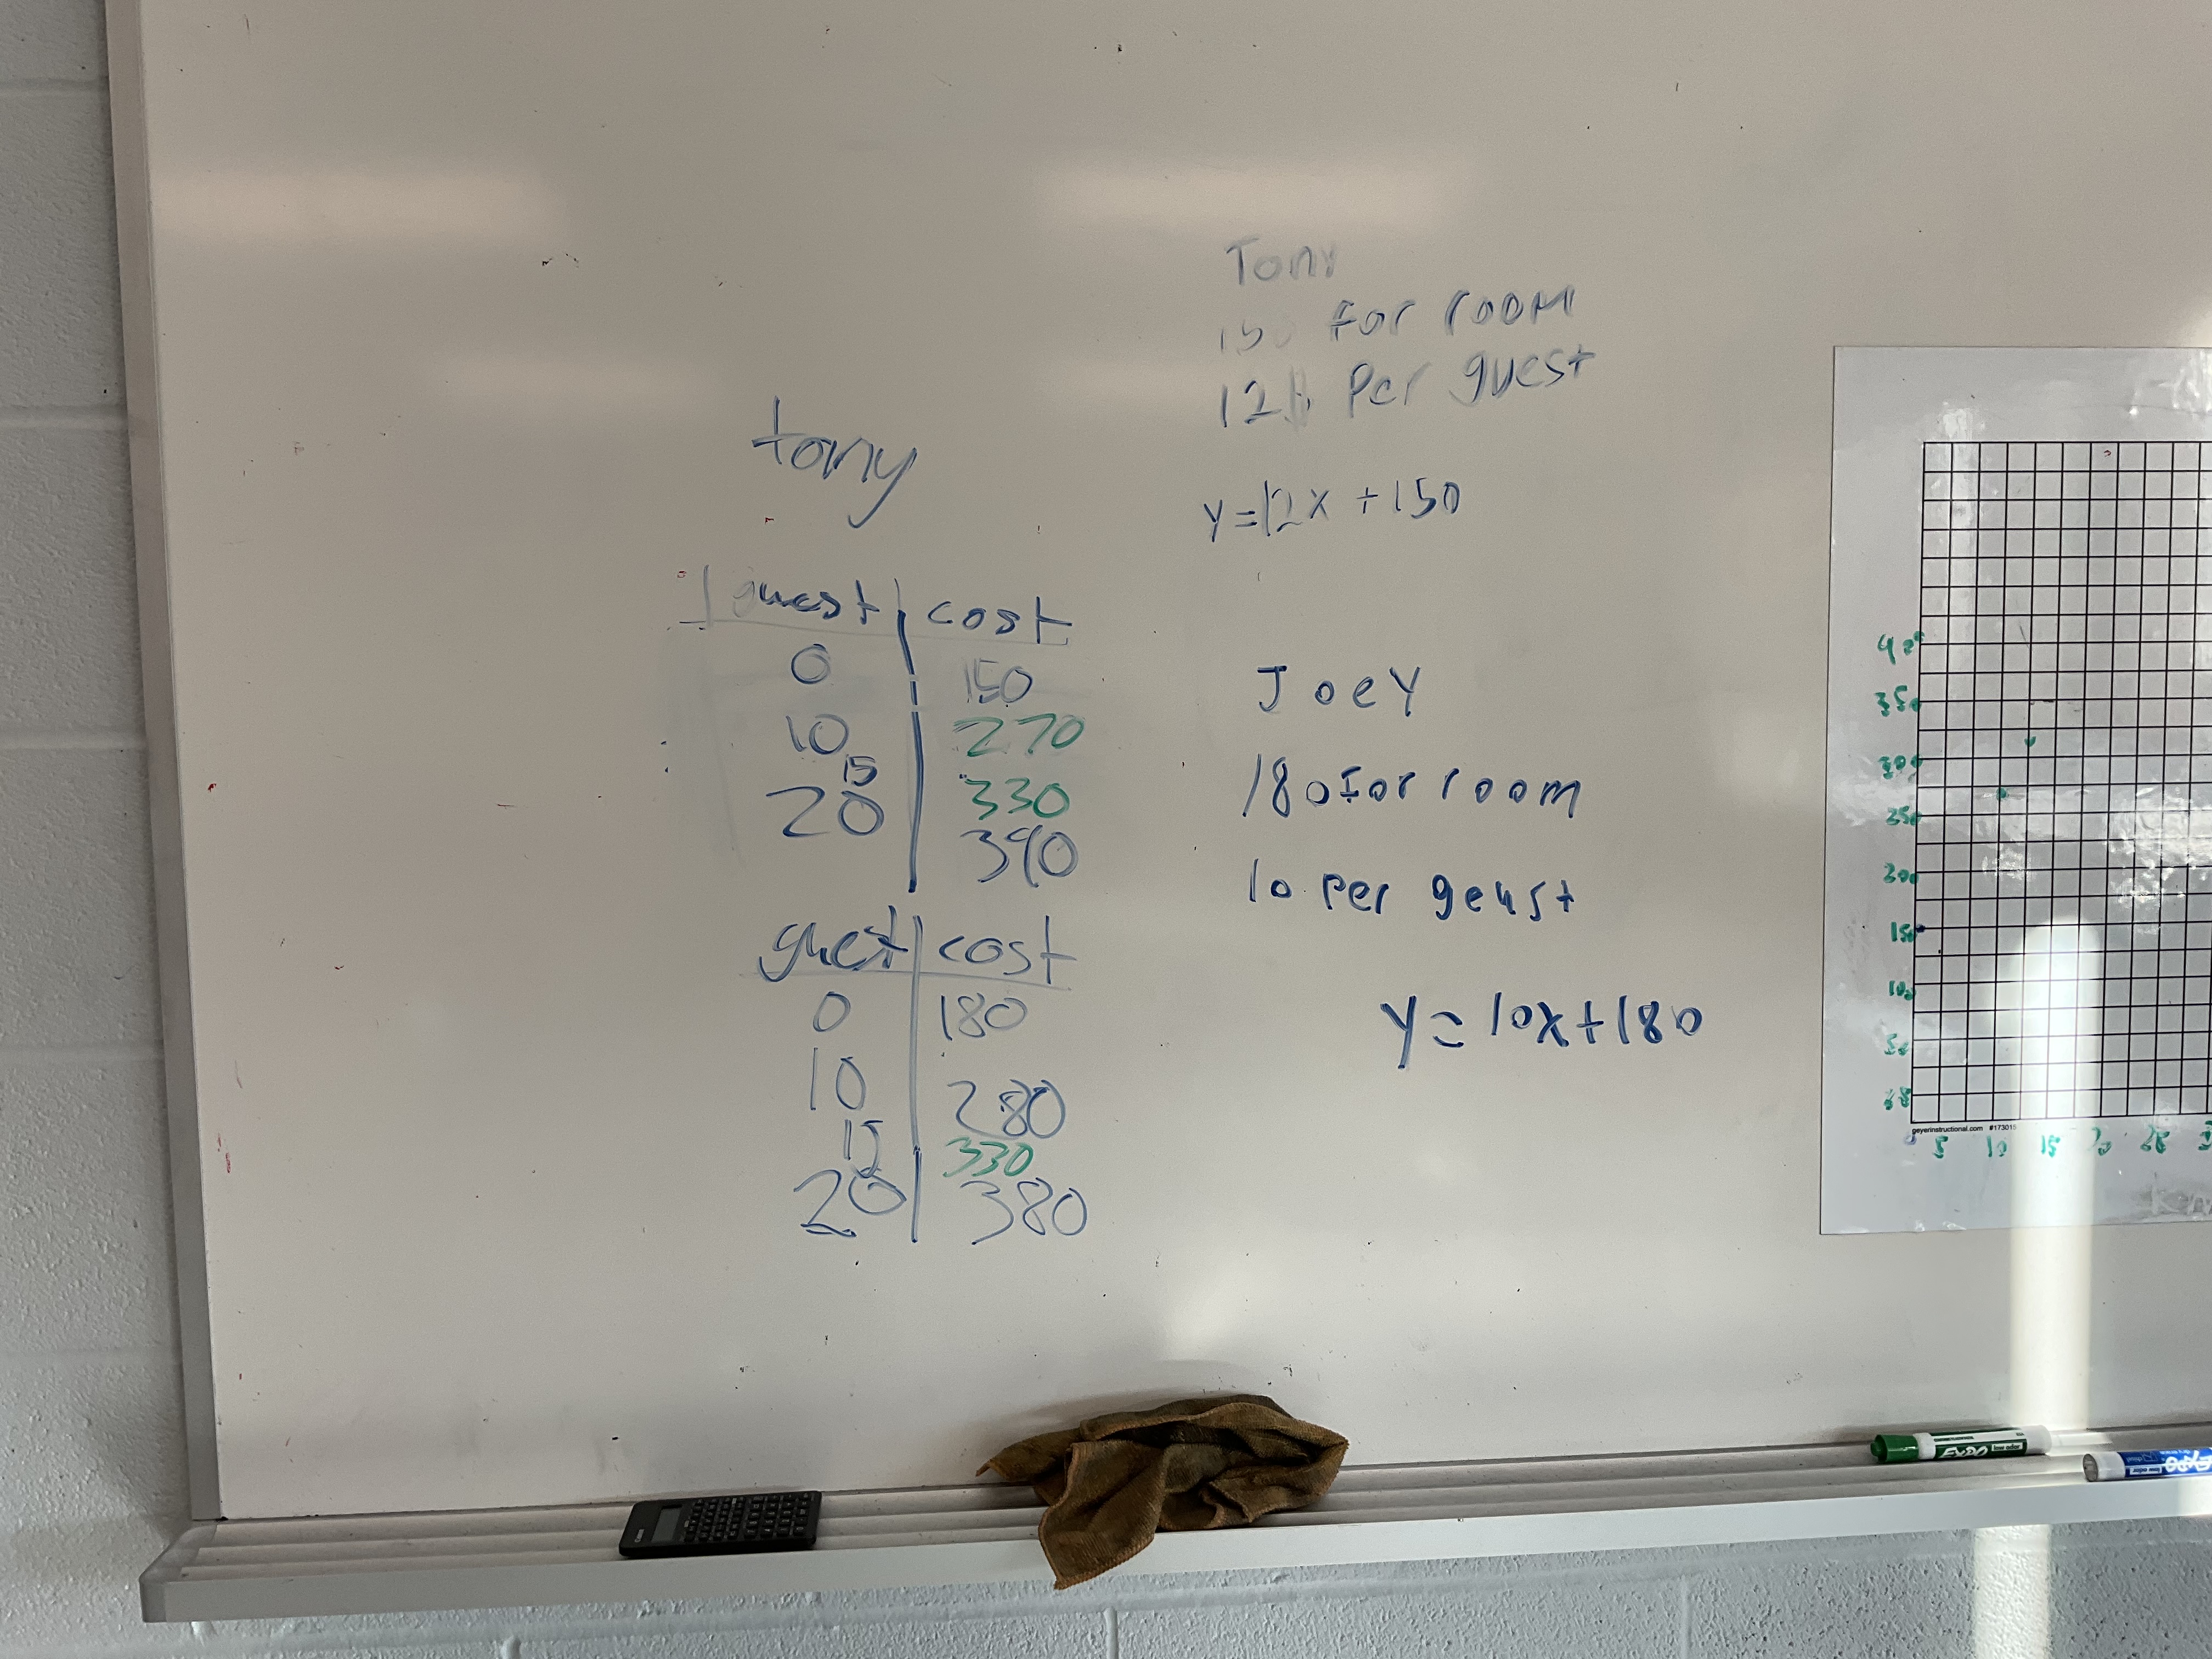
Groups that tried to graph directly from equations had a struggle with the scales, and plotting rise and run accurately. Lines started to look almost parallel, even though we know that the rates are not the same. The point of intersection would be way off the graph in this case.

Student are getting confident applying their skills to solve problems with linear equations, and to work together in groups and communicate their learning.
Building Pyramids and Confronting Misconceptions
We’ve had 2 inclement weather days to start the week. It threw off our schedule a bit, and caused us to do some tasks in a different way. This allows for some interesting observations.
First of all, each class can react very differently to a given task depending on many factors (personalities, willingness to take risks, time of day), so these observations may be based on many factors.
Usually I do a day 1 task of “build me a rectangular prism with a volume of 300 cubic centimetres”. This allows students to have an introduction to building things, working in groups on an open task, and reminds them of volume calculations from their prior learning.
Because of timing, students did some work on the inclement weather days on volume and surface area of prisms, and then today we started our building task.
After watching and participating in the demo with water
The challenge is then given to build a square based pyramid with a volume of 300 cubic centimetres. Groups flocked to whiteboards to plan, and it was interesting to see what aspects were challenges.

After some productive struggle the connection was made between the water demo and the task. The volume of a prism with same base and height would be 900 cubic centimetres. Many groups drew on the work on the whiteboards for inspiration, and there were lots of pyramids with sides of the base that were 6cm. They knew that (36)(25)=900, and they took the square root of the 36 to get the side lengths of the square. They then decided to take the square root of the 25 to get side lengths of the triangles, which was an interesting misconception that took off around the room.
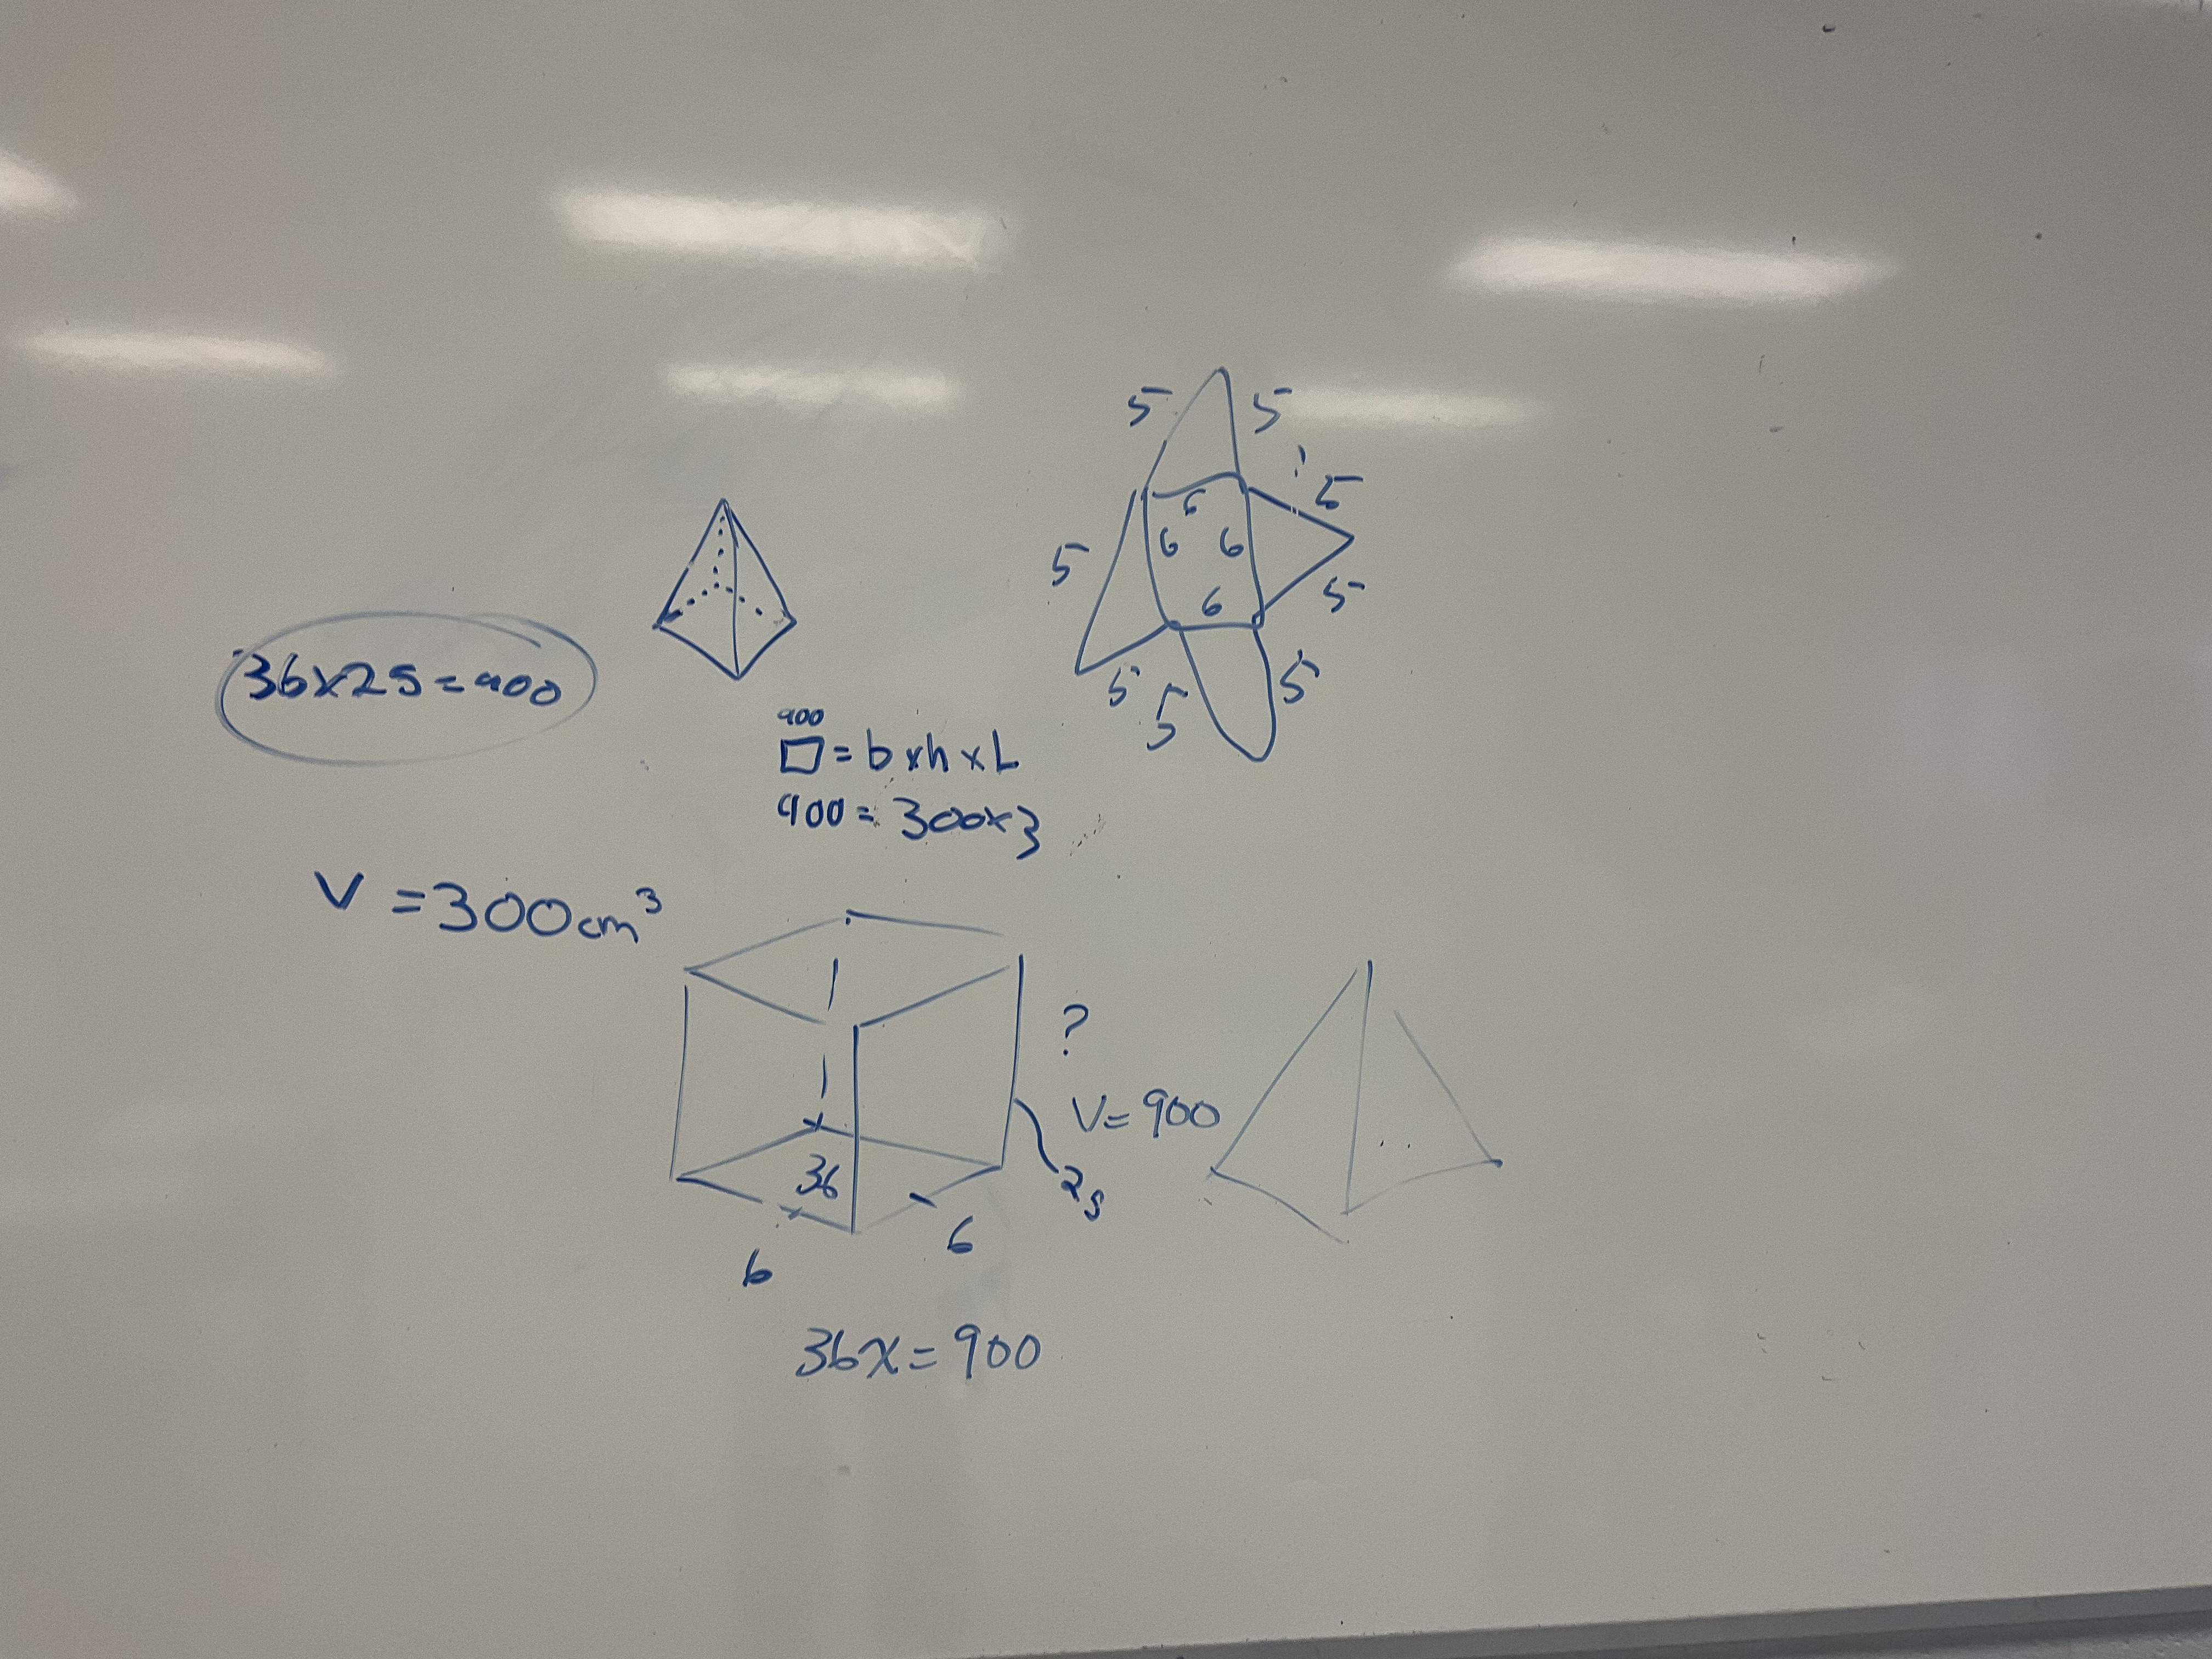
We had some groups make their pyramids and bring them to me for verification. They were adorable pyramids, but did not have the correct volume.

Groups were sent back to the drawing board to make the volume bigger, with sides of the base being 6cm and the height of the pyramid as 25cm.
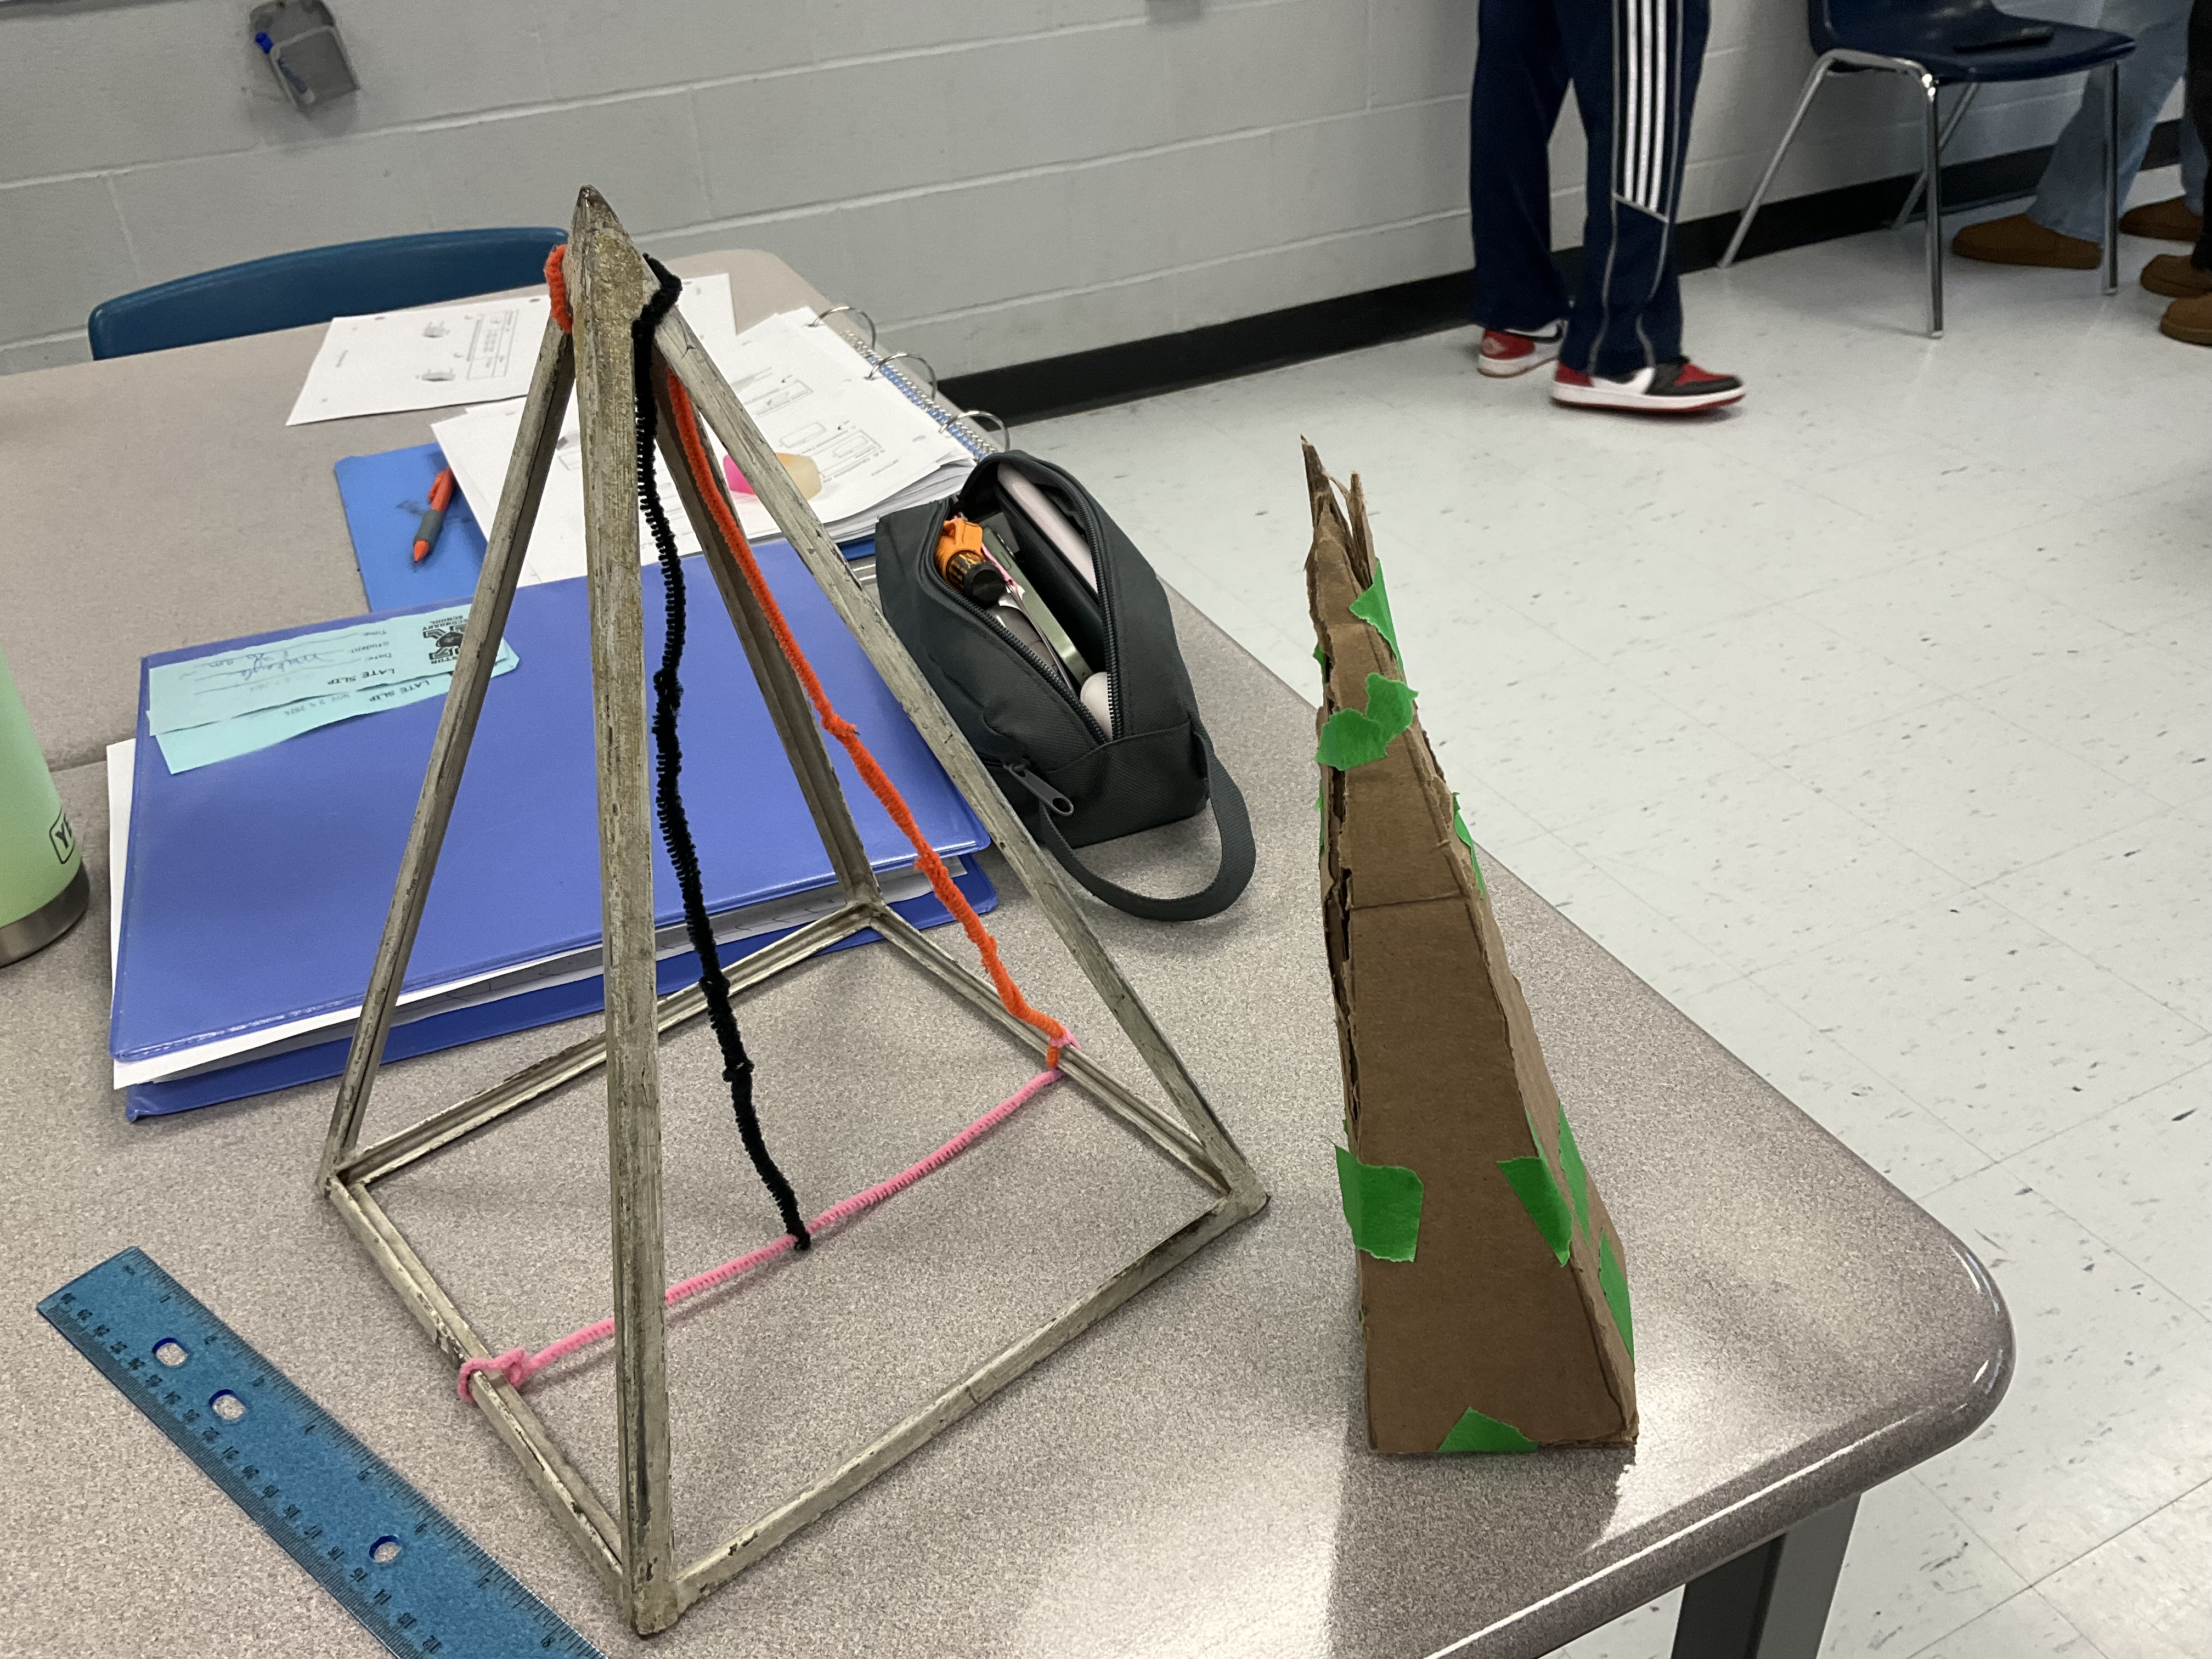
Eventually we had some that were closer. These were just a bit short though! The students measured the desired height of the pyramid as the height of each triangle, which causes the pyramid to be too short. This can be remedied by using the Pythagorean theorem to calculate the slant height of the pyramid, as shown with the pipe cleaners on the wireframe model.
Other groups had some unique ideas for dimensions: this one had a base of 9.65 cm by 9.65 cm and a height of 9.65cm. They needed a Pythagorean adjustment to make theirs work in the end. It was neat that they used the cube root of 900 to get their dimensions.

Here’s another that found a new misconception. They made the base of the pyramid 10cm by 10cm and then measured the side of the triangle as 9cm. It was much shorter than they had anticipated, and went back to the drawingboard to make it taller.
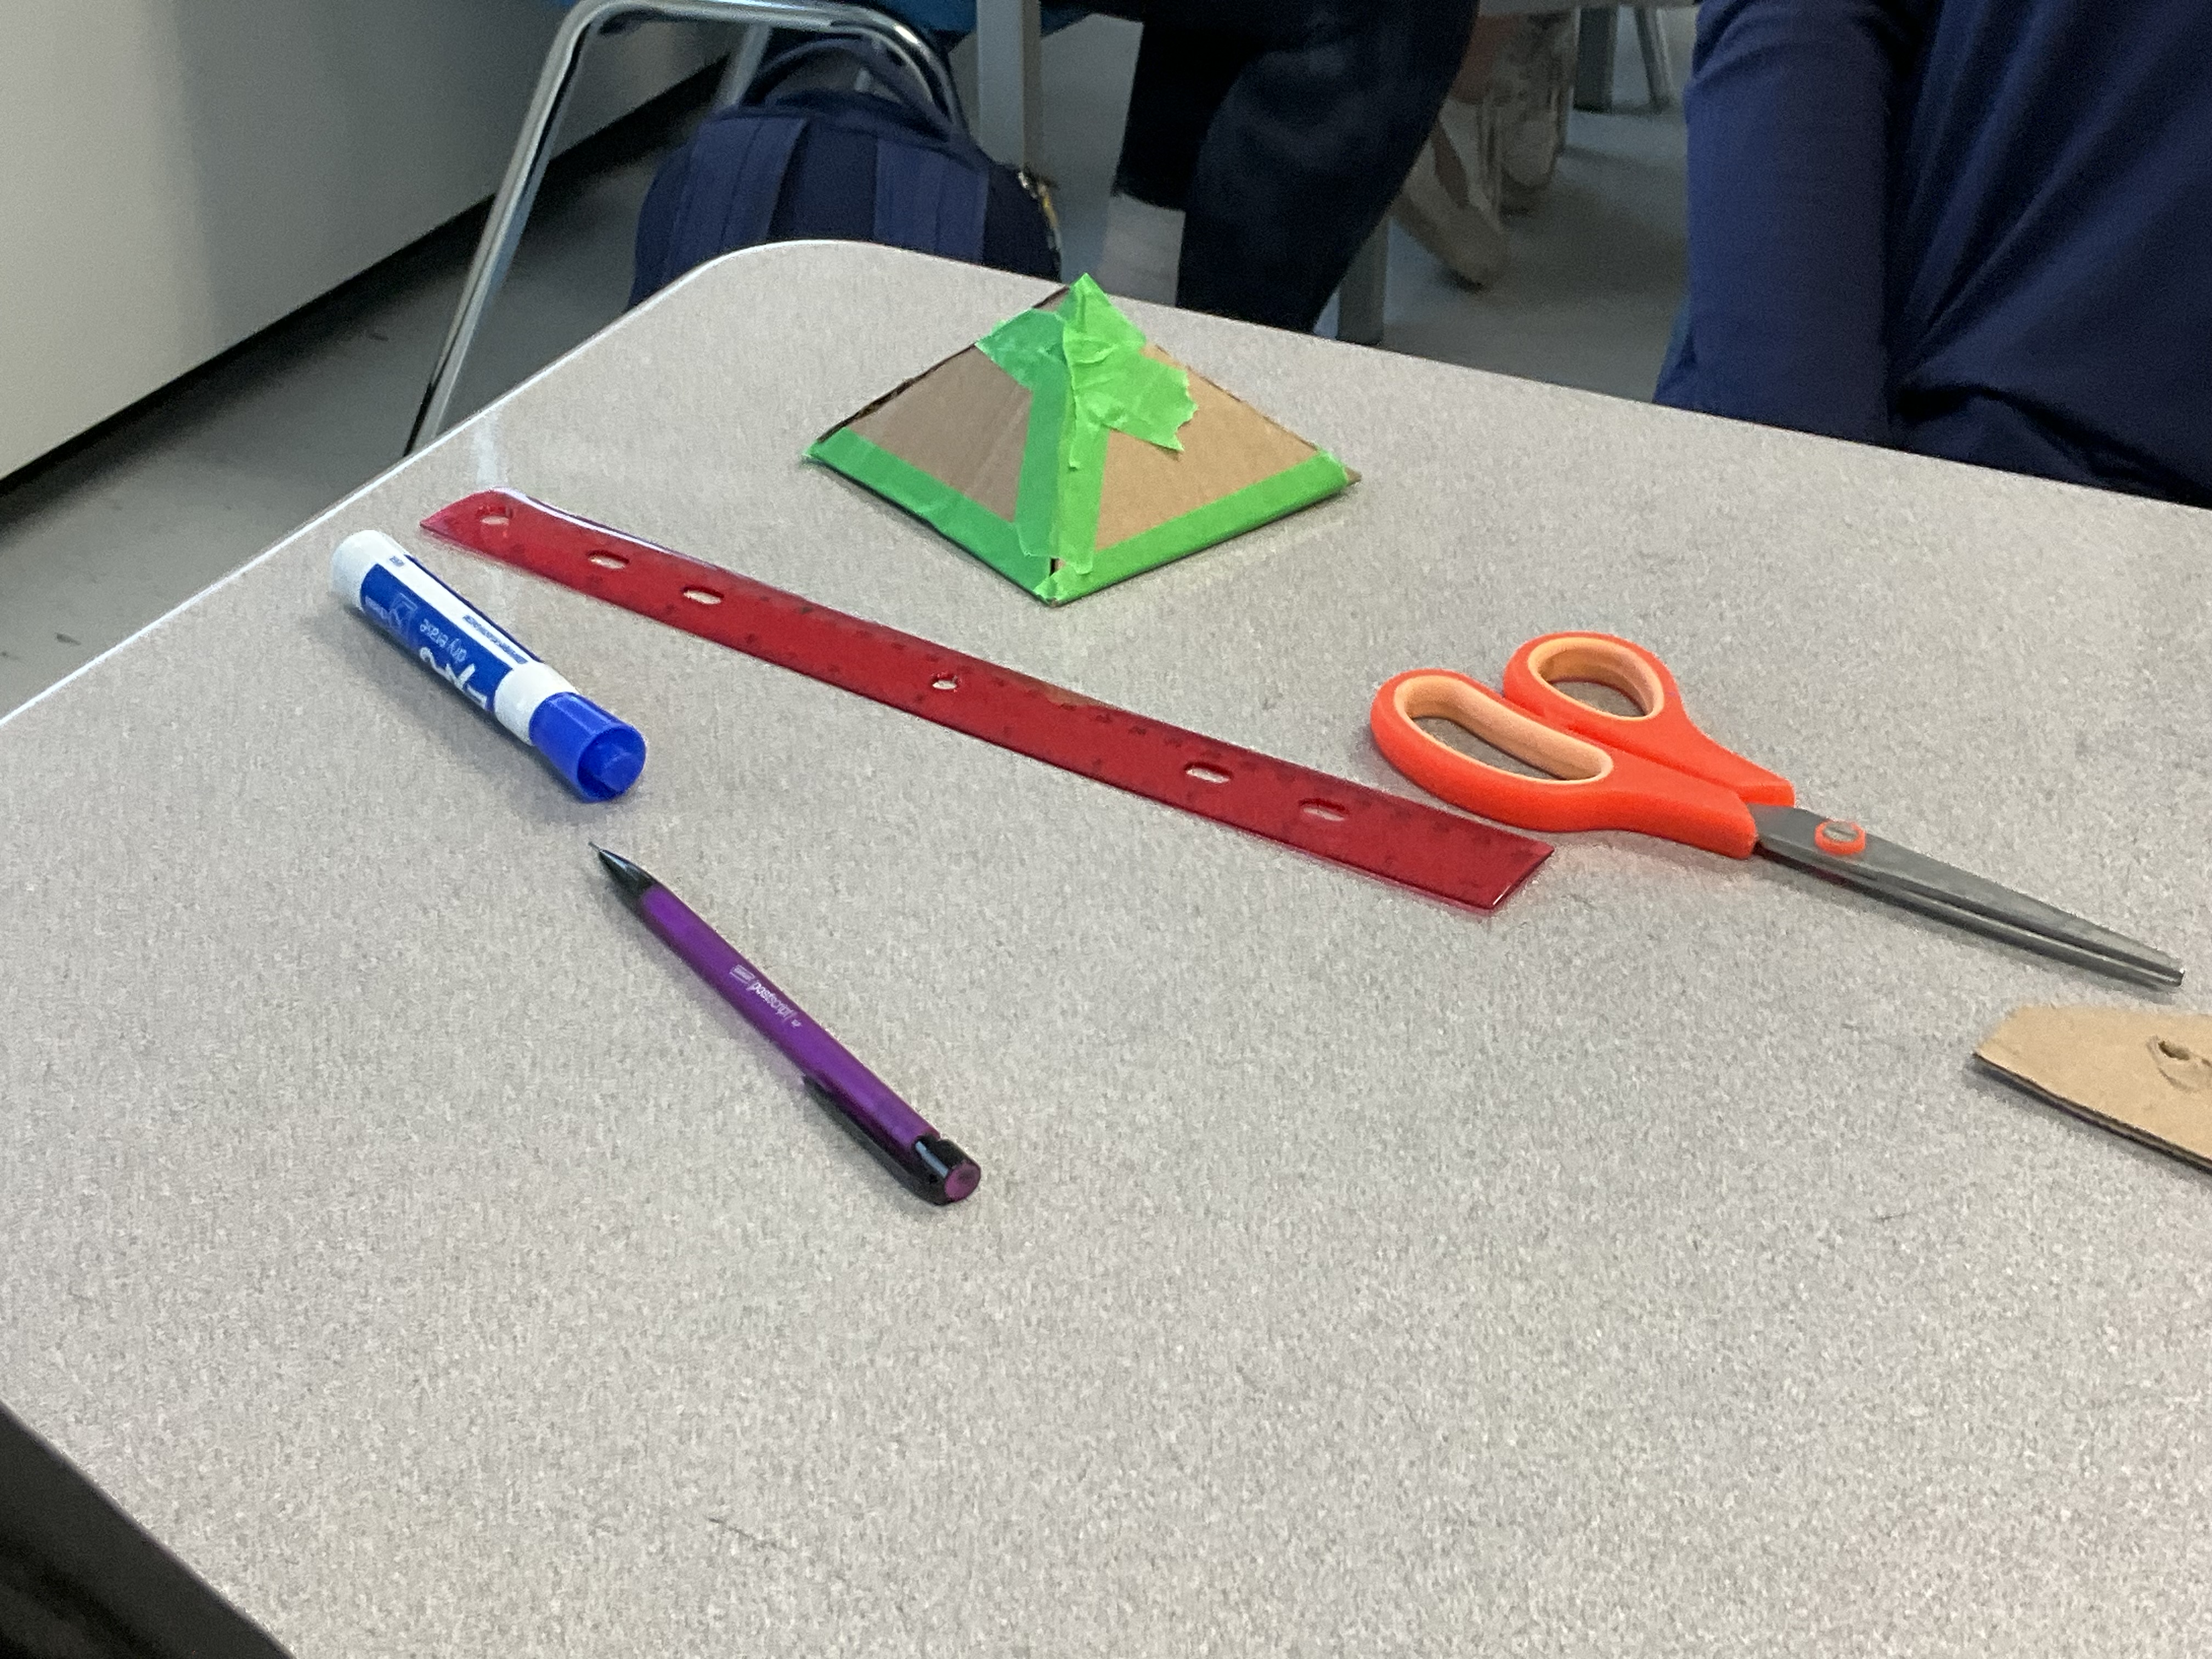
Some groups were able to confront their misconceptions and rebuild, and other groups had major issues with even starting the task once. There is something to be said about struggling through an iterative design process! This task has never taken this many turns before, and it makes me wonder whether it was the fact that they didn’t build prisms the day before, or whether it was first period back after a weekend prolonged by 2 snow days.
Courageously Solving Equations with Fractions
We summoned our courage on a Friday afternoon and worked on solving equations with fractions in MTH1W.

We worked up from solving equations without fractions, to equations like x/2=4, where we understand that the fraction just means x is divided by 2 and the answer is 4. We can undo that division by 2 by doubling each side.
Next we looked at solving equations with binomial numerators like (x-3)/2=4, and we used the same strategy of doubling each side as a first step to solve.
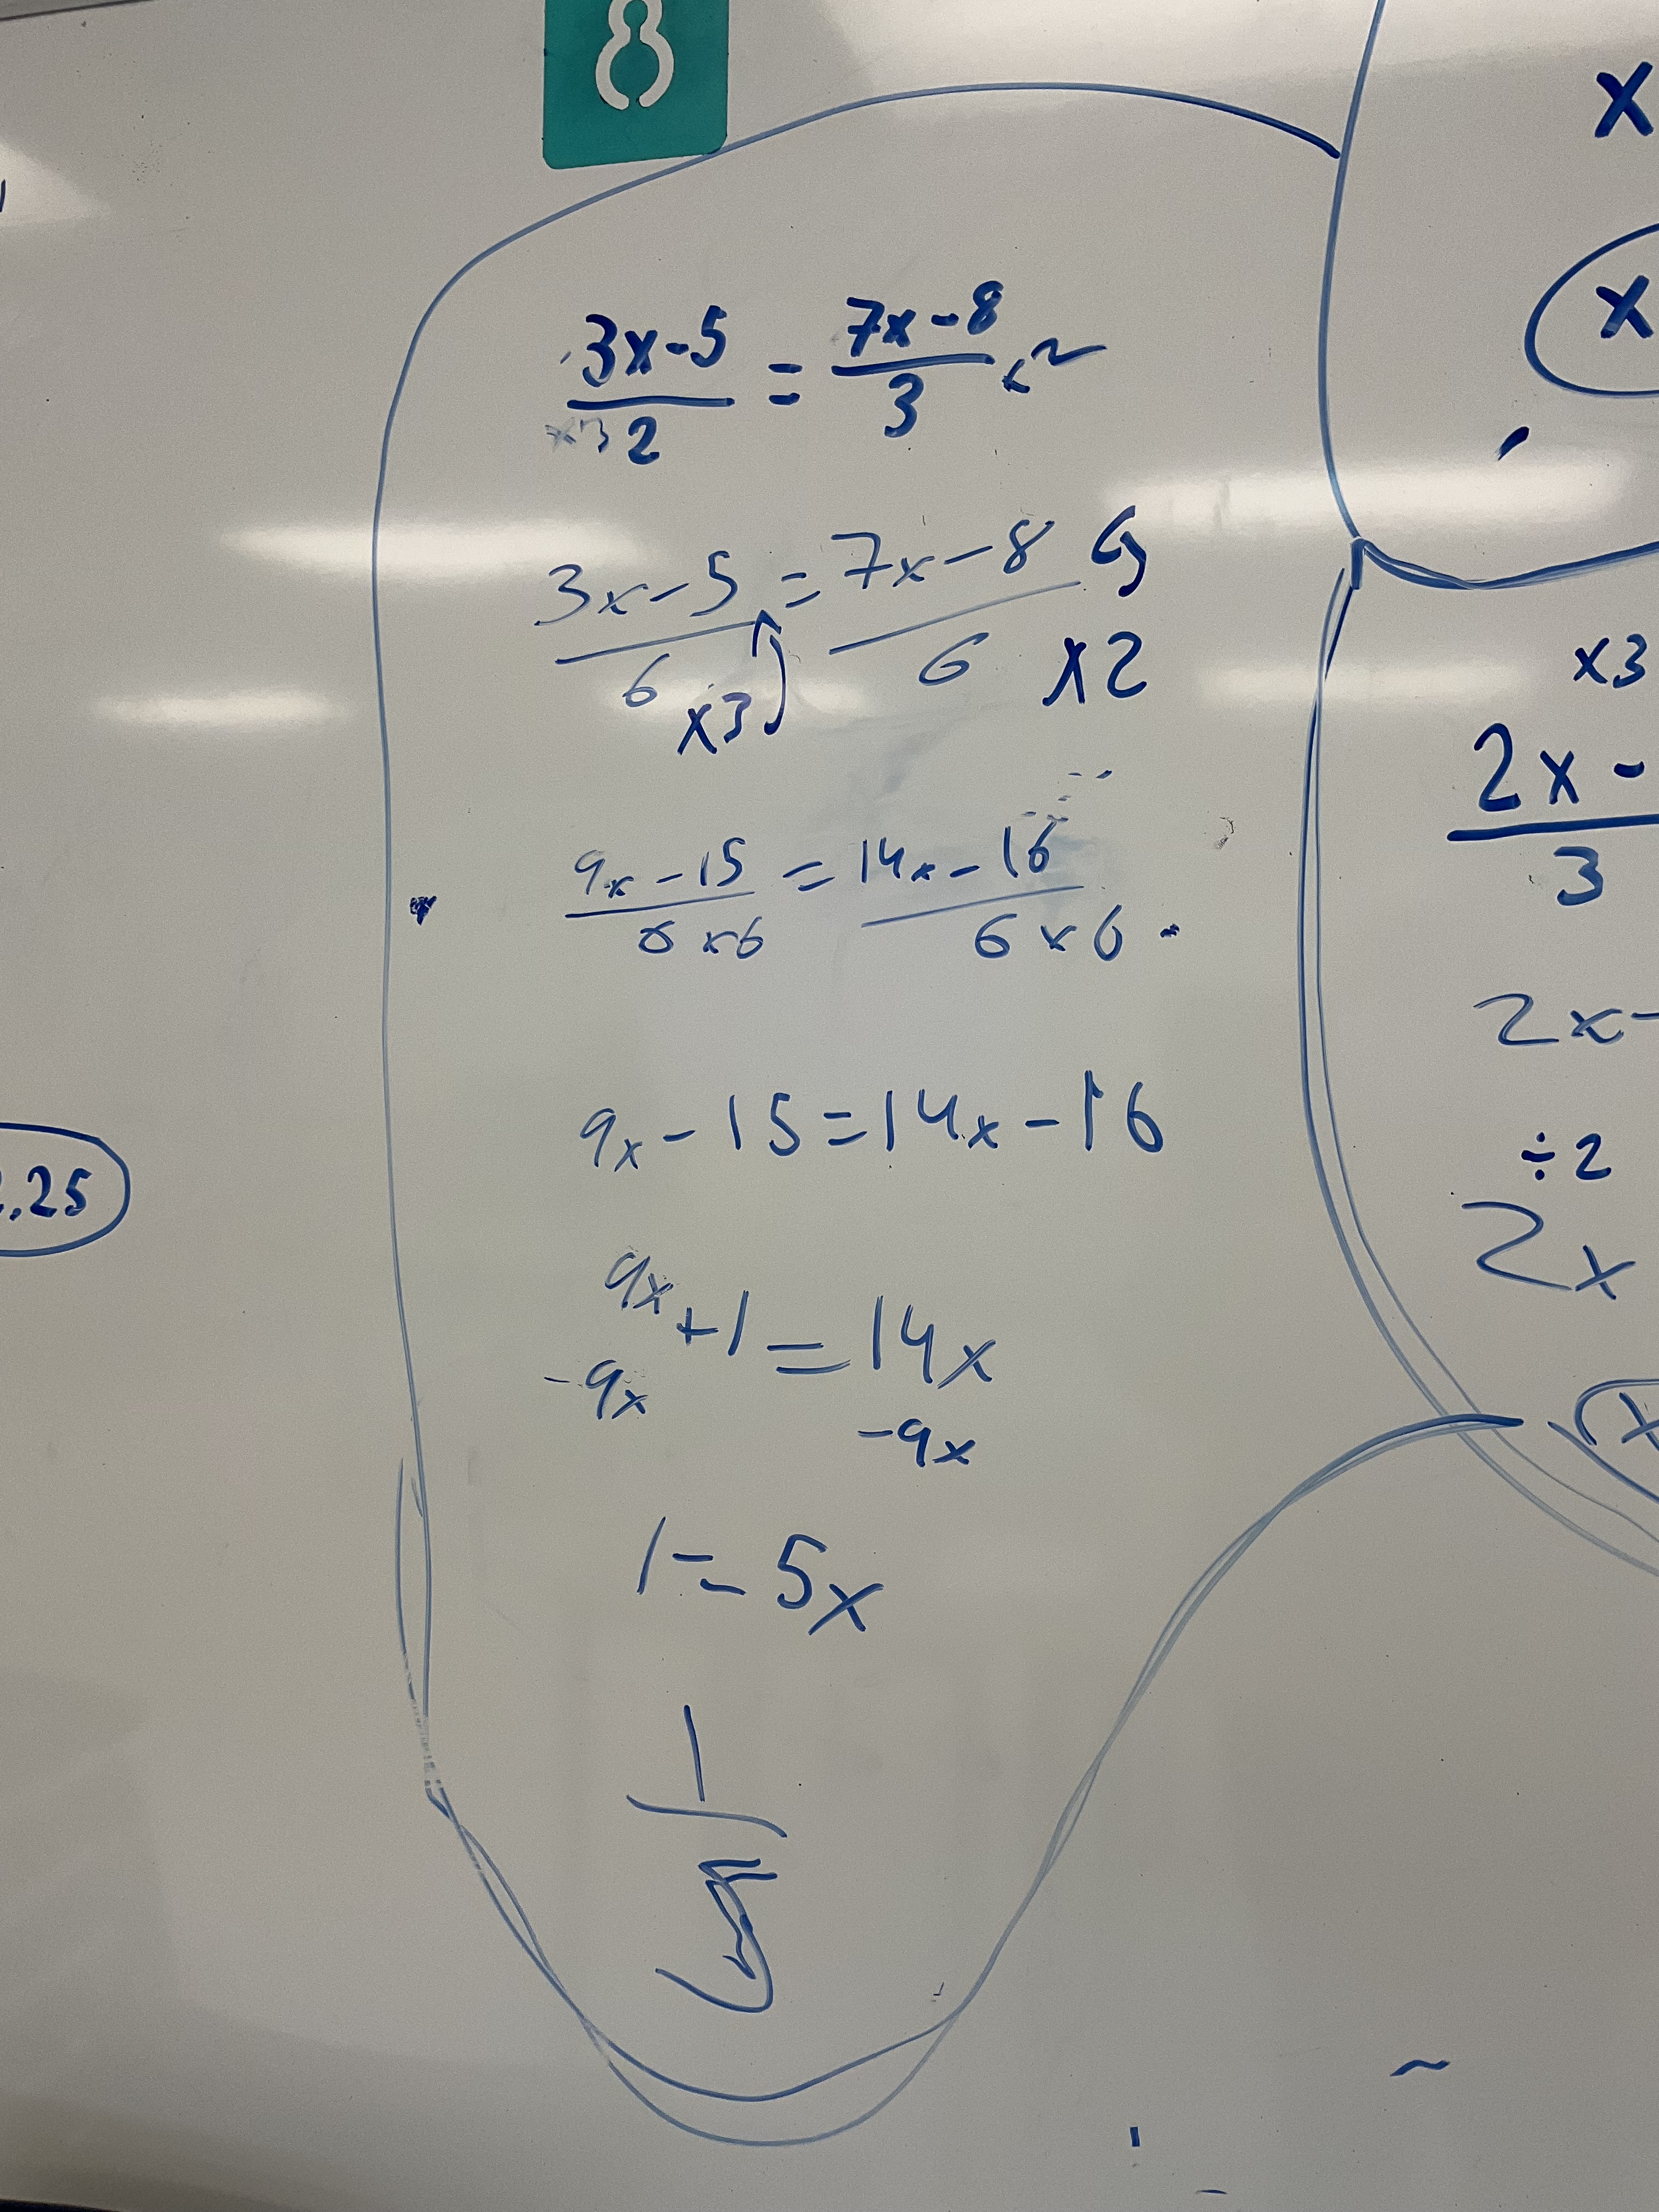
We then looked at solving equations with variables on both sides like (x+5)/4=3x
Next we looked at questions with fractions on both sides, and variables on both sides. We now needed a new strategy of “make a common denominator” and then we can multiply both sides by that denominator to get rid of it.
We need to work a bit on our notation, but we’re working through the process of solving in a way that makes sense.

We even figured out how to solve when some terms are in fractions and some are not. We turned the 7x term into a fraction by writing a denominator of 1 before progressing.
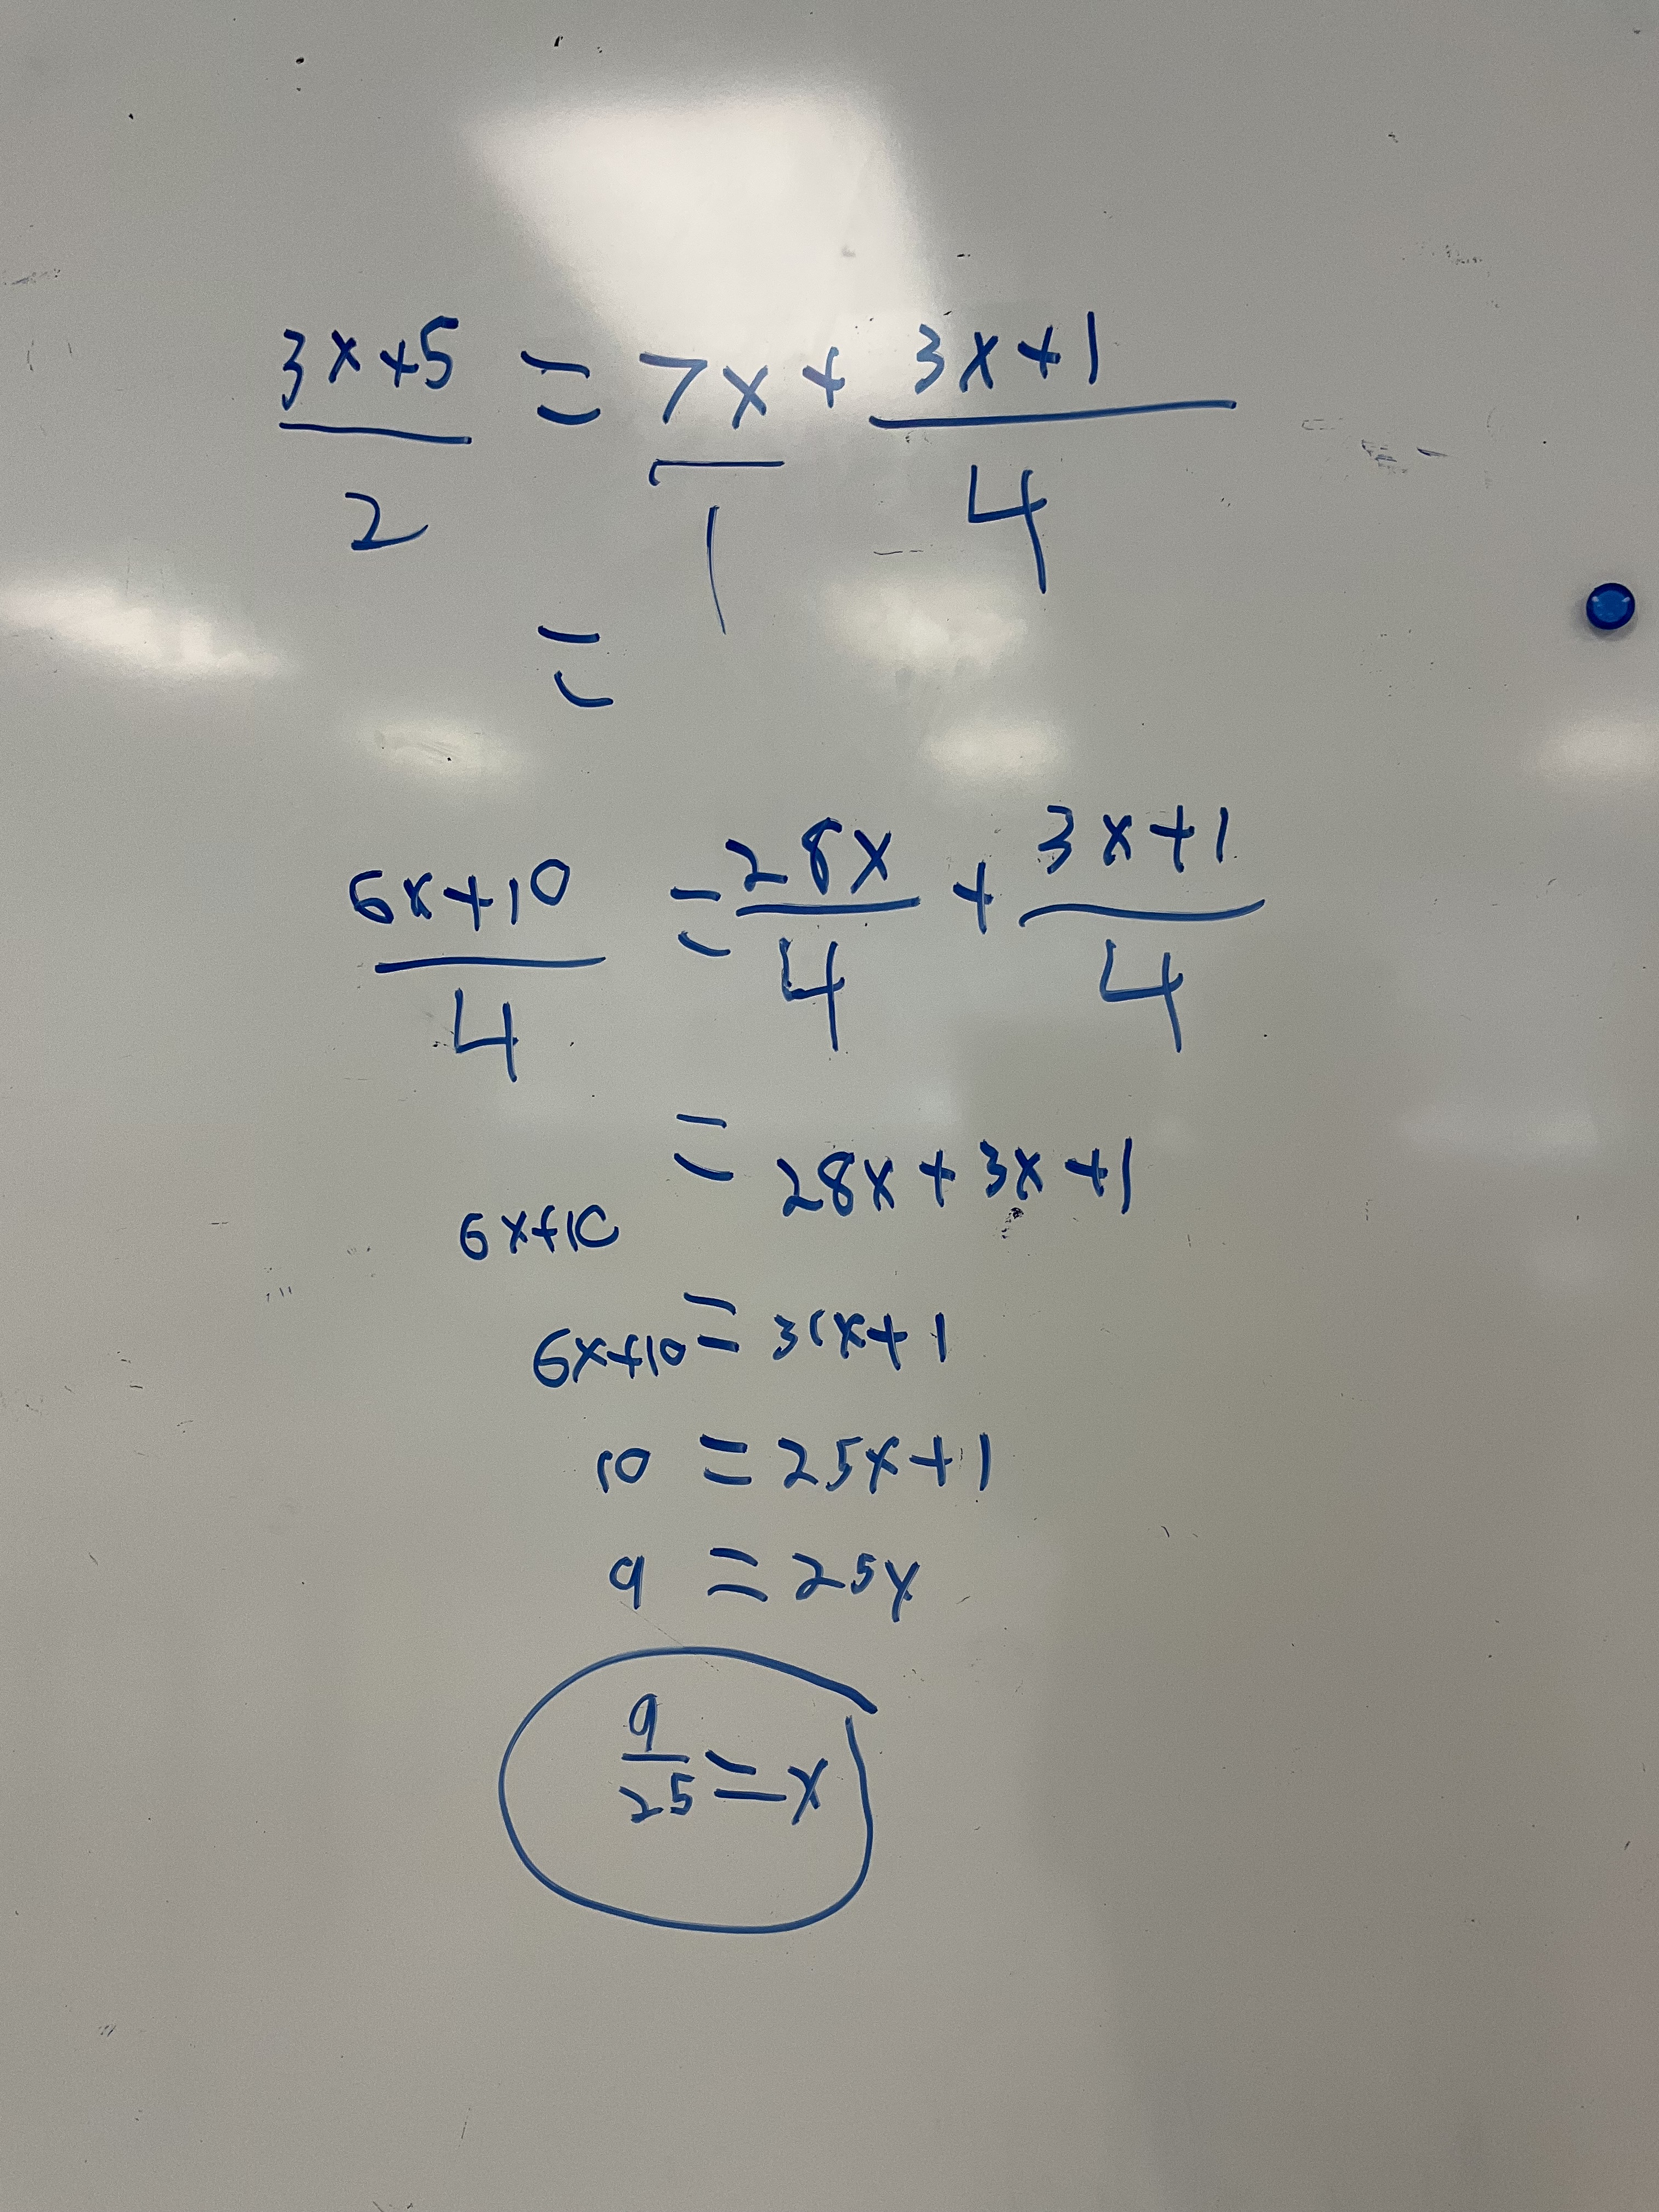
It ended up being a very productive class where we bravely solved some pretty complicated equations. I hope we did enough practice to retain the skills until next week.
Introducing Trig Ratios
Today I had the chance to co-teach a lesson introducing trigonometry with a 2P math class. The students started out up at the boards learning how to label right angle triangle sides and angles with lowercase and uppercase letters, and the words hypotenuse, opposite and adjacent sides.
Next they worked through some examples of calculating sides with the pythagorean theorem.

The next challenge was on graph paper: they needed to draw a 90 degree angle on their page. Then draw a right triangle with one angle that is 30 degrees. We estimated the other acute angle, then measured it to be sure. Just to prove to them that angles in a triangle add to 180 we did this demonstration (but I forgot to get pictures).

photo source
Next we used rulers and measured the side lengths of the triangle, as precisely as possible.
We put the values in a table to compare. And I magically was able to judge the accuracy of their triangle skills and accuracy of measuring.
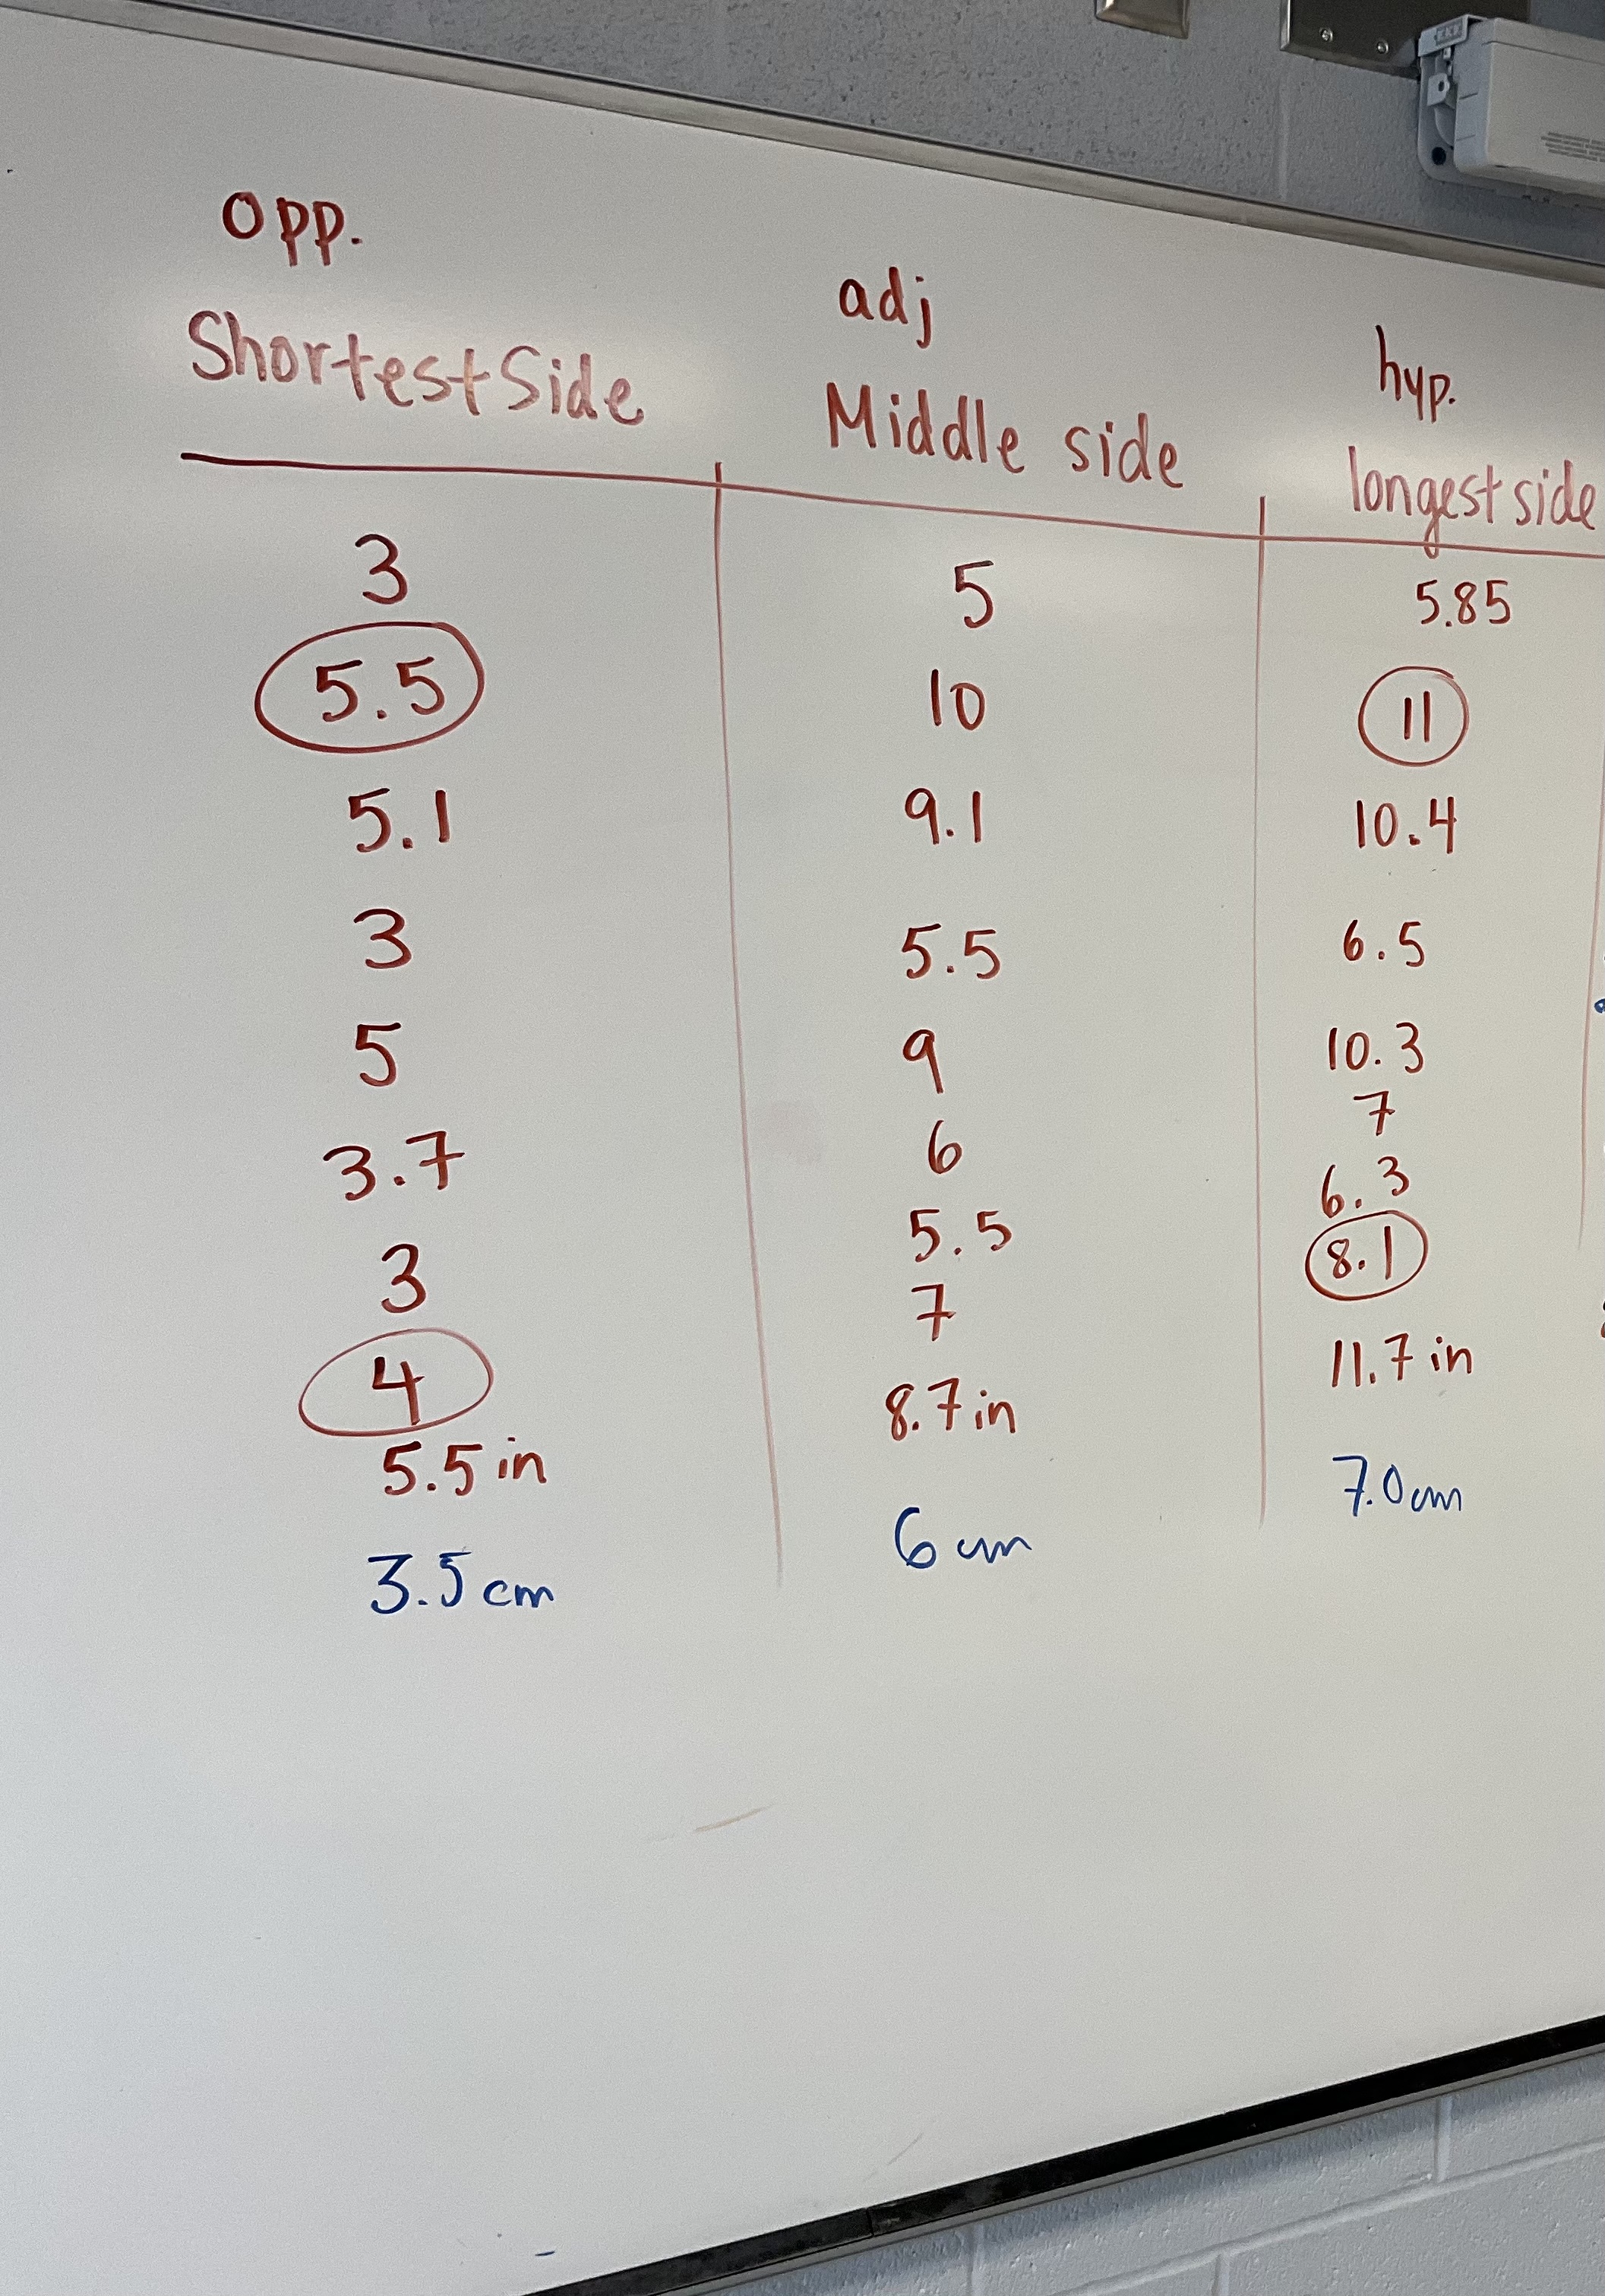
We talked through what was special about the ones that were done “perfectly”. Students identified that the short side was half of the long side for those cases.
From there we explored the primary trig ratios and how to remember them with the acronym SOH CAH TOA.

