Quadratic Formula
In grade 10 we’ve been working on parabolas all year. In our first lap we did factoring and expanding with algebra tiles. In Lap 2 we did all things factored. Now that we’re in lap 3 we did vertex form, and also derived the quadratic formula.

we sing the quadratic formula to the tune of pop goes the weasel. Here’s a youtube video
We’re connecting back to all we know about quadratics, and finding the axis of symmetry, the vertex, and the y intercept as well.
Students are enjoying working together at the walls “thinking classroom” style. It gets us up and moving, and collaborating. At this time of year it’s nice to see that there are so many people in the room who are getting confident and able to help others out. We’ve come a long way since February!
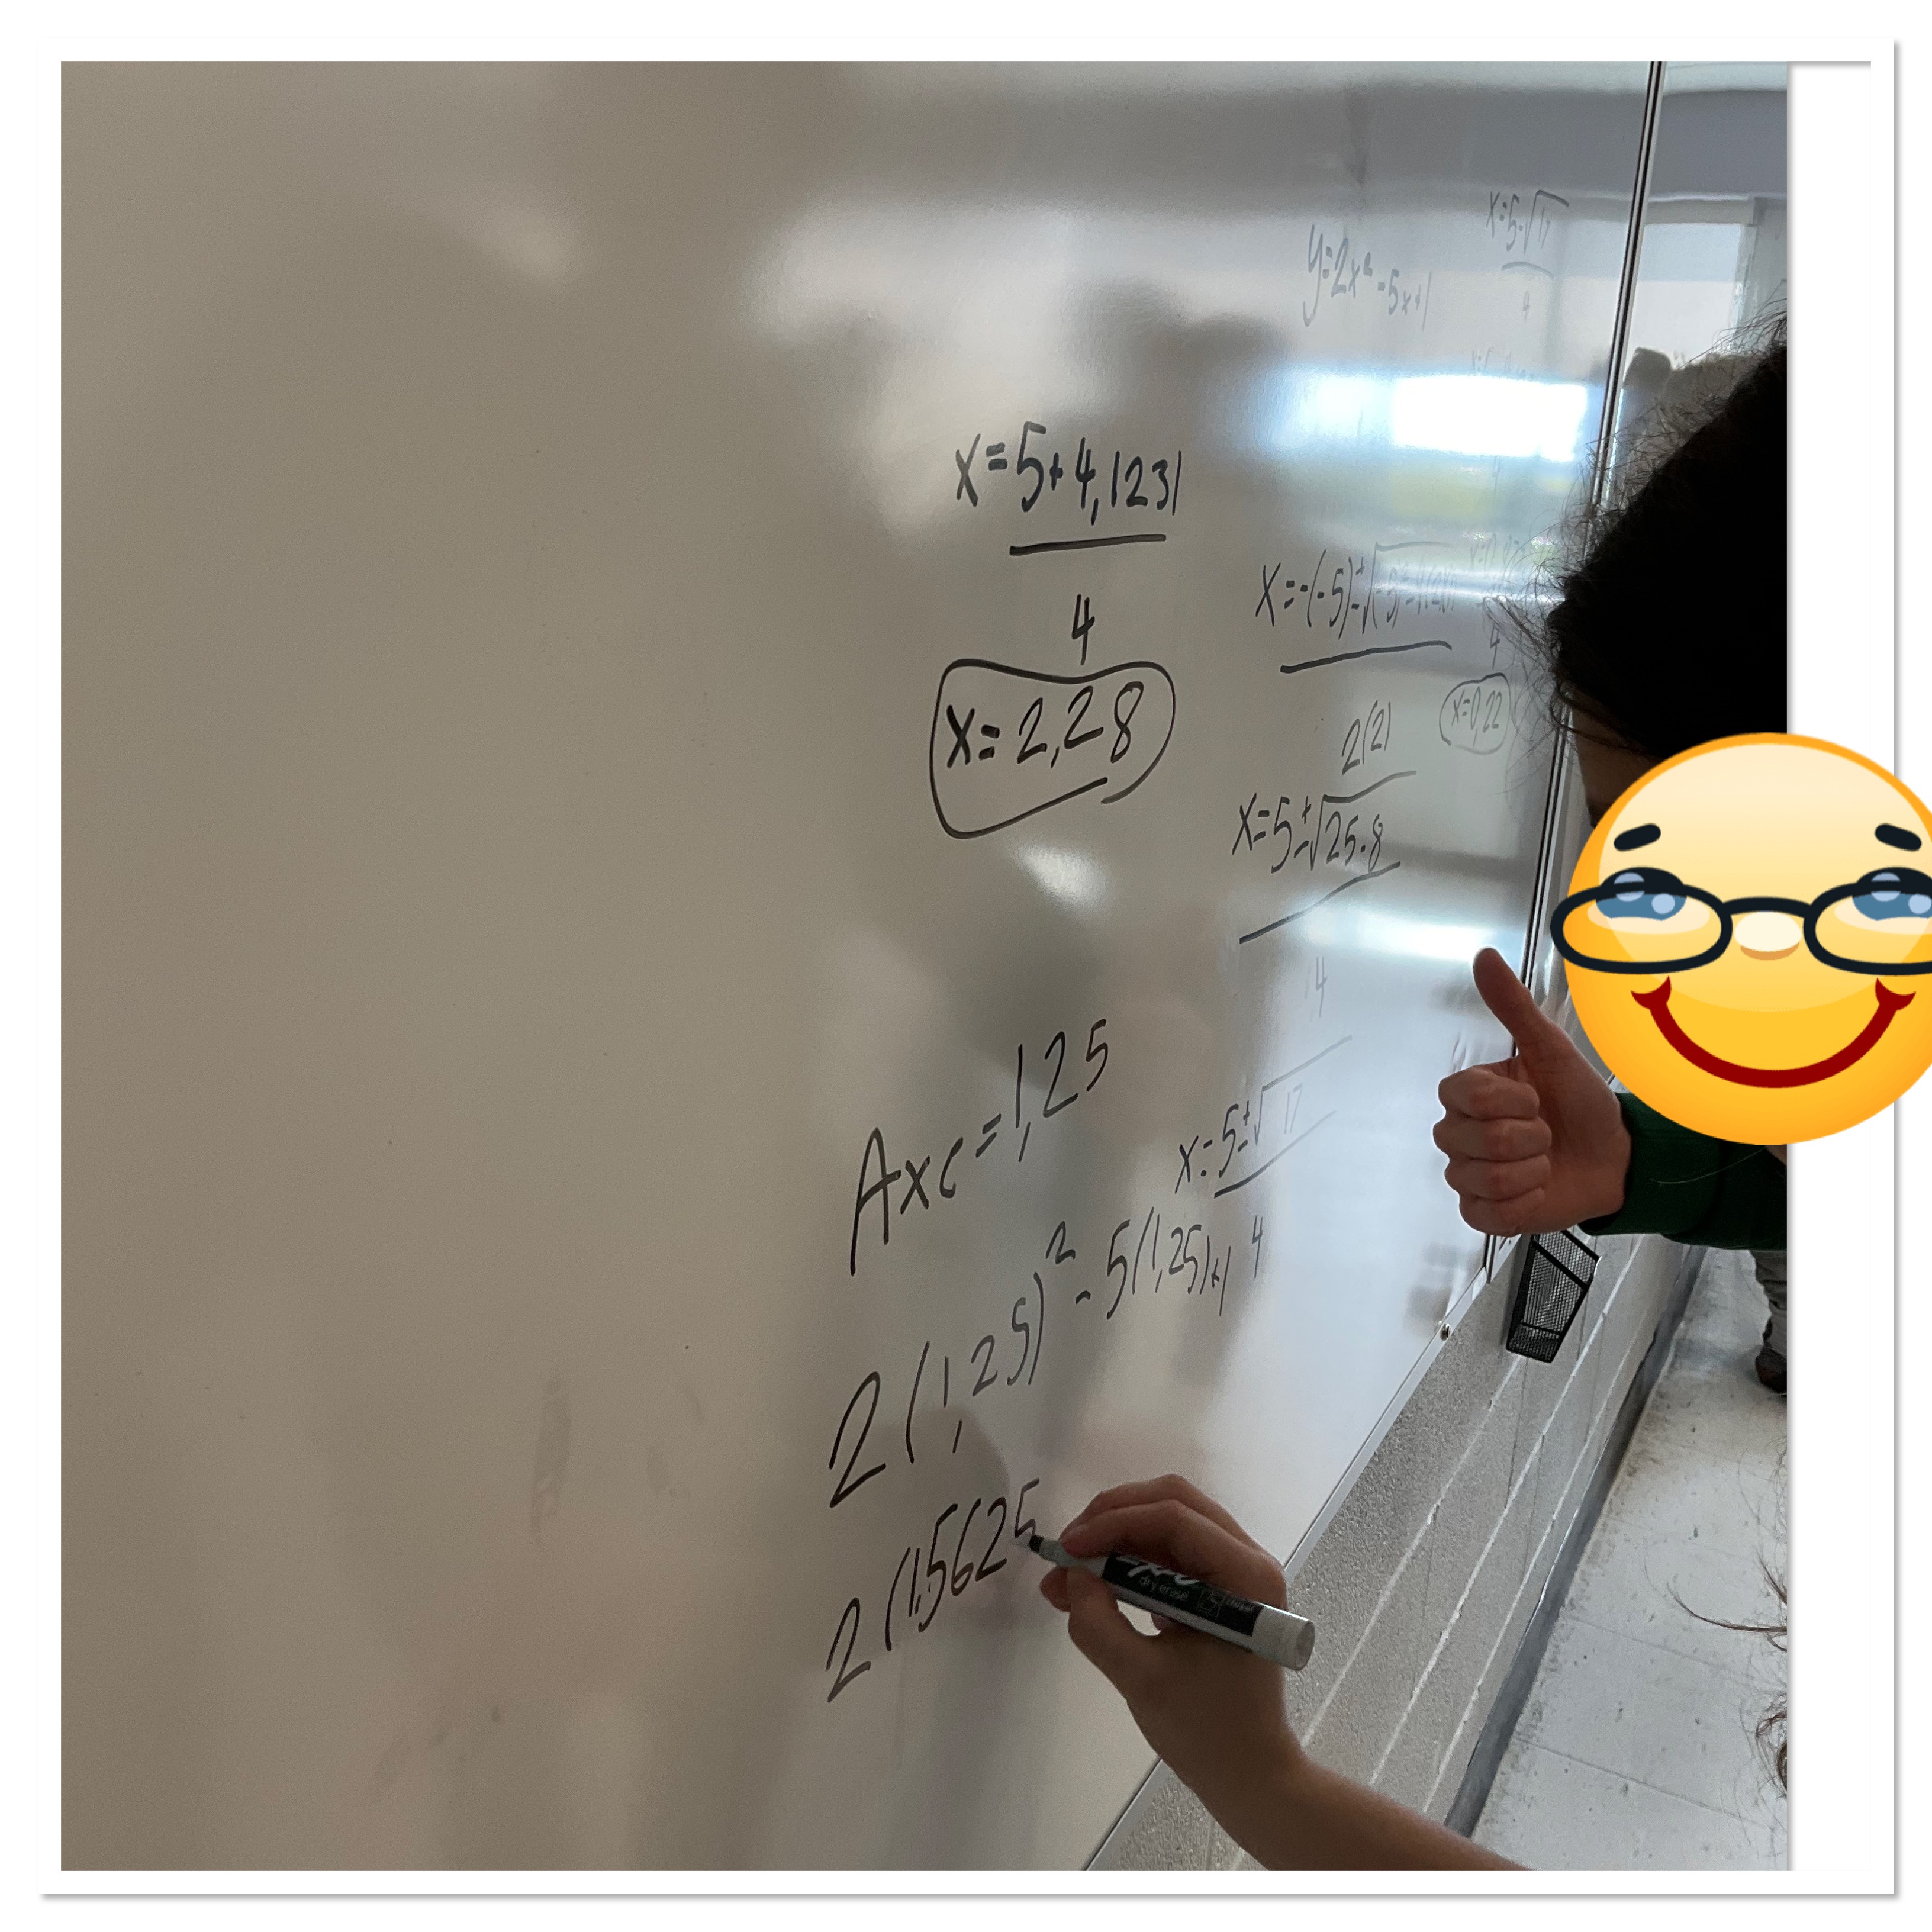
Pretty soon we’ll be solving word problems!
OAME 2025
What a fun time we’ve had at OAME! Many thanks to the wonderful presenters for sharing their skills, and for inspiring us to think about things in new ways. I’ve got more good problems to try with my classes now, and some new ideas for running lessons.
I was part of a presenter team this year. Our session was titled Fostering Confident Math Learners: Cultivating a Growth Mindset through Engaging Activities. Here are our slides
Our time-slot was the last session on Friday afternoon, so we were excited to get hands on with some manipulatives and try to represent some math.
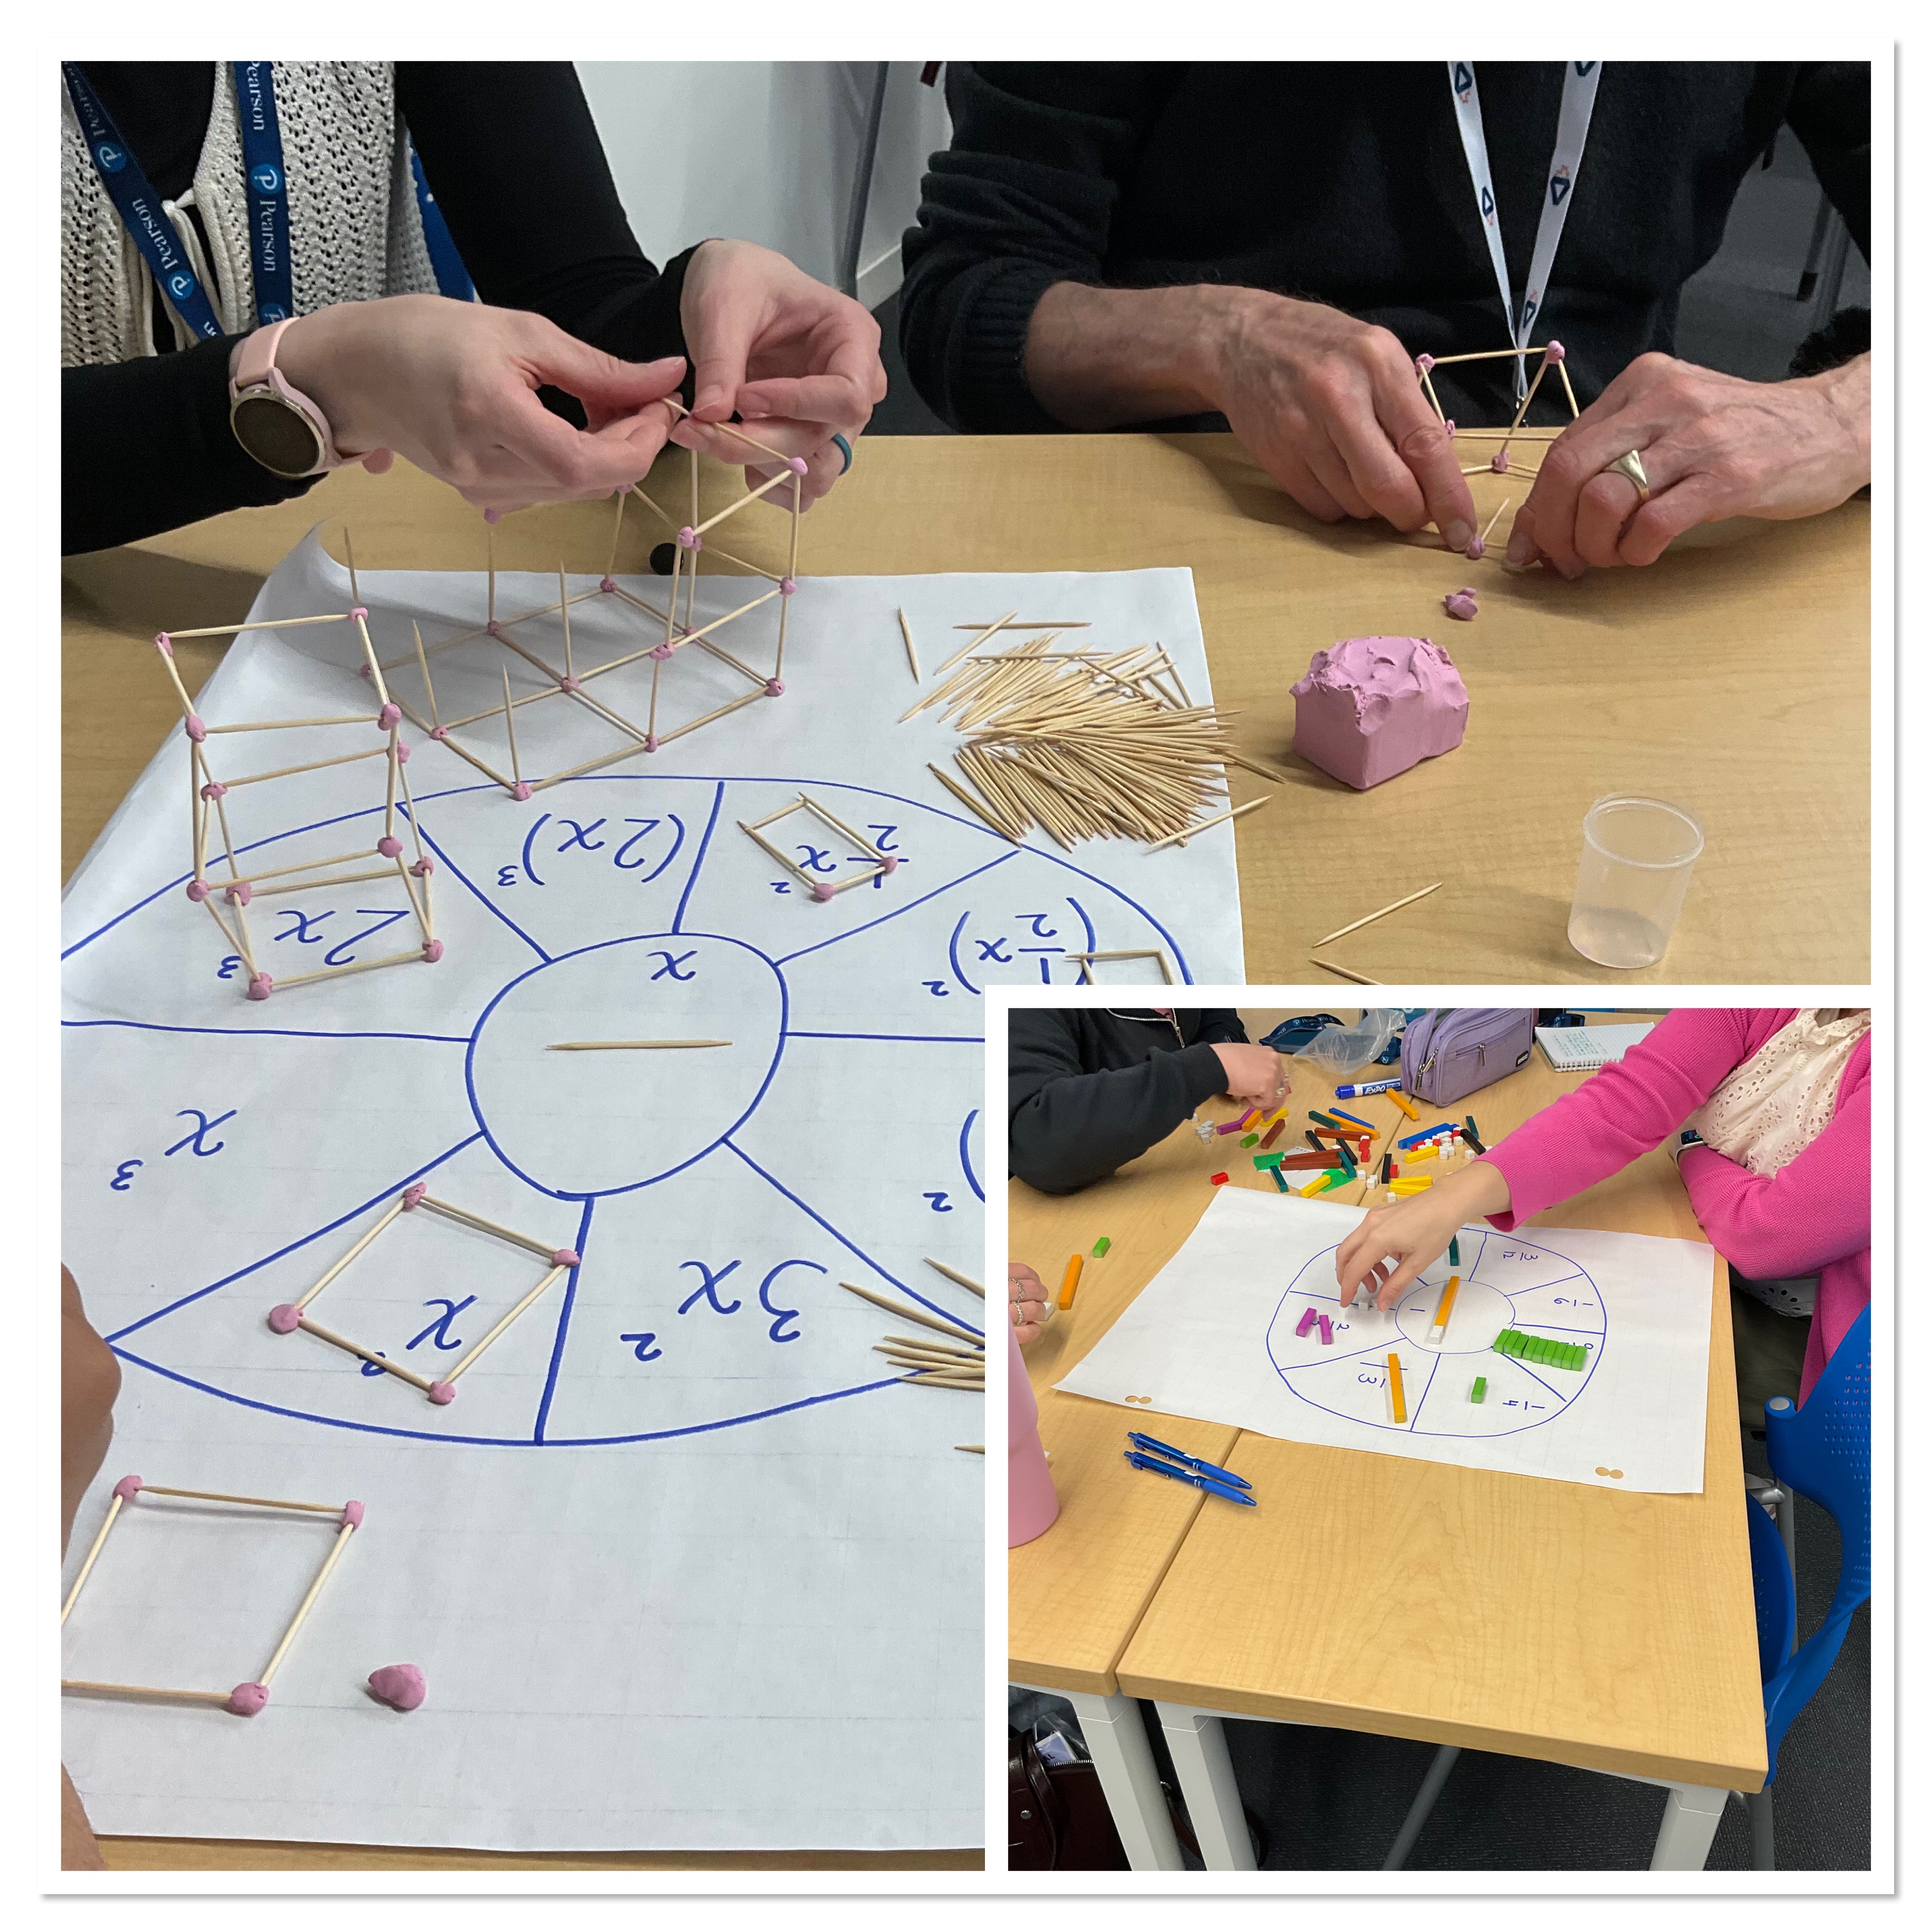
We had 2 different concept circle stations happening, one with relational rods and one with toothpicks and plasticine building models of exponents.

There were lots of great conversations among the groups about what the exponents of 2 and 3 mean physically, and what the brackets mean, in relation to changing the side length of the object, and how that can change the surface area or volume.
We then had the great cheerio stacking competition, where groups aimed to see who was the fastest cheerio stacker, and then we looked at connections to rates and slopes, and units of measuring speed. We determined who was the fastest stacker in the room and then, if time allowed, we would have created a photo finish by having everyone determine the headstart (in number of cheerios) that they’d need to have a full skewer at the same time as the fastest person.

this activity is good for grade 9 and 10, looking at rates, graphing, points of intersection and determining the b value (y intercept).
It was fun to share some of our ideas with the participants, and hear their ideas of what we could try next.
Many thanks to all who came to our presentation!
Painted Cube (again!)
Today another group of grade 10s worked on the painted cube rich task (blogged earlier).
As always when doing this problem, something new shows up as students interpret it differently, or work to make connections to math that they know.

This group decided to represent the blocks as a fraction of the whole. This makes me see all kinds of connections to fractions and percents, or patterning about what happens to these fractions or percents as the cube’s side length increases.
Something I’d be curious to explore with a class is modelling the patterns you’d see in the fractions. This would be an interesting task for grade 11s and 12s I think, as an inquiry into the rational functions. There could be discussion about vertical asymptotes and end behaviours.
These functions could be graphed, and then the intersections between them could be calculated too.
We didn’t go down that road with these grade 10s because they were struggling a bit with the initial task and building general equations for a cube with side length x, and were not ready to push into new territory.
It’s so refreshing to see new ideas and approaches pop up with each new iteration of the task.
Good teamwork today!
Painted Cube Revisited
I was invited to run through the painted cube problem for another class of grade 10s. With each iteration of these rich tasks it’s neat ro see the different connections that can be made.
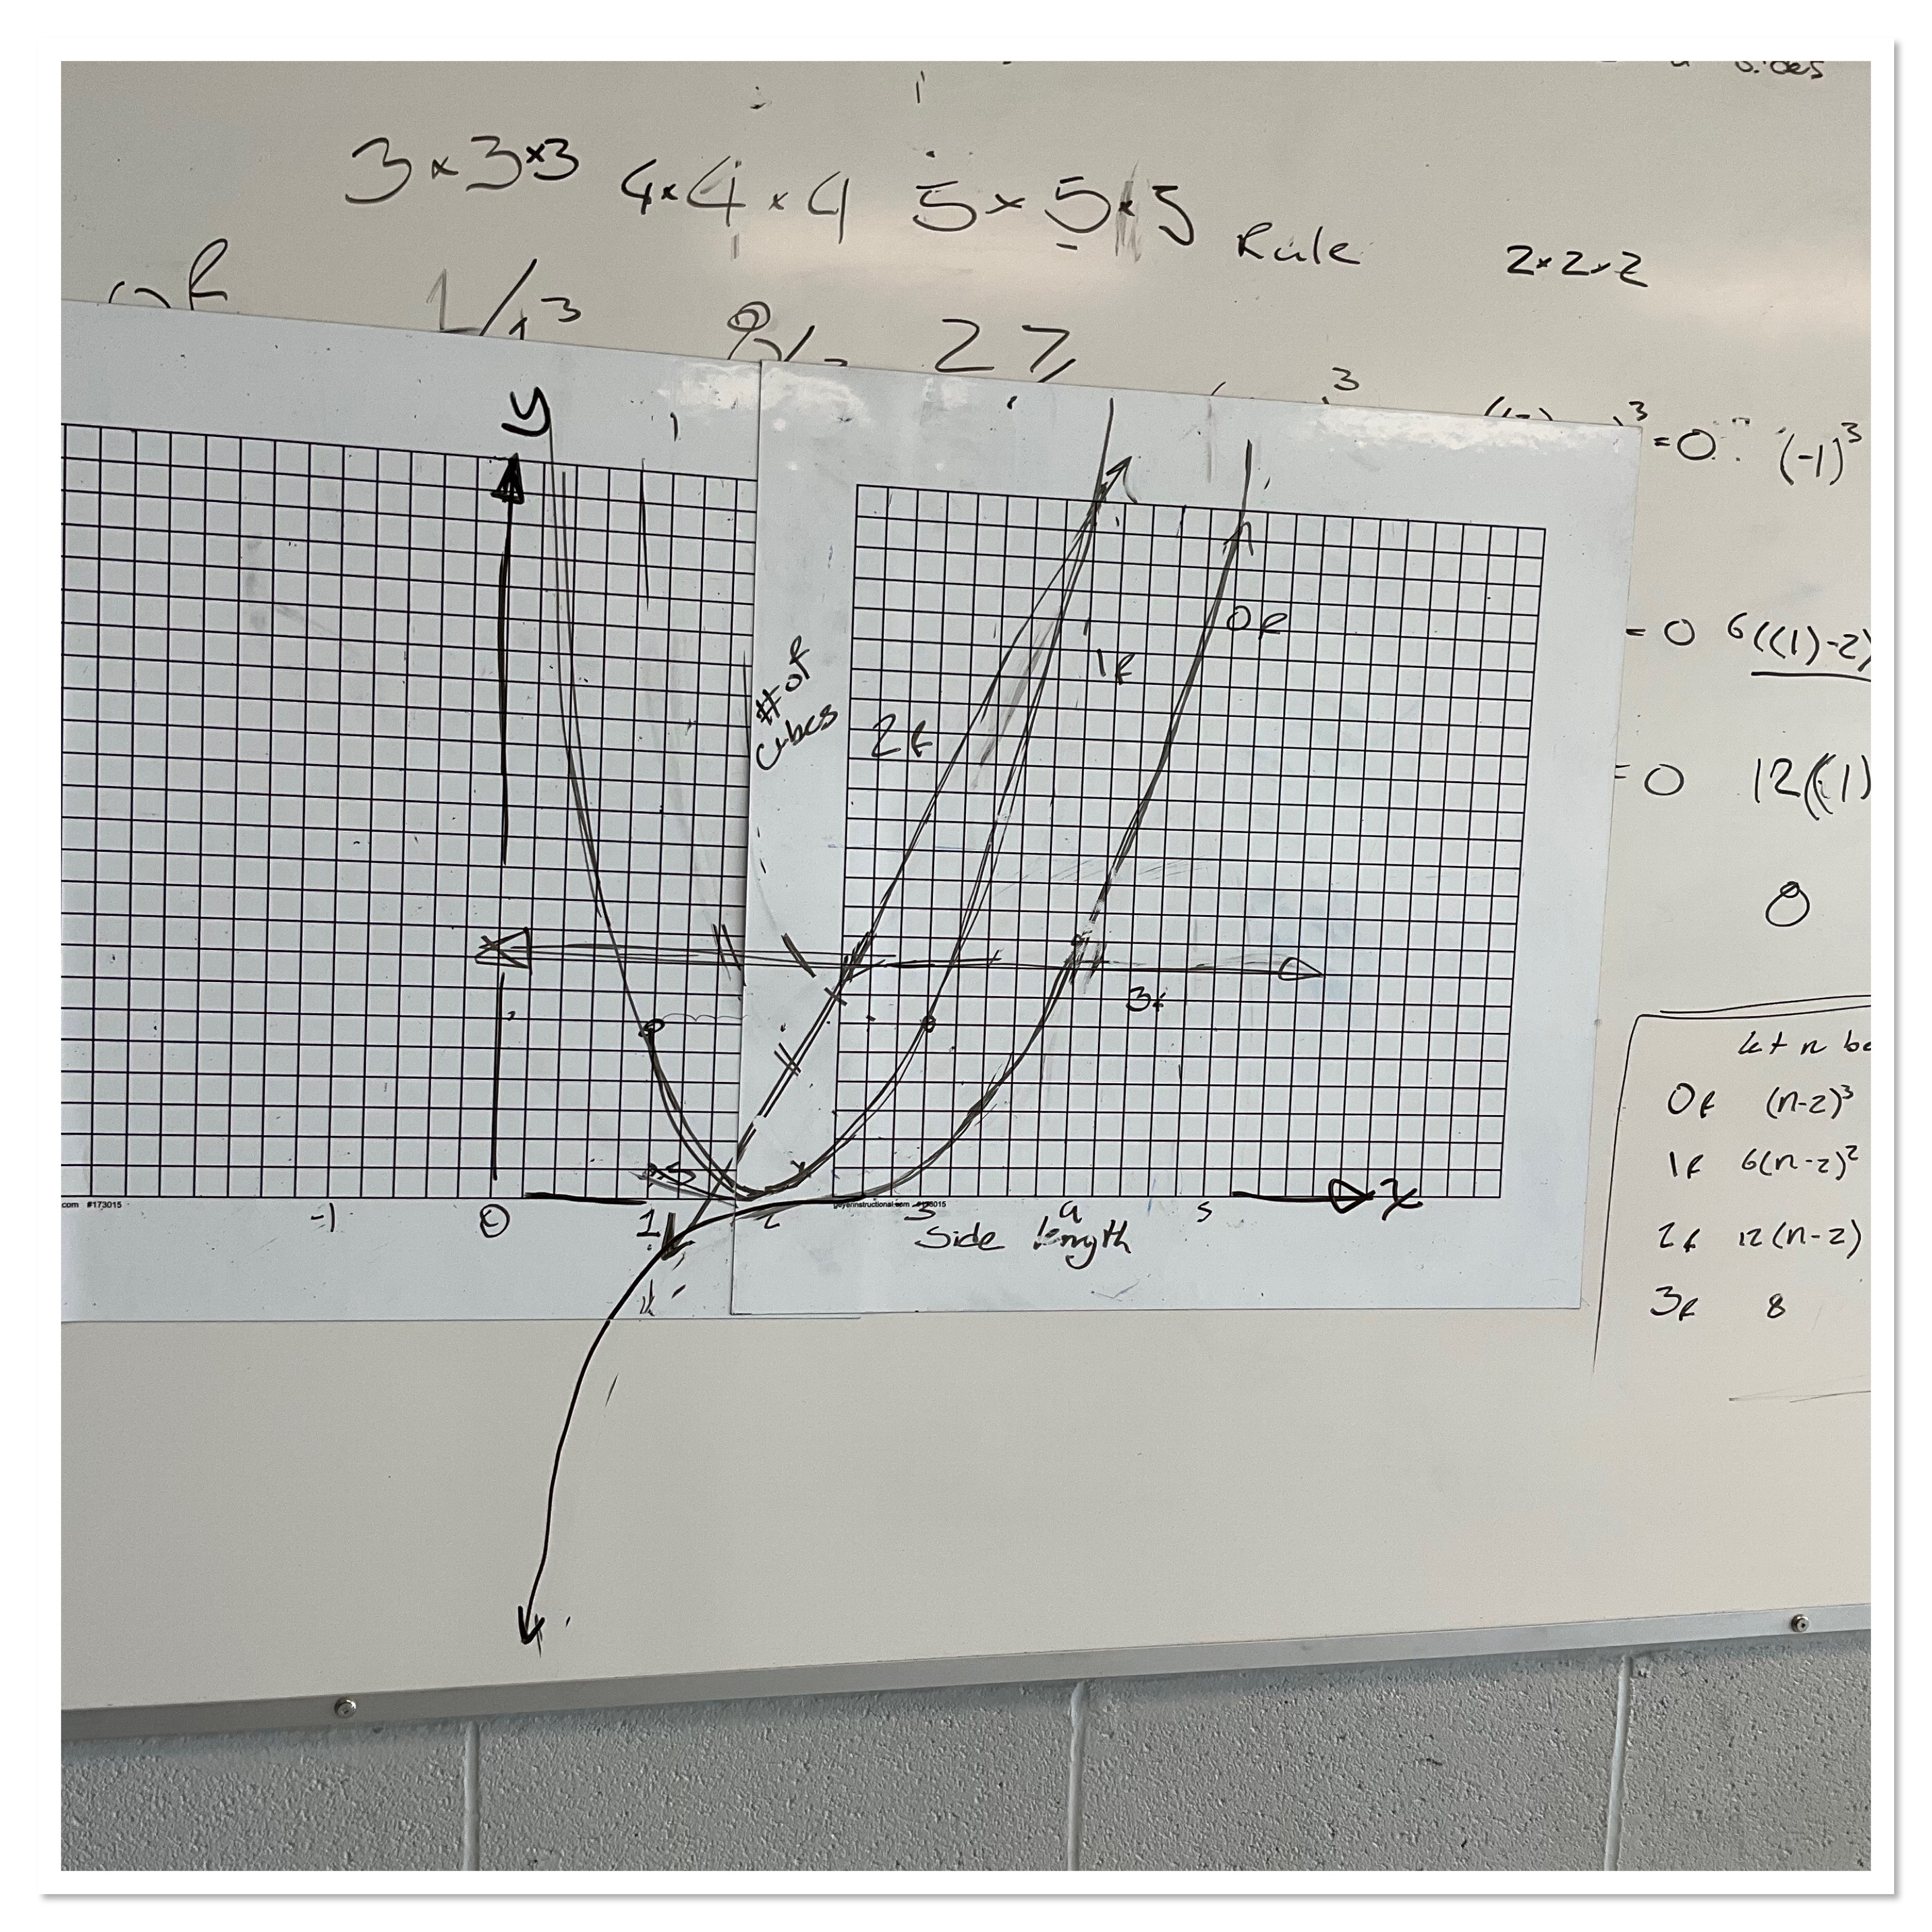
To refresh: the task is to imagine that a 3×3 cube is dunked in paint, then dried, then disassembled. We need to categorize each little sub cube by the number of faces that have paint.

Once groups have managed a 3x3x3 cube, they are asked to try a 4x4x4 or a 5x5x5 or a 6x6x6 or a 10x10x10 or the general case of (x)(x)(x).
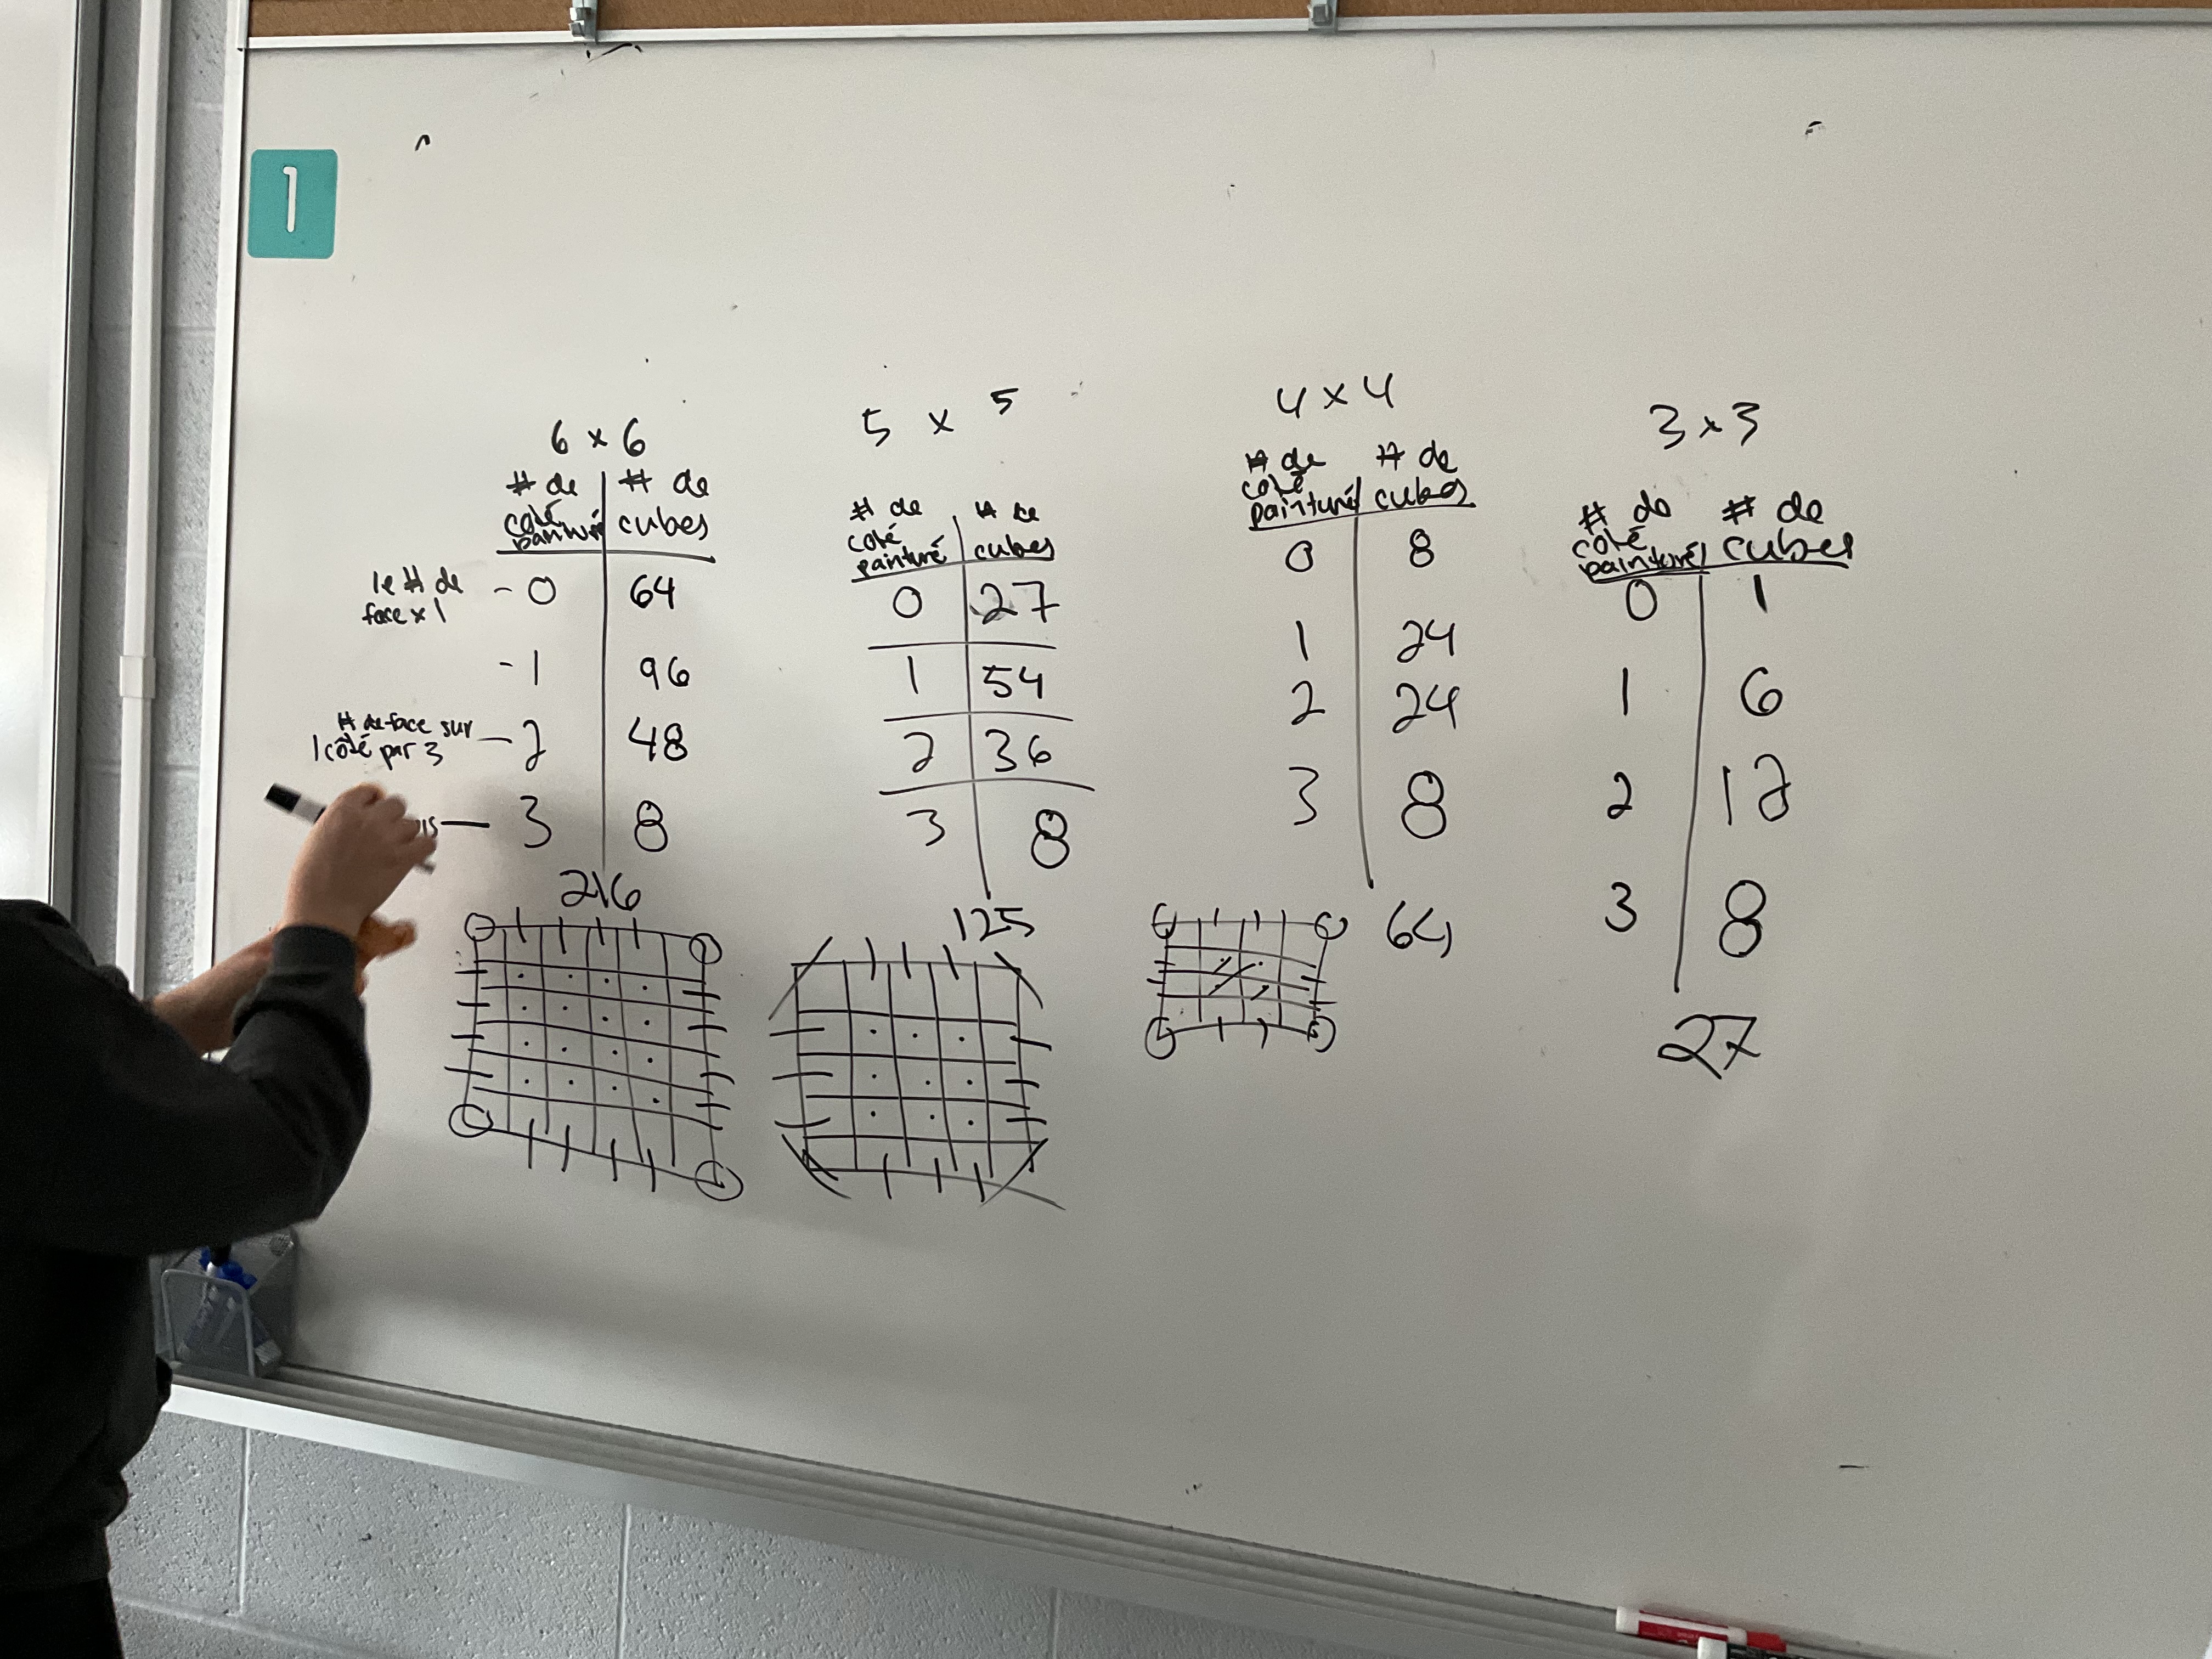
Students come up with all the equations to model the relationships, then are asked to graph the relationships.
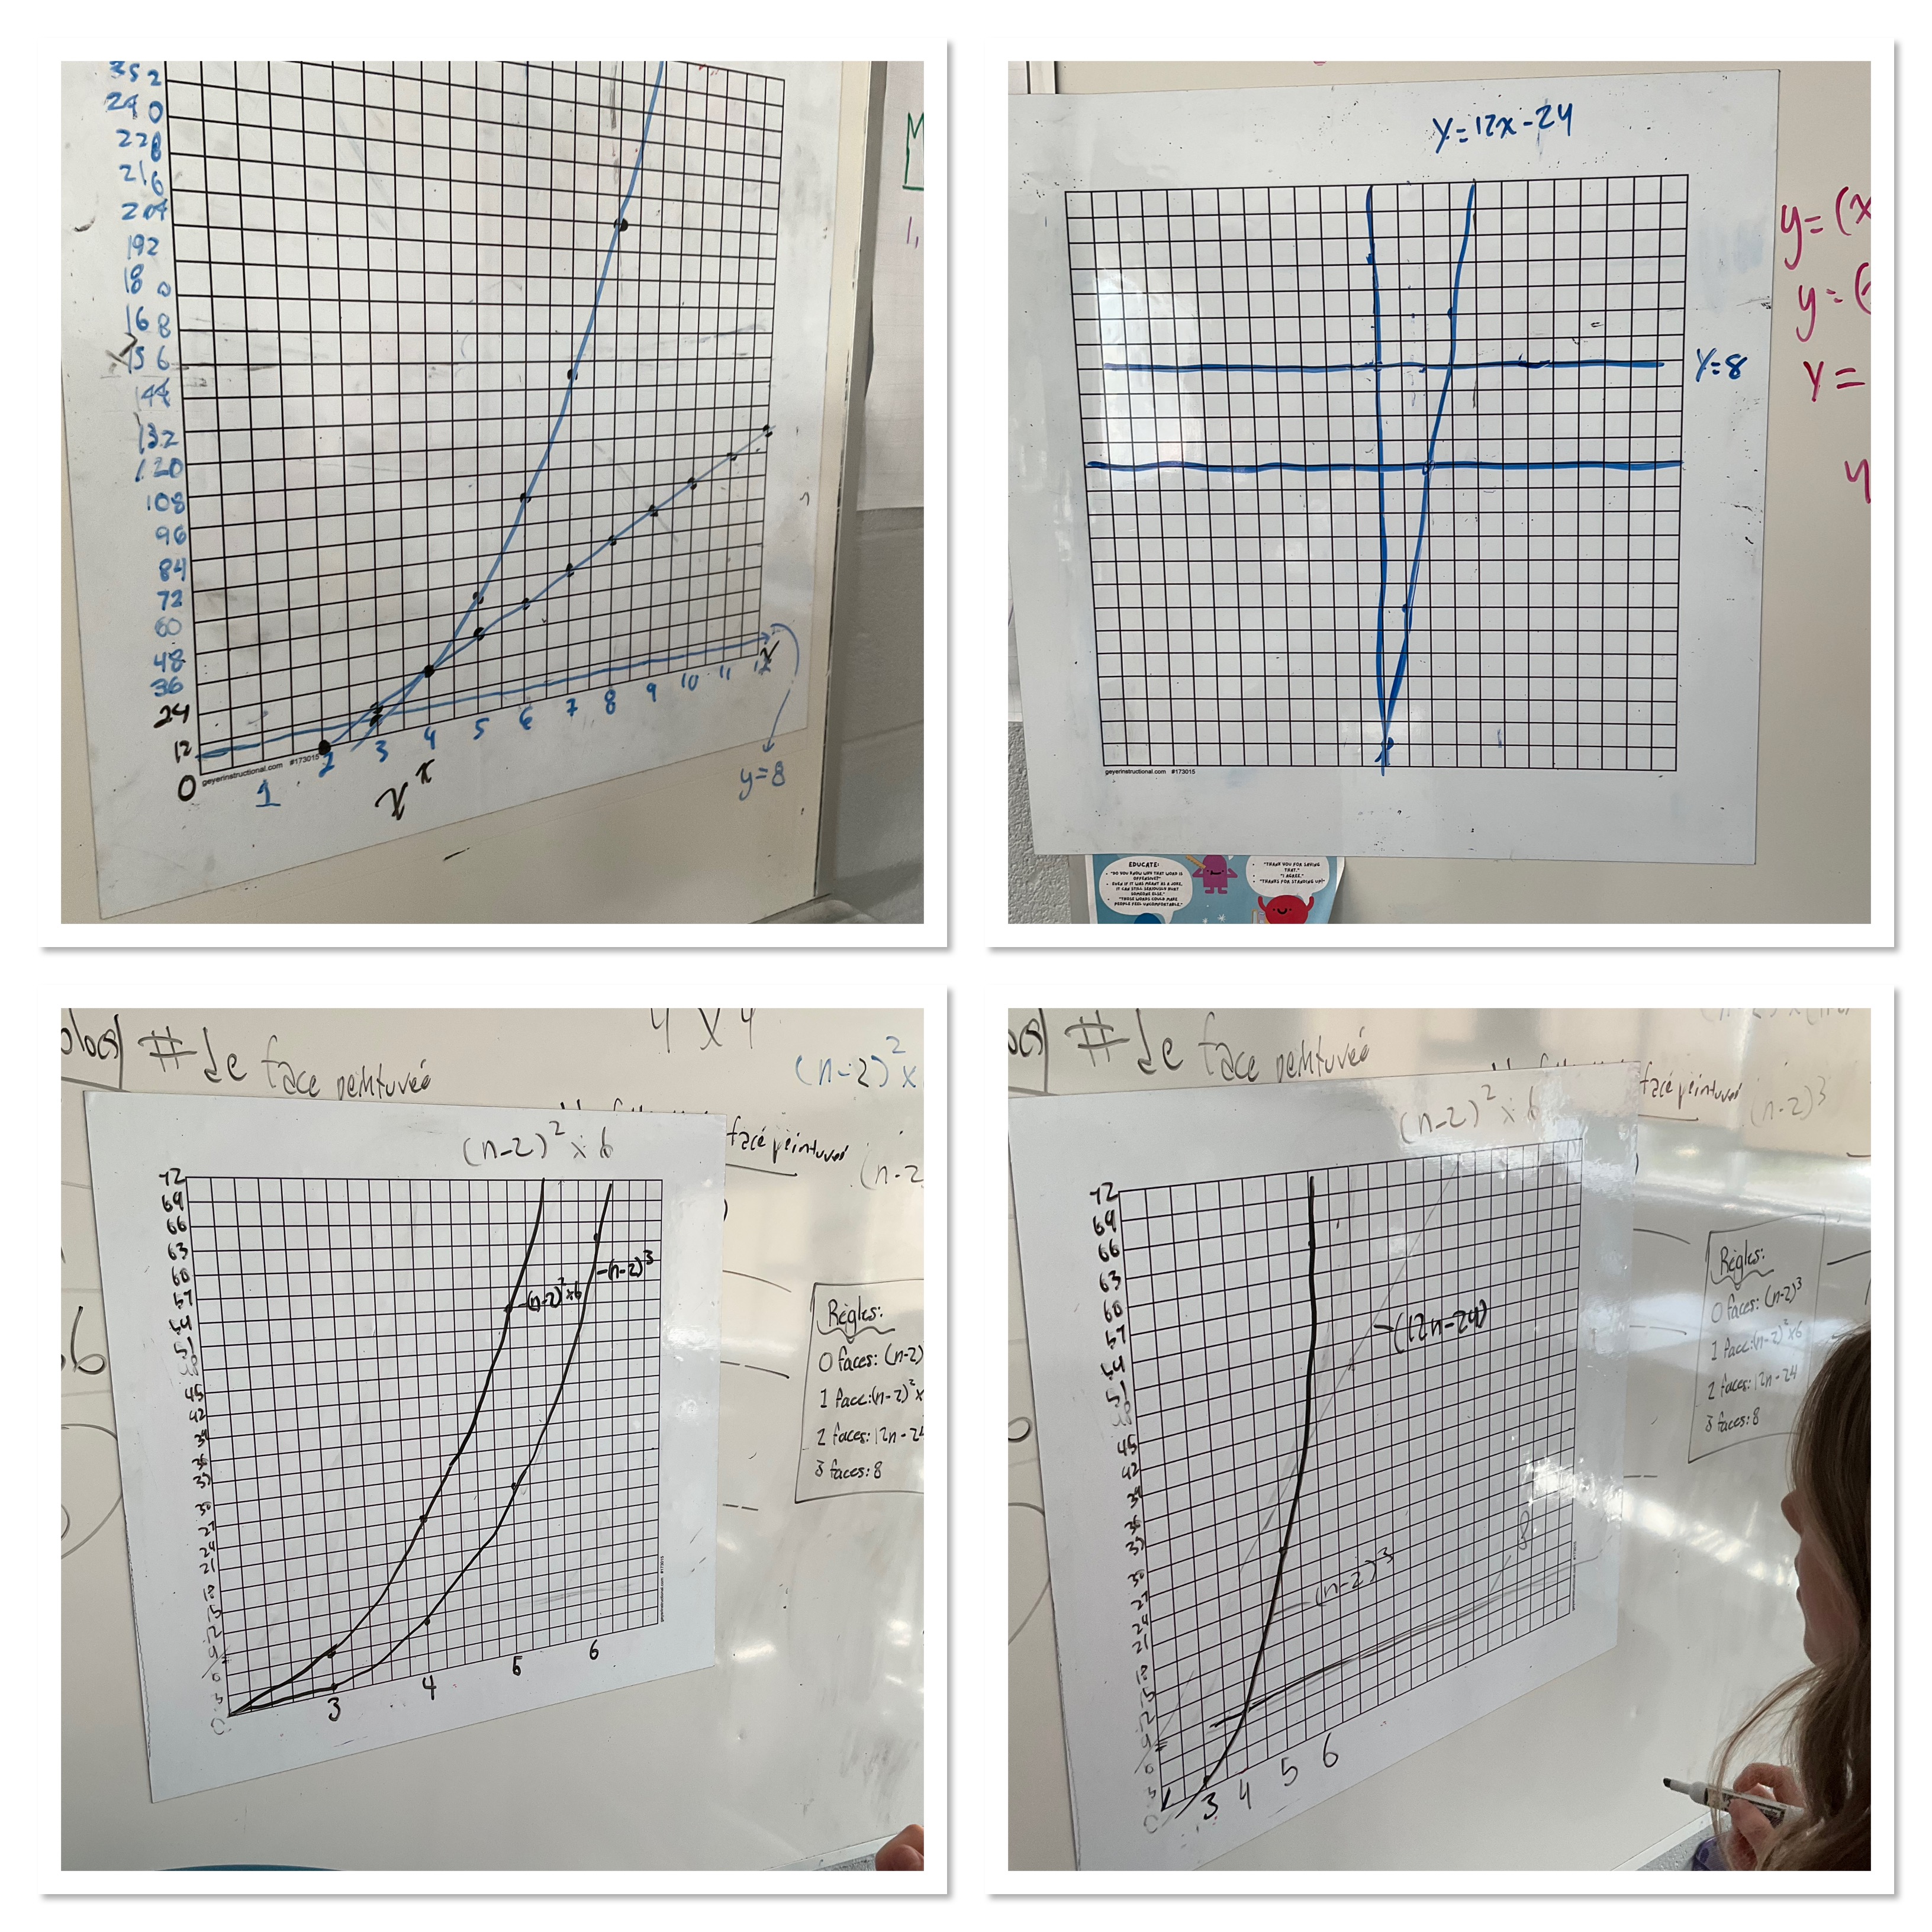
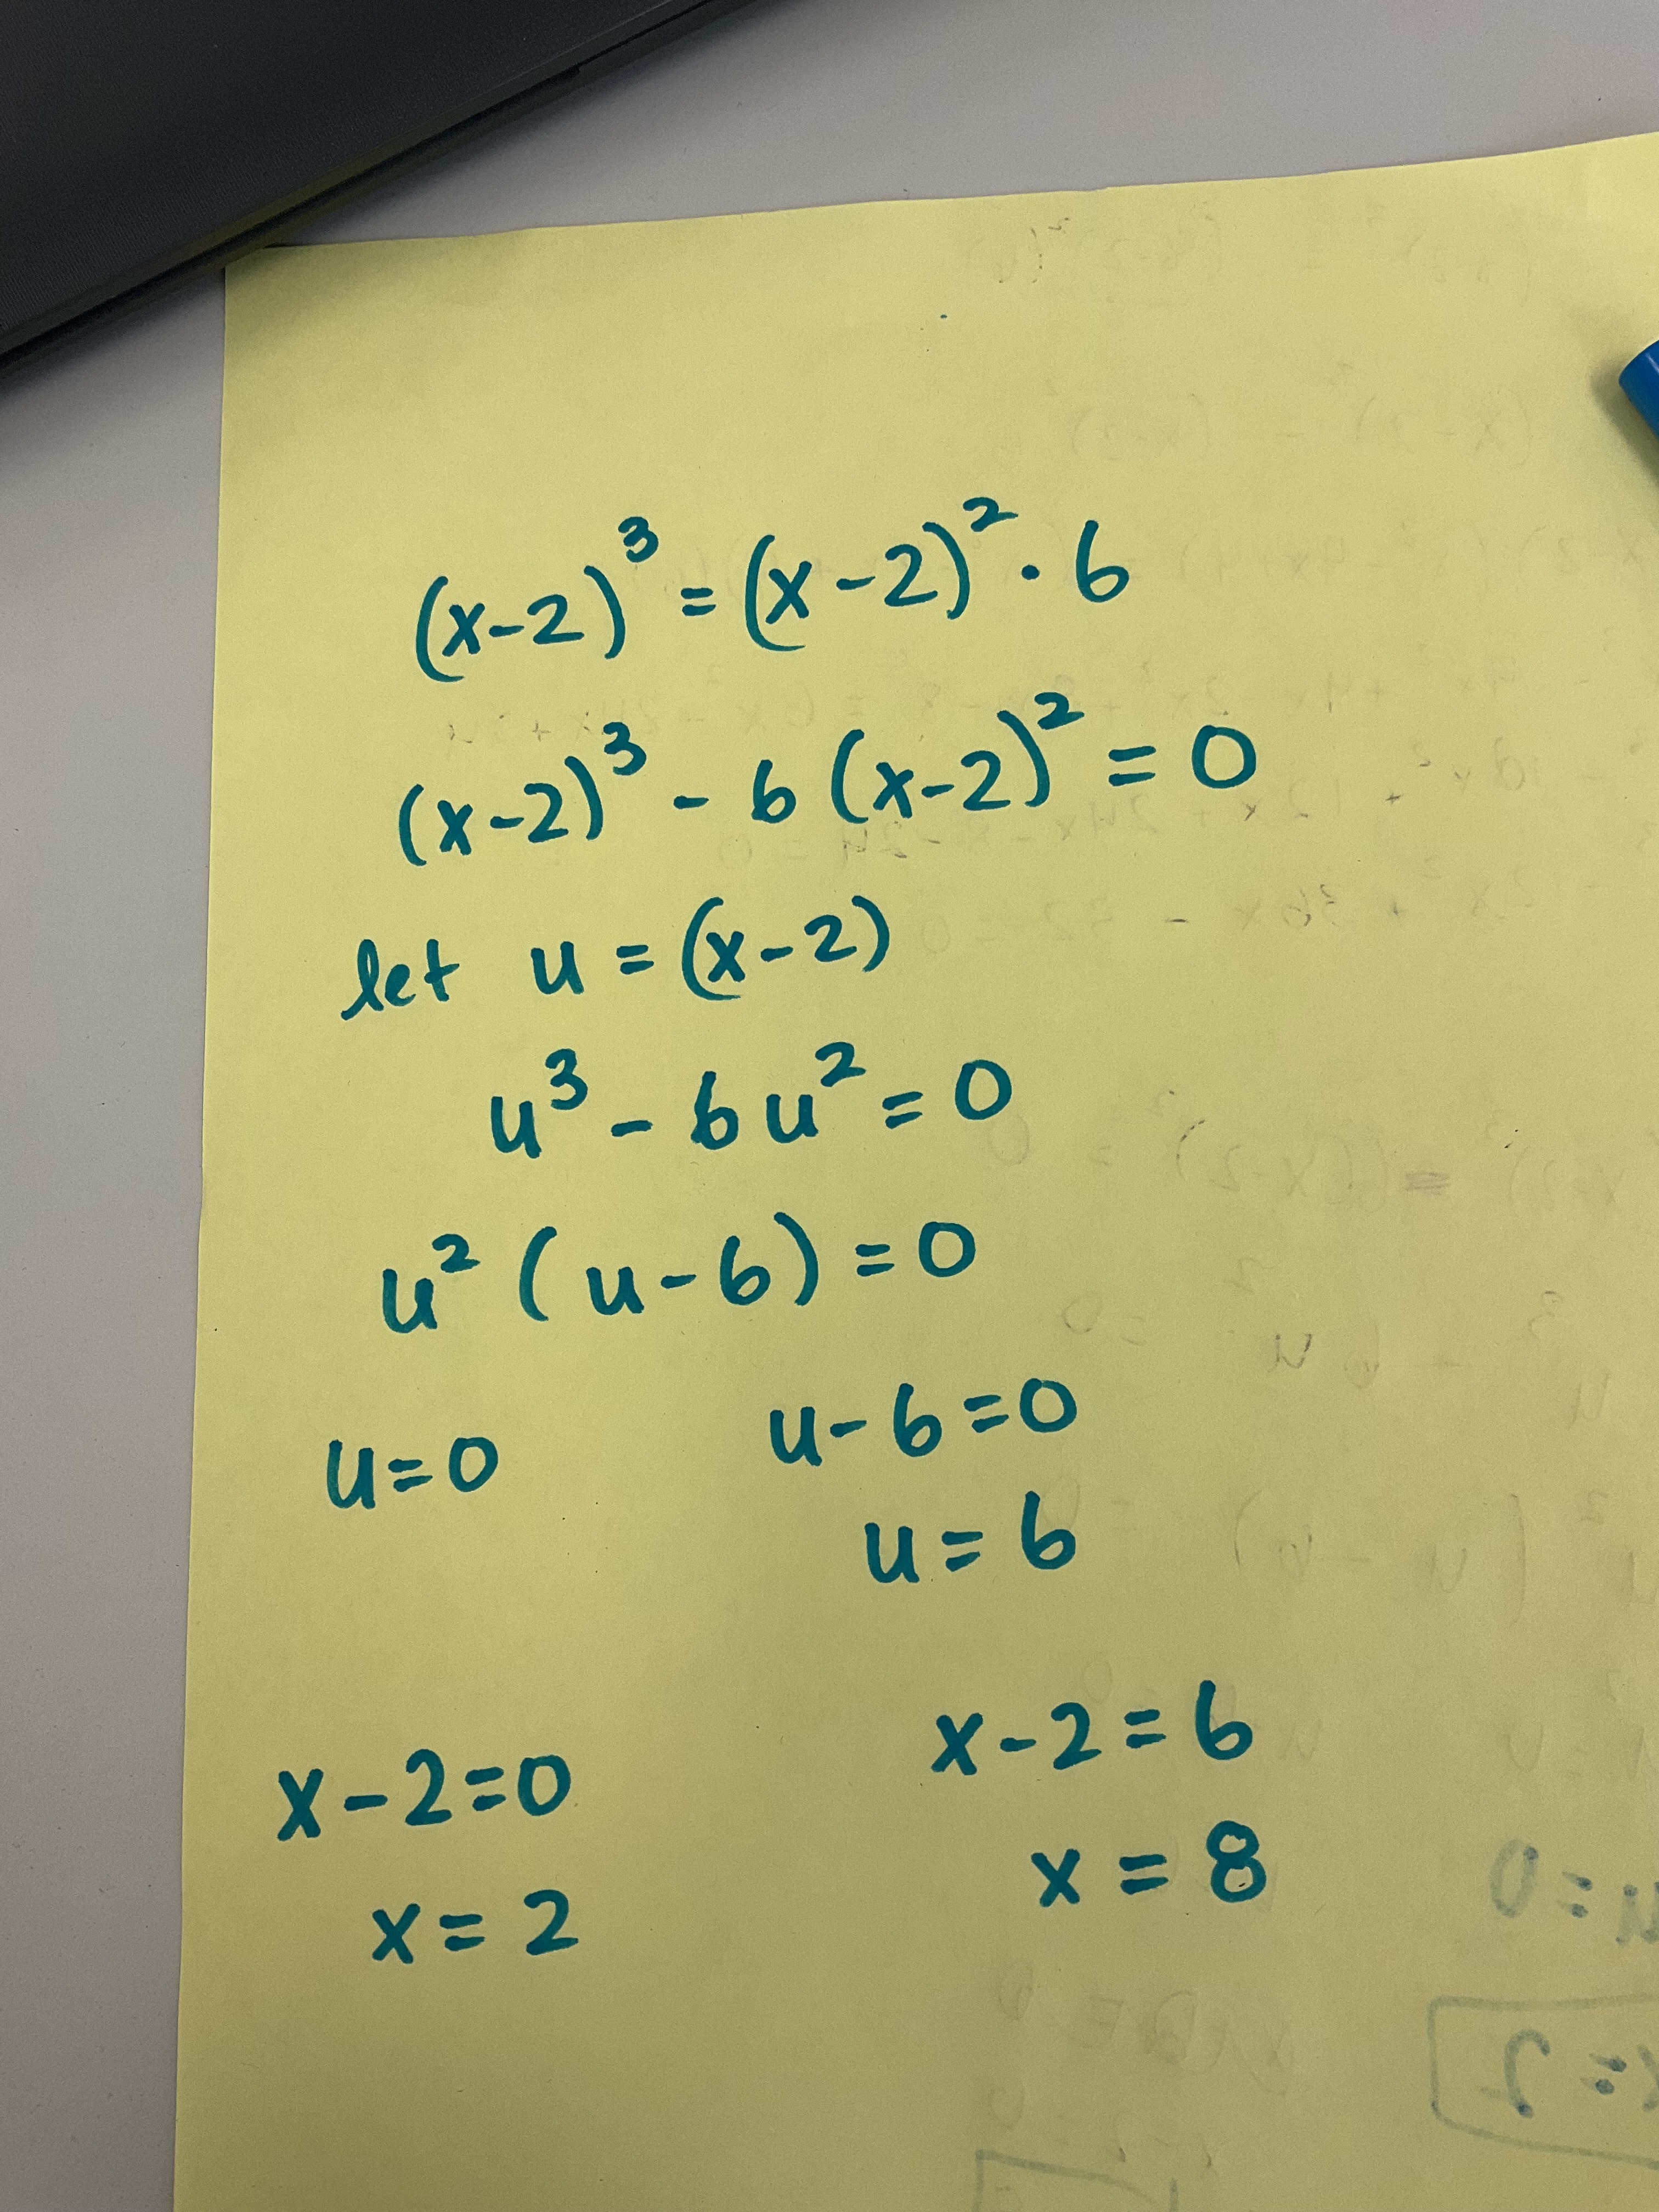
What was interesting with this group was that they wanted to find the intersection of the curves algebraically. We got into some good discussions about how to multiply a binomial by a trinomial, and also about how to solve by substitution.

we discovered later that the best way to approach this particular intersection in grade 10 is with u substitution, since we can’t really deal with factor theorem or solving cubics.
The other intersections are all really good to do for grade 10s. It’s good practice for solving linear systems by substitution, or solving systems by factoring.
This task gets richer with each iteration! Looking forward to seeing what we notice the next time through.
Painted Cube
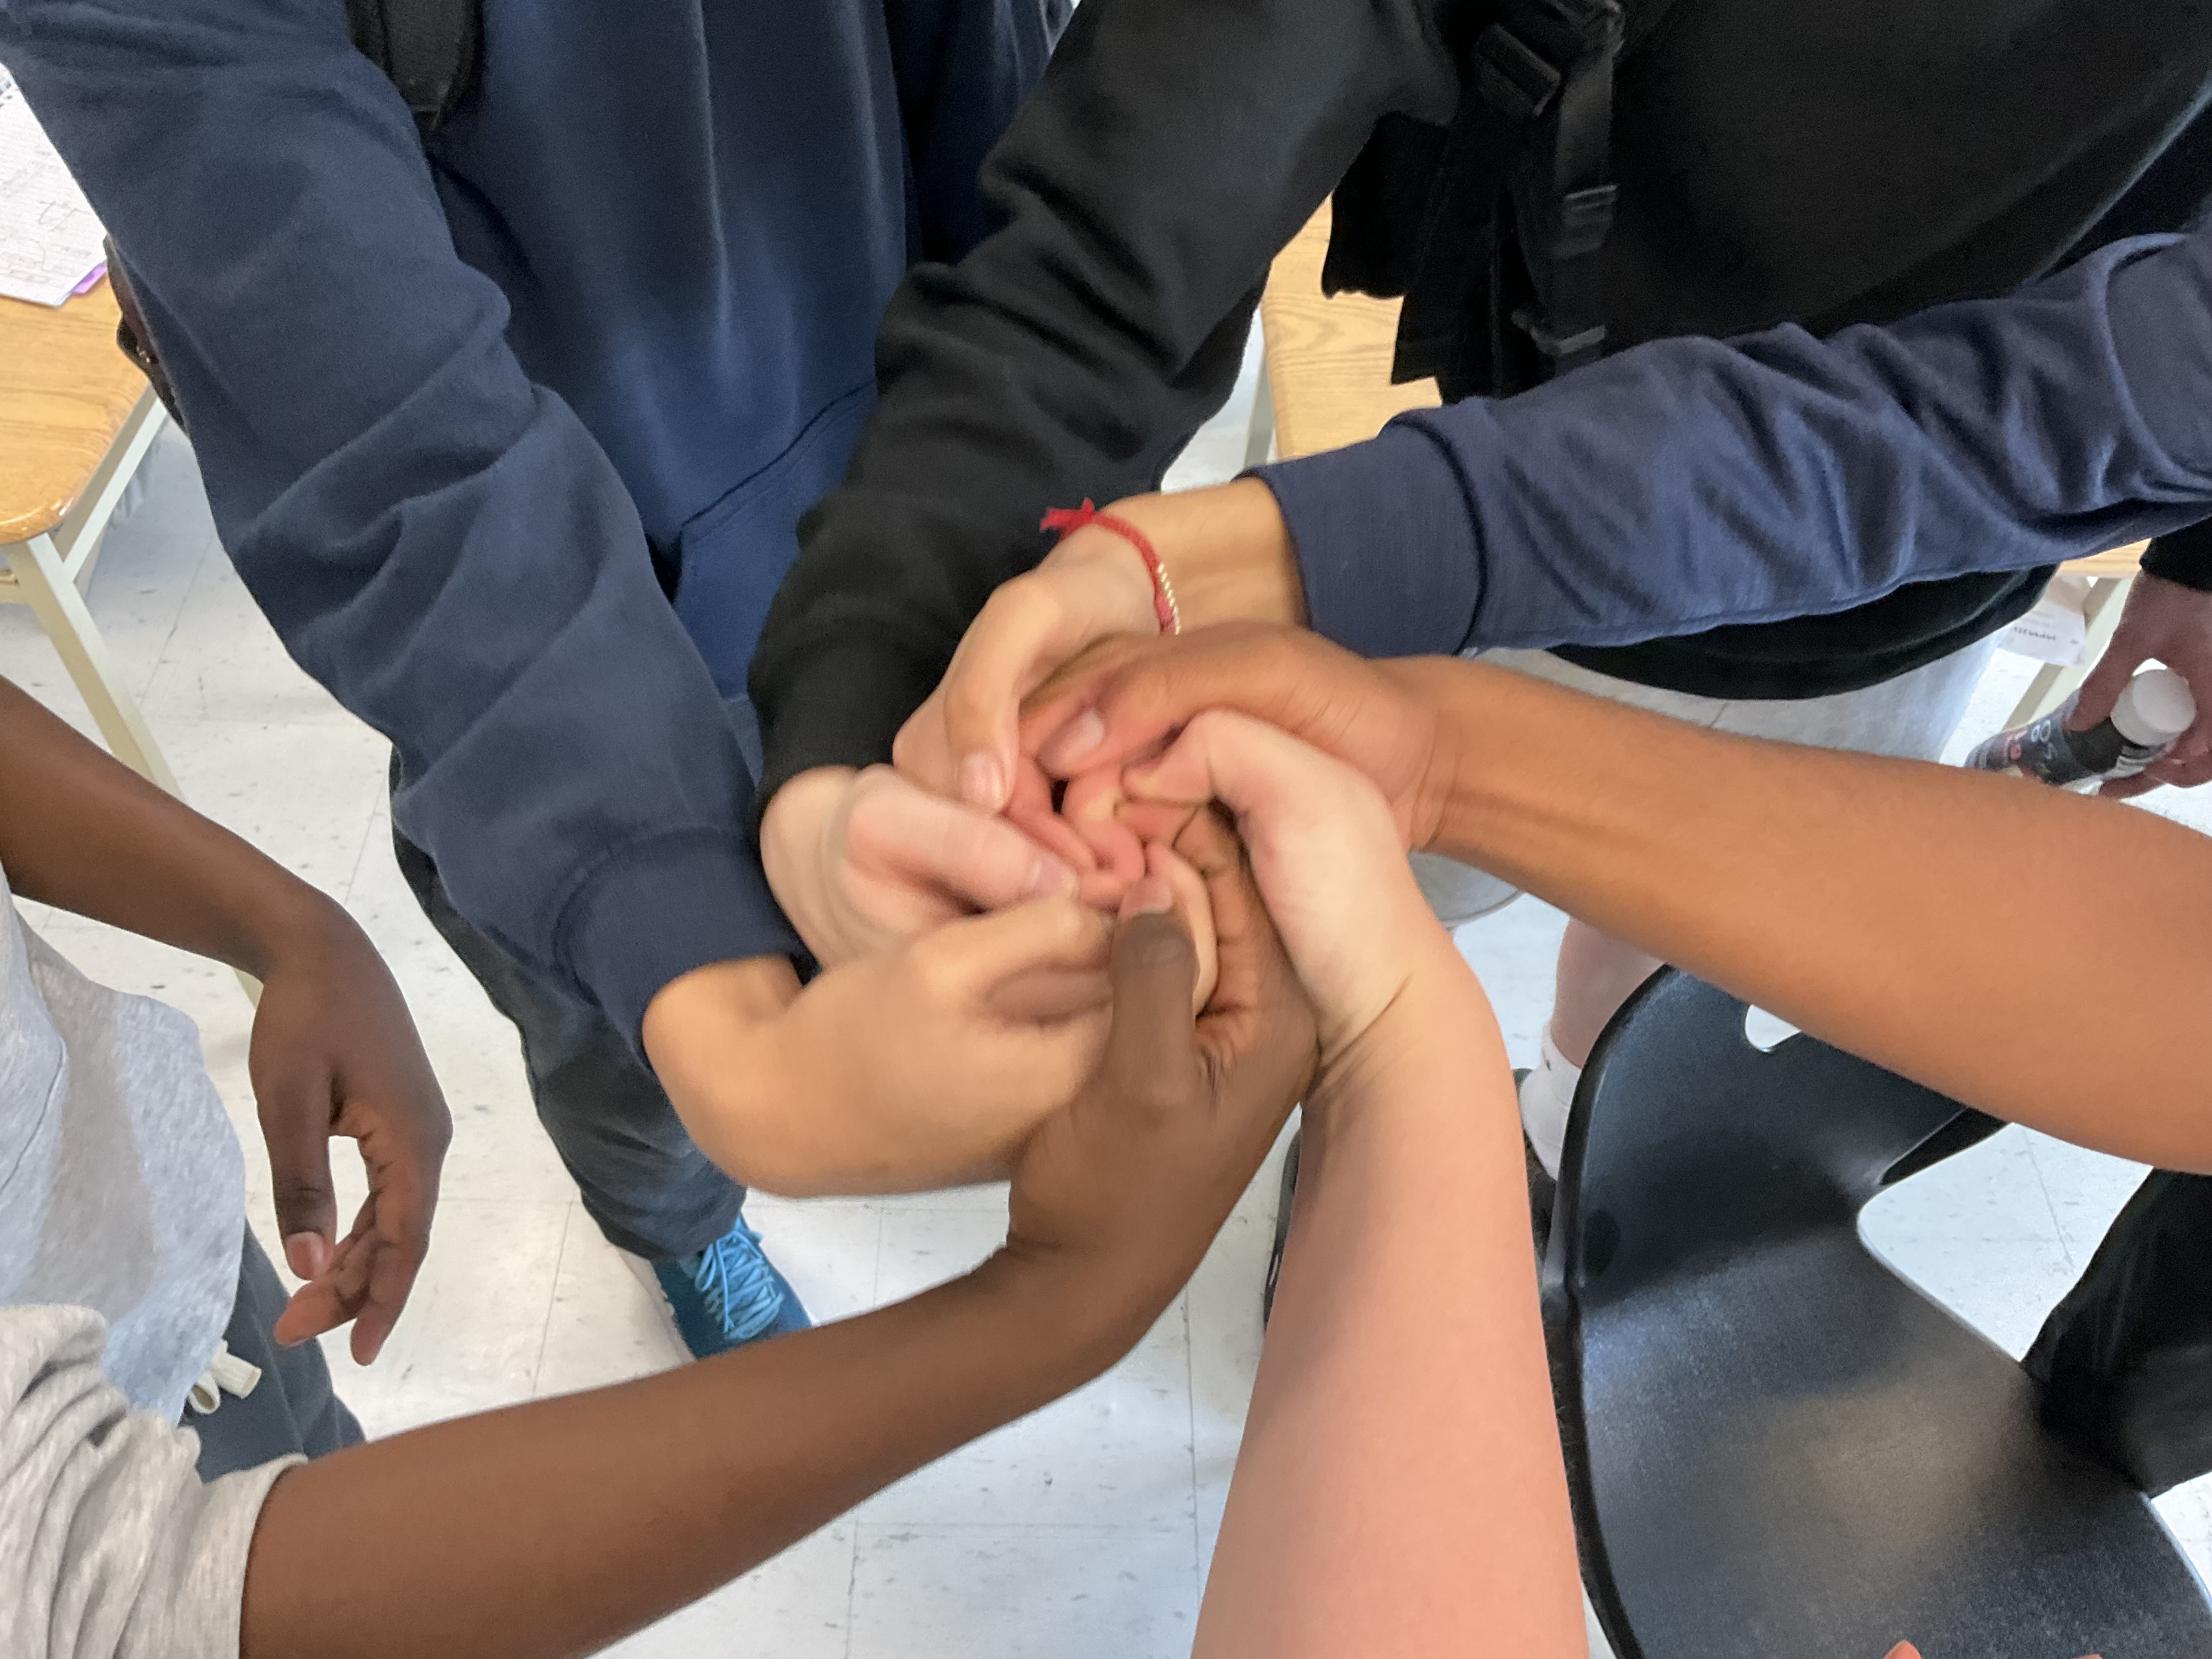
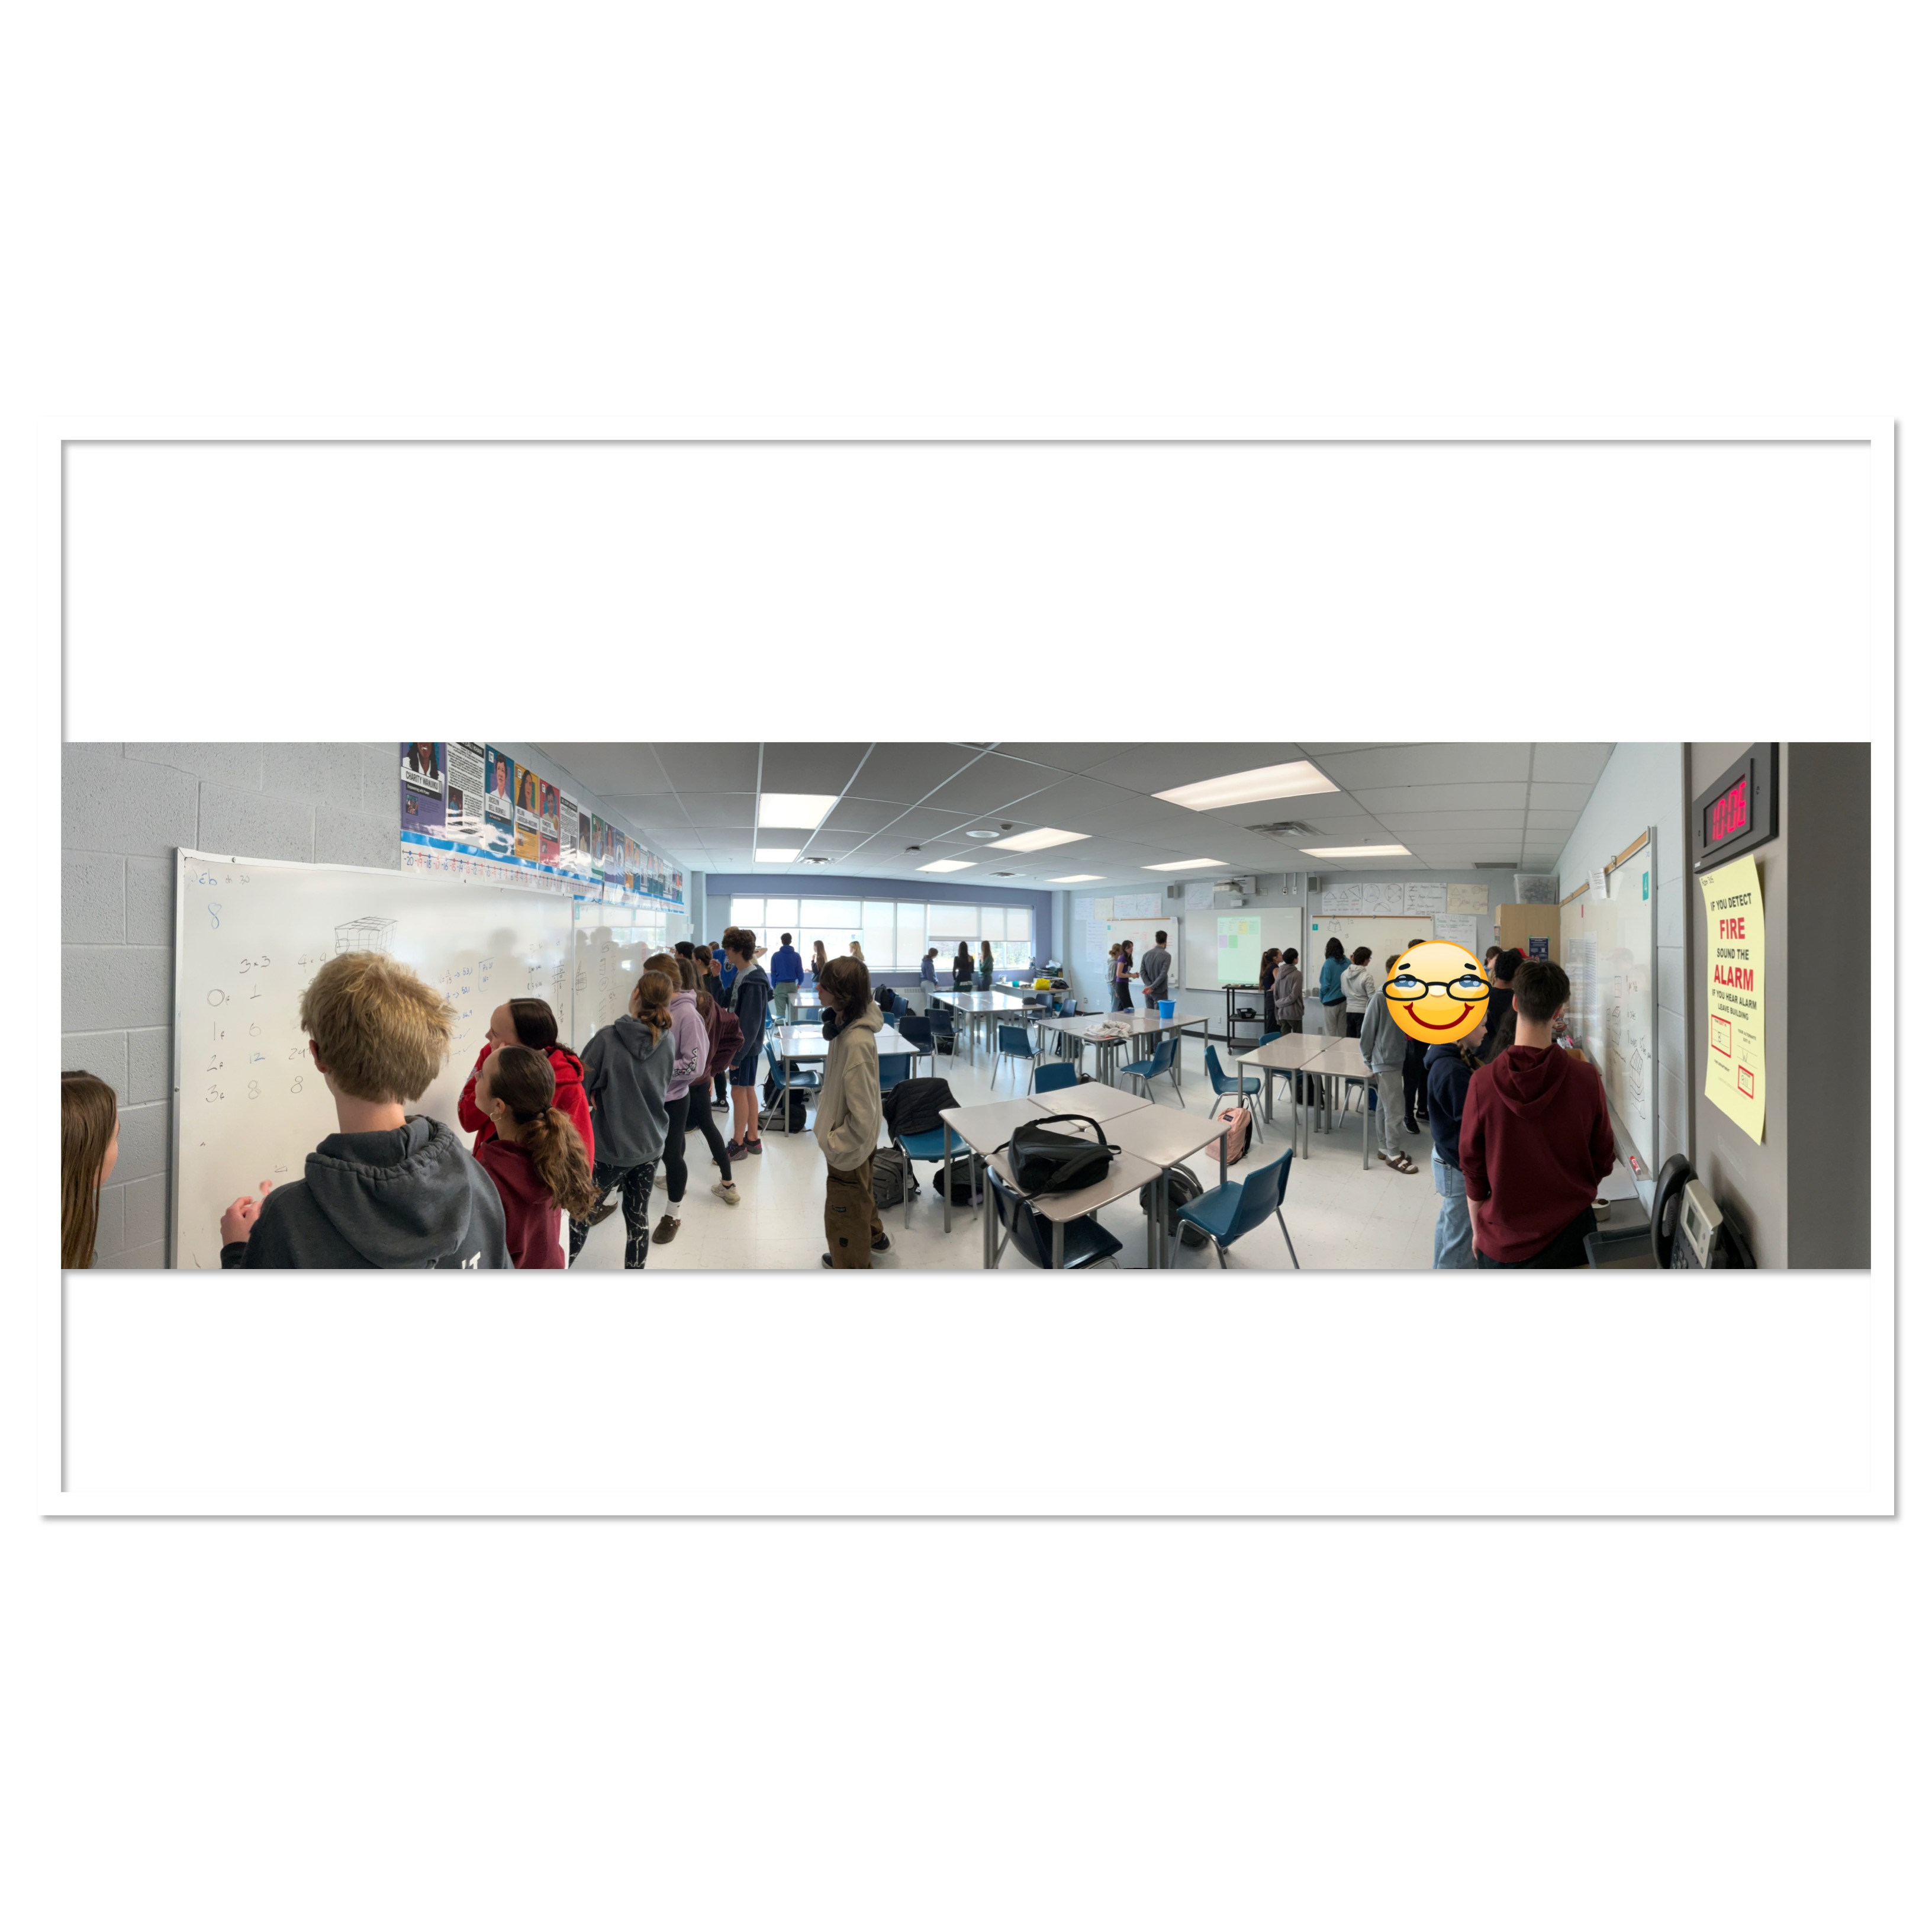
Today my grade 10s invited the grade 10 class from across the hall to come over to do math together. We worked in co-mingled random groups of 3-4 students to tackle the problem of the painted cube.
The question is: imagine a cube, like a Rubik’s cube, 3x3x3. The cube is dunked in a bucket of paint. When dried off, the cube is taken apart to reveal the little cubes that make it up. How many of those little cubes have no paint? How many have 1 face painted? How many have 2 faces painted, and how many have 3 faces painted? Do any have all faces painted?
Students worked together to understand and represent the problem, and to work through their answers. There were excellent drawings and tables created.
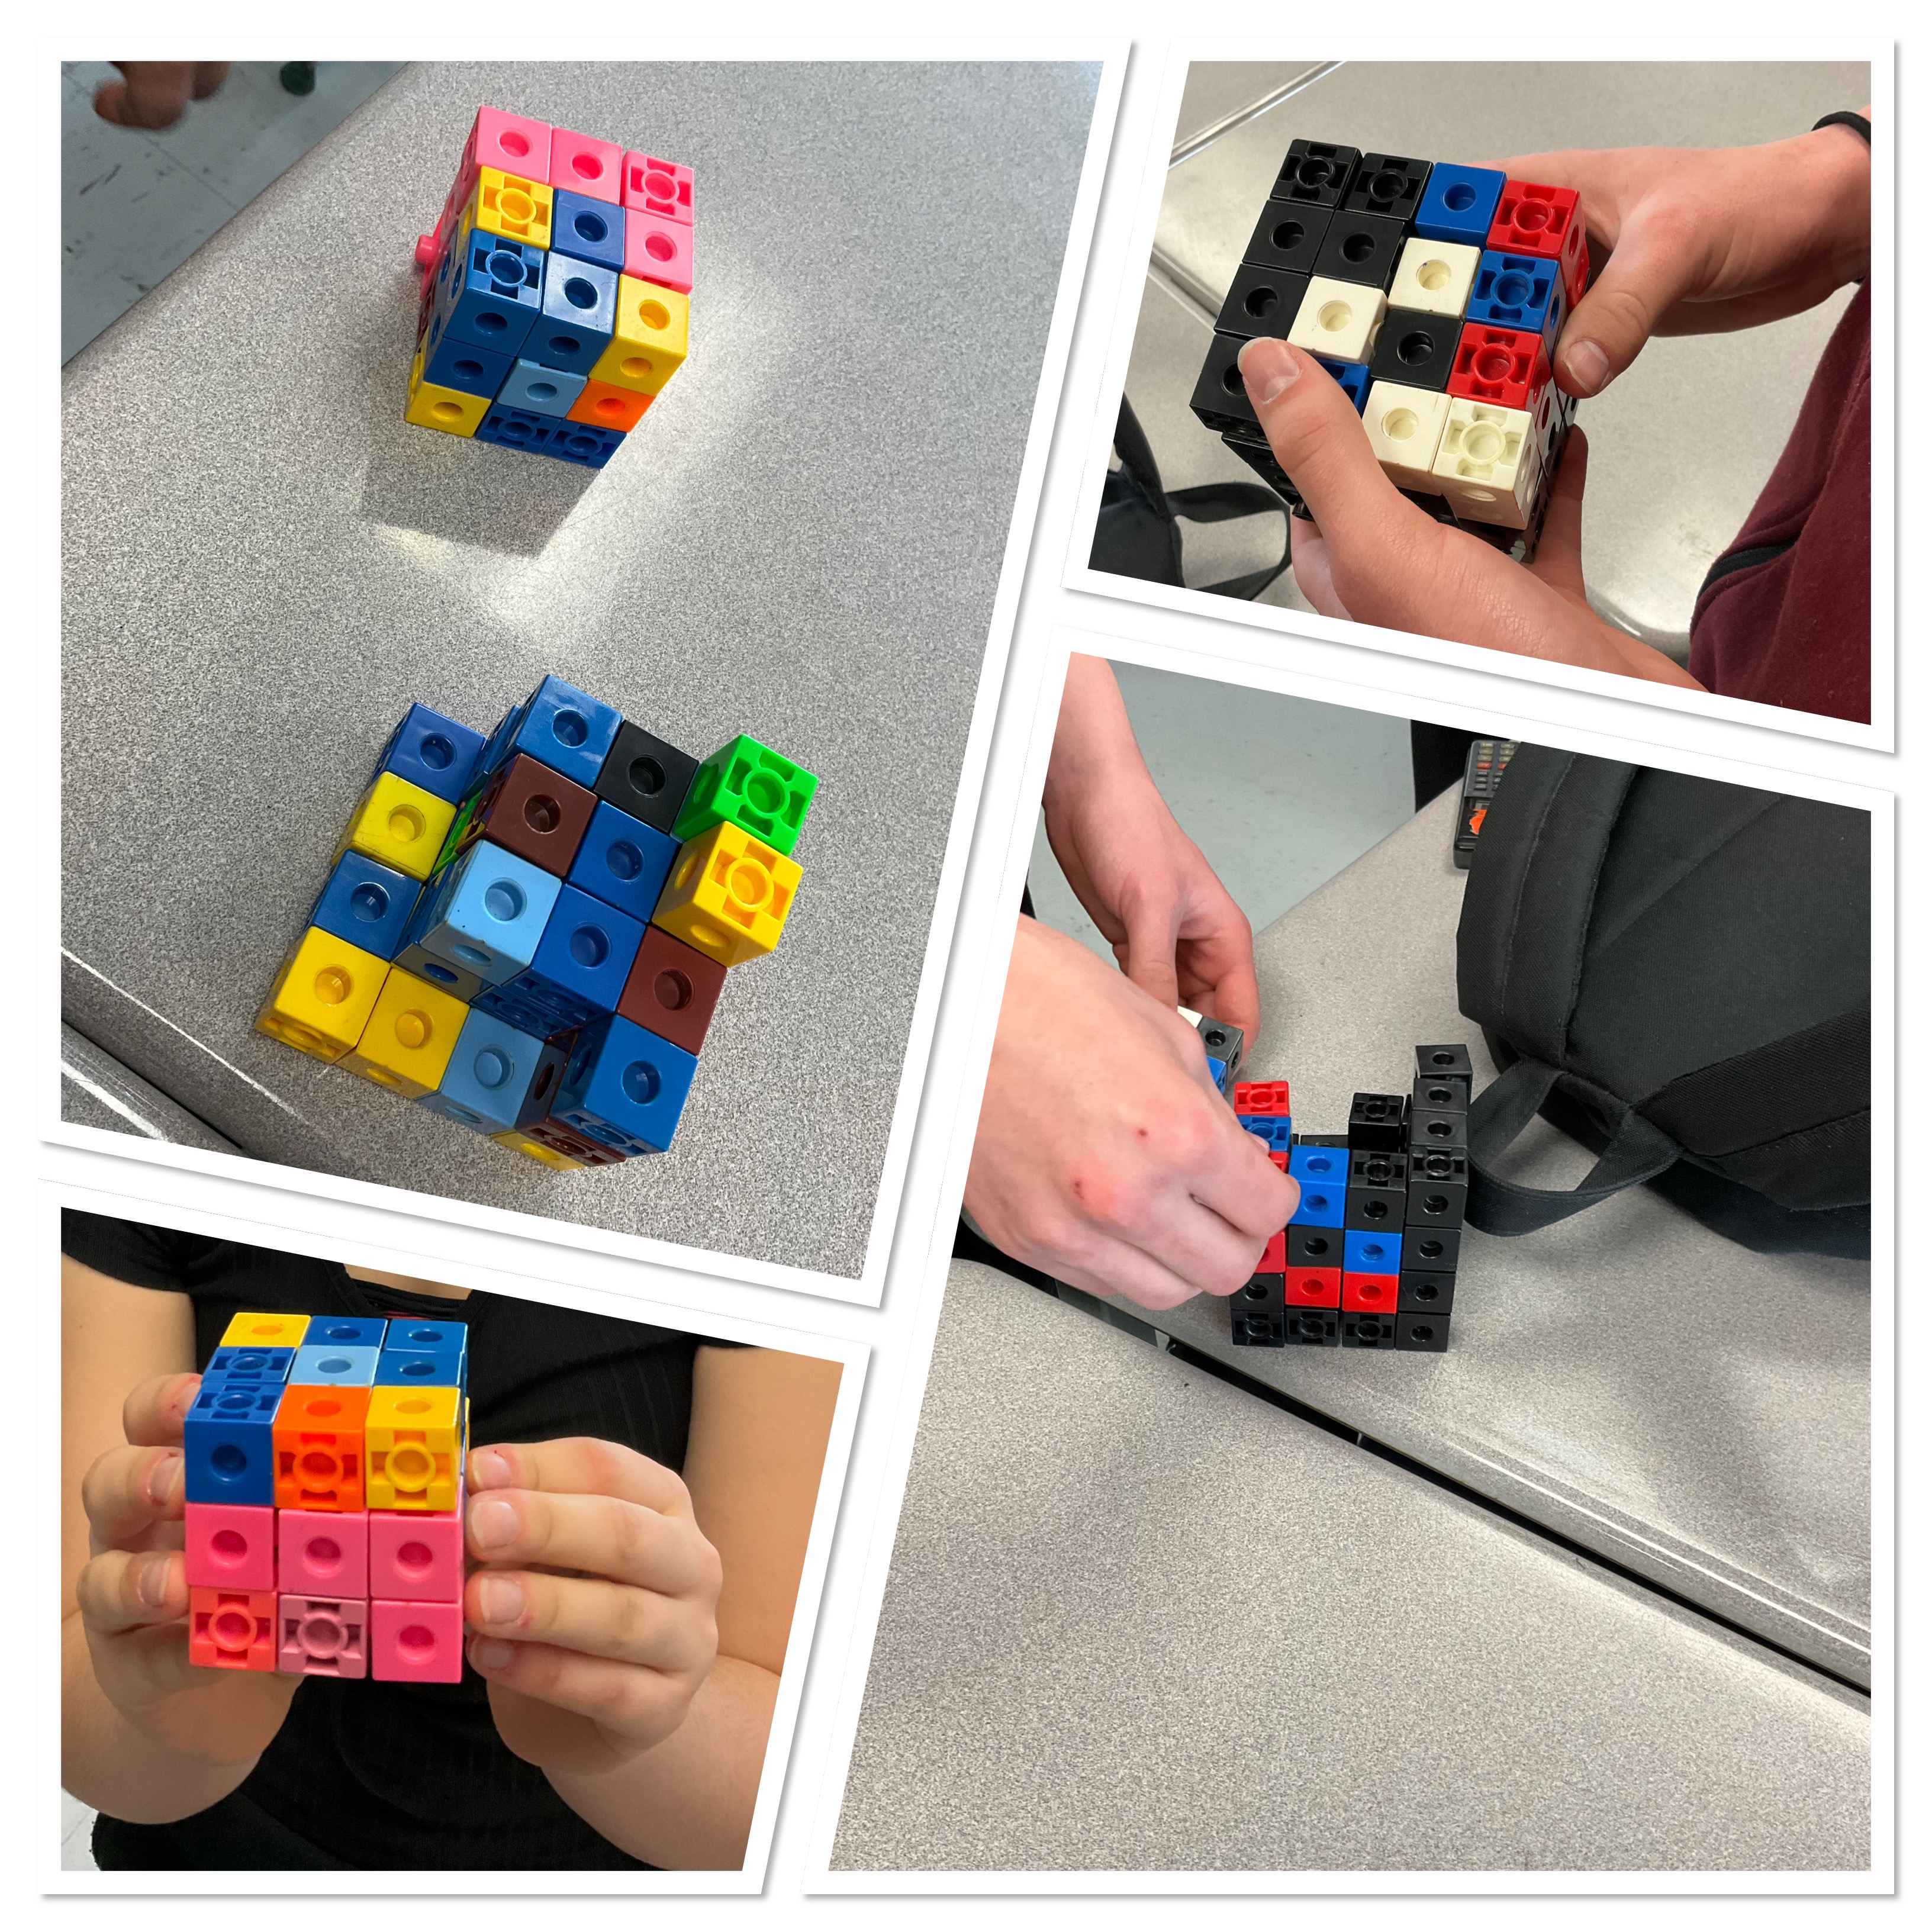
we pushed the thinking to a 4x4x4 and a 5x5x5 situation. Some wanted to do a 100x100x100 cube! Many decided to create a general rule or equation for each number of painted faces.

To help model their thinking, some groups used the linking cubes we have in our room. The concrete tools really help us visualize 3 dimensional problems.
After pushing groups to consider a general formula, we asked them to graph them, and continue their model into the hypothetical range of negative sided cubes. The whole cube scenario falls apart, but the models keep going.
some students were interested in restricting the domain, to tell the region where the model works. We need whole number values for x, and they have to be bigger than 2.
It was fun to see the room so full of active math. Groups worked well together. Some students were concerned about having never solved a problem like this before, but took risks, and tried things, and realized by the end that the thinking is the goal. The thinking about the problem, and modelling the problem is far more valuable than knowing the number of painty sides on a cube. The ability to think, communicate, and represent the question in multiple ways is the skill which will be quite useful in future math classes.
hopefully we can have another problem solving day with our neighbouring class in the near future.
Completing the Square
Today was completing the square day in several grade 10 classes. We used algebra tiles to work on understanding how to complete the square to write a quadratic in vertex form.
here we have x^2 -6x+2. We arrange the tiles to make a square. It’s not complete though. We need 7 more red tiles to complete the square. We can only add zero pairs, so we will put the red tiles in the square to complete it, and then have the blue tiles alongside the square.
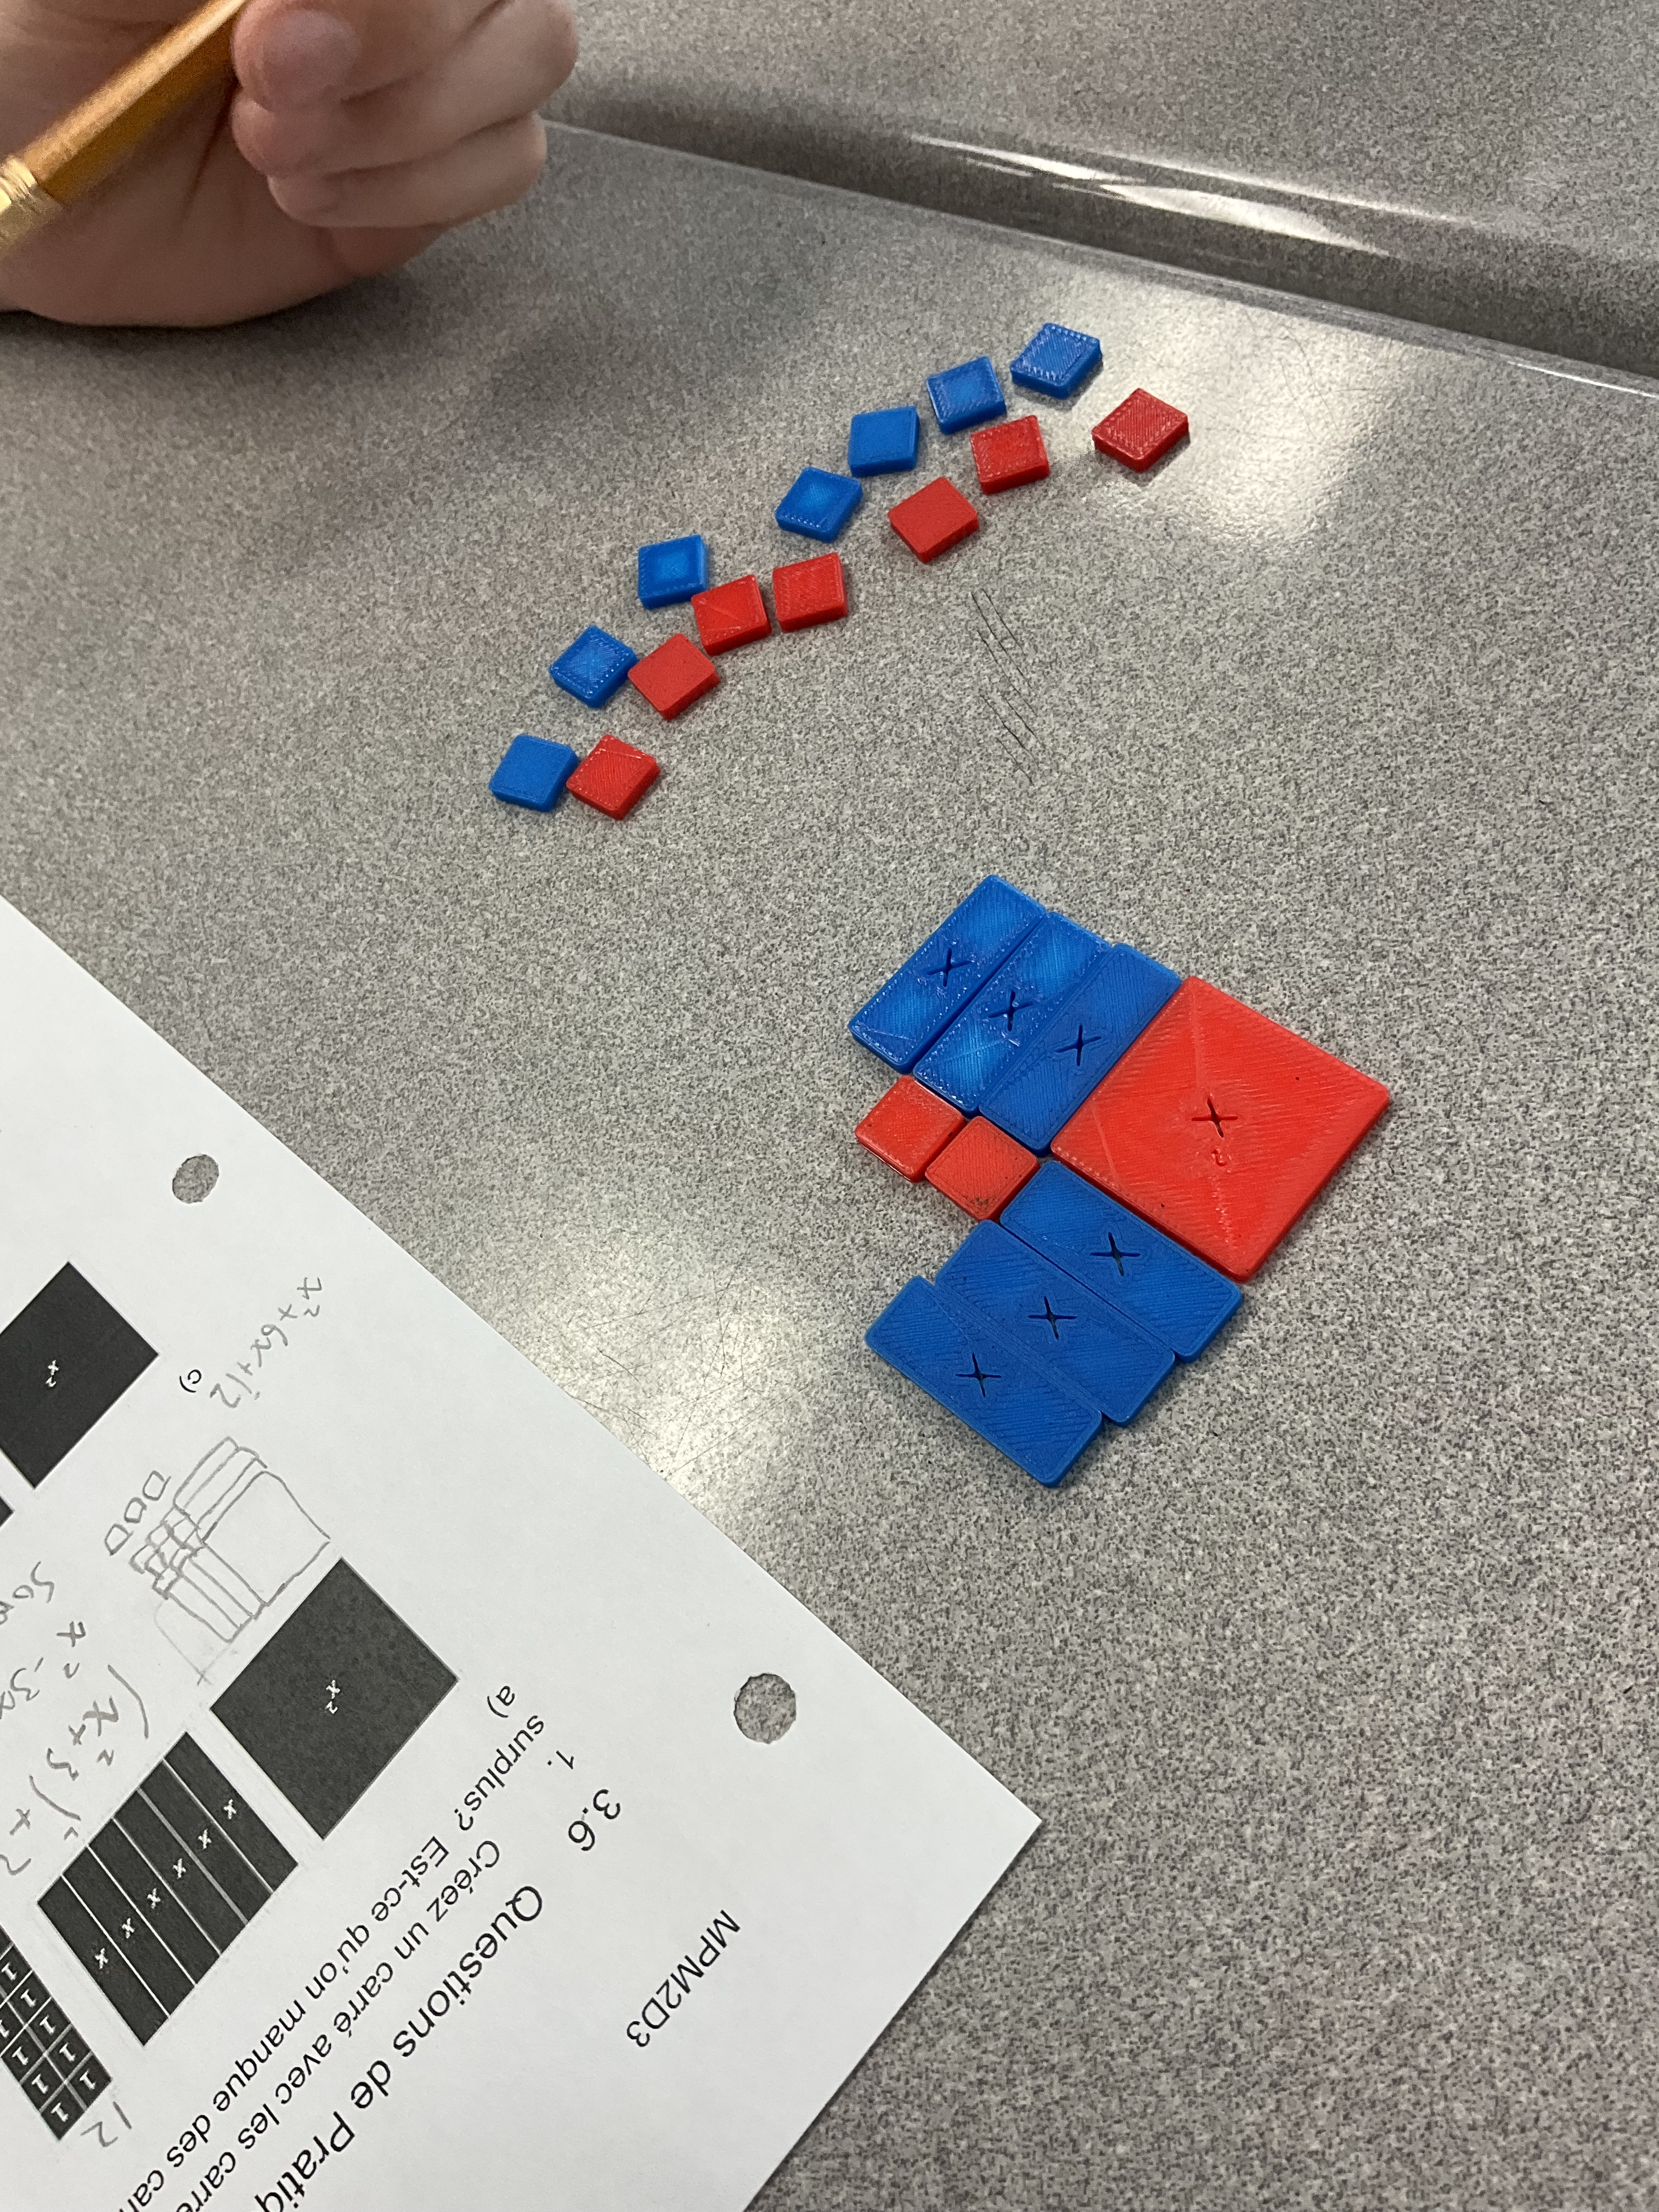
in vertex form we have (x-3)^2-7
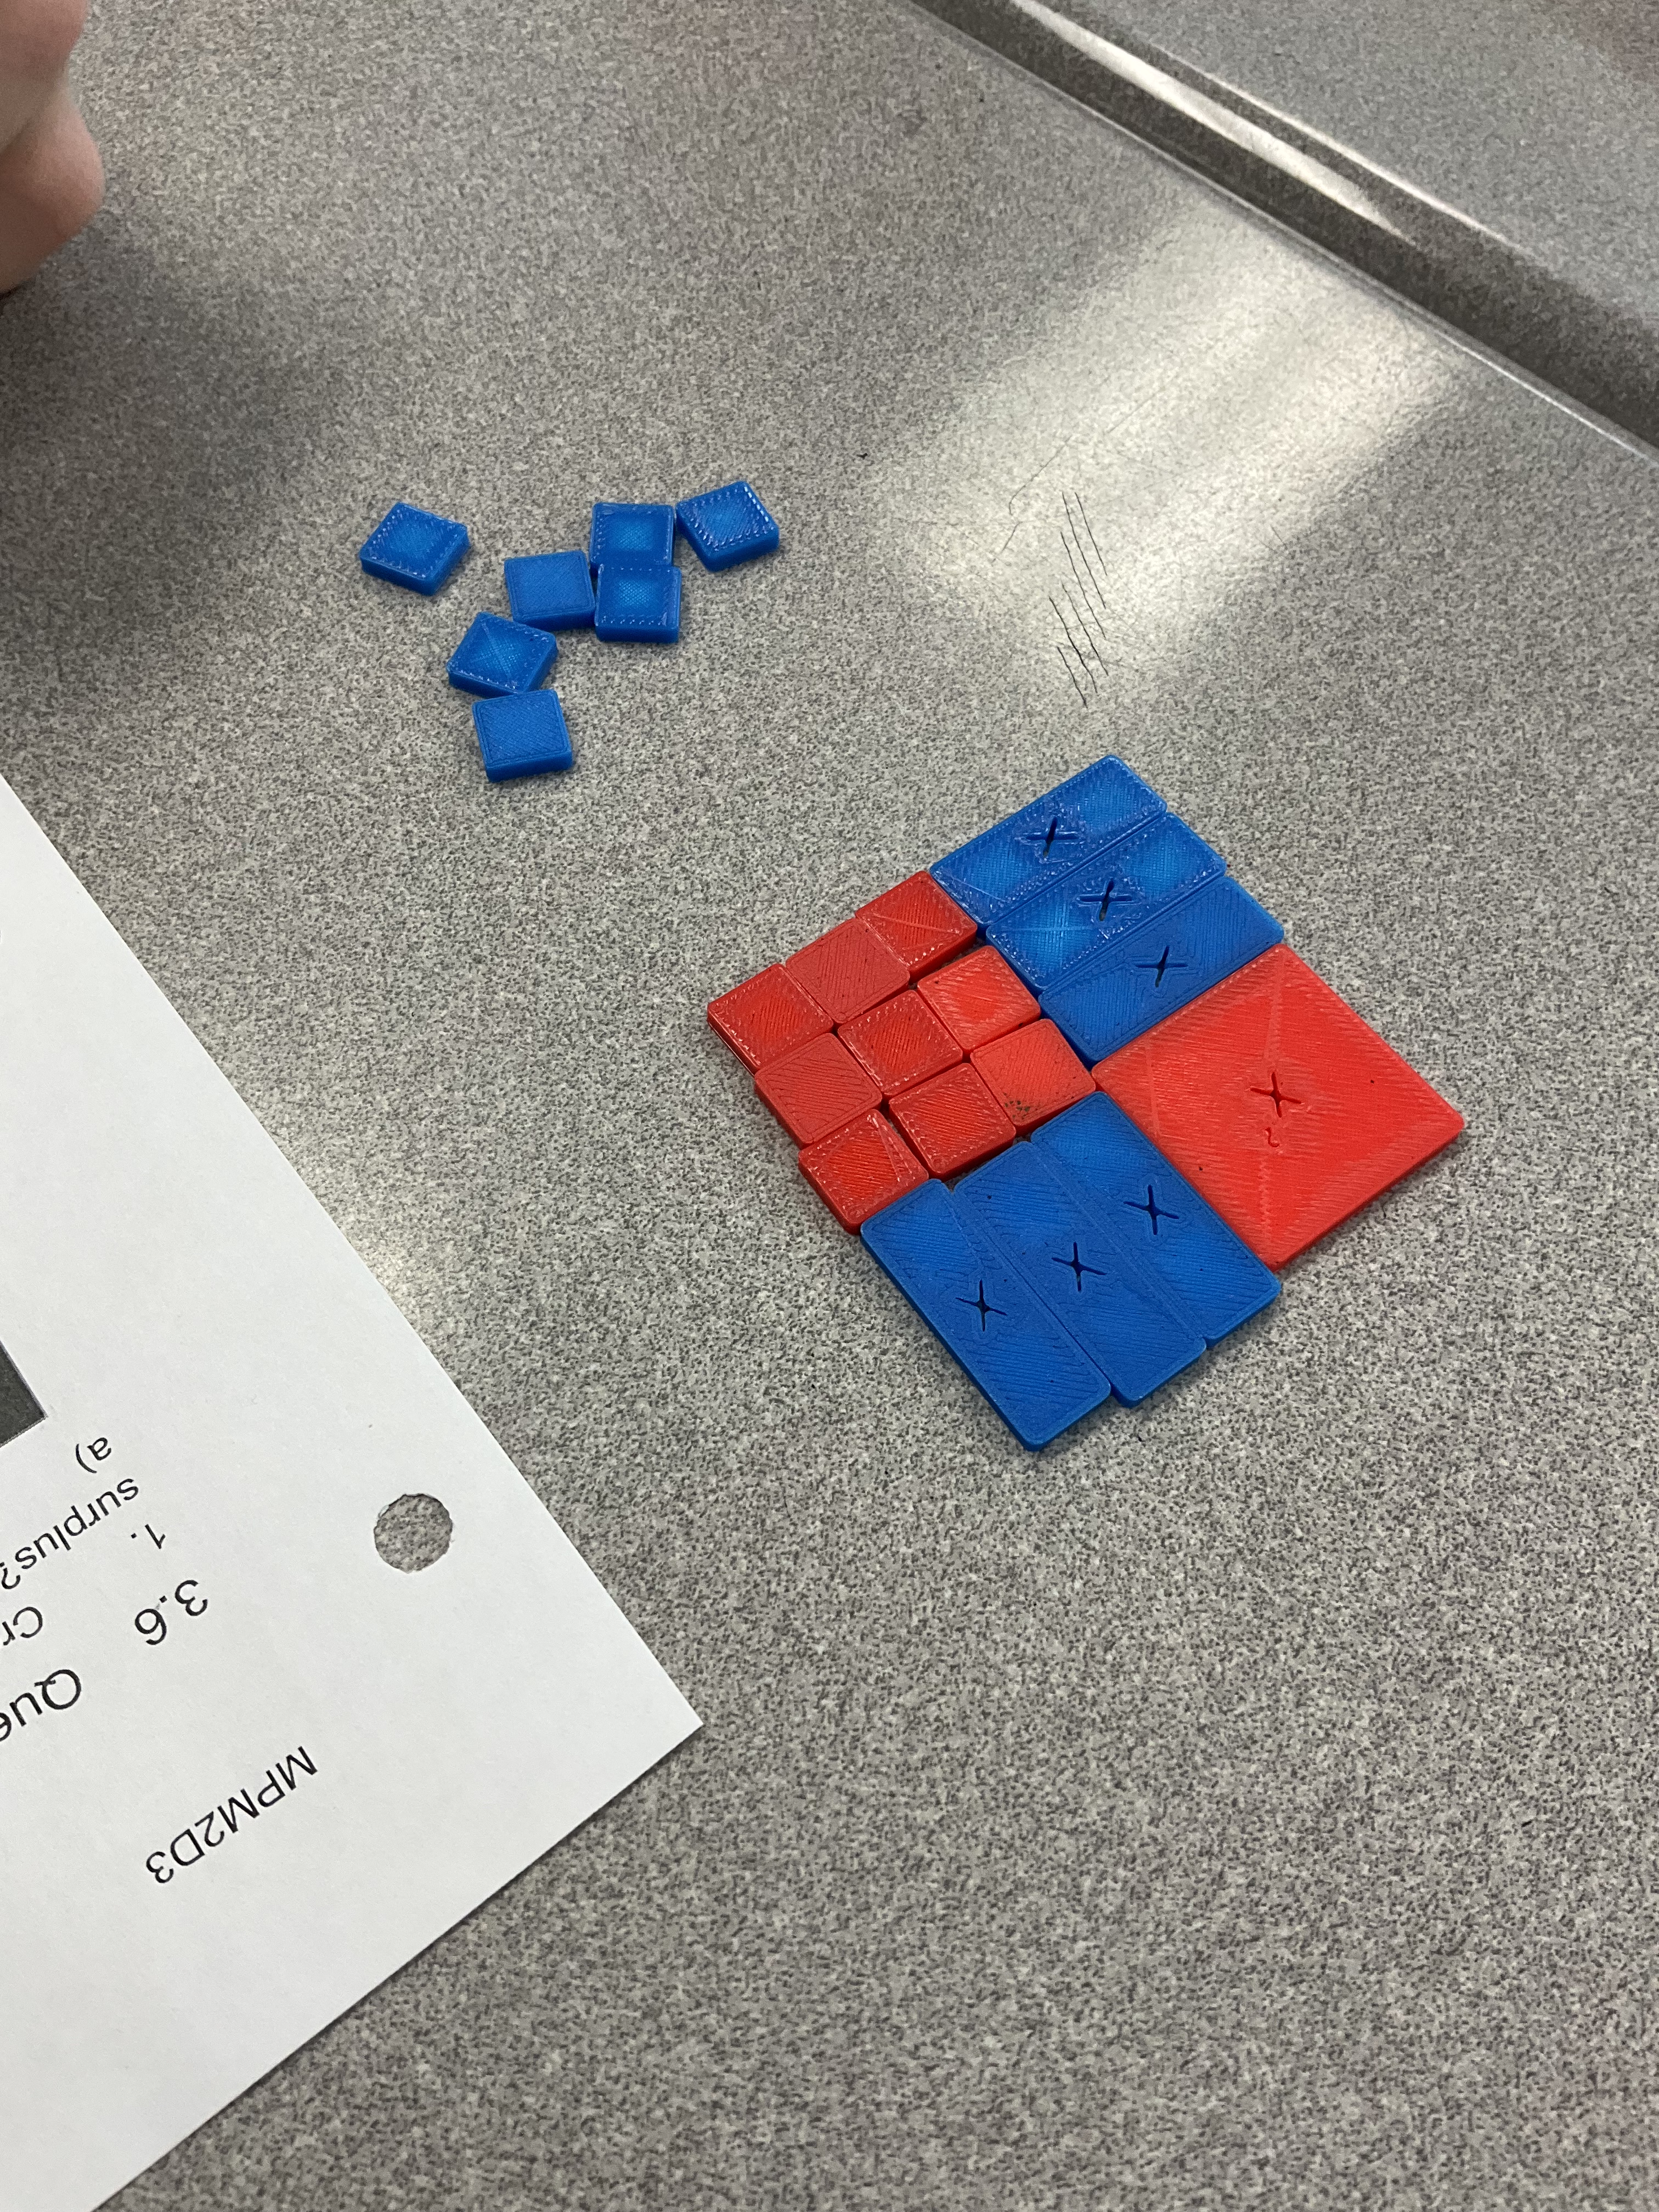
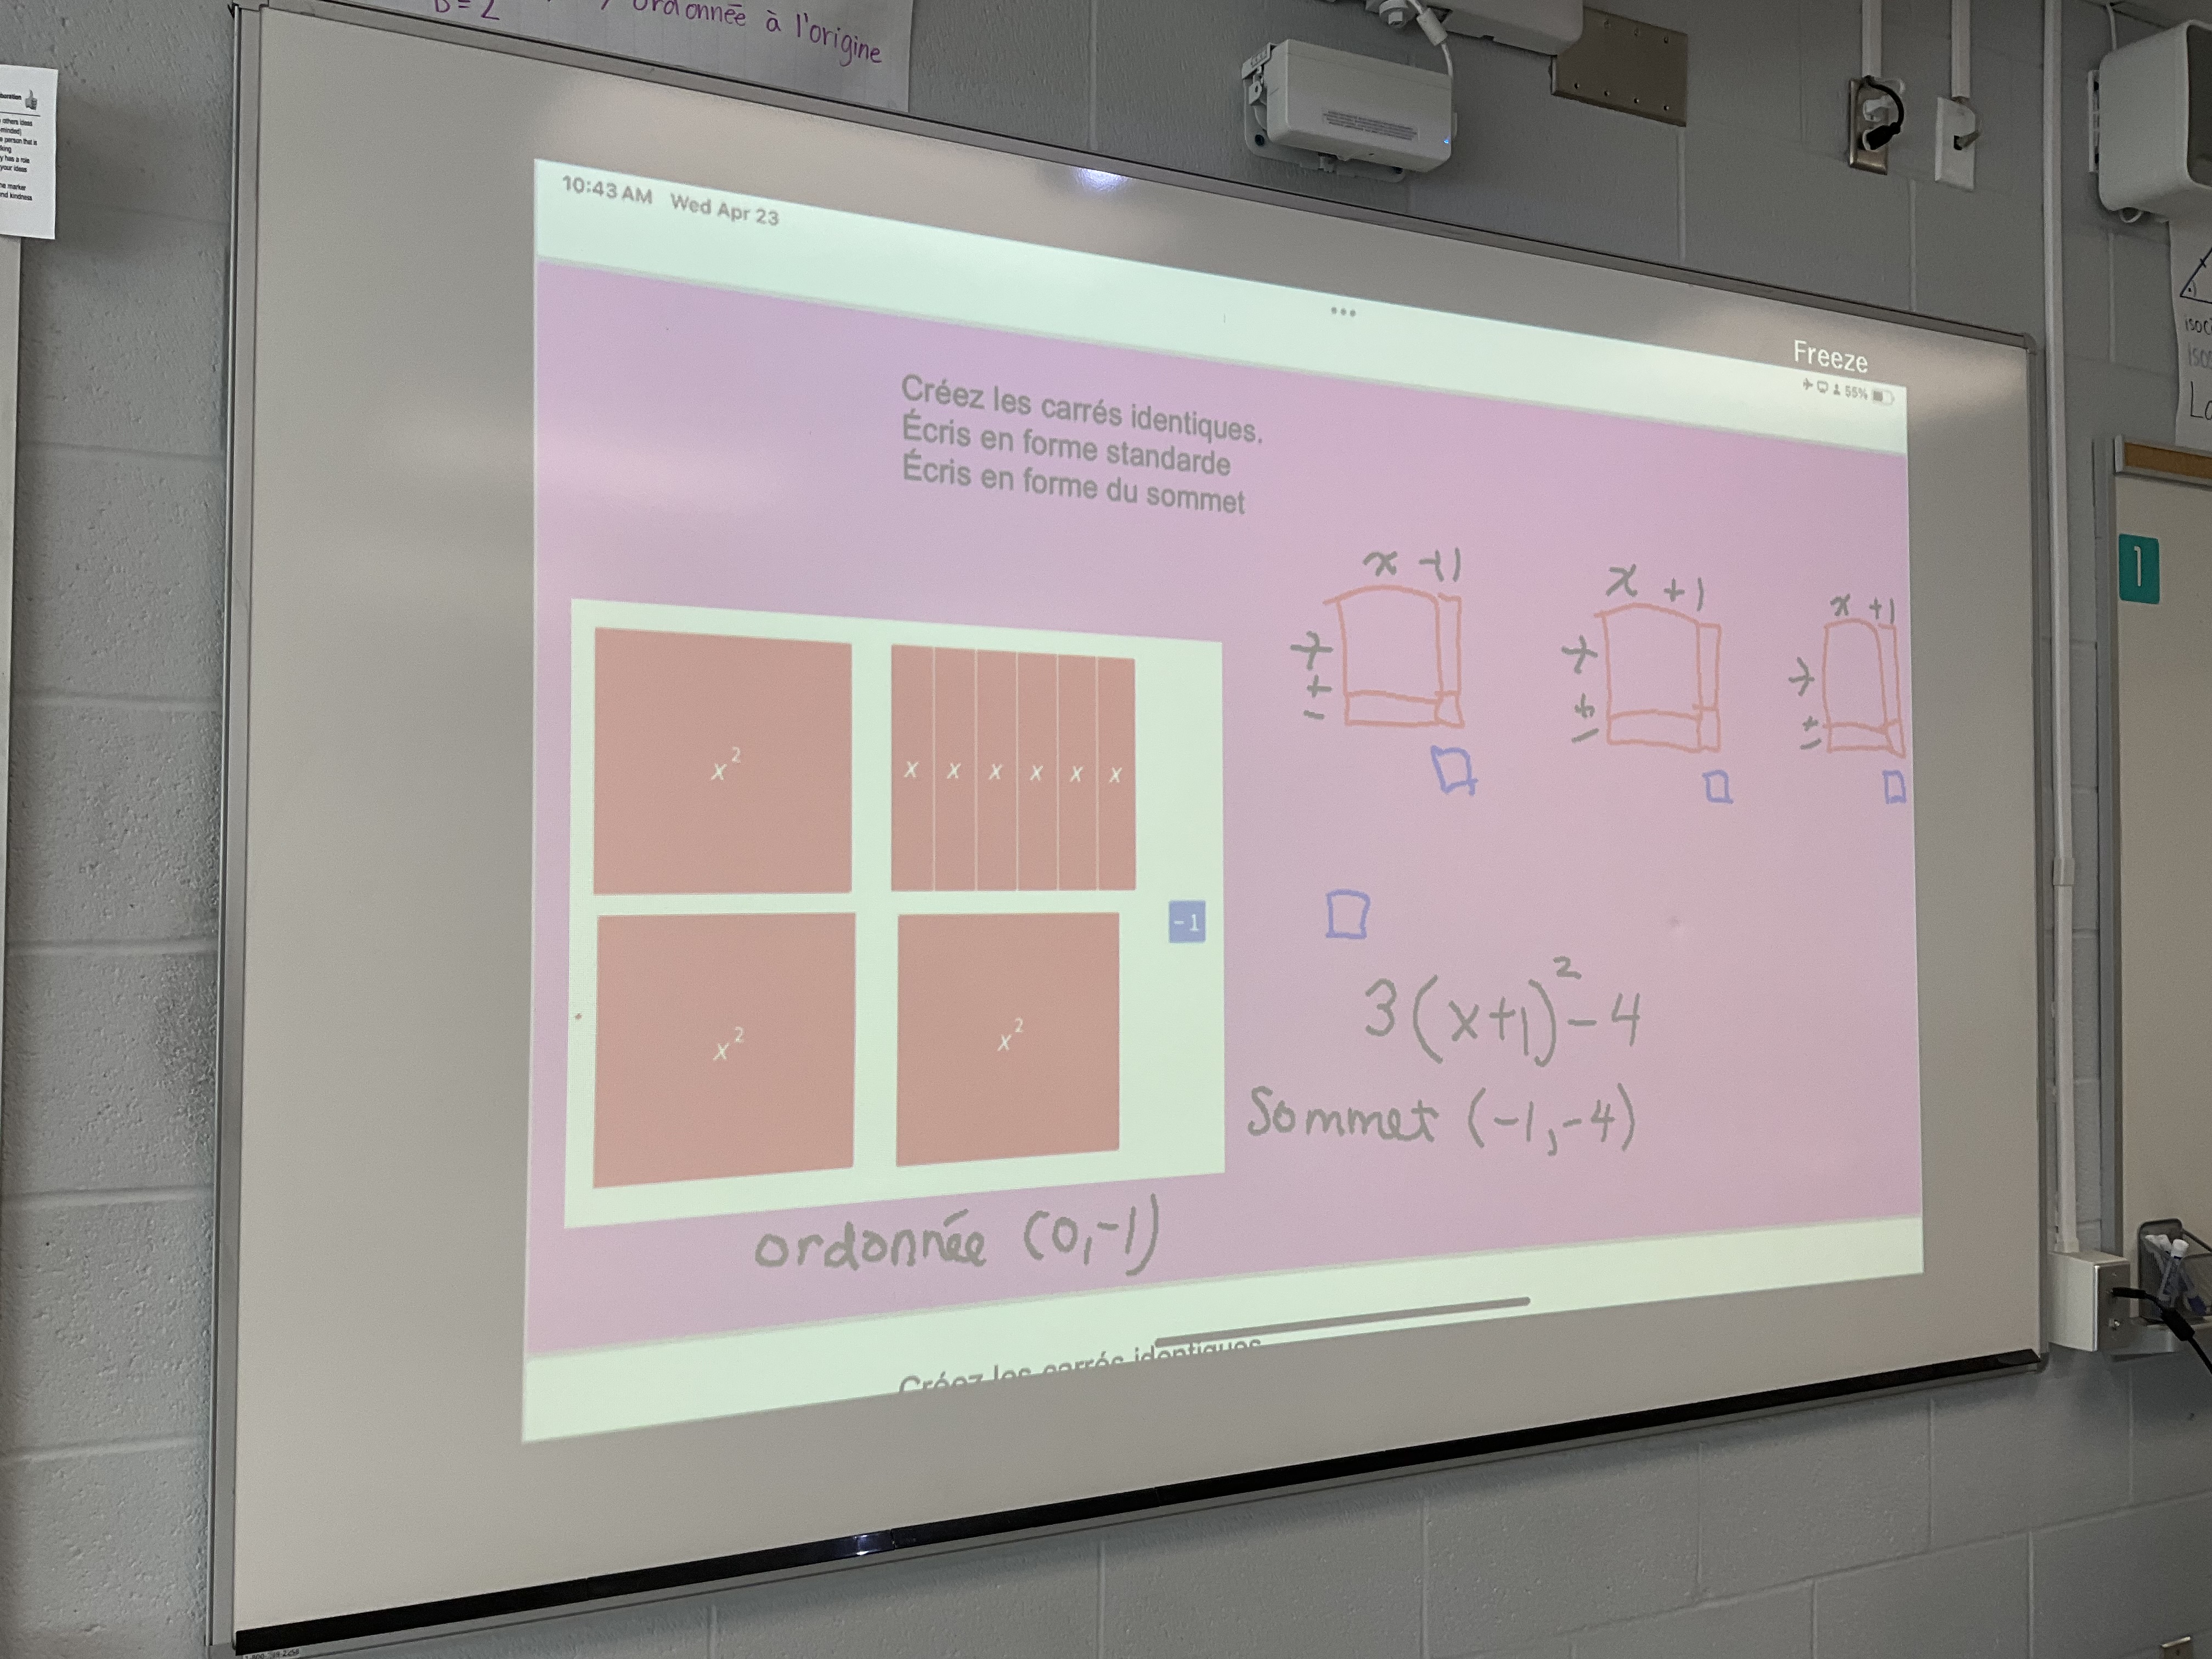
when we have a leading coefficient we are no longer completing the square, we are completing the squares (plural). Each x^2 tile is the base for an identical square.
we will be working on vertex form and graphing over the next while.
algebra tiles are a great low-tech solution for teaching engaging lessons while faced with a network outage. It appears we’re working without internet, online class resources, and very limited access to printing for the foreseeable future. Glad to have the consistency of tiles and graph paper, and lots of whiteboard markers. We will still be able to make great use of our time.
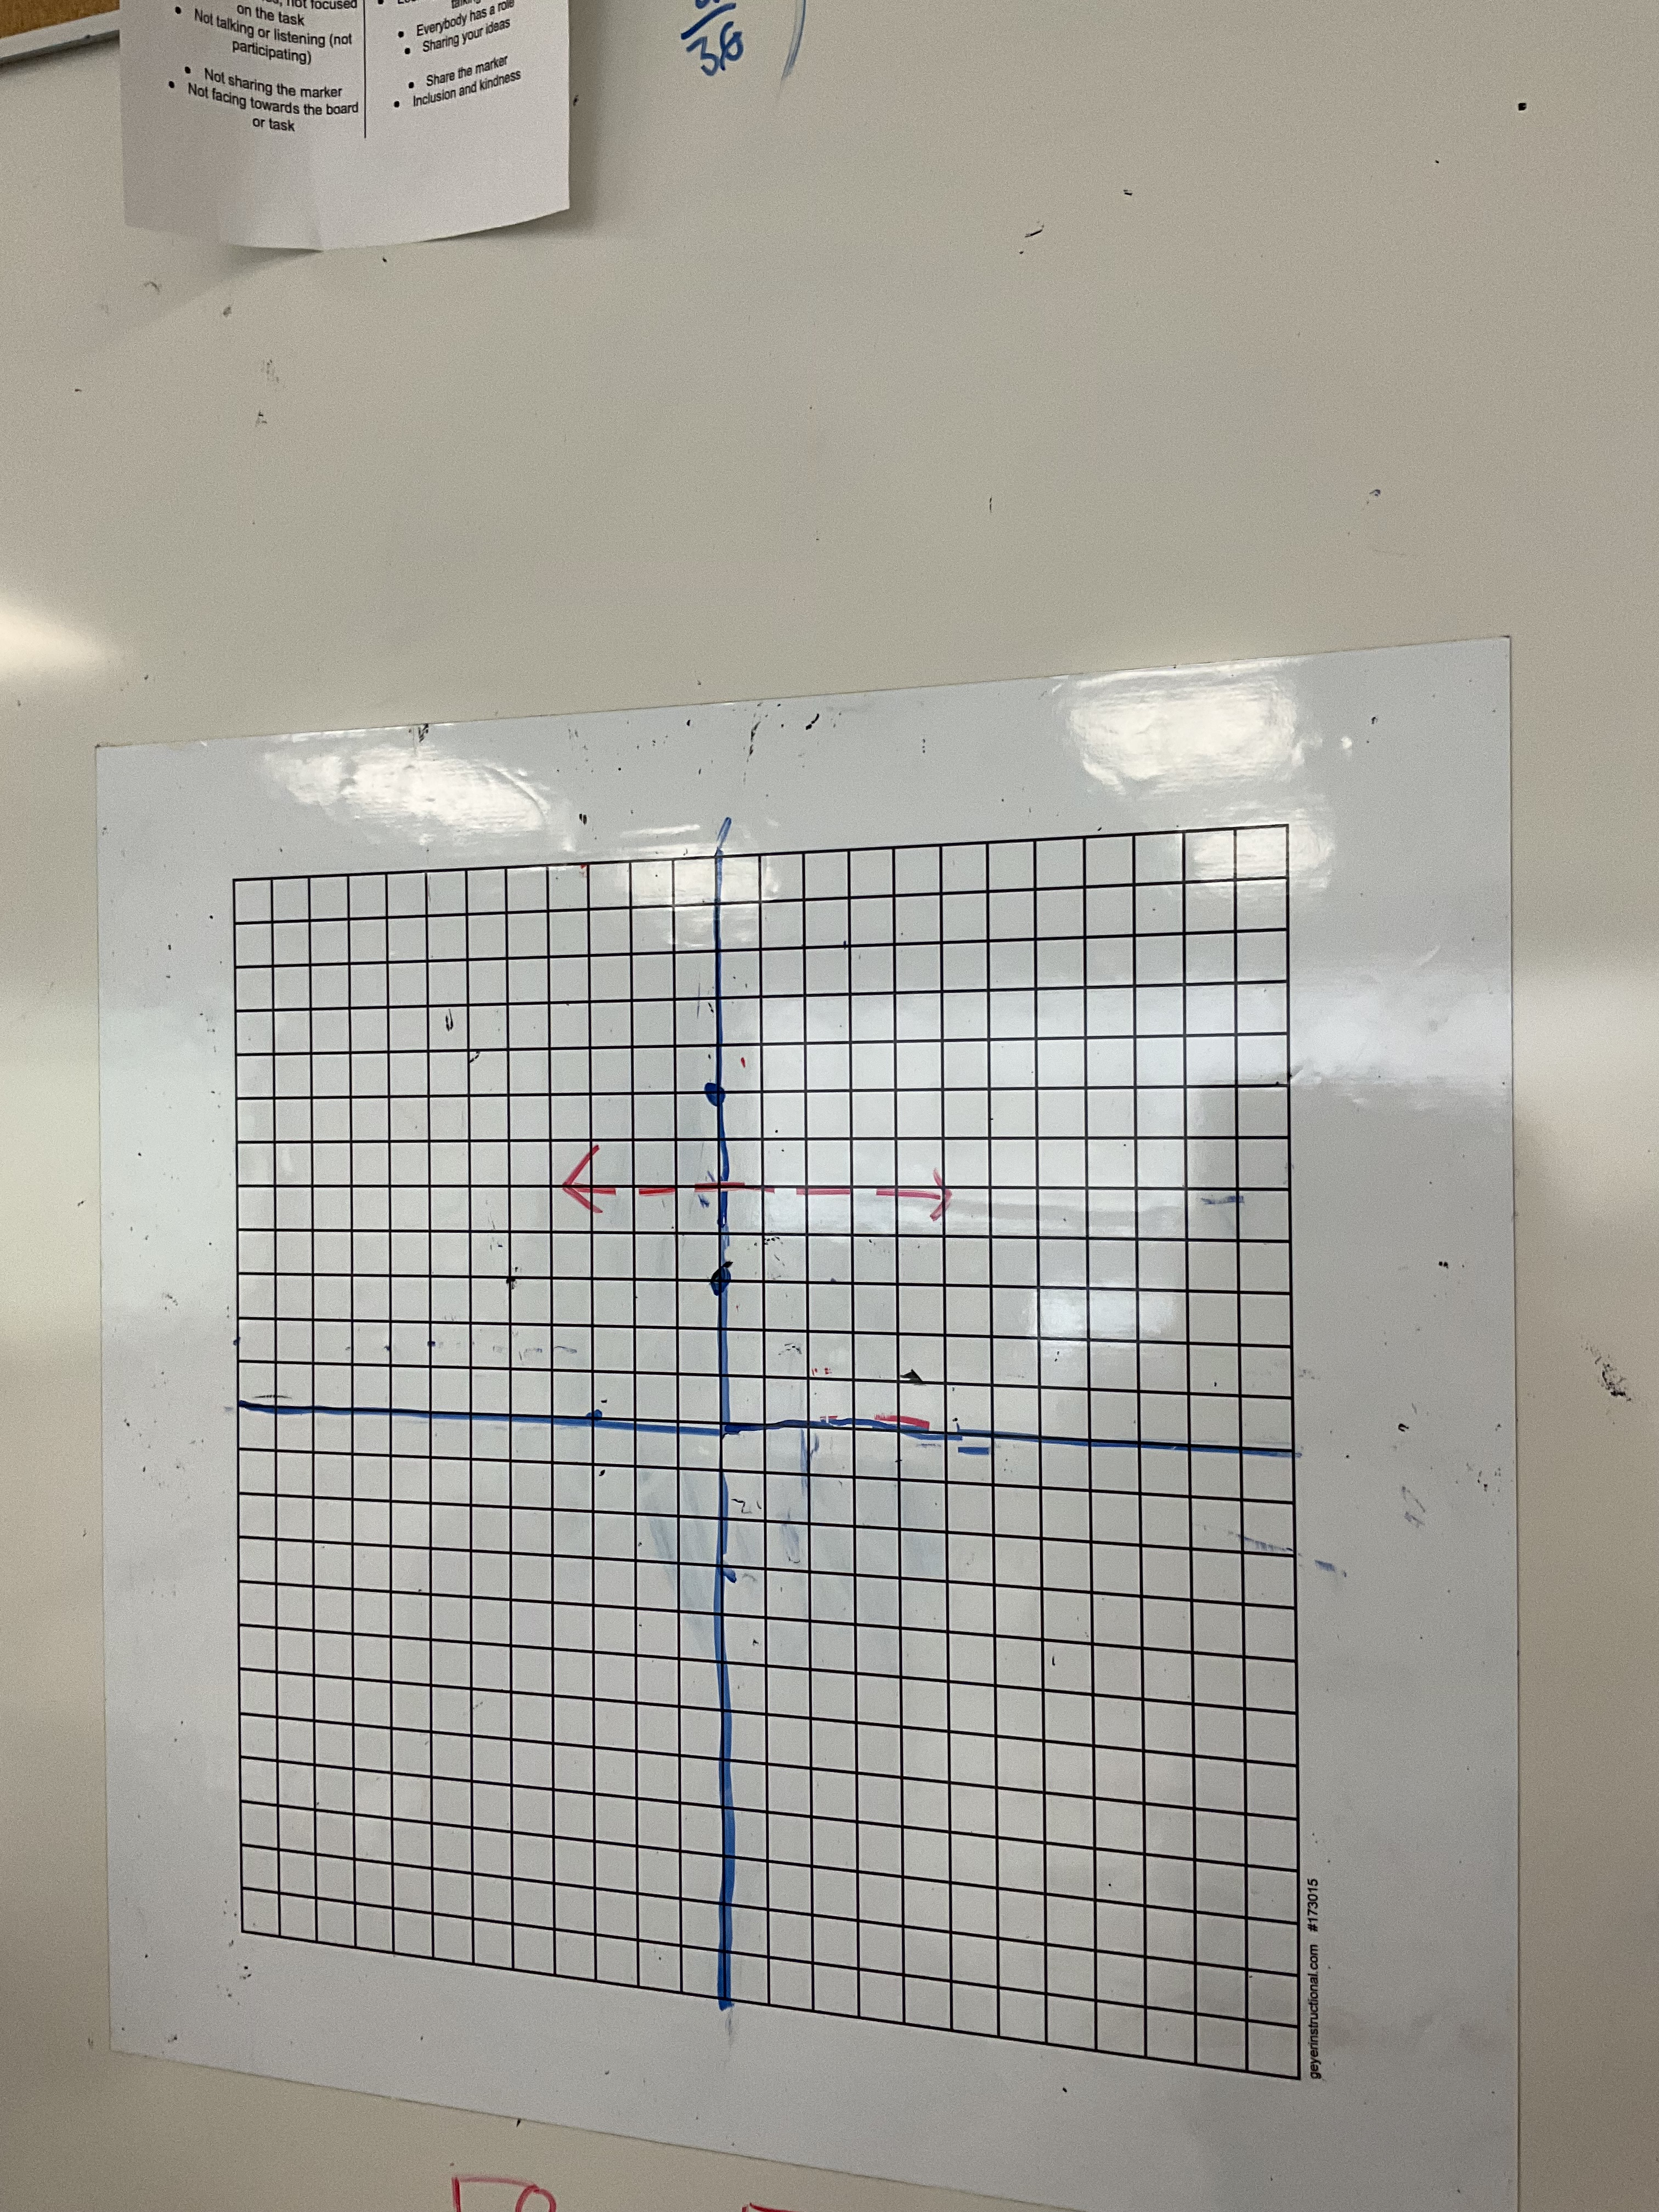
Perpendicular Bisector
We worked on perpendicular bisectors in grade 10 math. The challenge was to locate the points A(-3,0) and B(5,0), and then to find as many points as possible that were an equal distance to A and B.
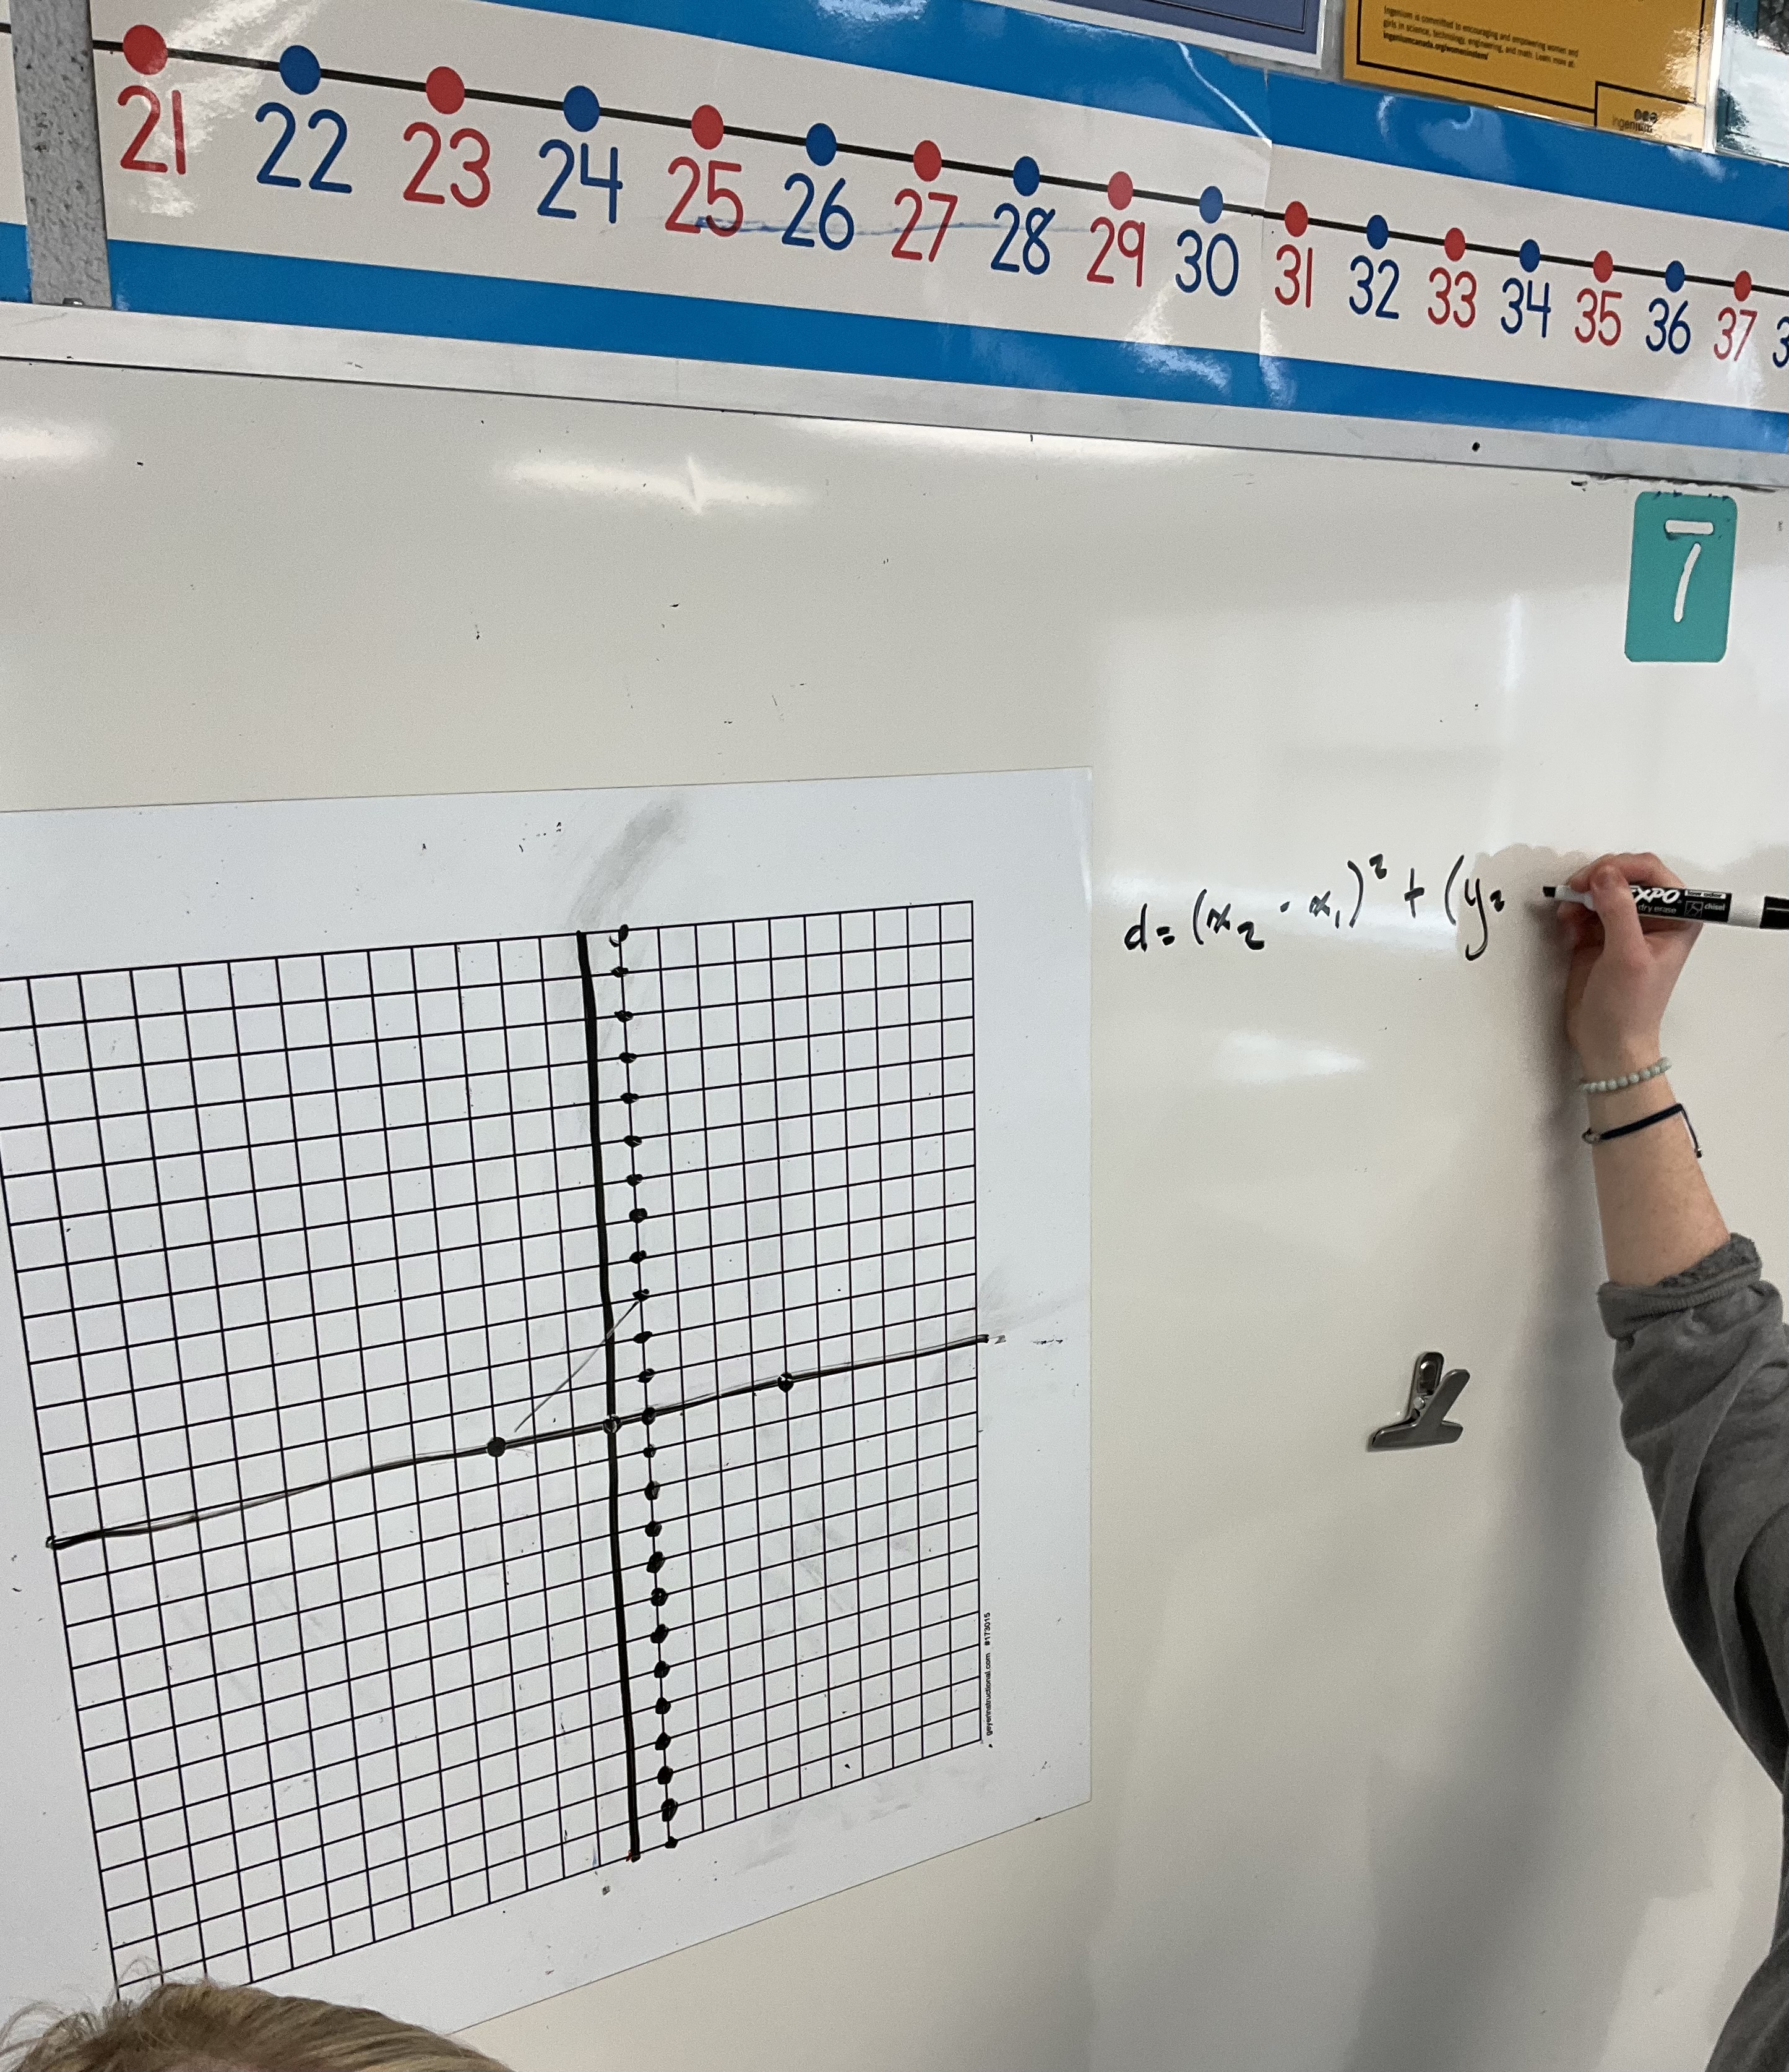
We had a discussion about how we knew that these points were all the same distance to A and B, by using the distance formula/pythagorean theorem.
We did the same task but with points A(0,3) and B(0,7). We noticed that the line of equal distanced points is perpendicular to the initial segment, and went through the midpoint.
The next challenge was to use the points A(1,2) and B(3,6)
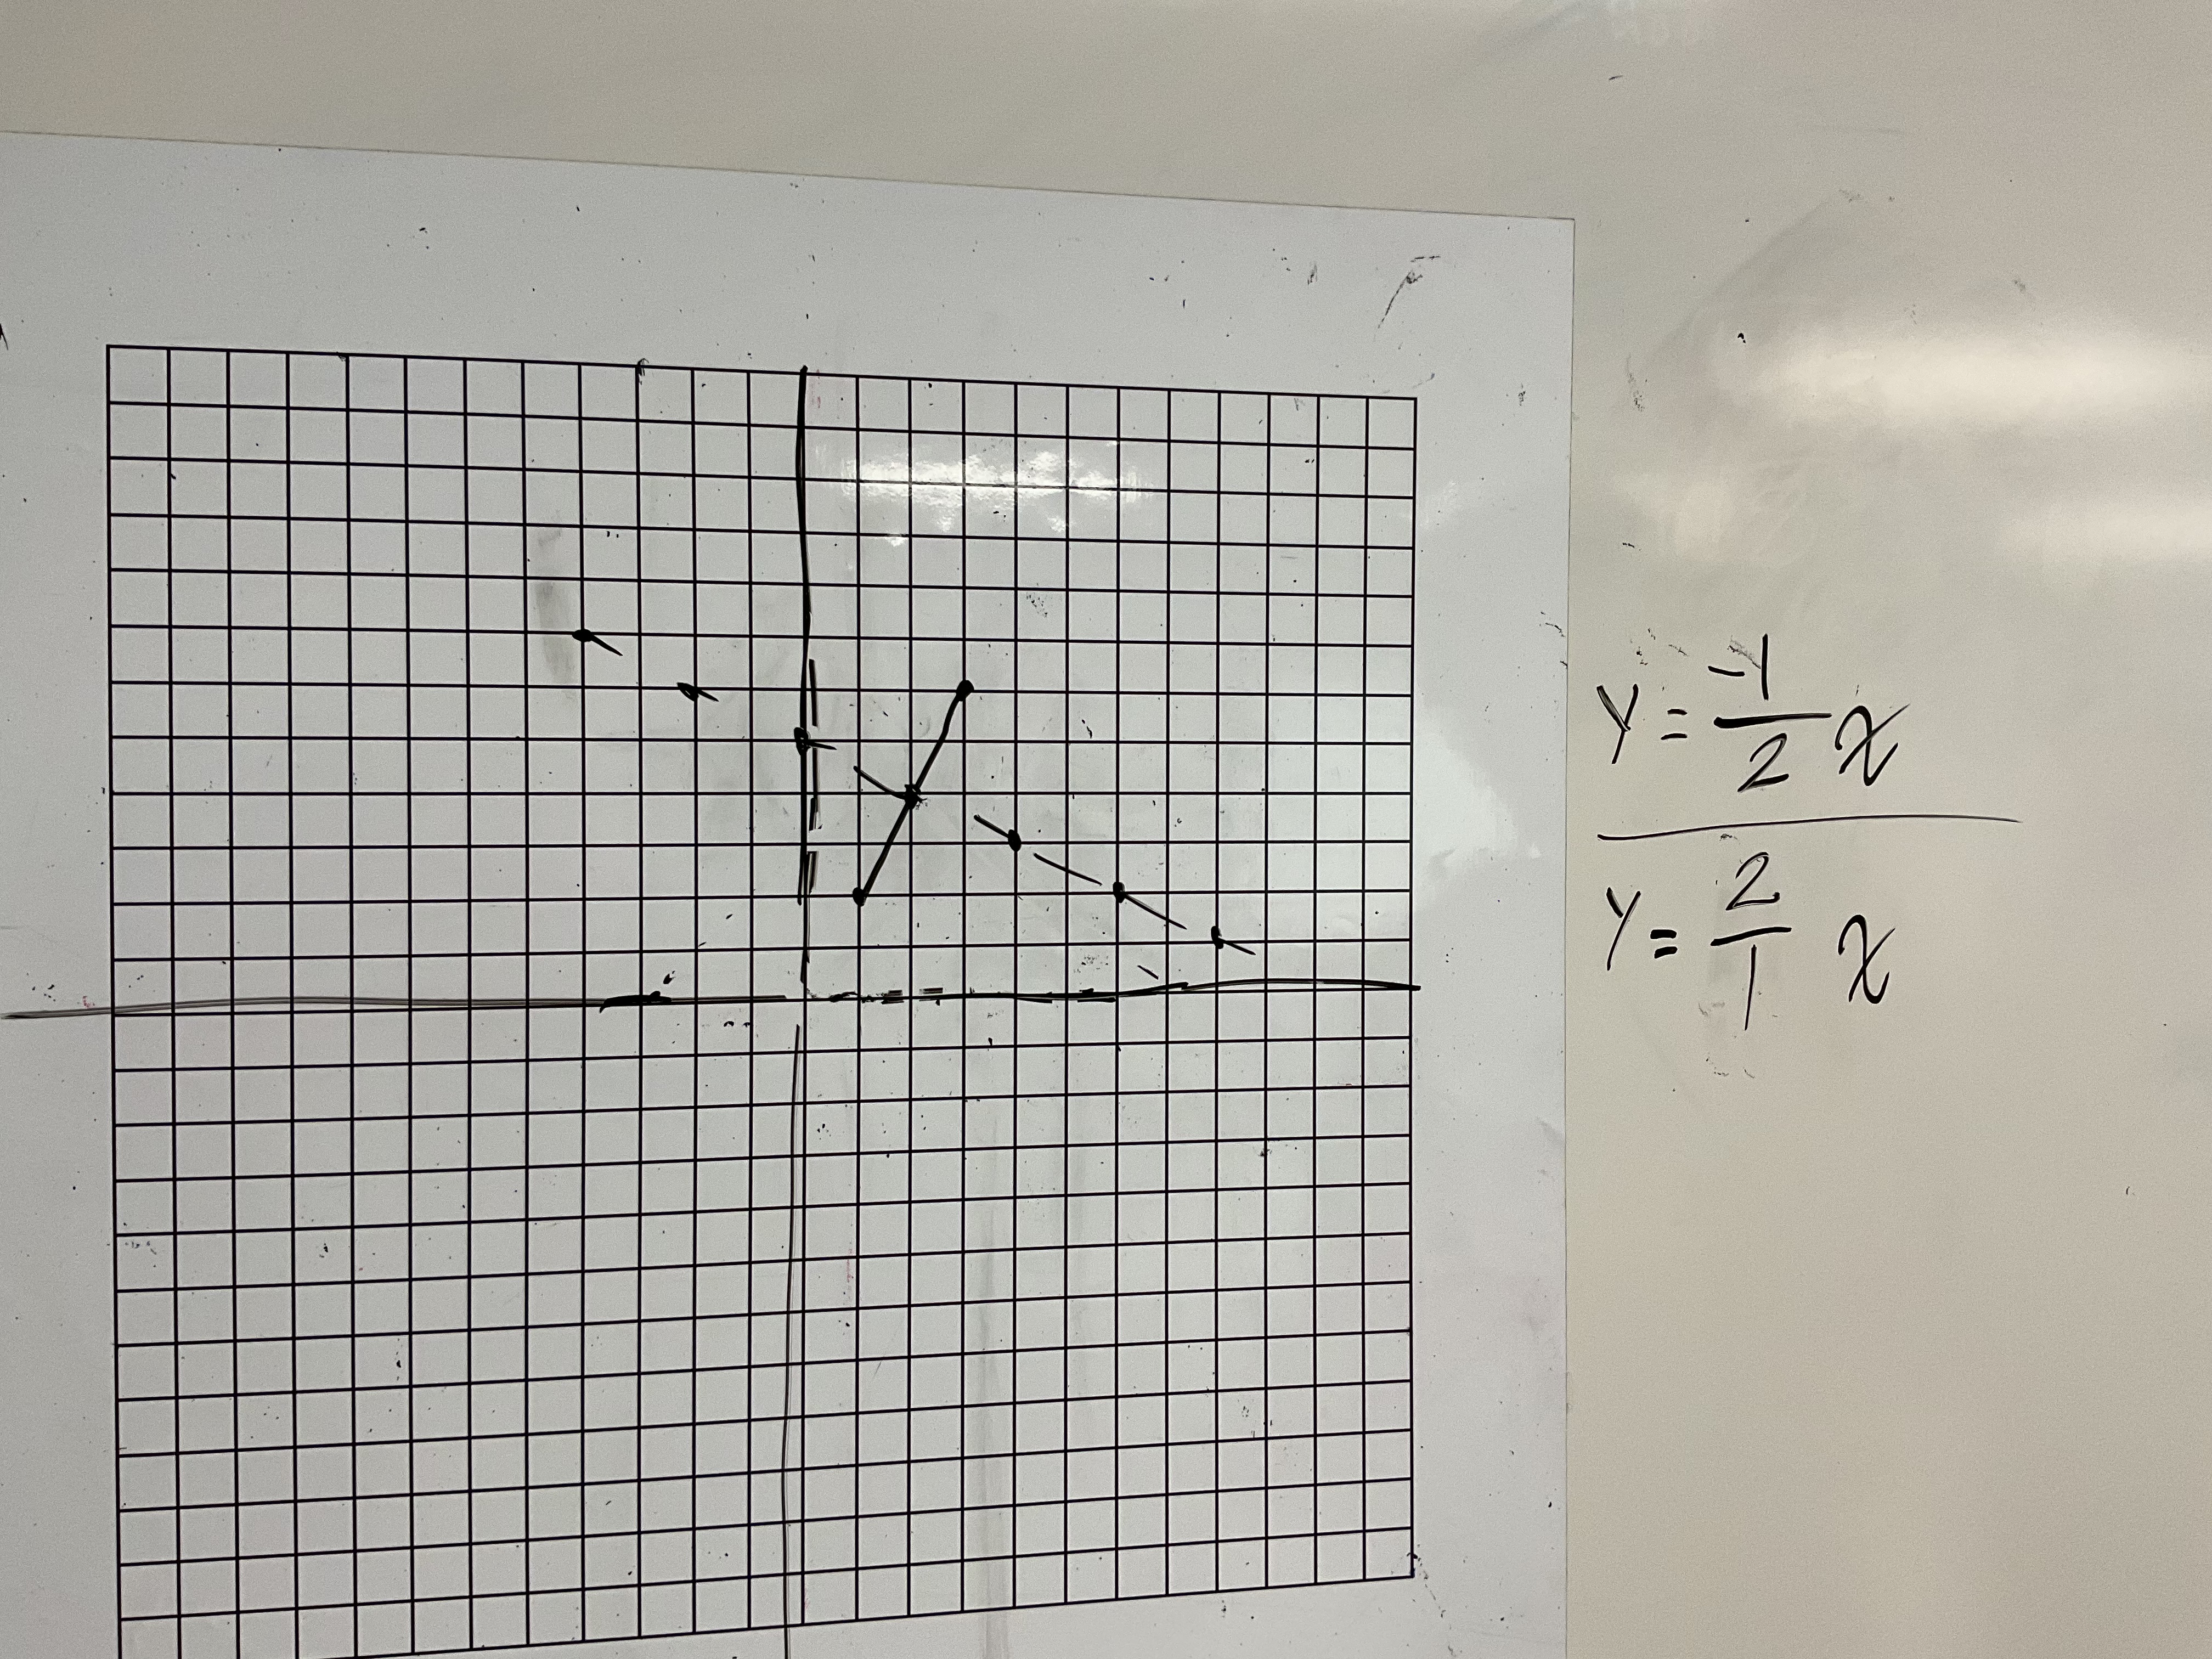
we know that the slope of the segment is 2/1 so the slope of the line we draw is -1/2. We know the line goes through the midpoint, and we’re great at calculating midpoints!
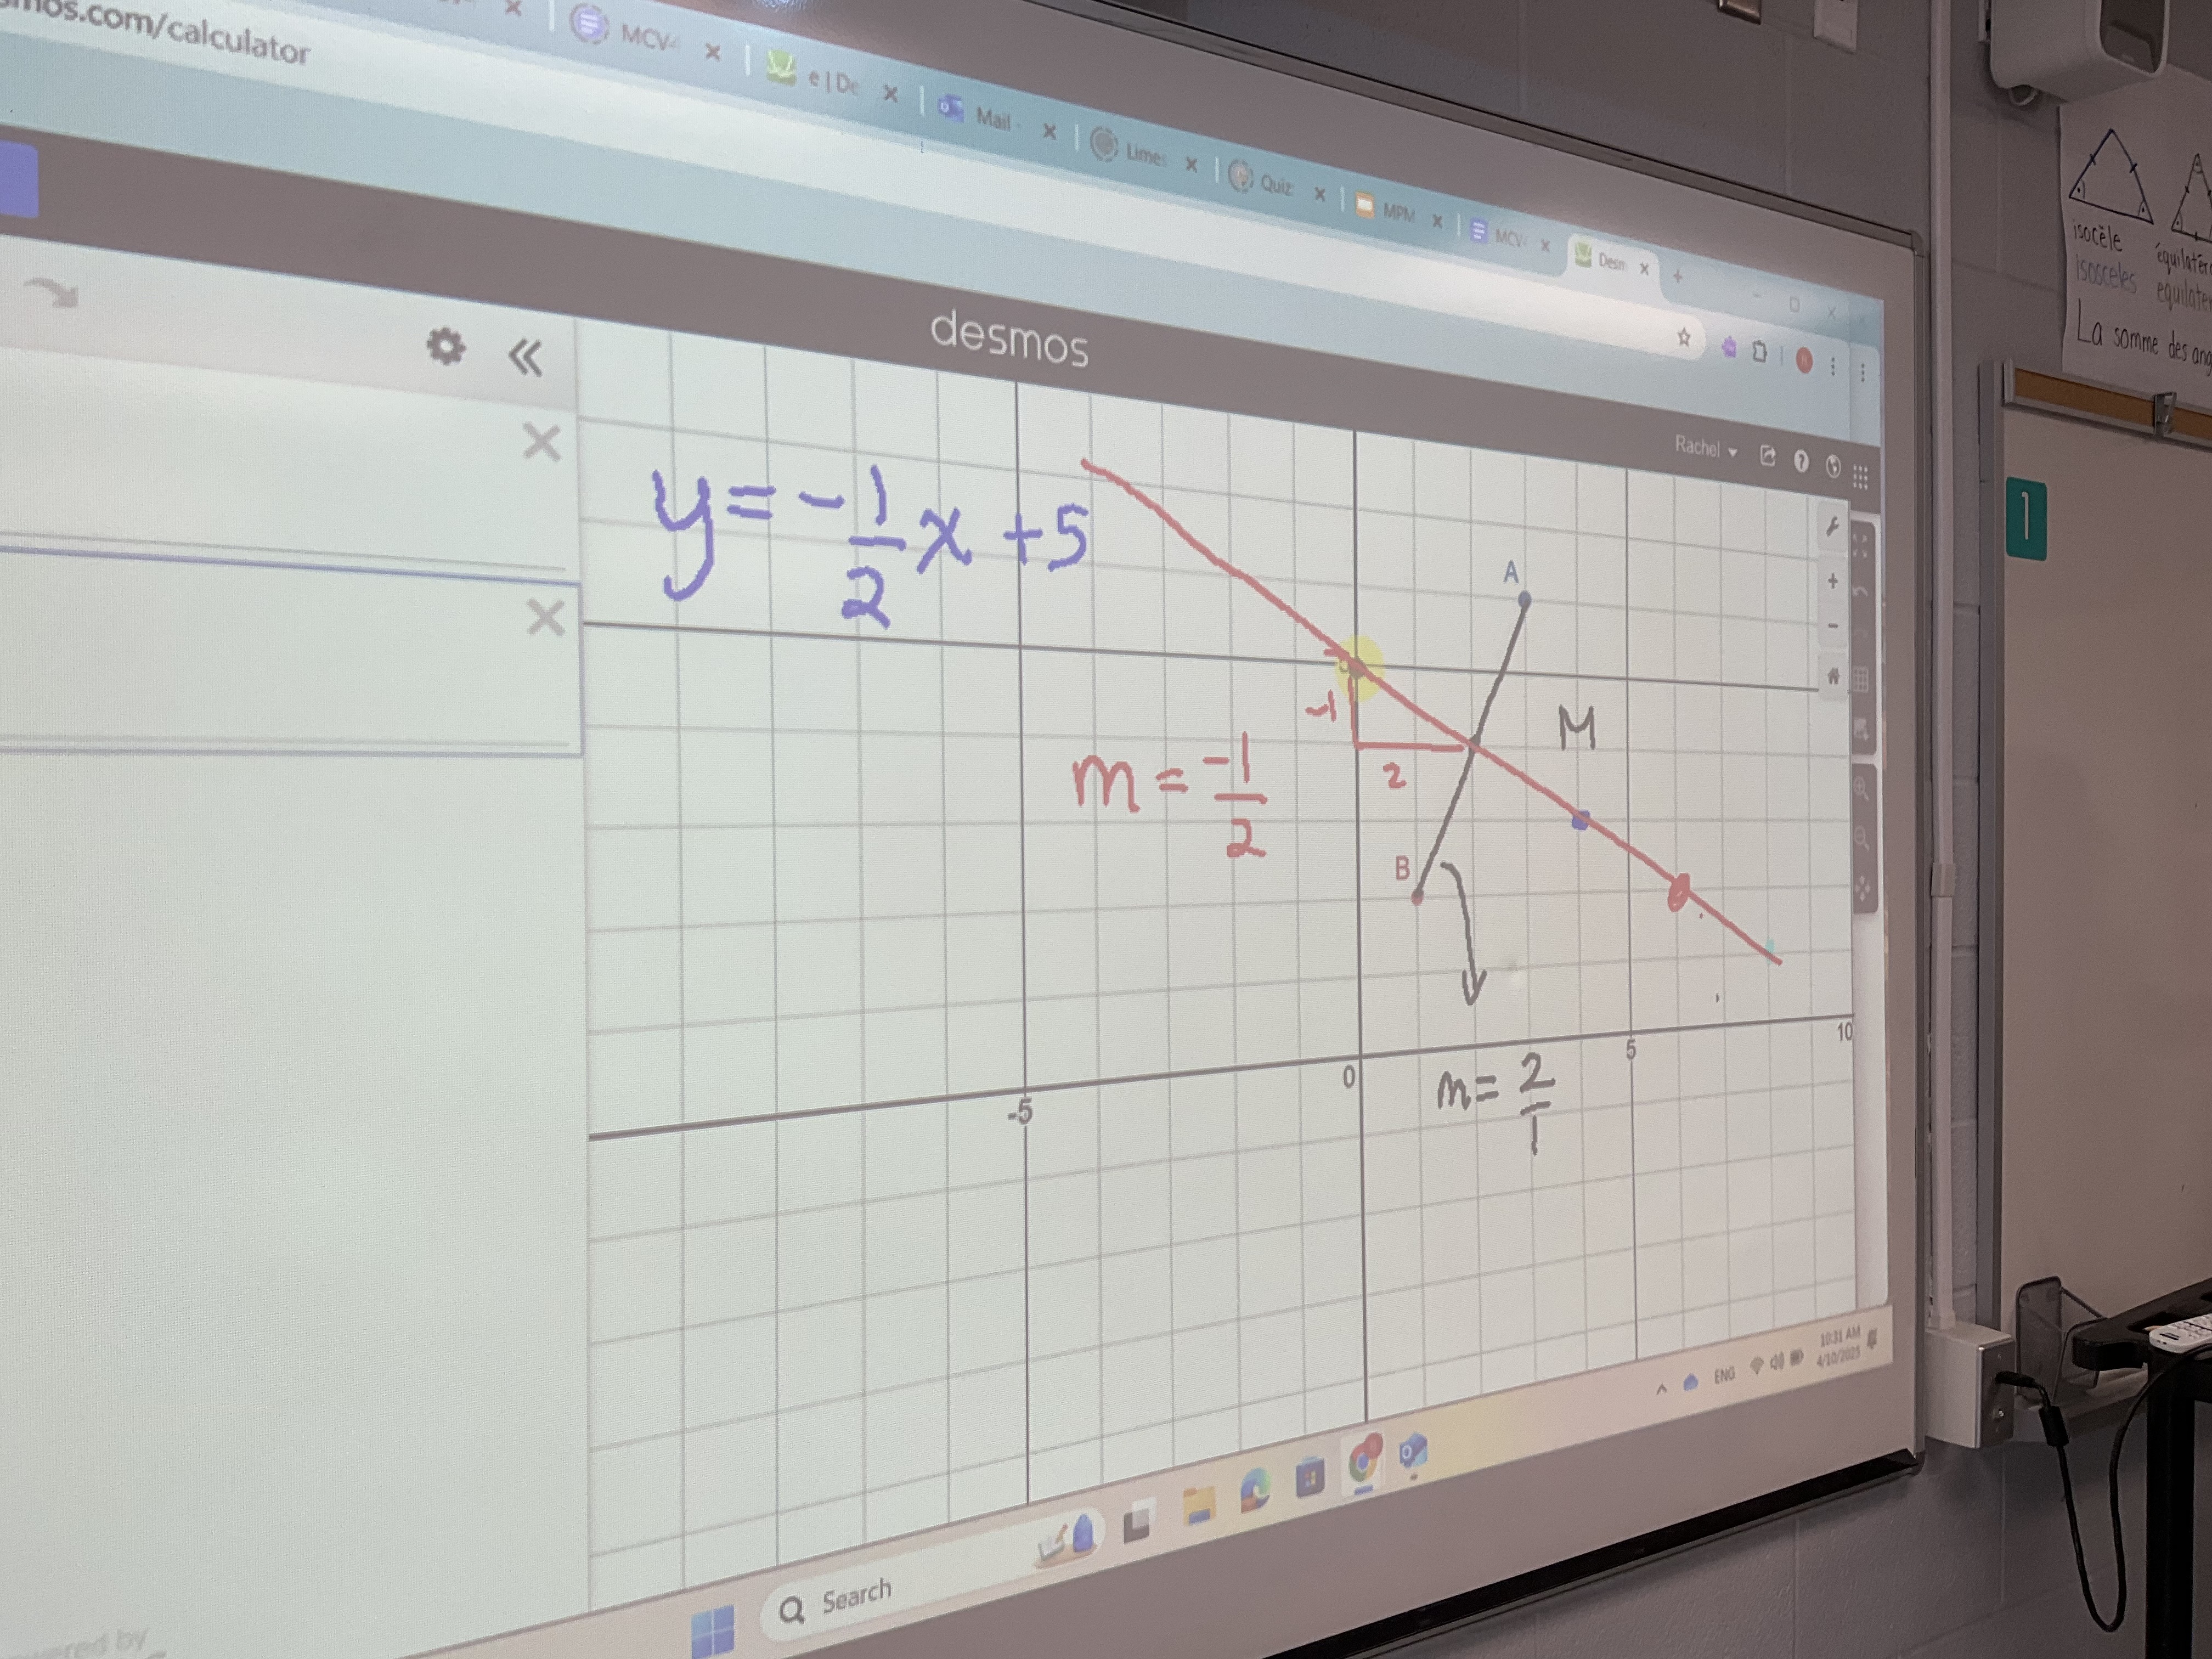
Our final step is to make the equation of the line, which we learned is called the perpendicular bisector (médiatrice). We’re able to use our skills from lap 1 to help us a lot with these questions.
Special Guests In Grade 10
Today we had the pleasure of welcoming Dr. Peter Taylor and several graduate students from Queen’s University, and RabbitMath to come and do some problems with us.
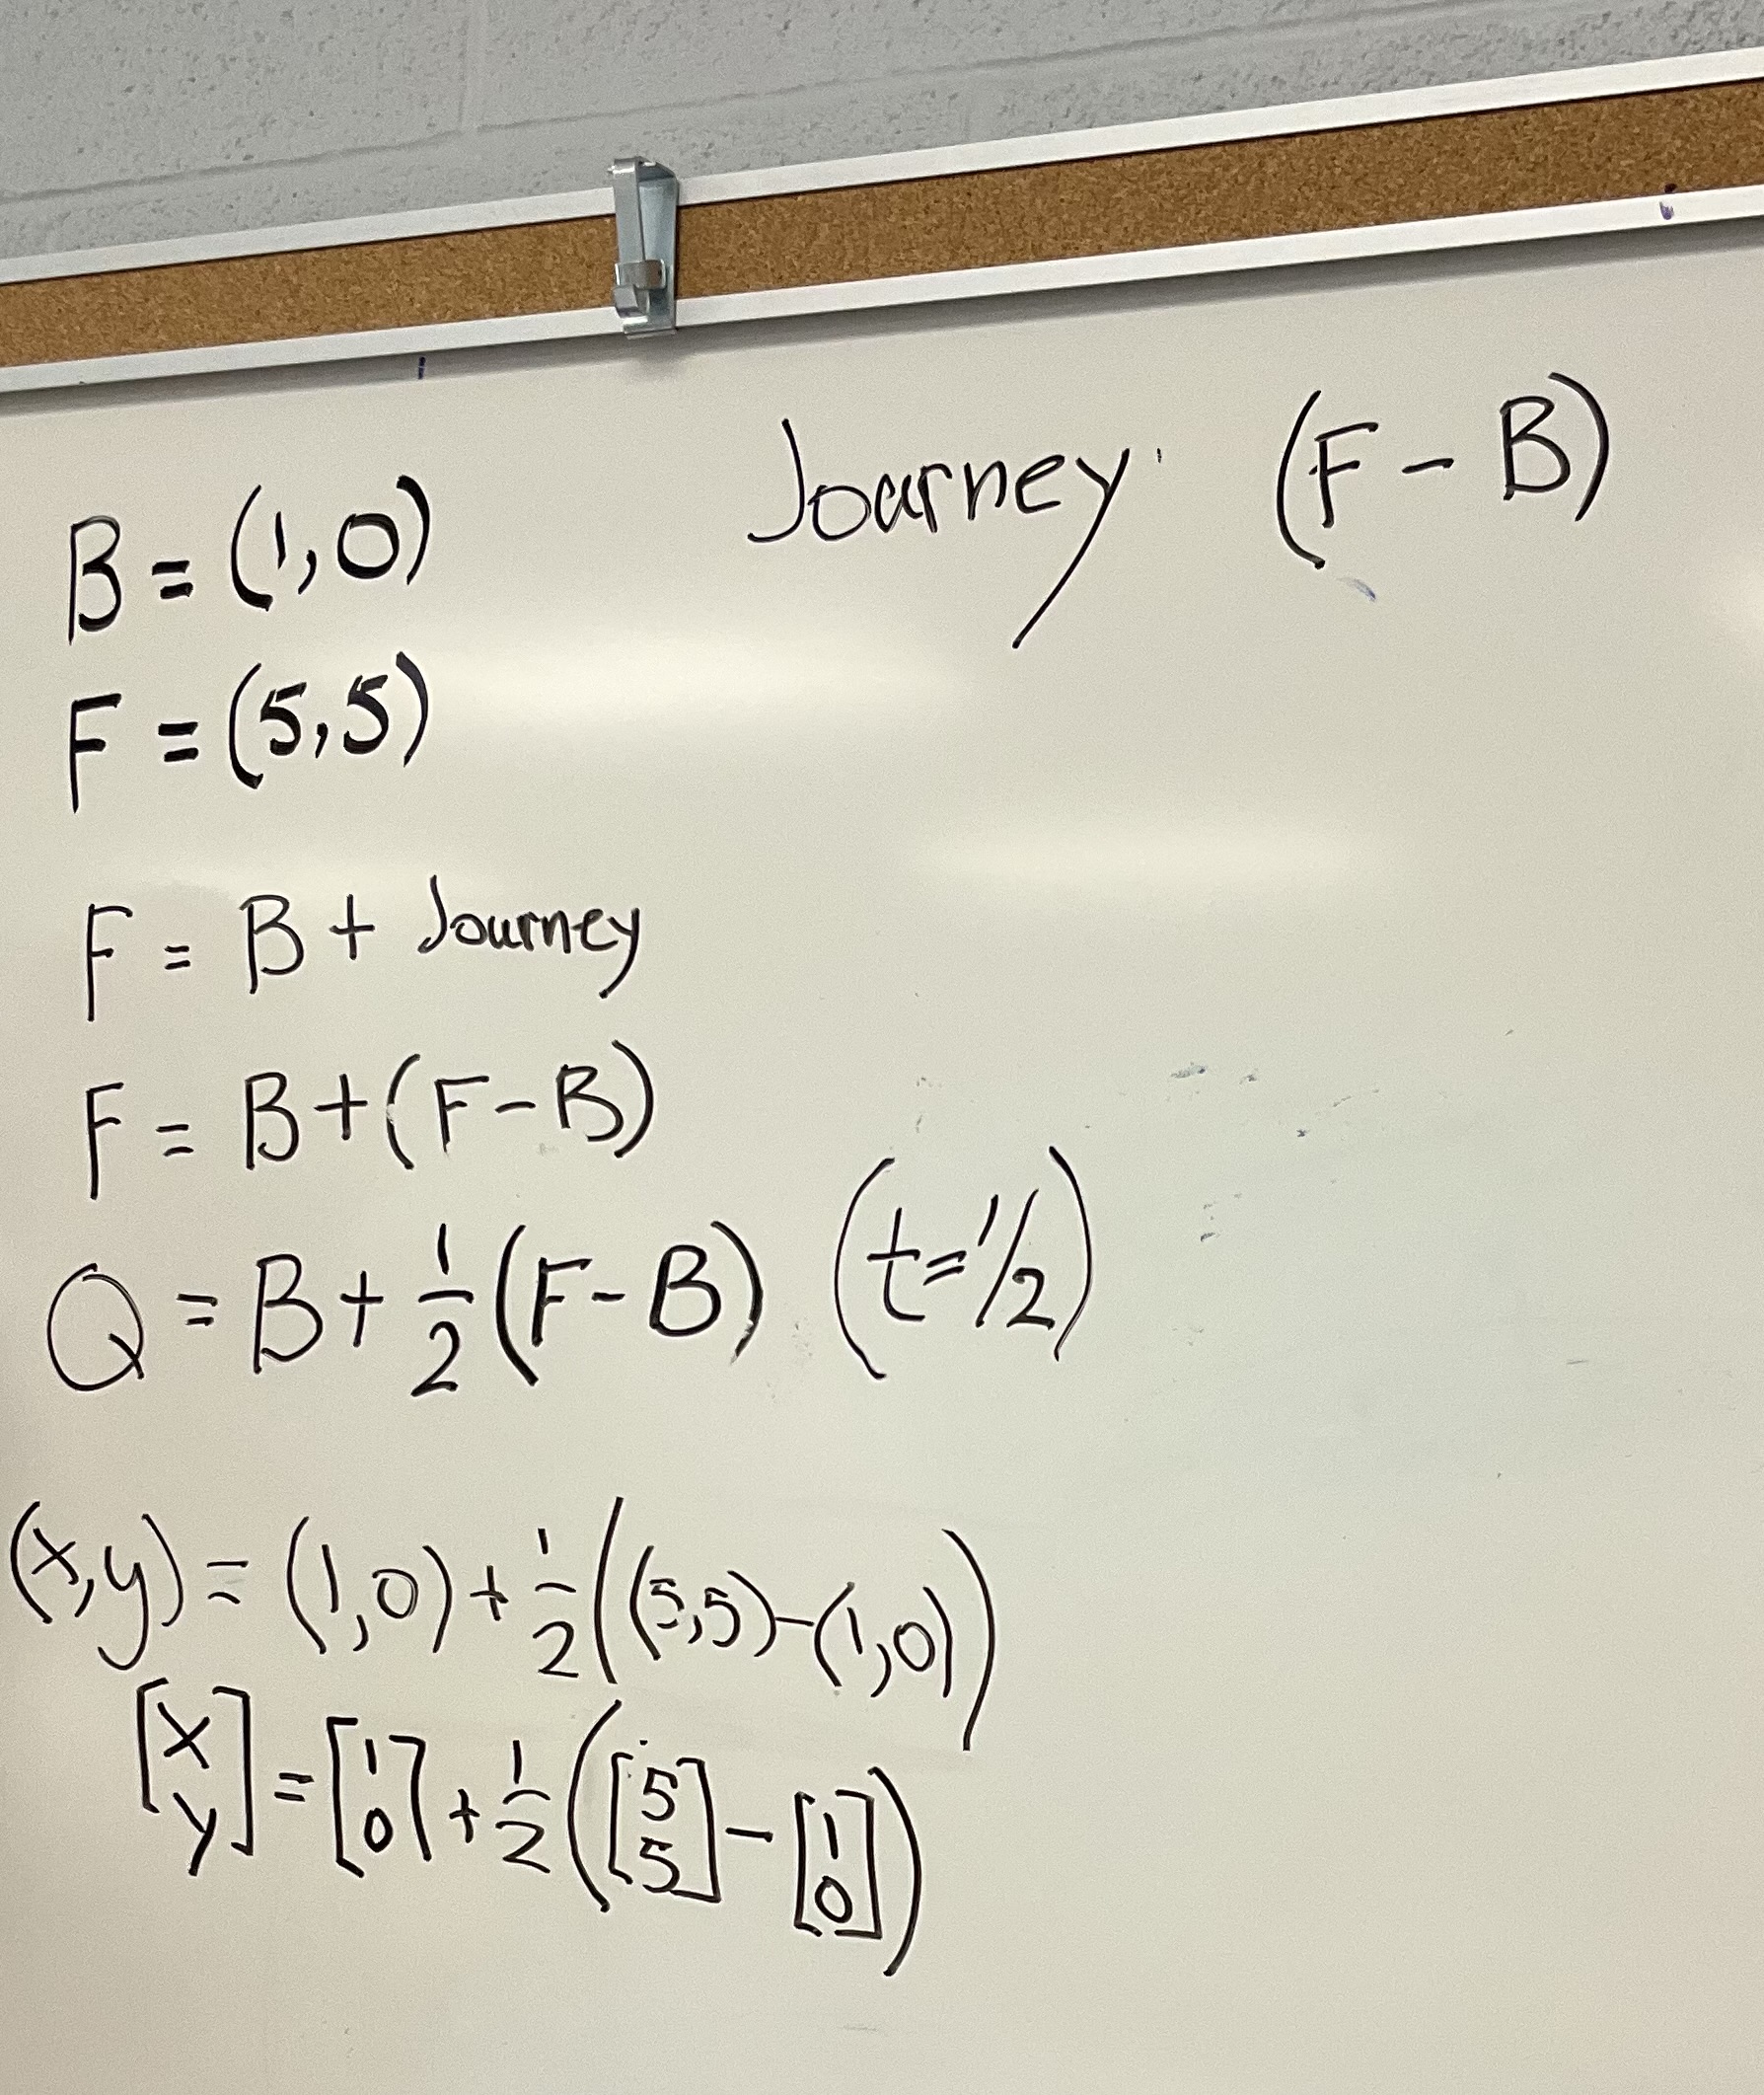
In grade 9 and 10 the problem we did was a neat one which showed a way of representing a line using a parameter. Students drew the line segment between the points (1,0) and (5,5).
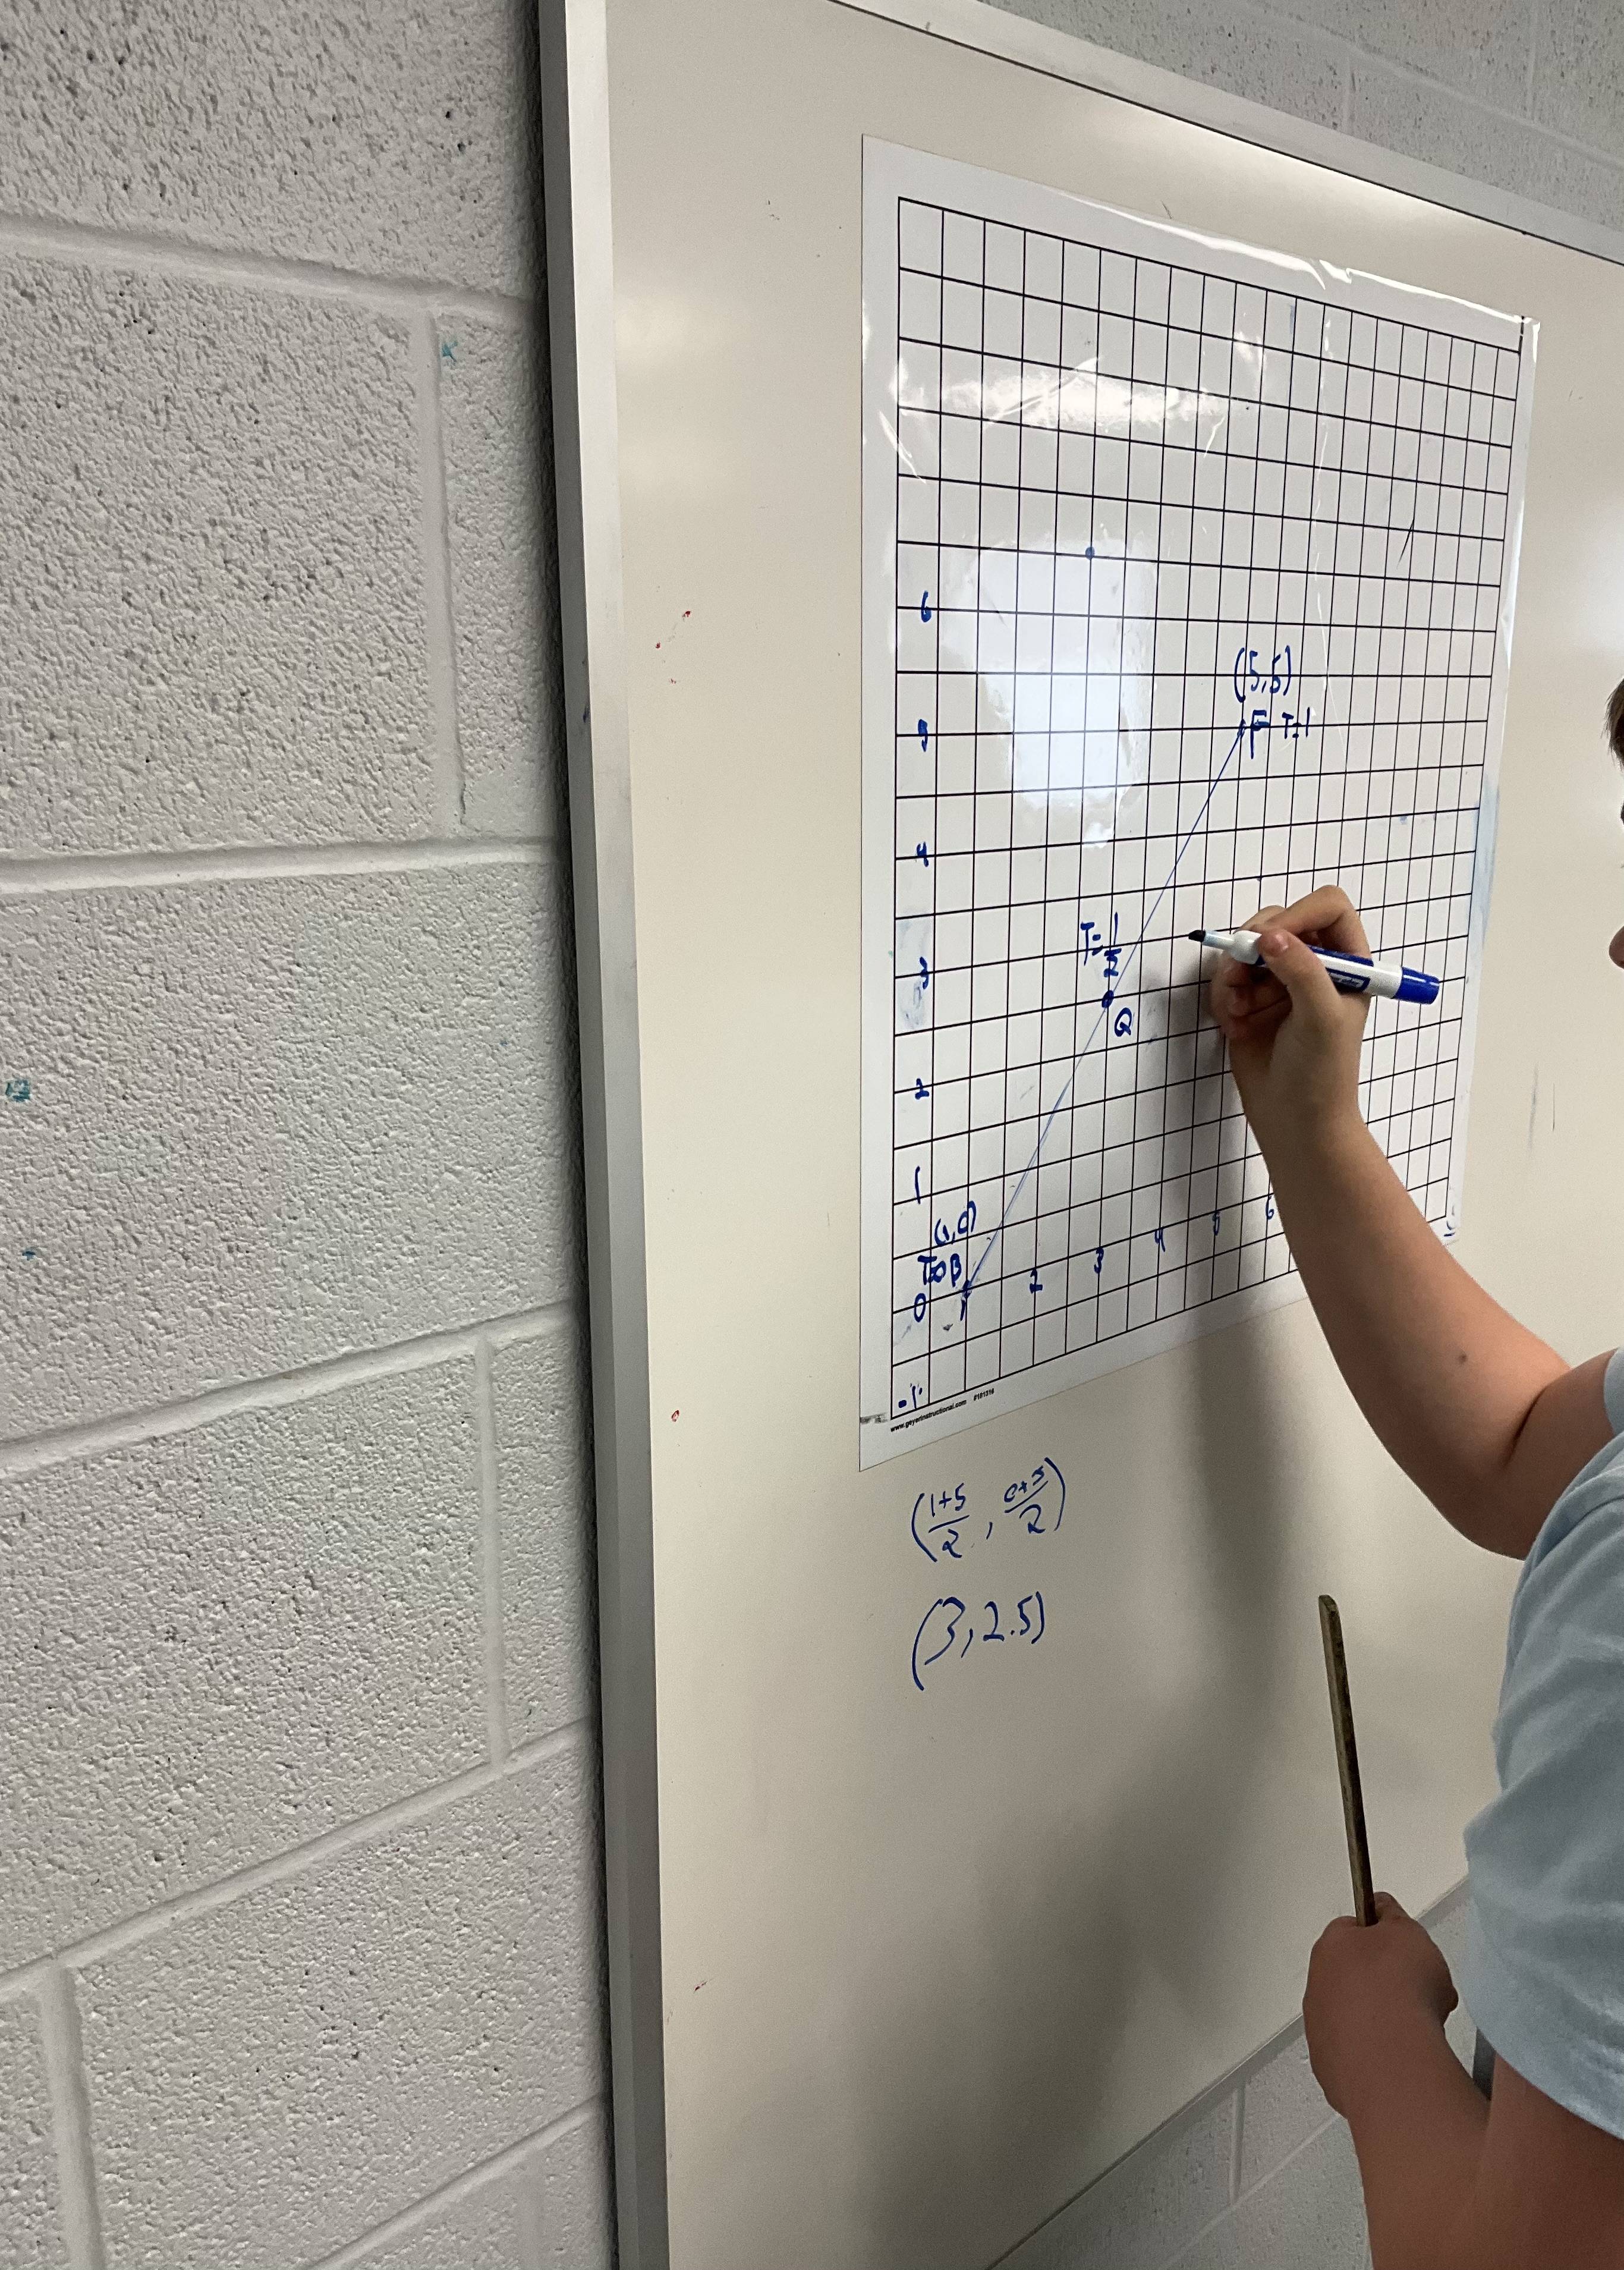
the journey from point to point took 1 minute. The next task was to determine where the halfway point would be? Where you’d be after 0.5 minutes, t=1/2, and the also where you’d be when t=1/4, or t=4/5.
There were great discussions happening in the groups, and students were pushed to justify their conclusions and explain their thinking.
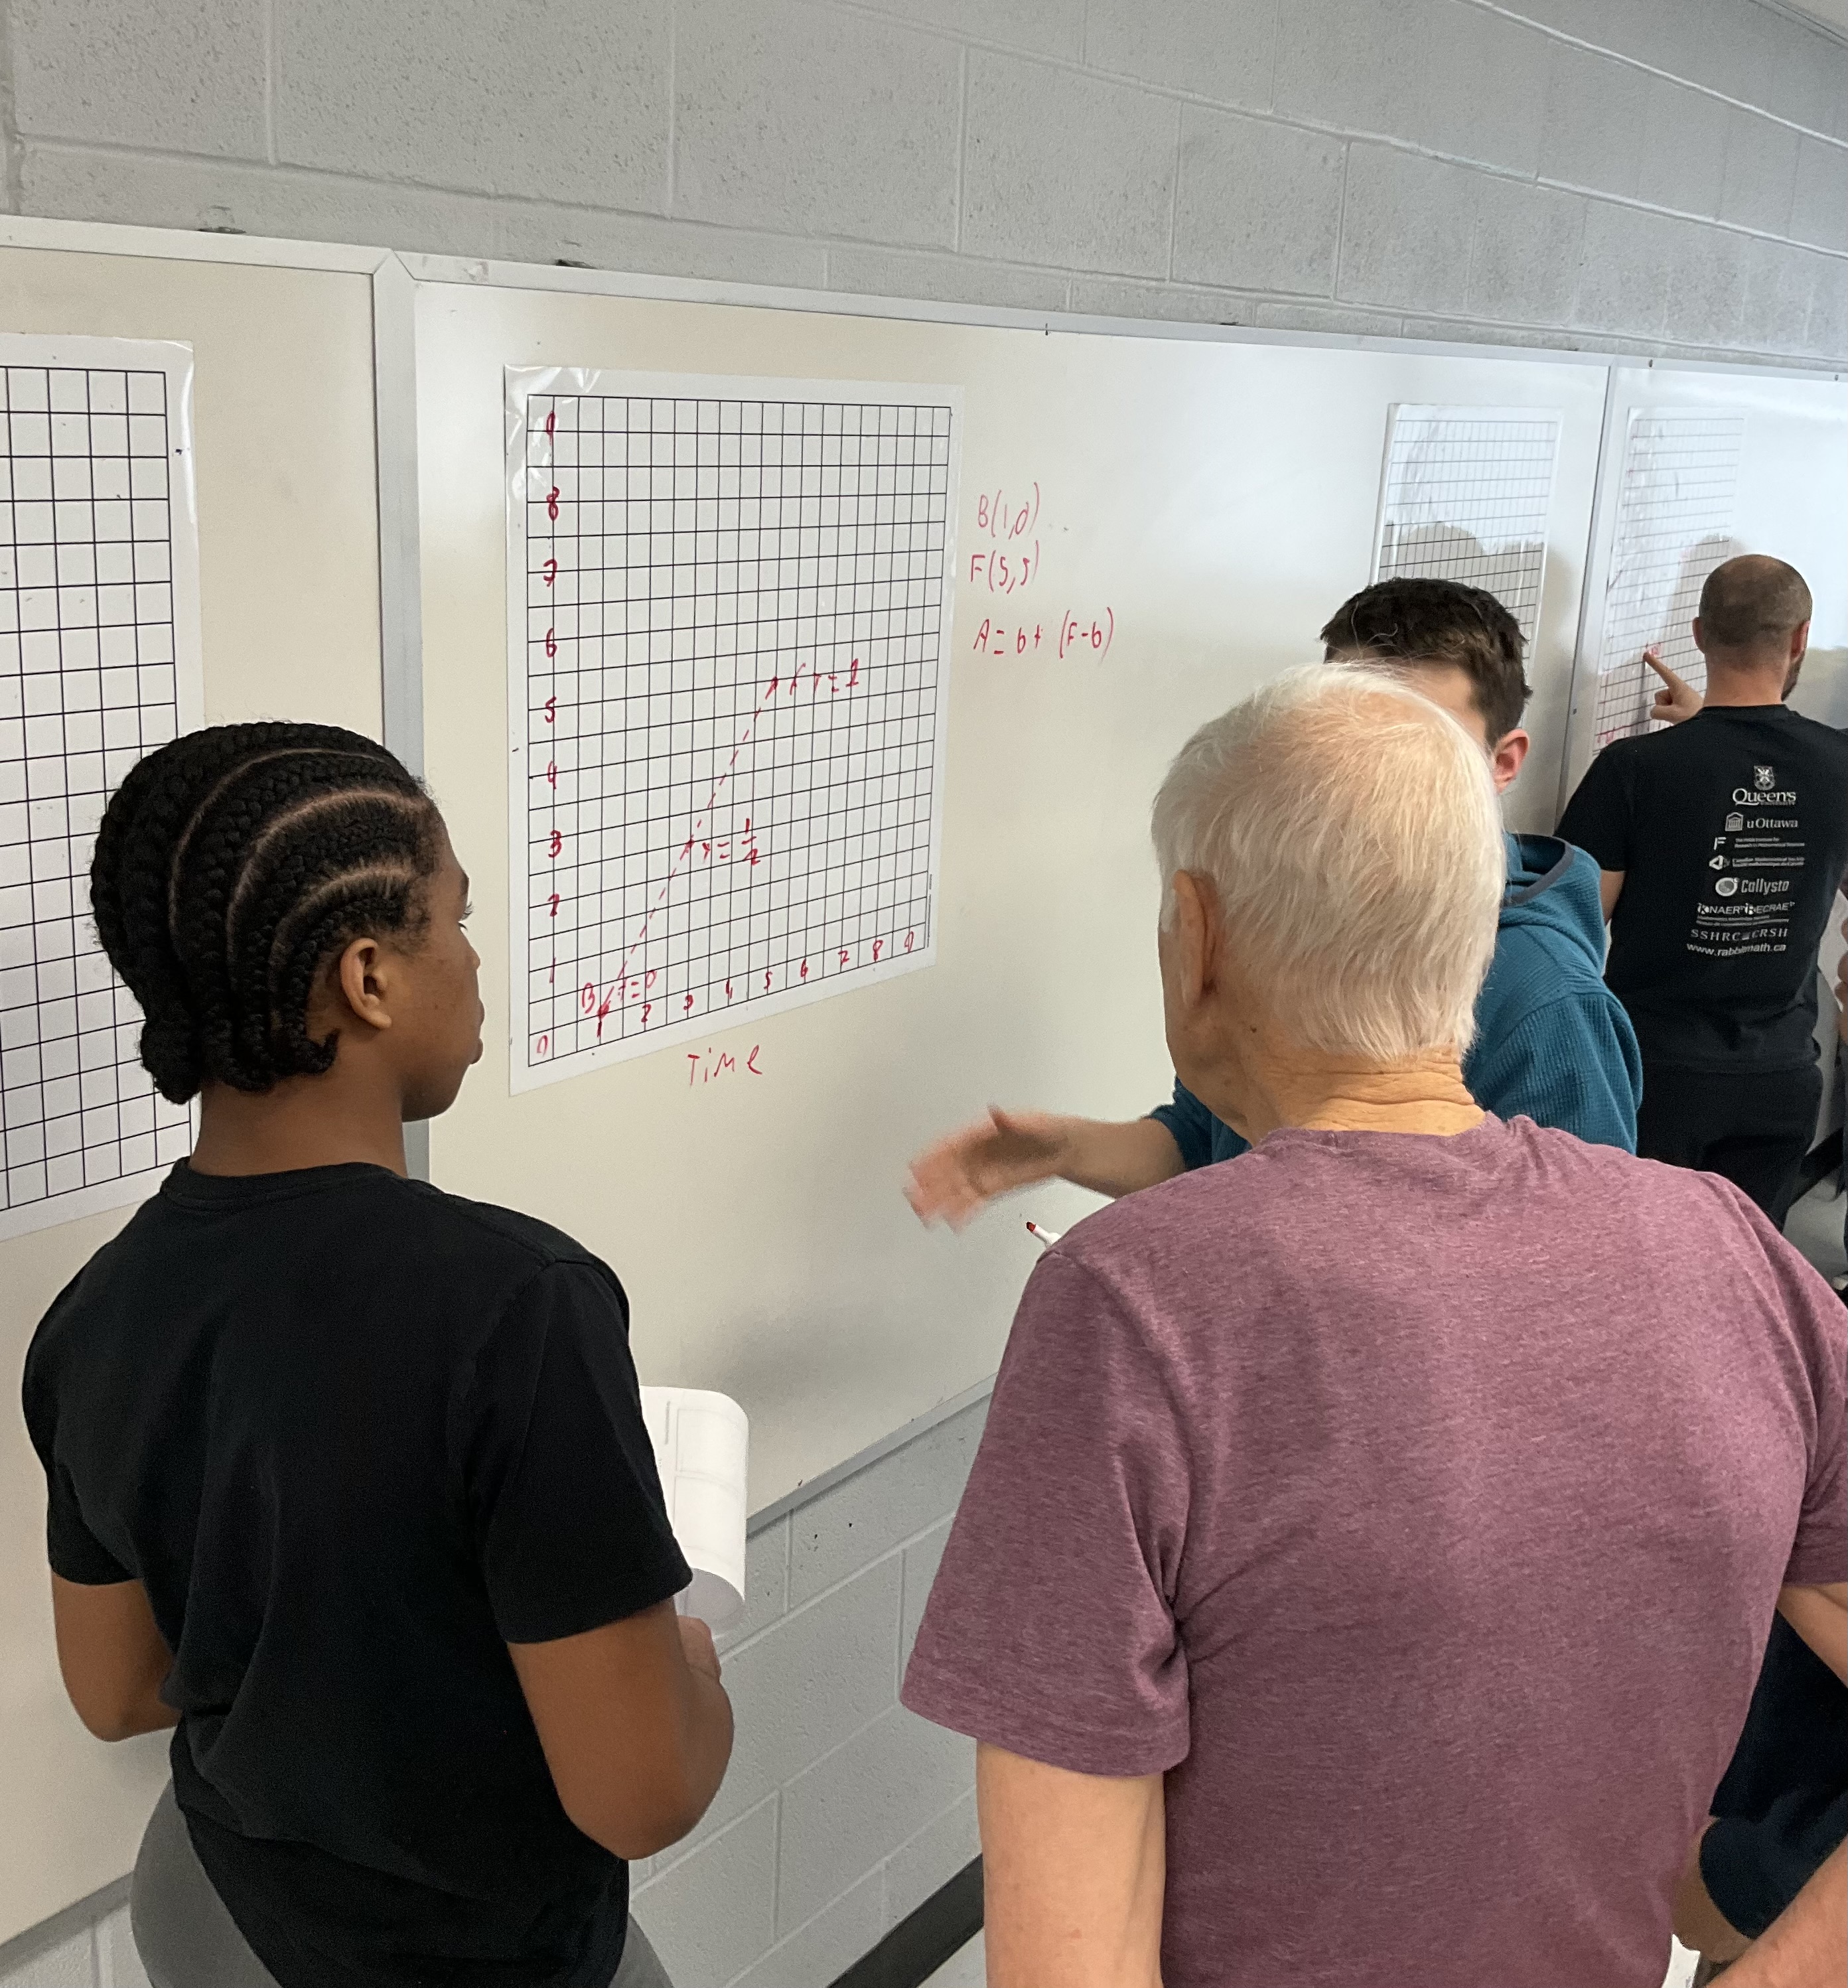
Next we brought in a parameter t, and we were able to express the point on the line for any value of t with the following equation.
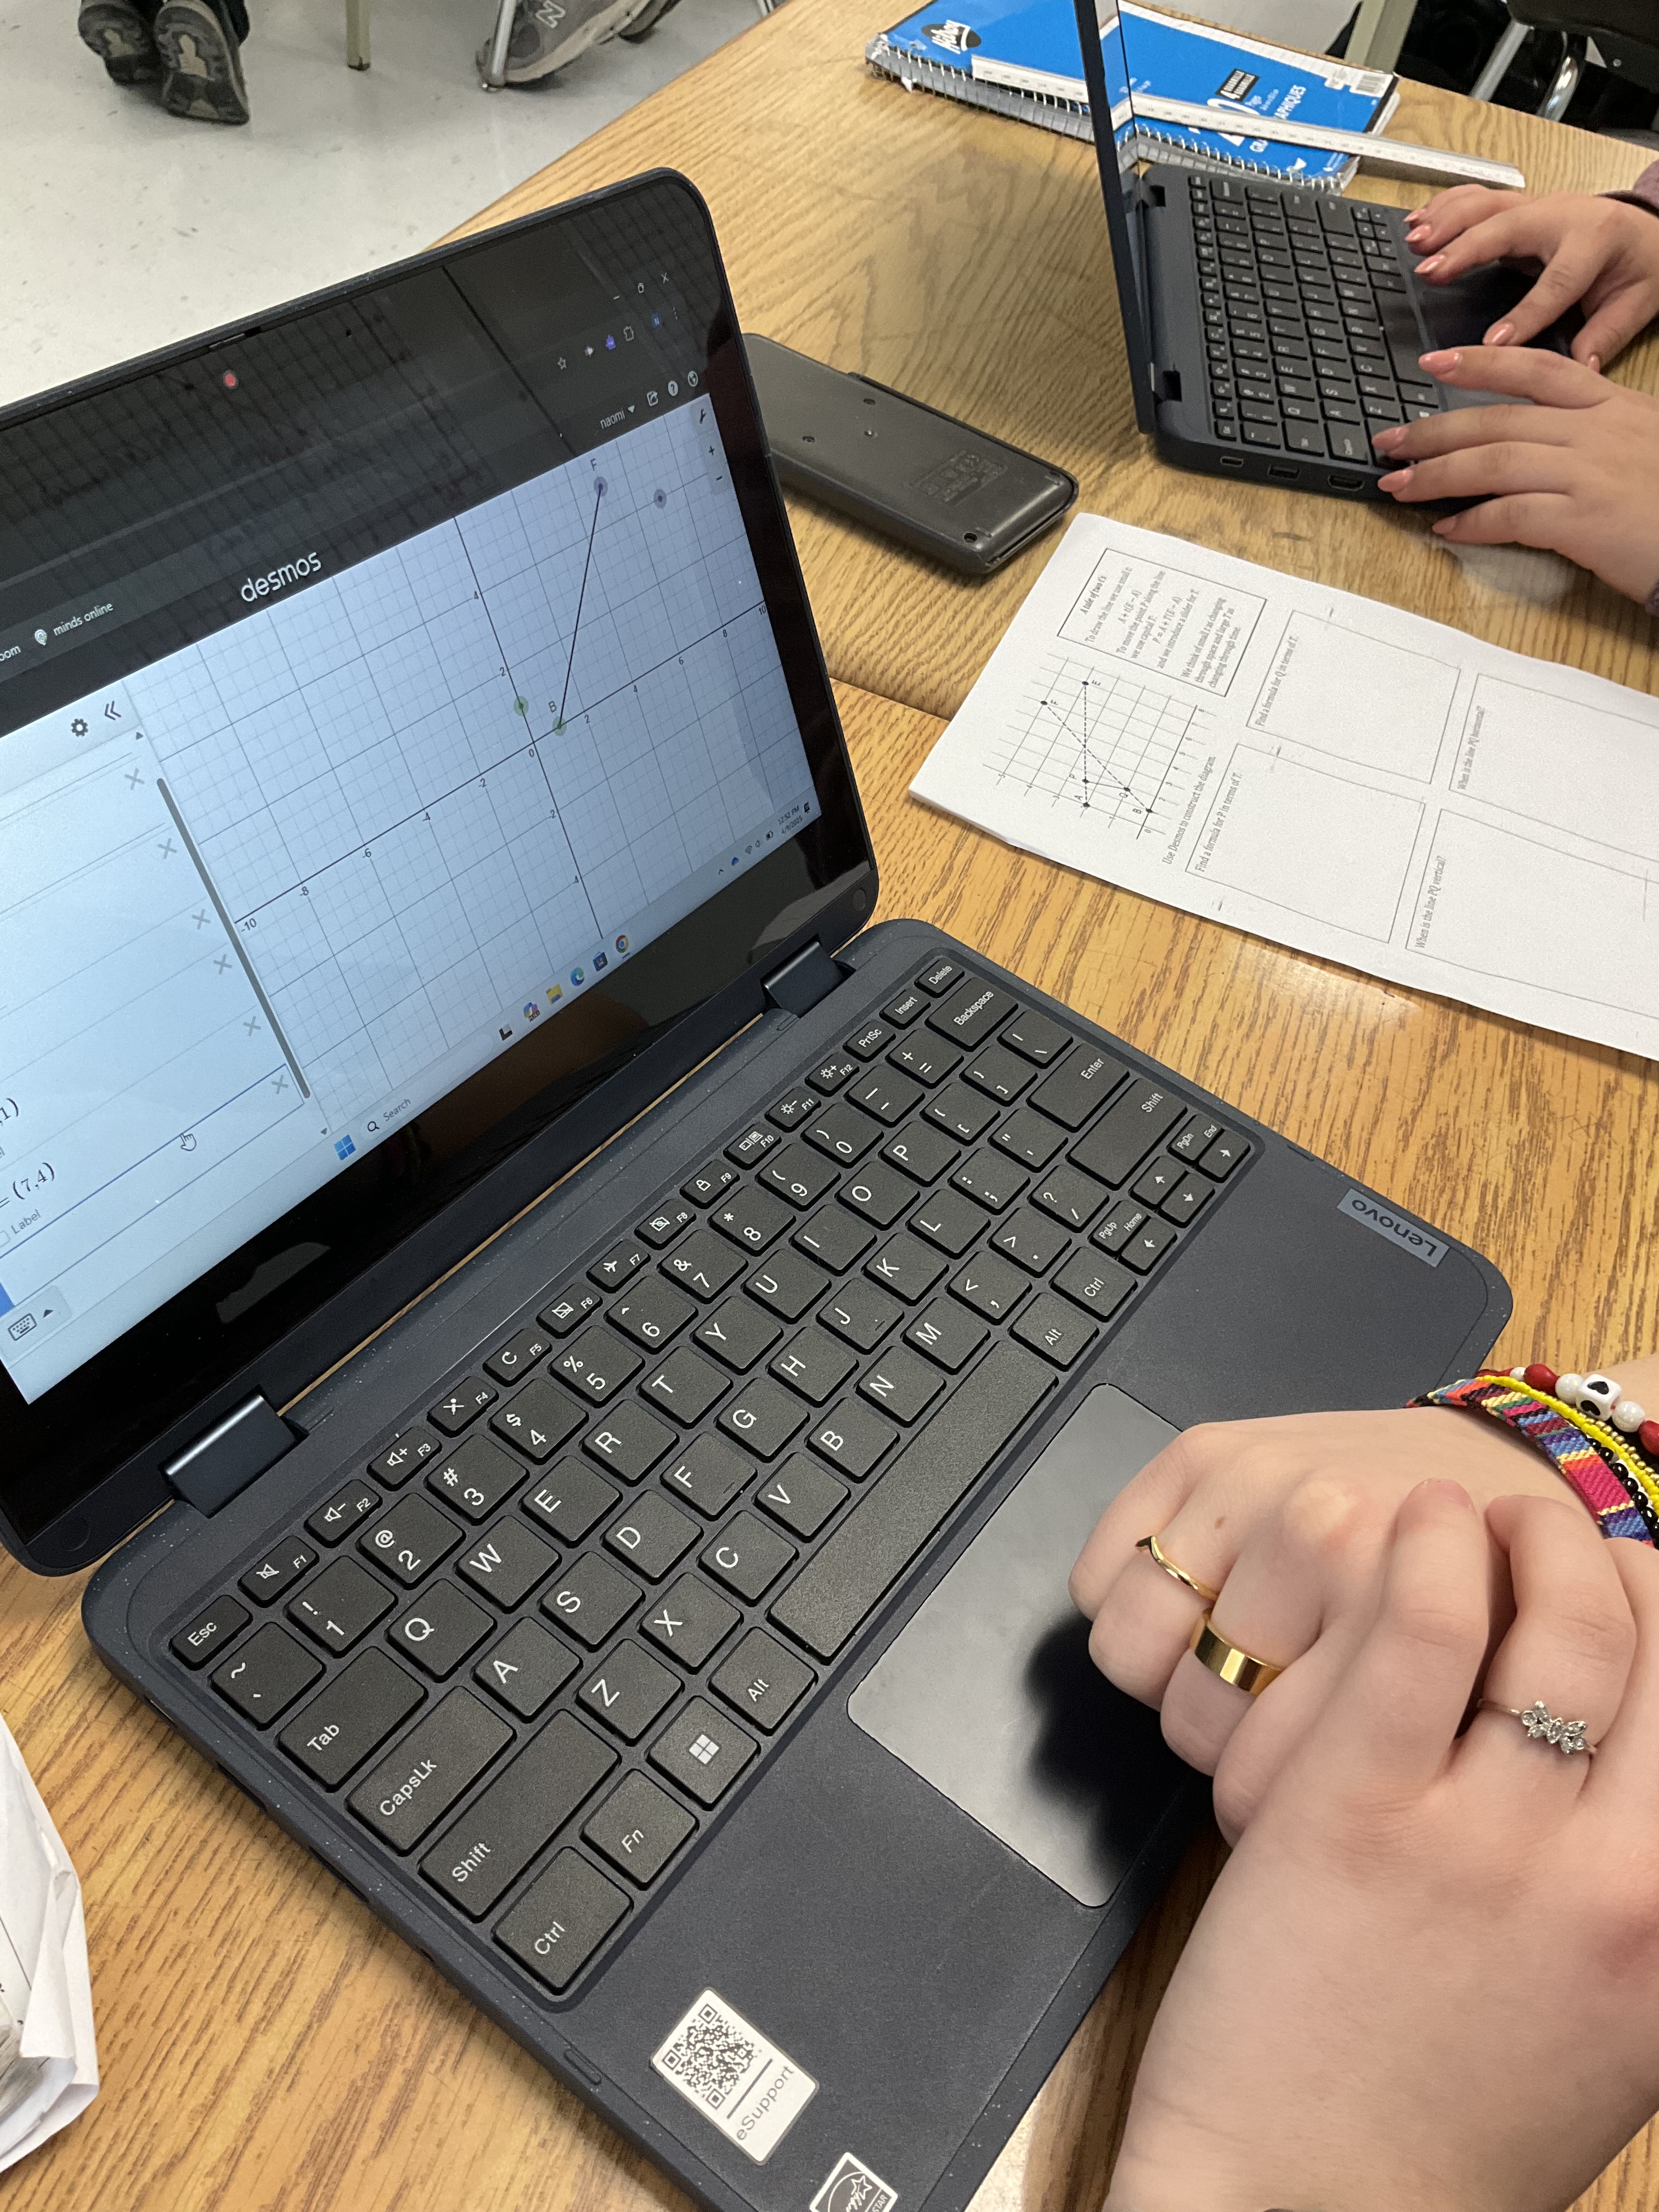
We turned to desmos and built a model
we used B=(1,0) and F=(5,5)
then we defined the line to be B+t(F-B) where t is a parameter
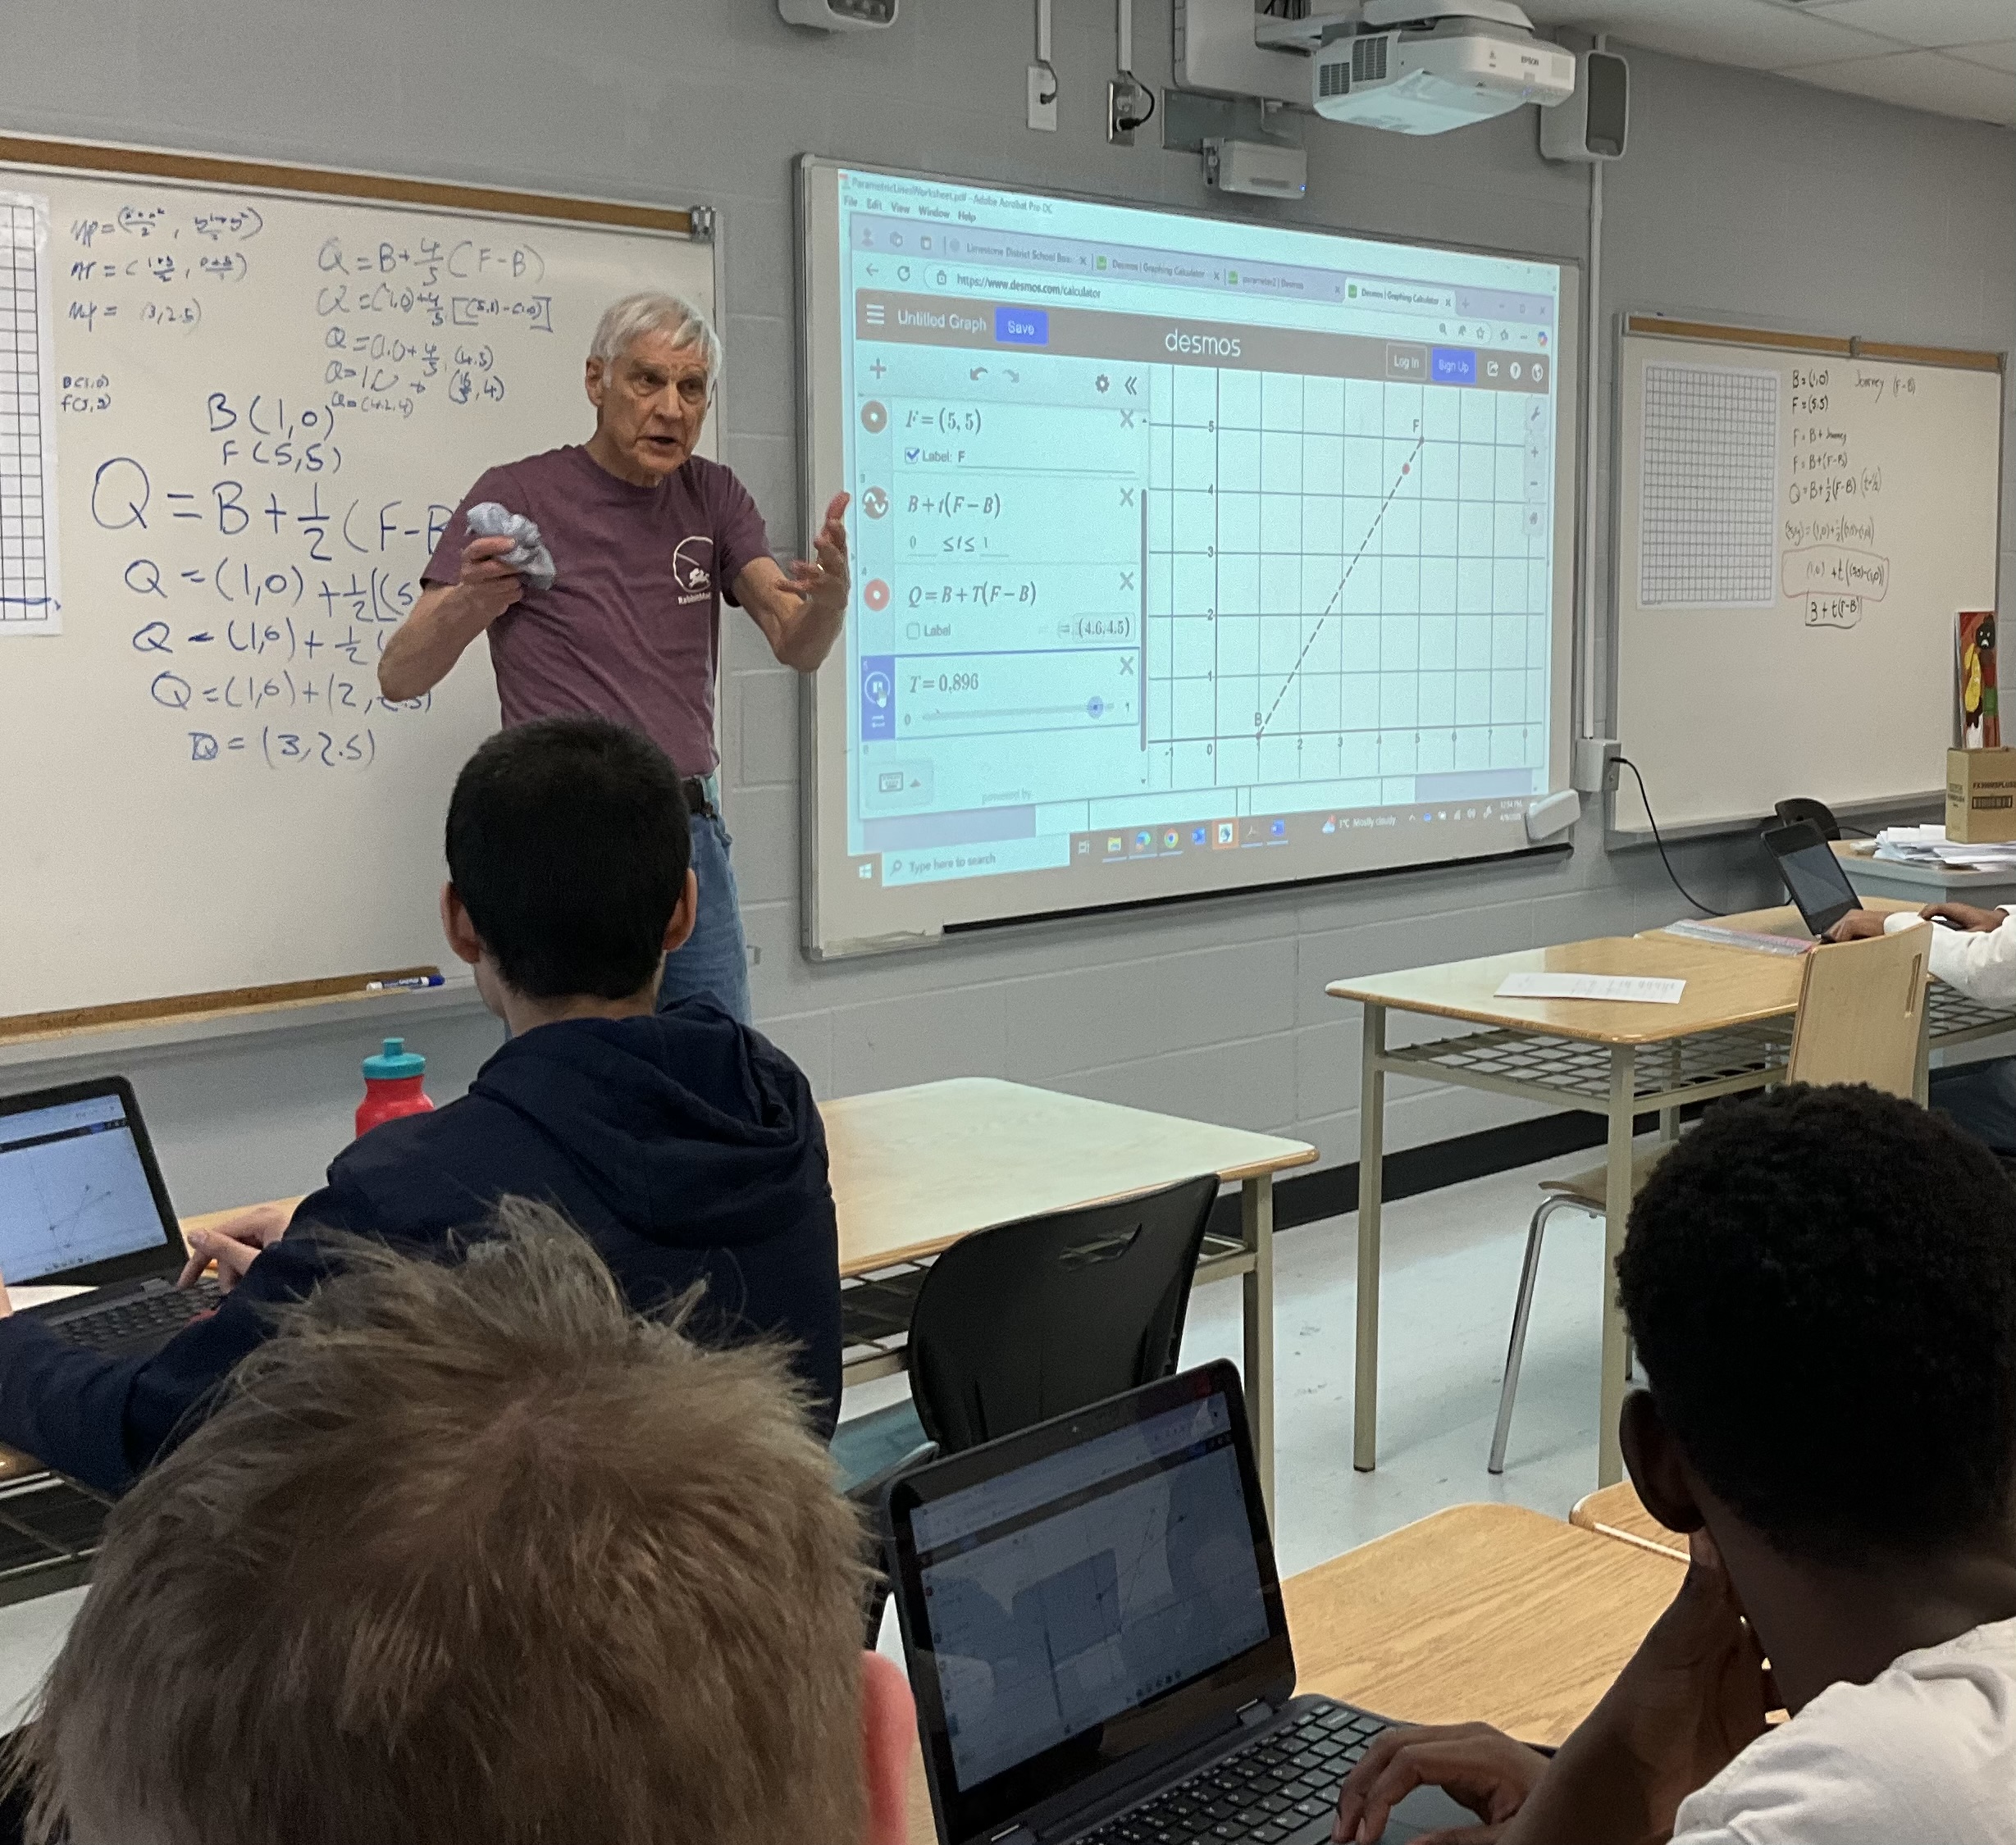
then we put a point on the line that could be animated with a slider. Q=B+T(F-B) where the capital T is controlled with a slider between 0 and 1.
We made another line as well, and added a slider dot on that one too.
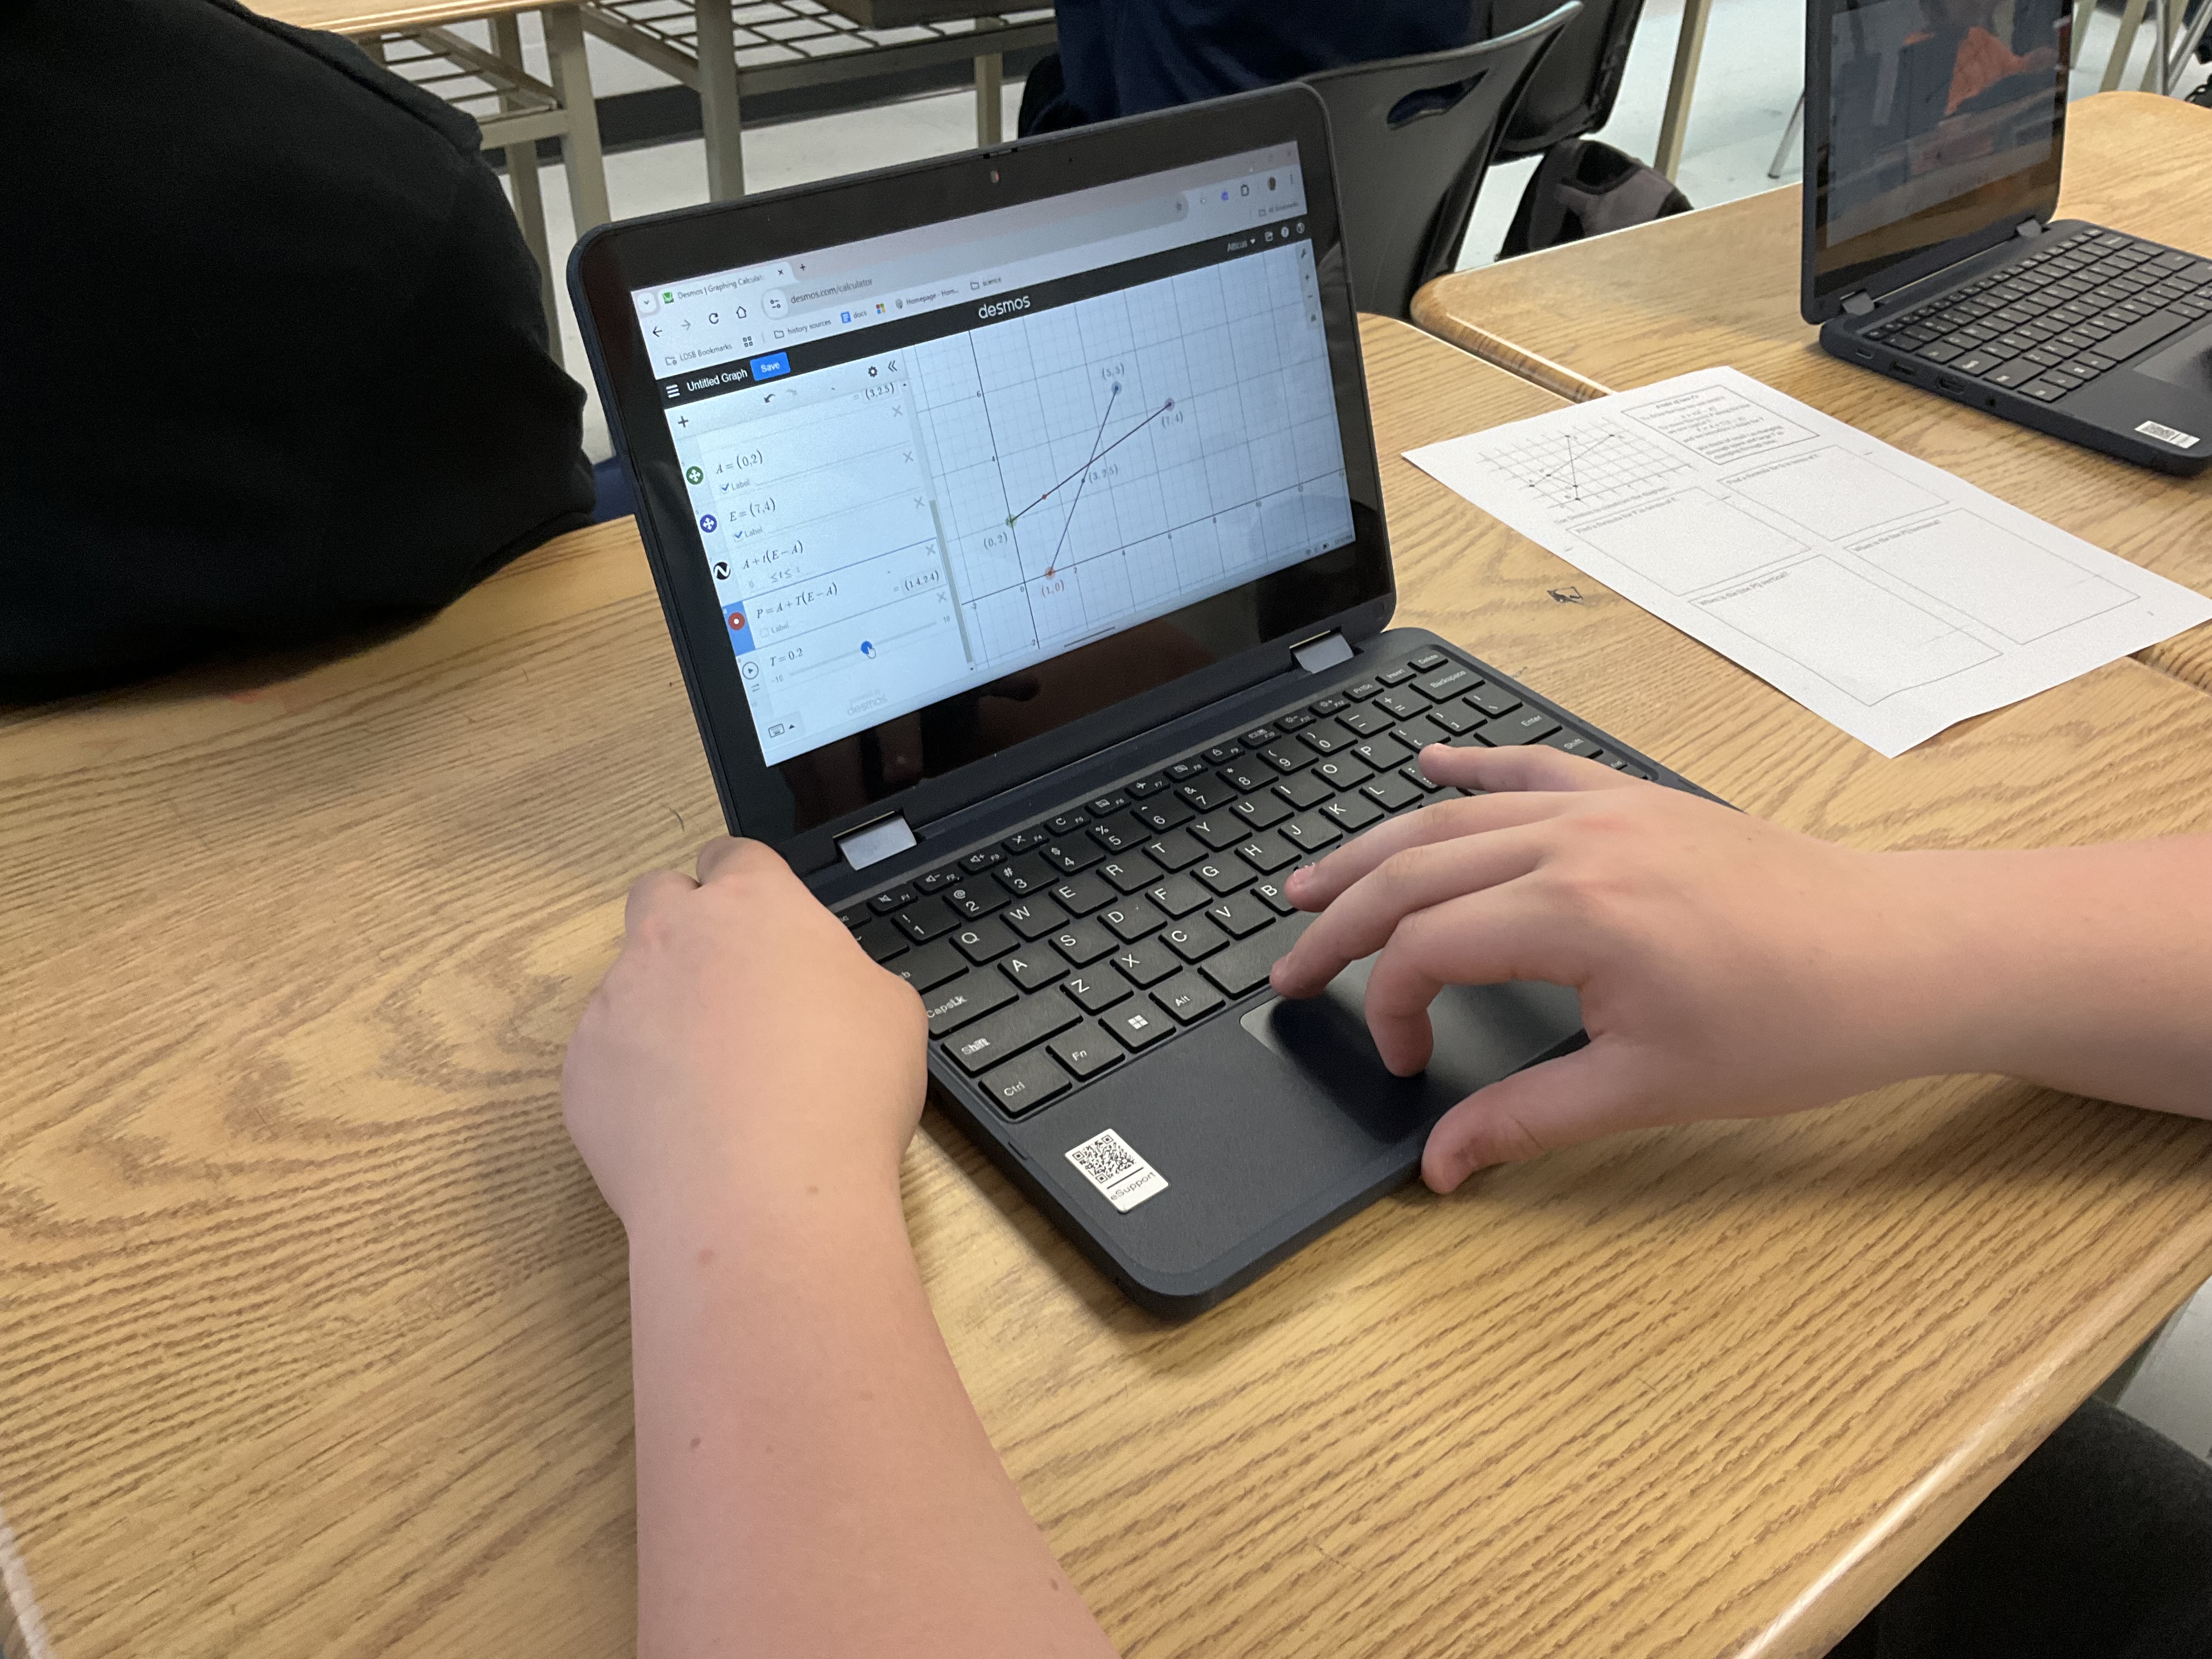
The final part was to make a line that joined the sliding dots together. We were exploring when that new line segment was vertical and when it was horizontal.
Here is the desmos result. It was pretty cool!
Students and teachers learned a great deal from this experience, and it was fun to do something totally different. We are thankful to our visitors for bringing good questions to share with us, and the support as we explored the math.
Solving Trig Problems

We’ve been having fun solving trig problems today. We can now recognize when to use sine cosine and tangent to solve for unknown sides or angles.
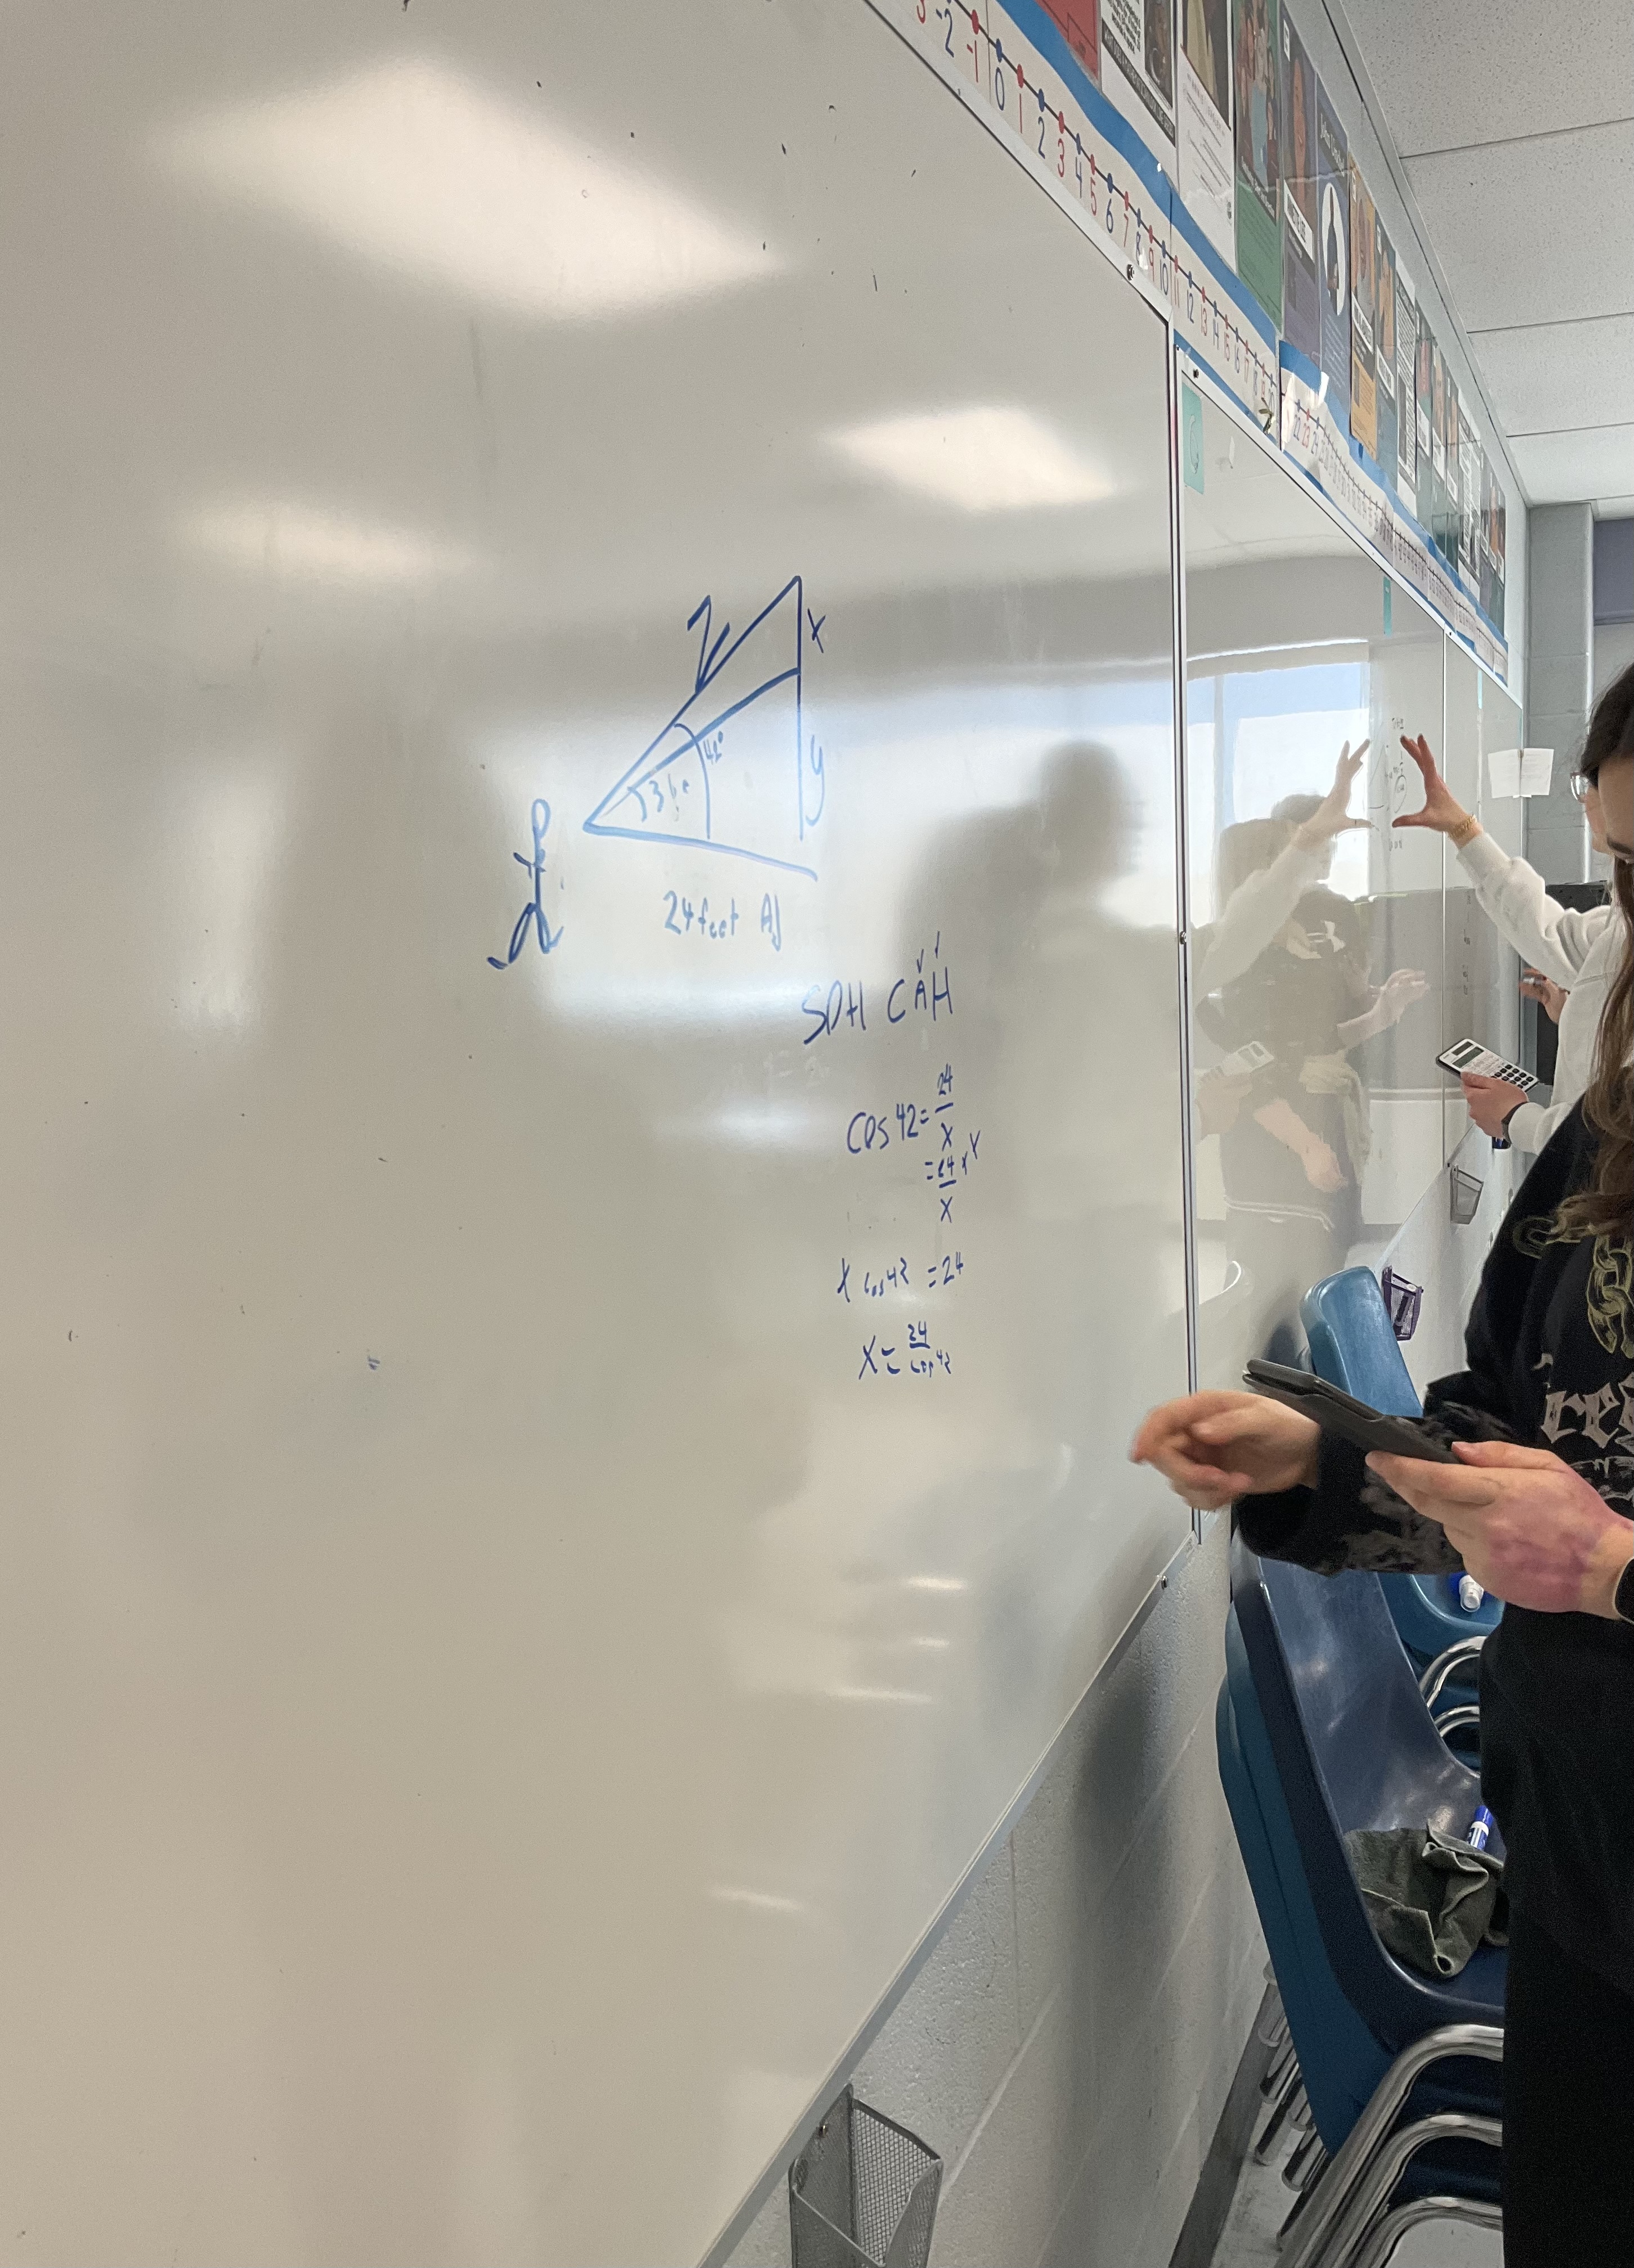
We’re working up at the whiteboards in our small groups, helping each other, sharing ideas, and checking our answers. It’s been a great 2 days of learning!
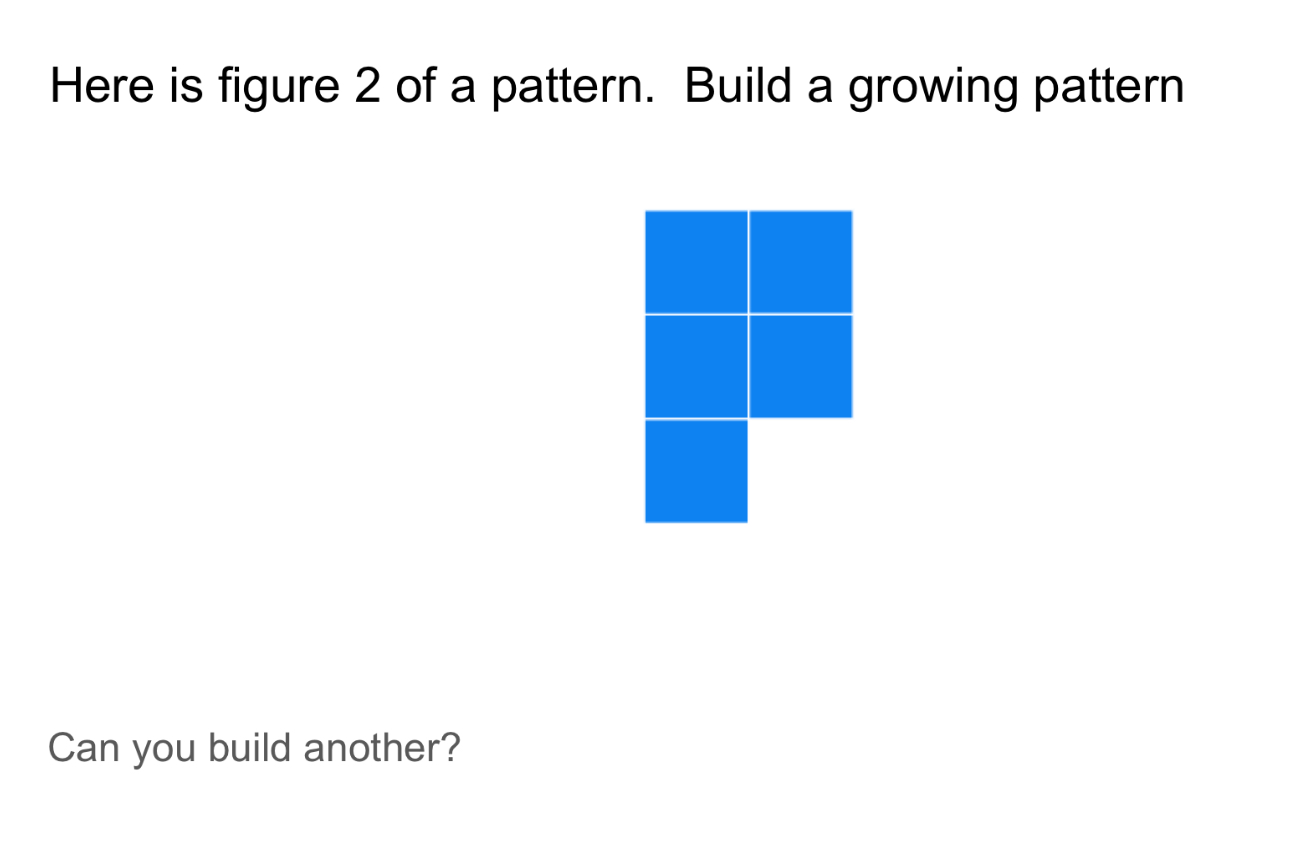
Patterns, Equations and Graphs
Today I was invited to work with a class on patterning, and equations and graphing.
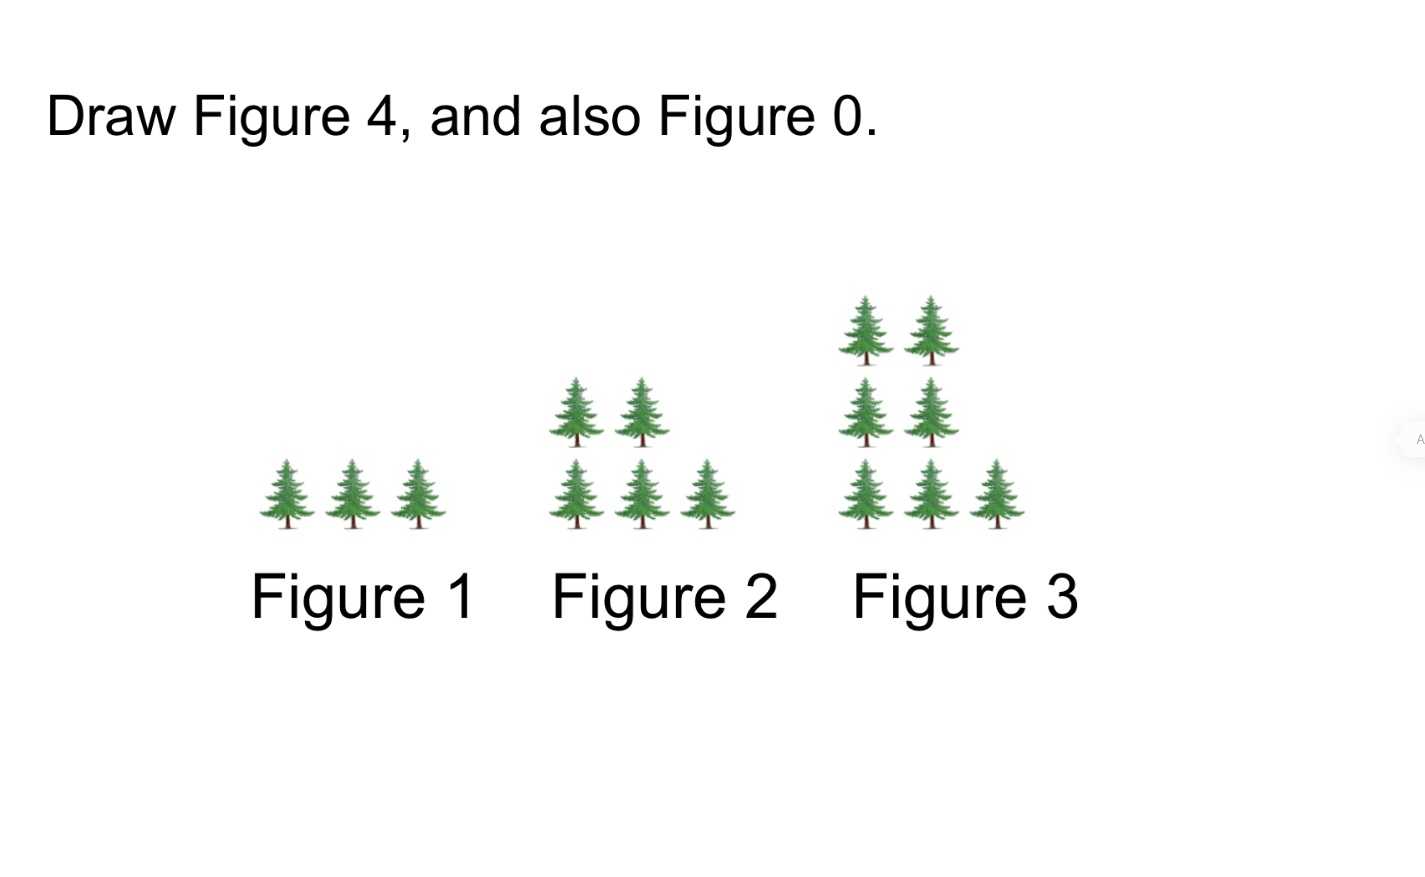
We built and extended the pattern using square tiles. We noticed that we added 2 new tiles each time, and we can see that we always add the new tiles in the same place. We can also see that figure 0 would have 1 tree. Figure 0 is the constant. It’s always there. We thought about how many trees would be in figure 10, or figure 100. We could make a table, and we could add 2 and add 2 and add 2 until we get to figure 100, but that is tedious, so we can think about how many groups of 2 you added. To get to figure 100 we add 2 100 times to the 1 that we started with. To get to figure x, we add 2 x times to the 1 that we started with. The equation, or pattern rule, is y=2x+1
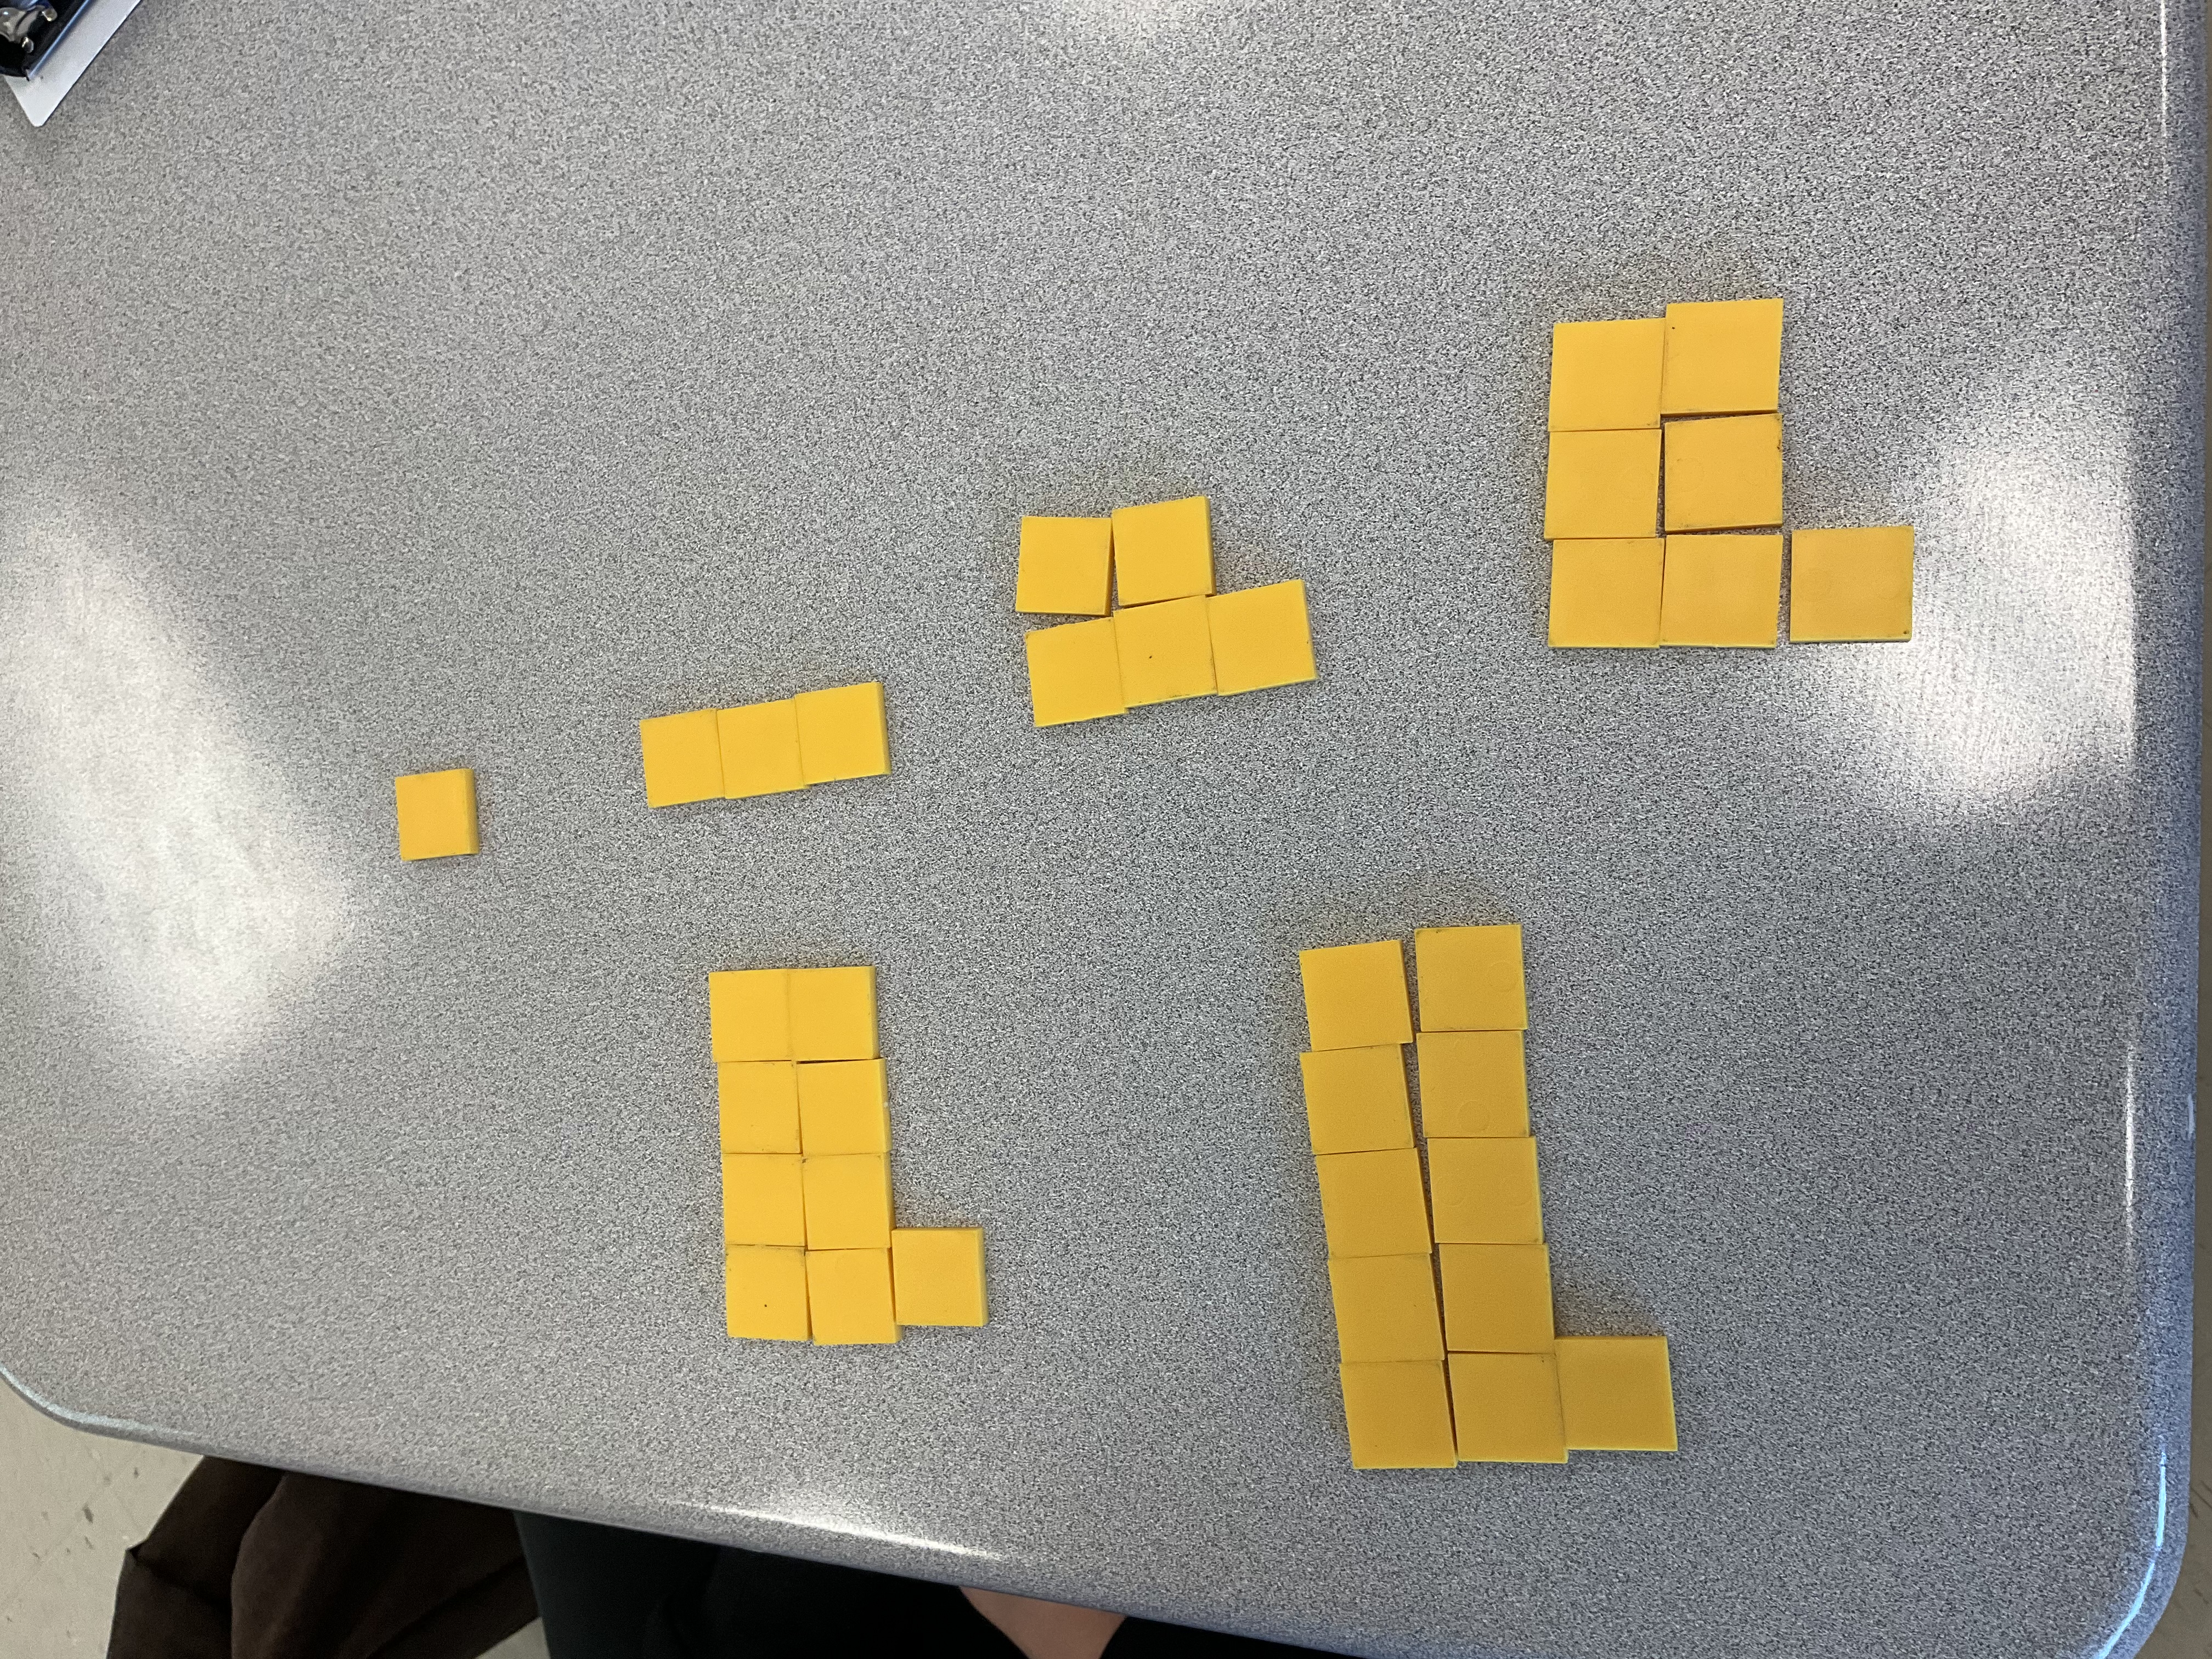
We had some fun building our own patterns and sharing the rules.
We saw some neat patterns:
this one is y=2x+1
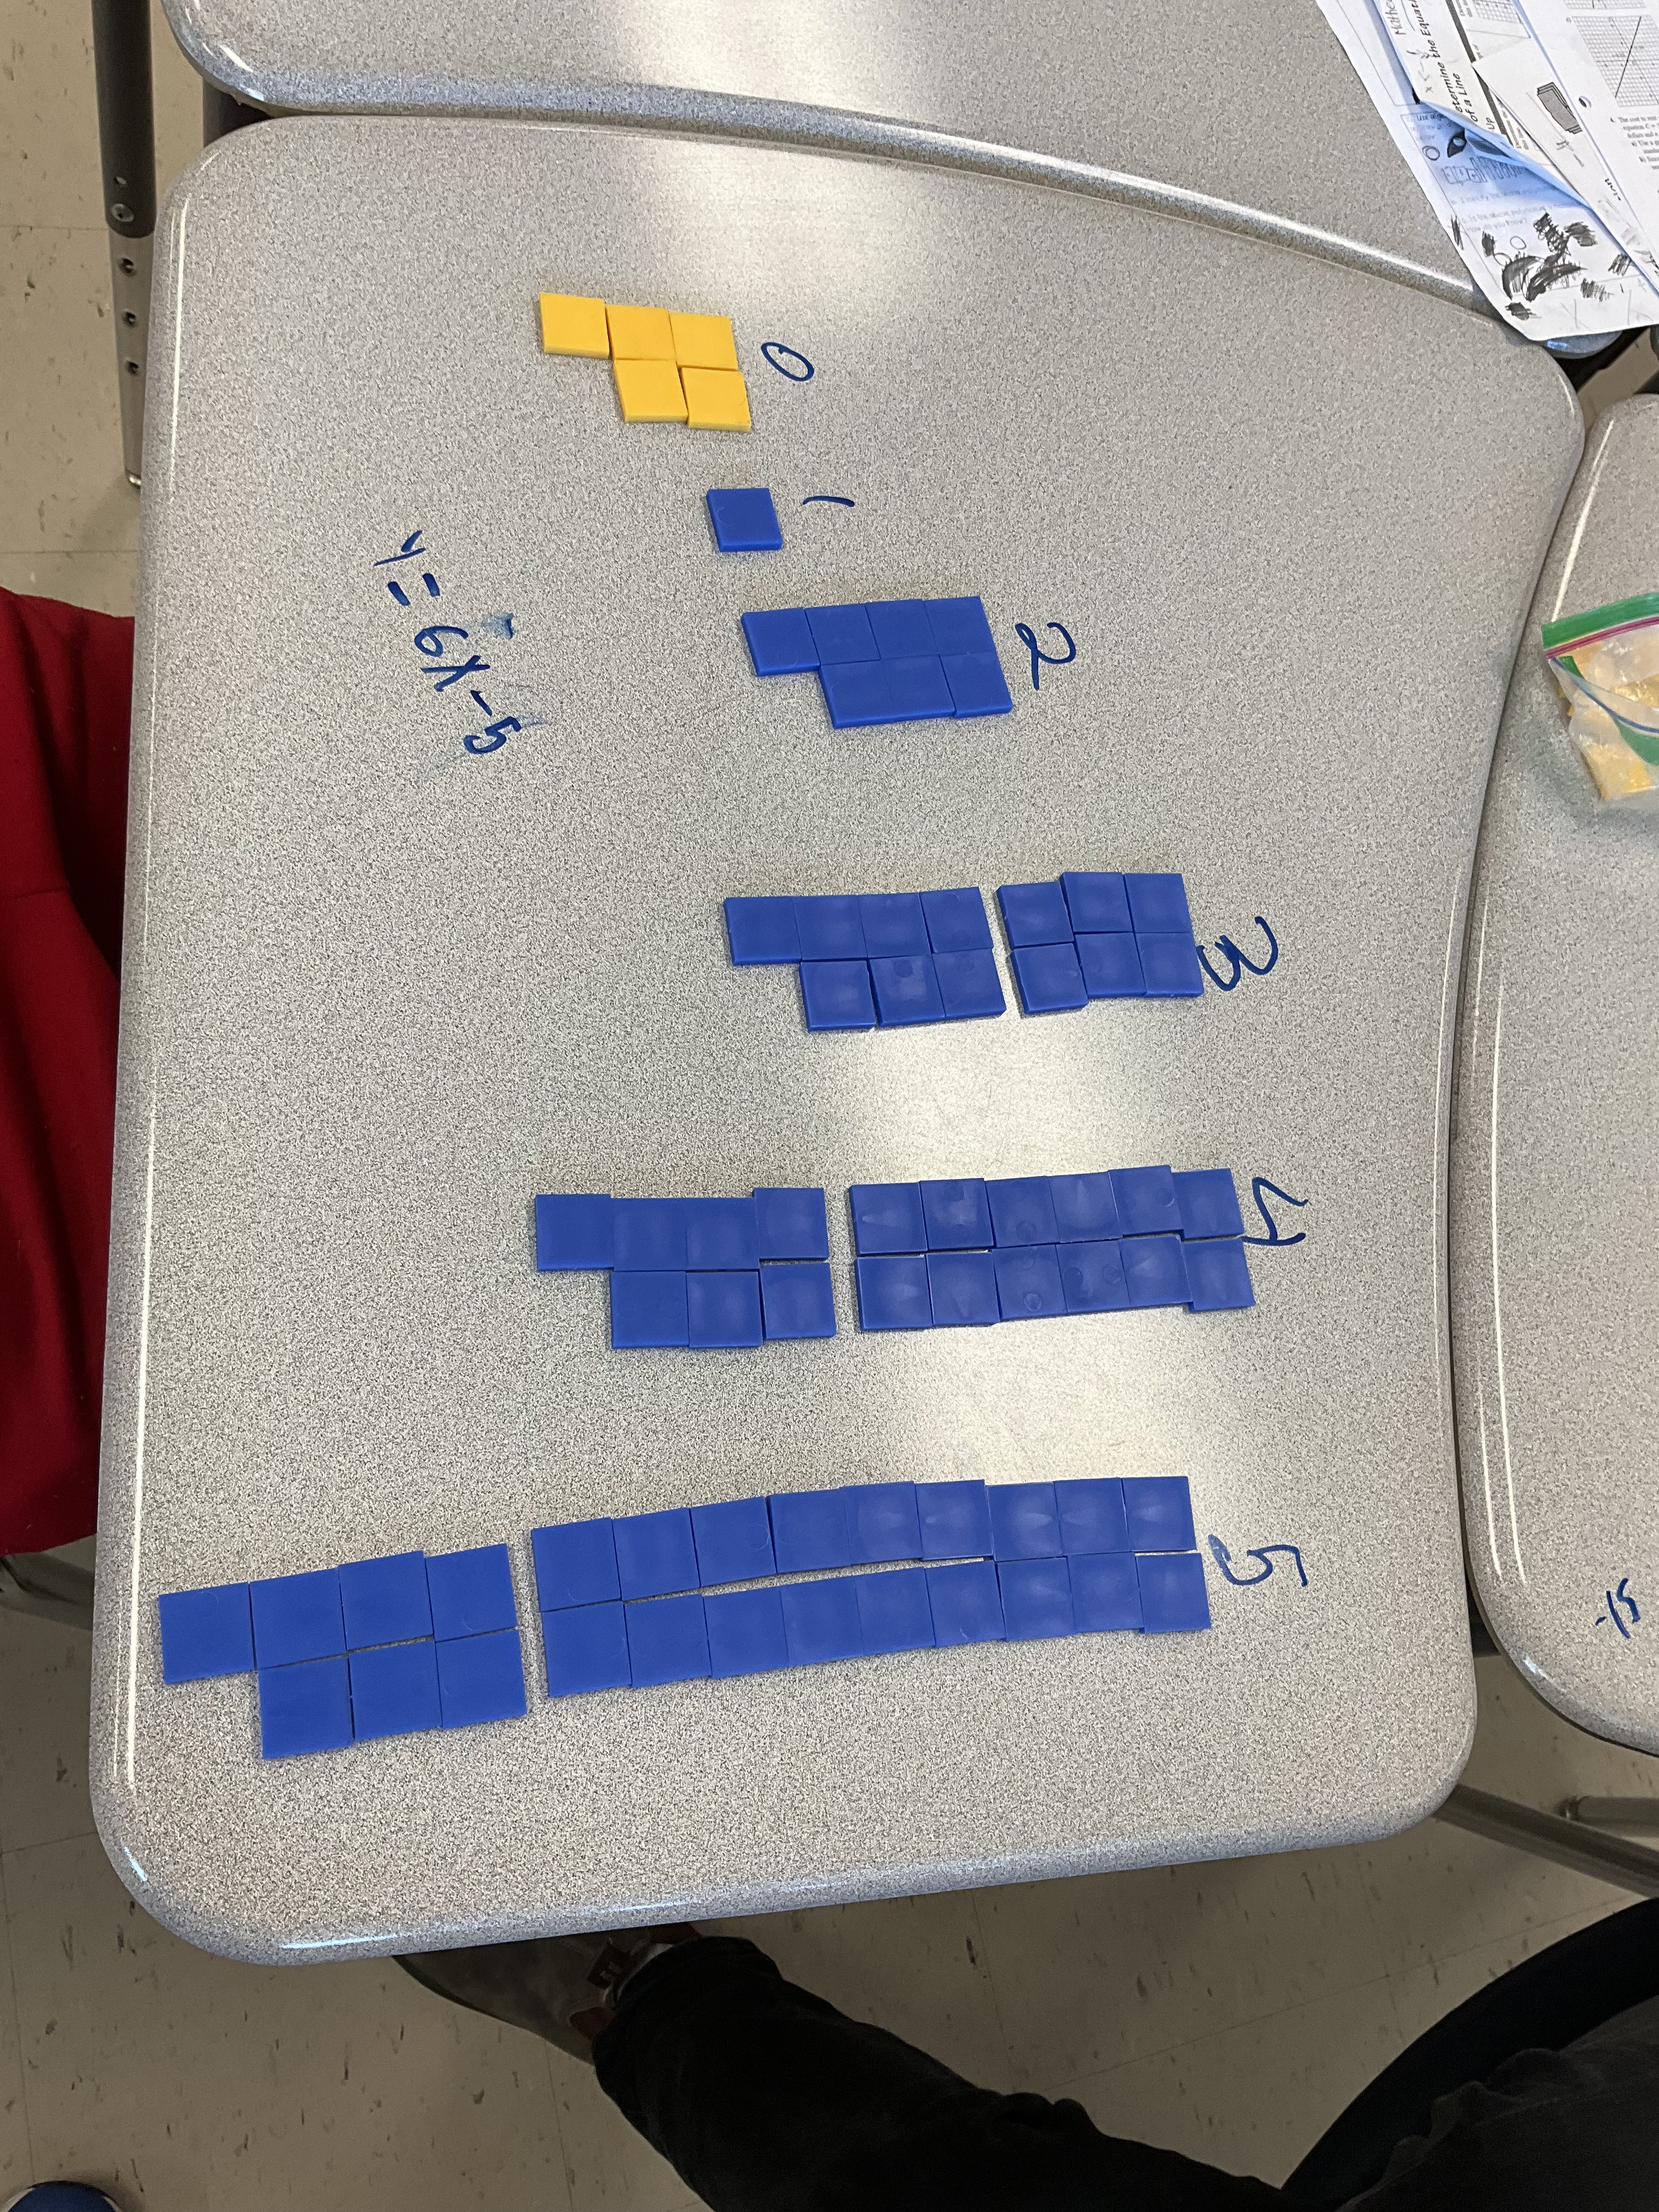
the figure 2 is a bit different here, but the pattern was cool, going up by 6 each time, we’d need a negative constant.

i was impressed at how many groups made negative constants without any issue. I likes how we have different colours for positives and negatives in these representations.
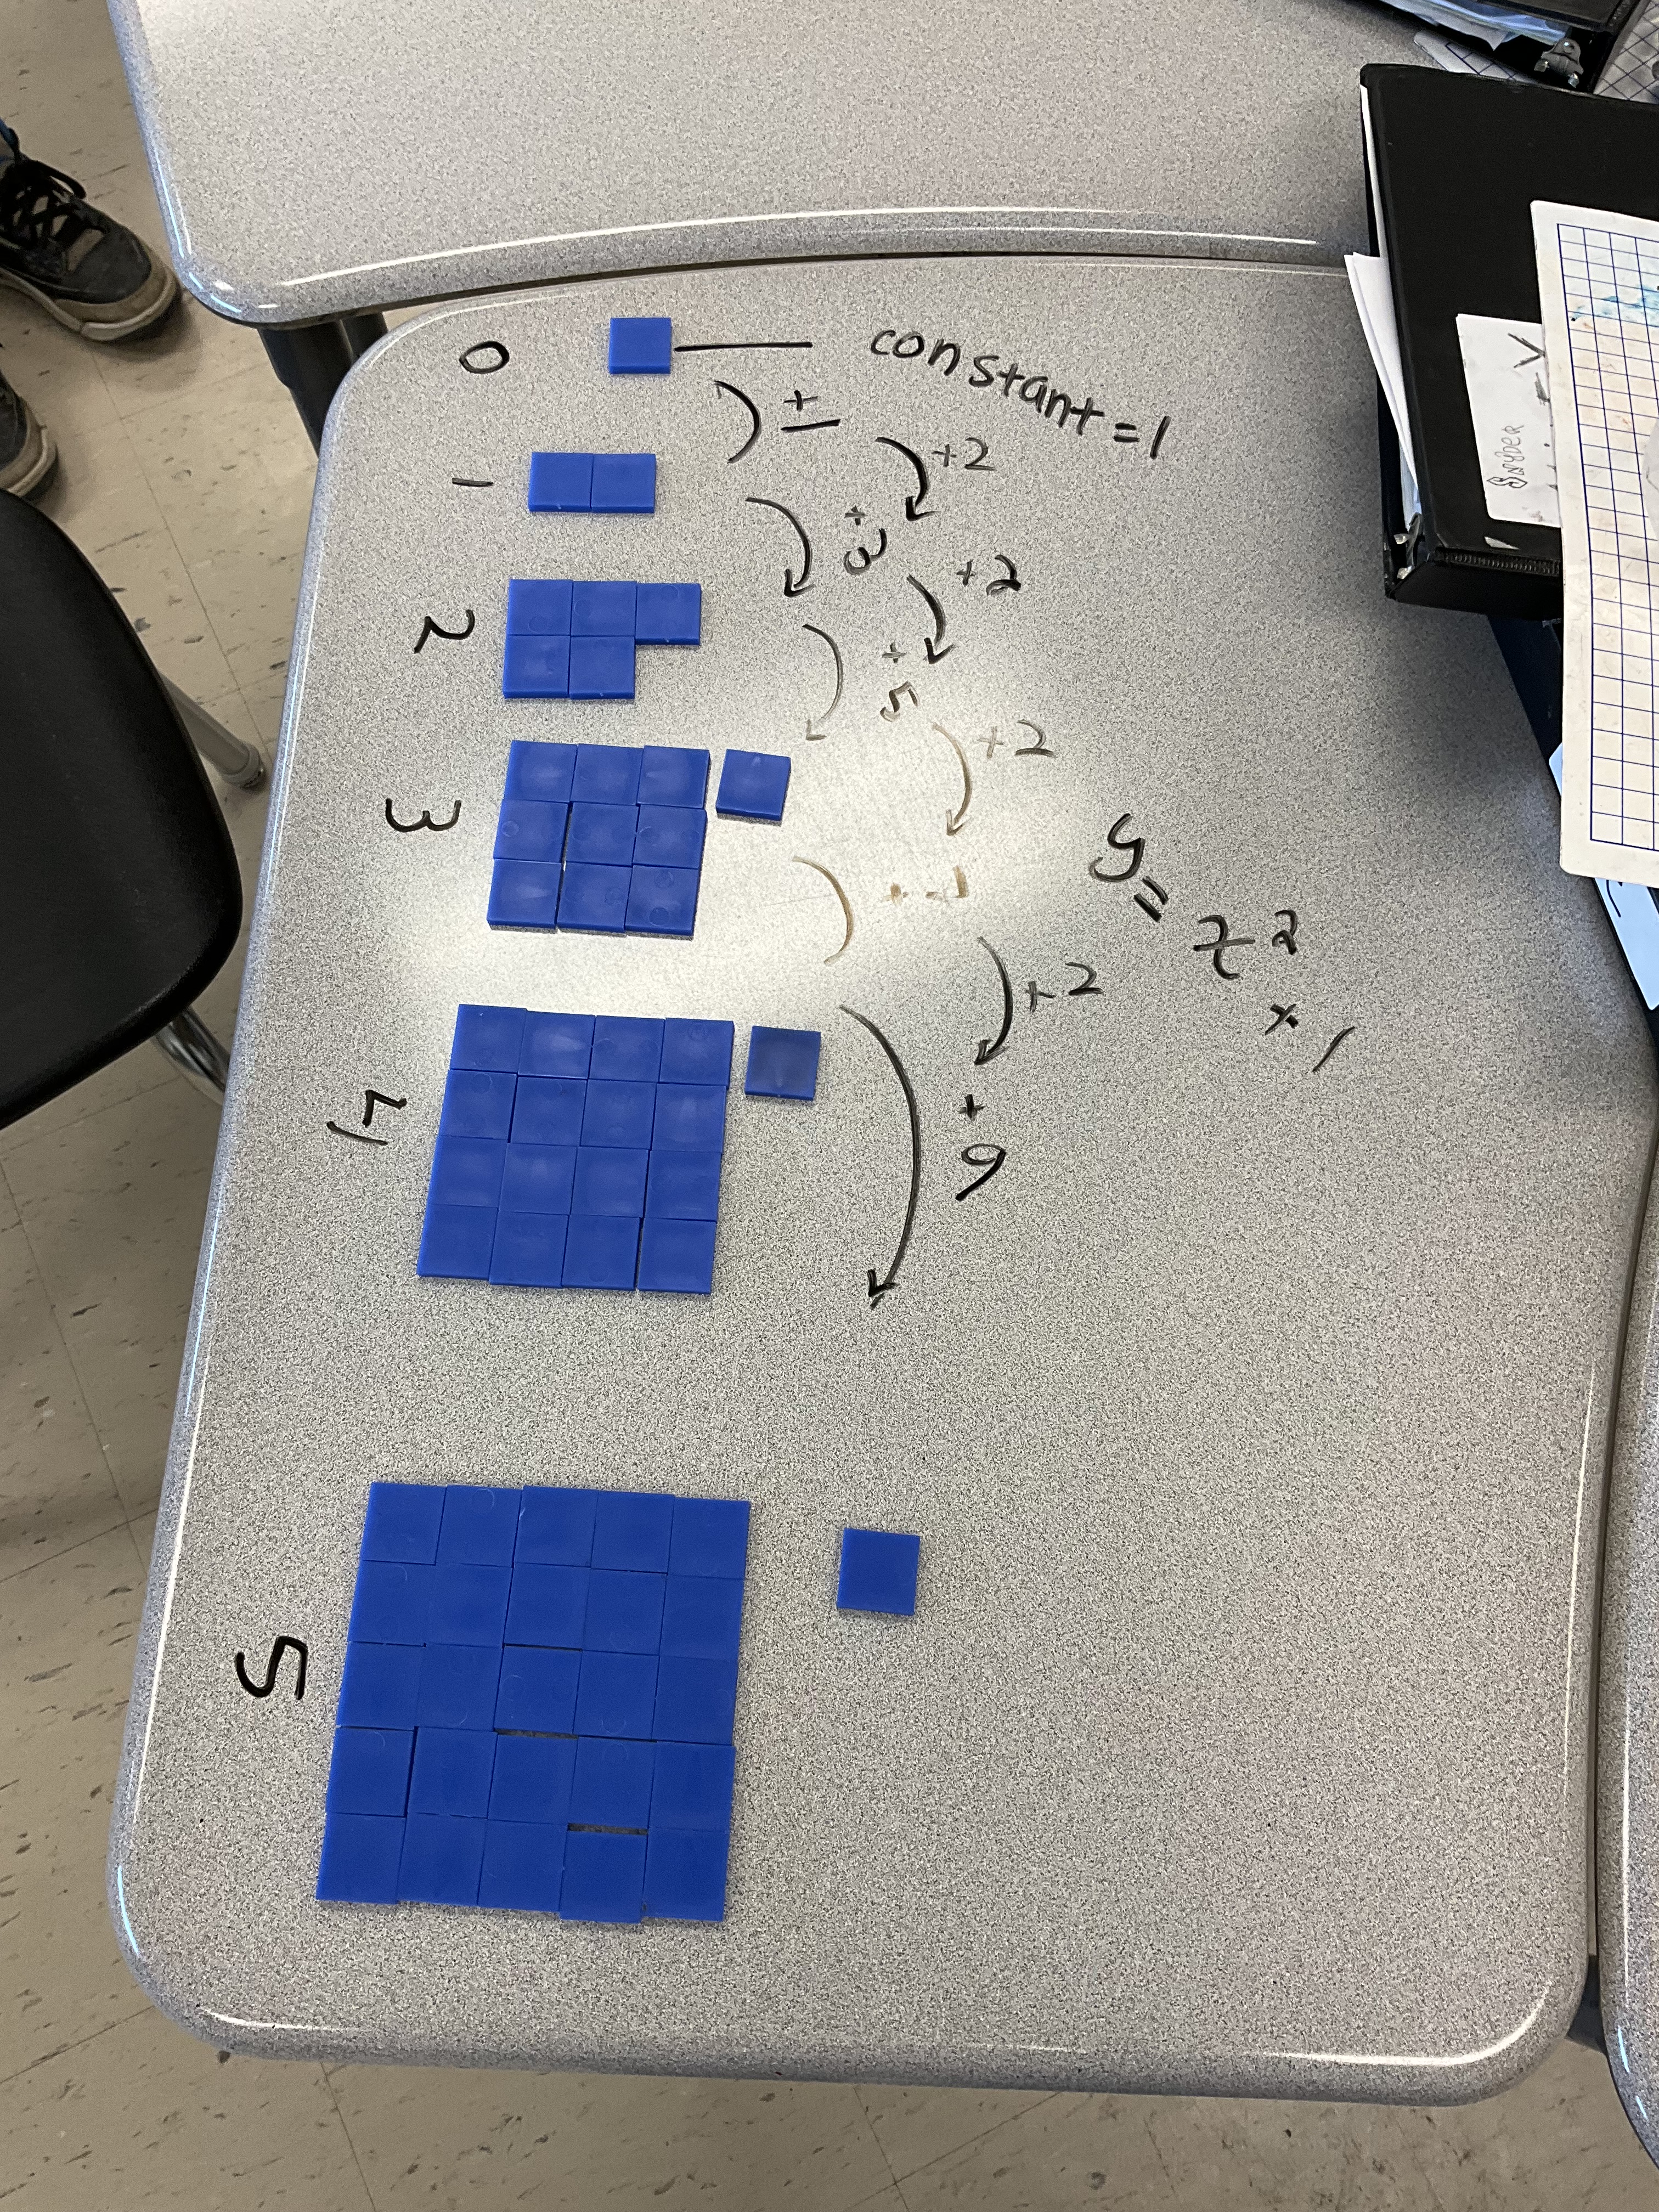
this was a neat pattern that was fun to unpack. We looked at how it grew and noticed that it was not linear because we added different amounts each time. We saw that we could split the figure into a square and 1 extra tile. The constant is 1 since figure 0 is 1. We determined the equation was y=x^2+1.


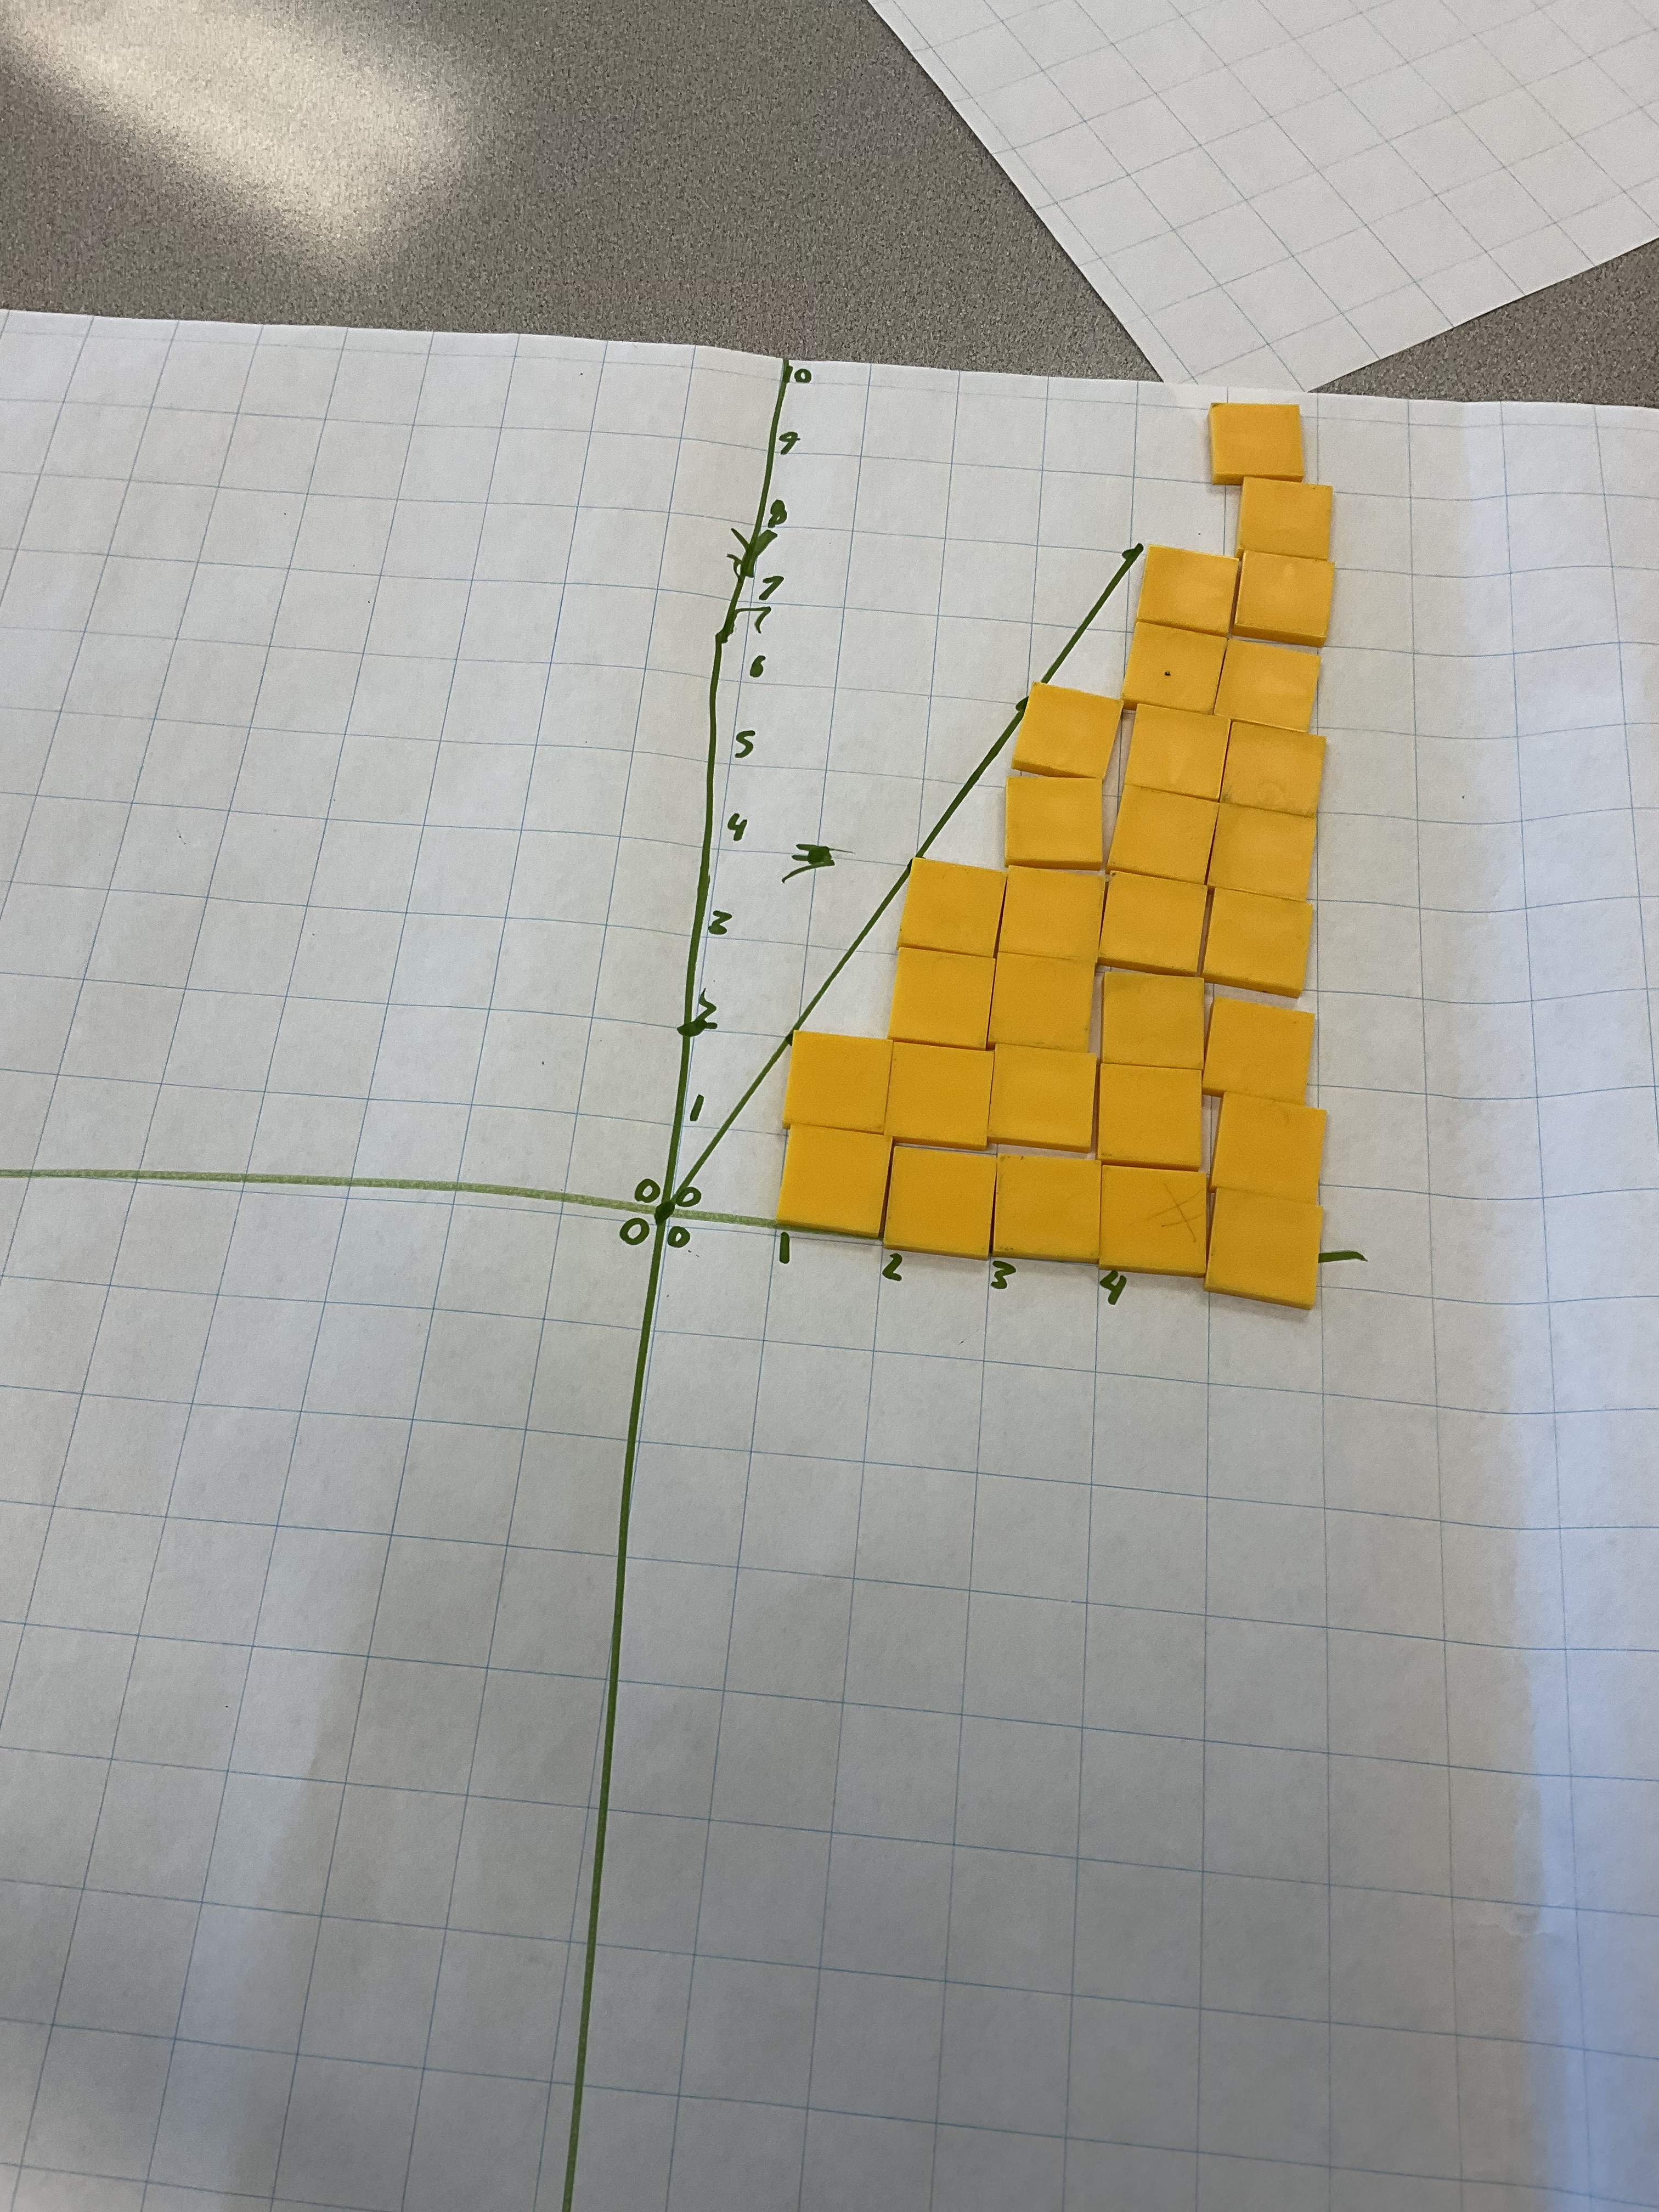
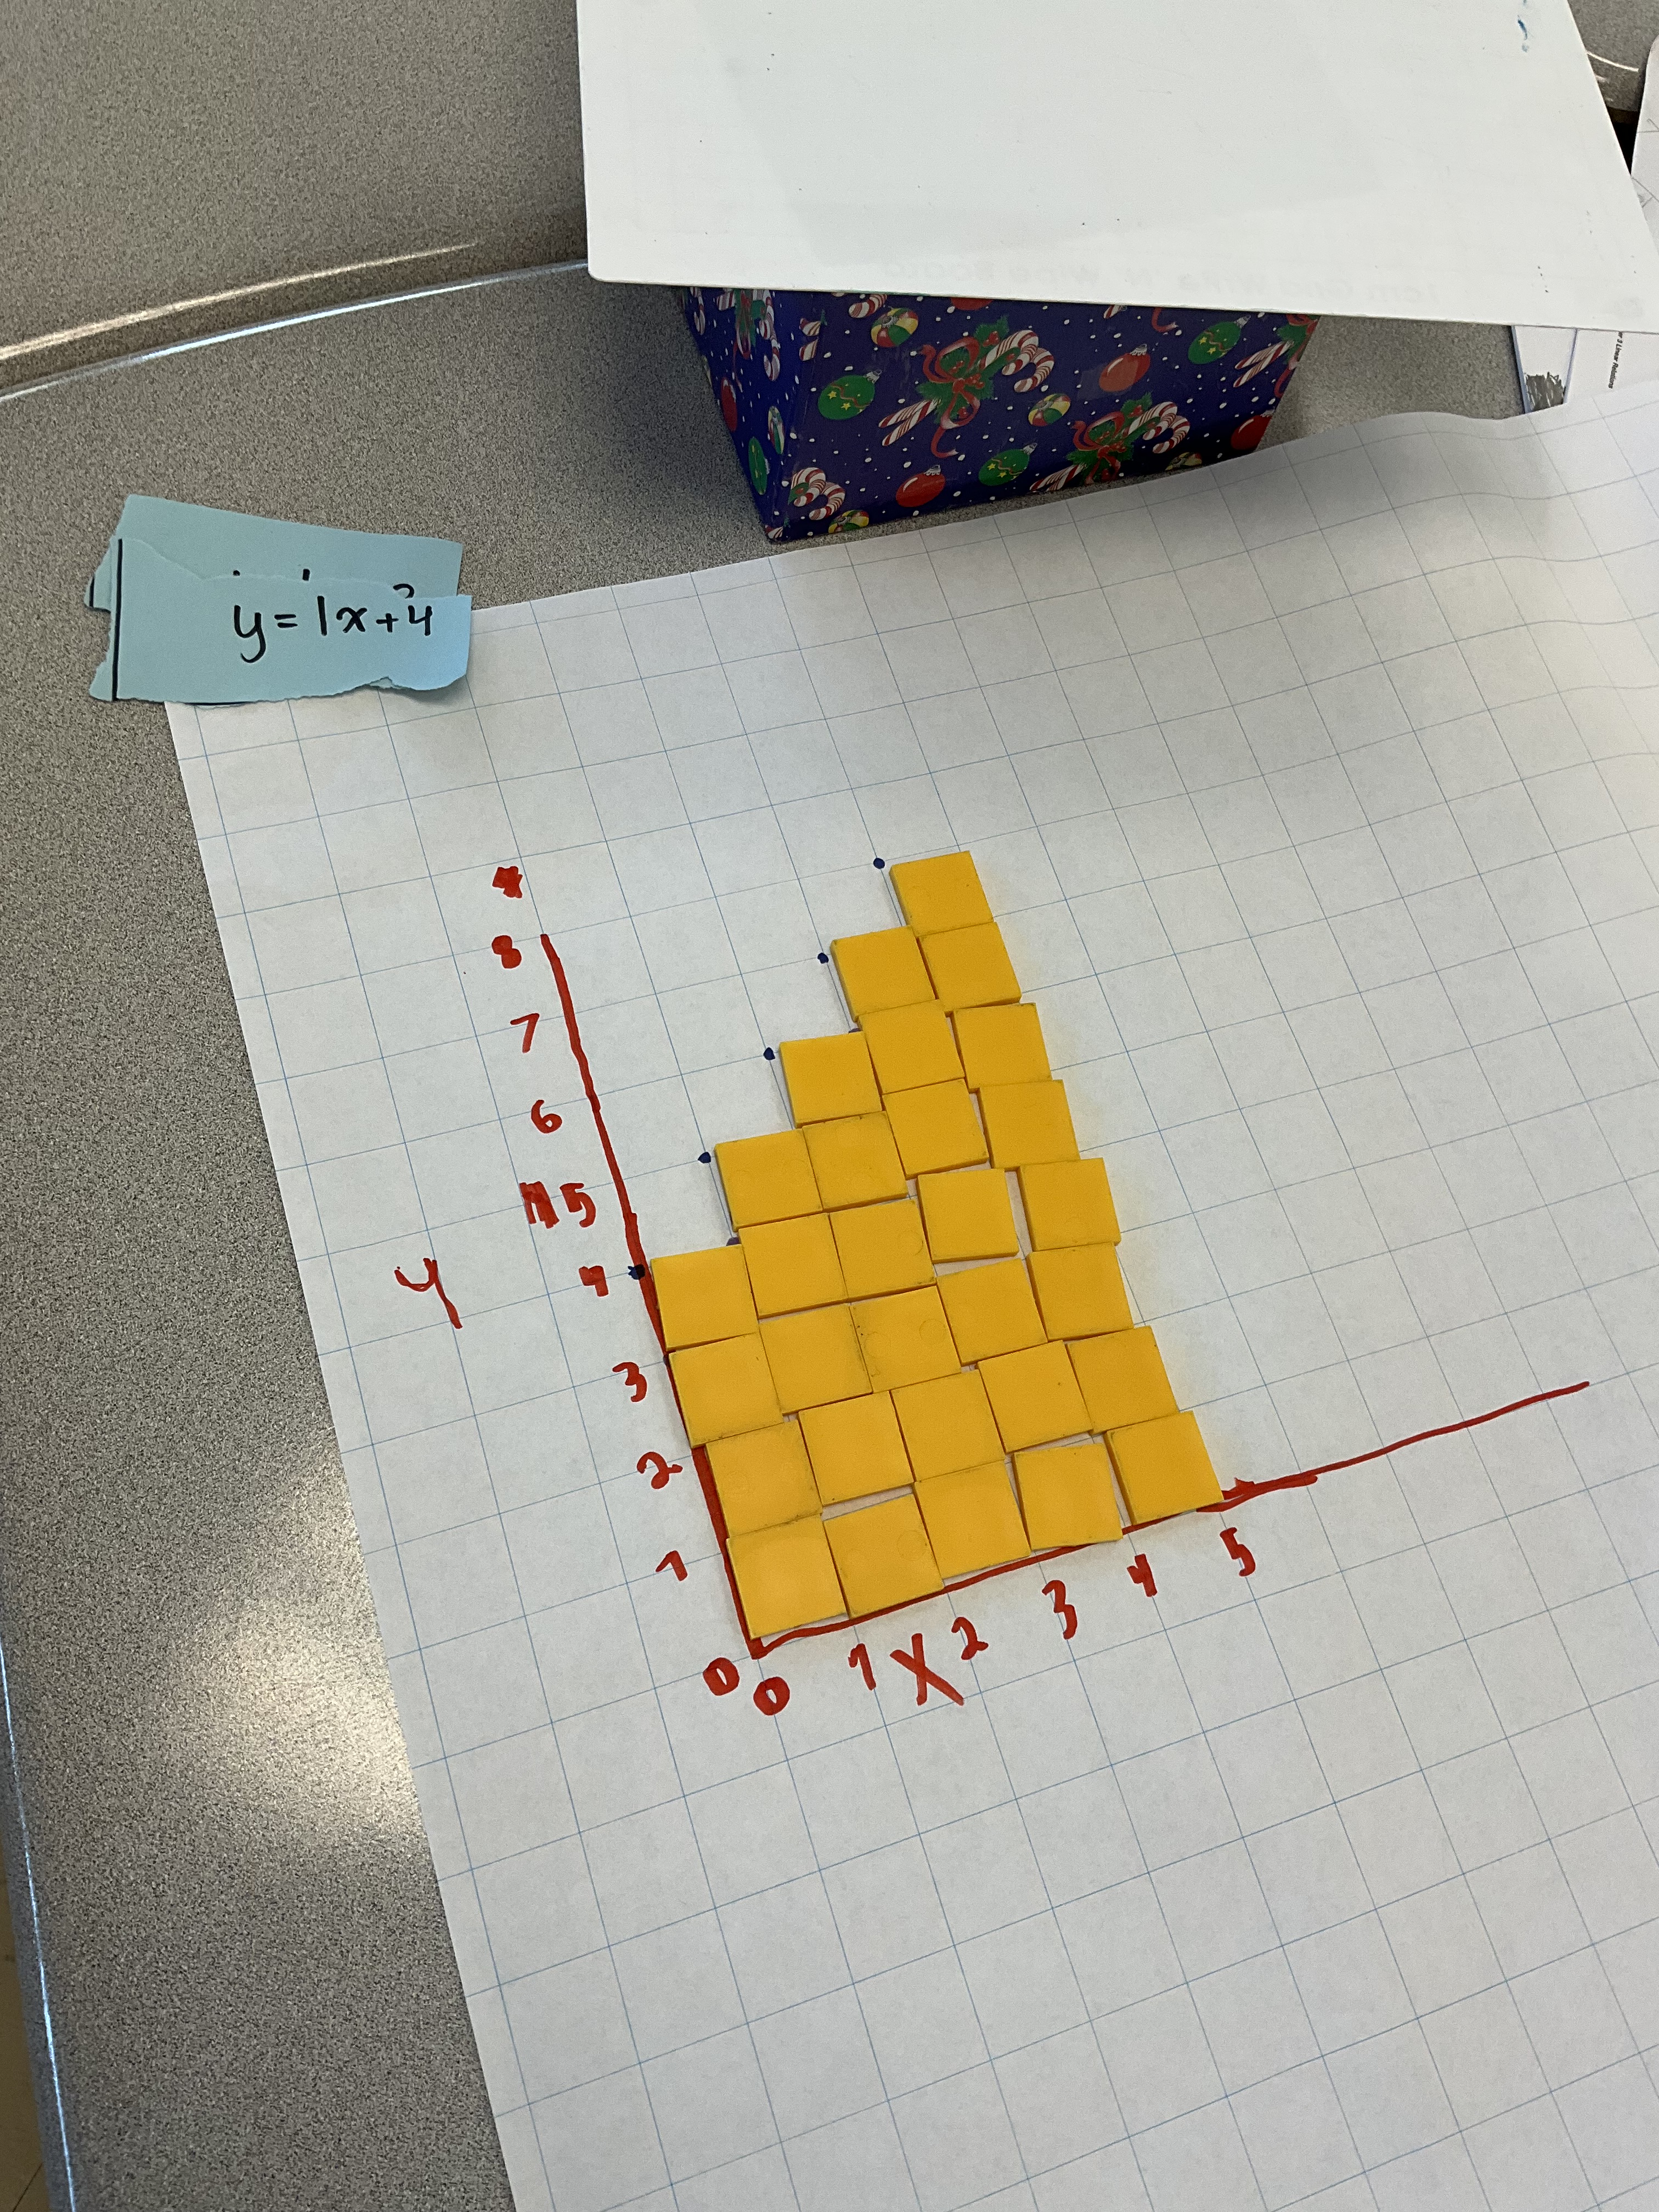
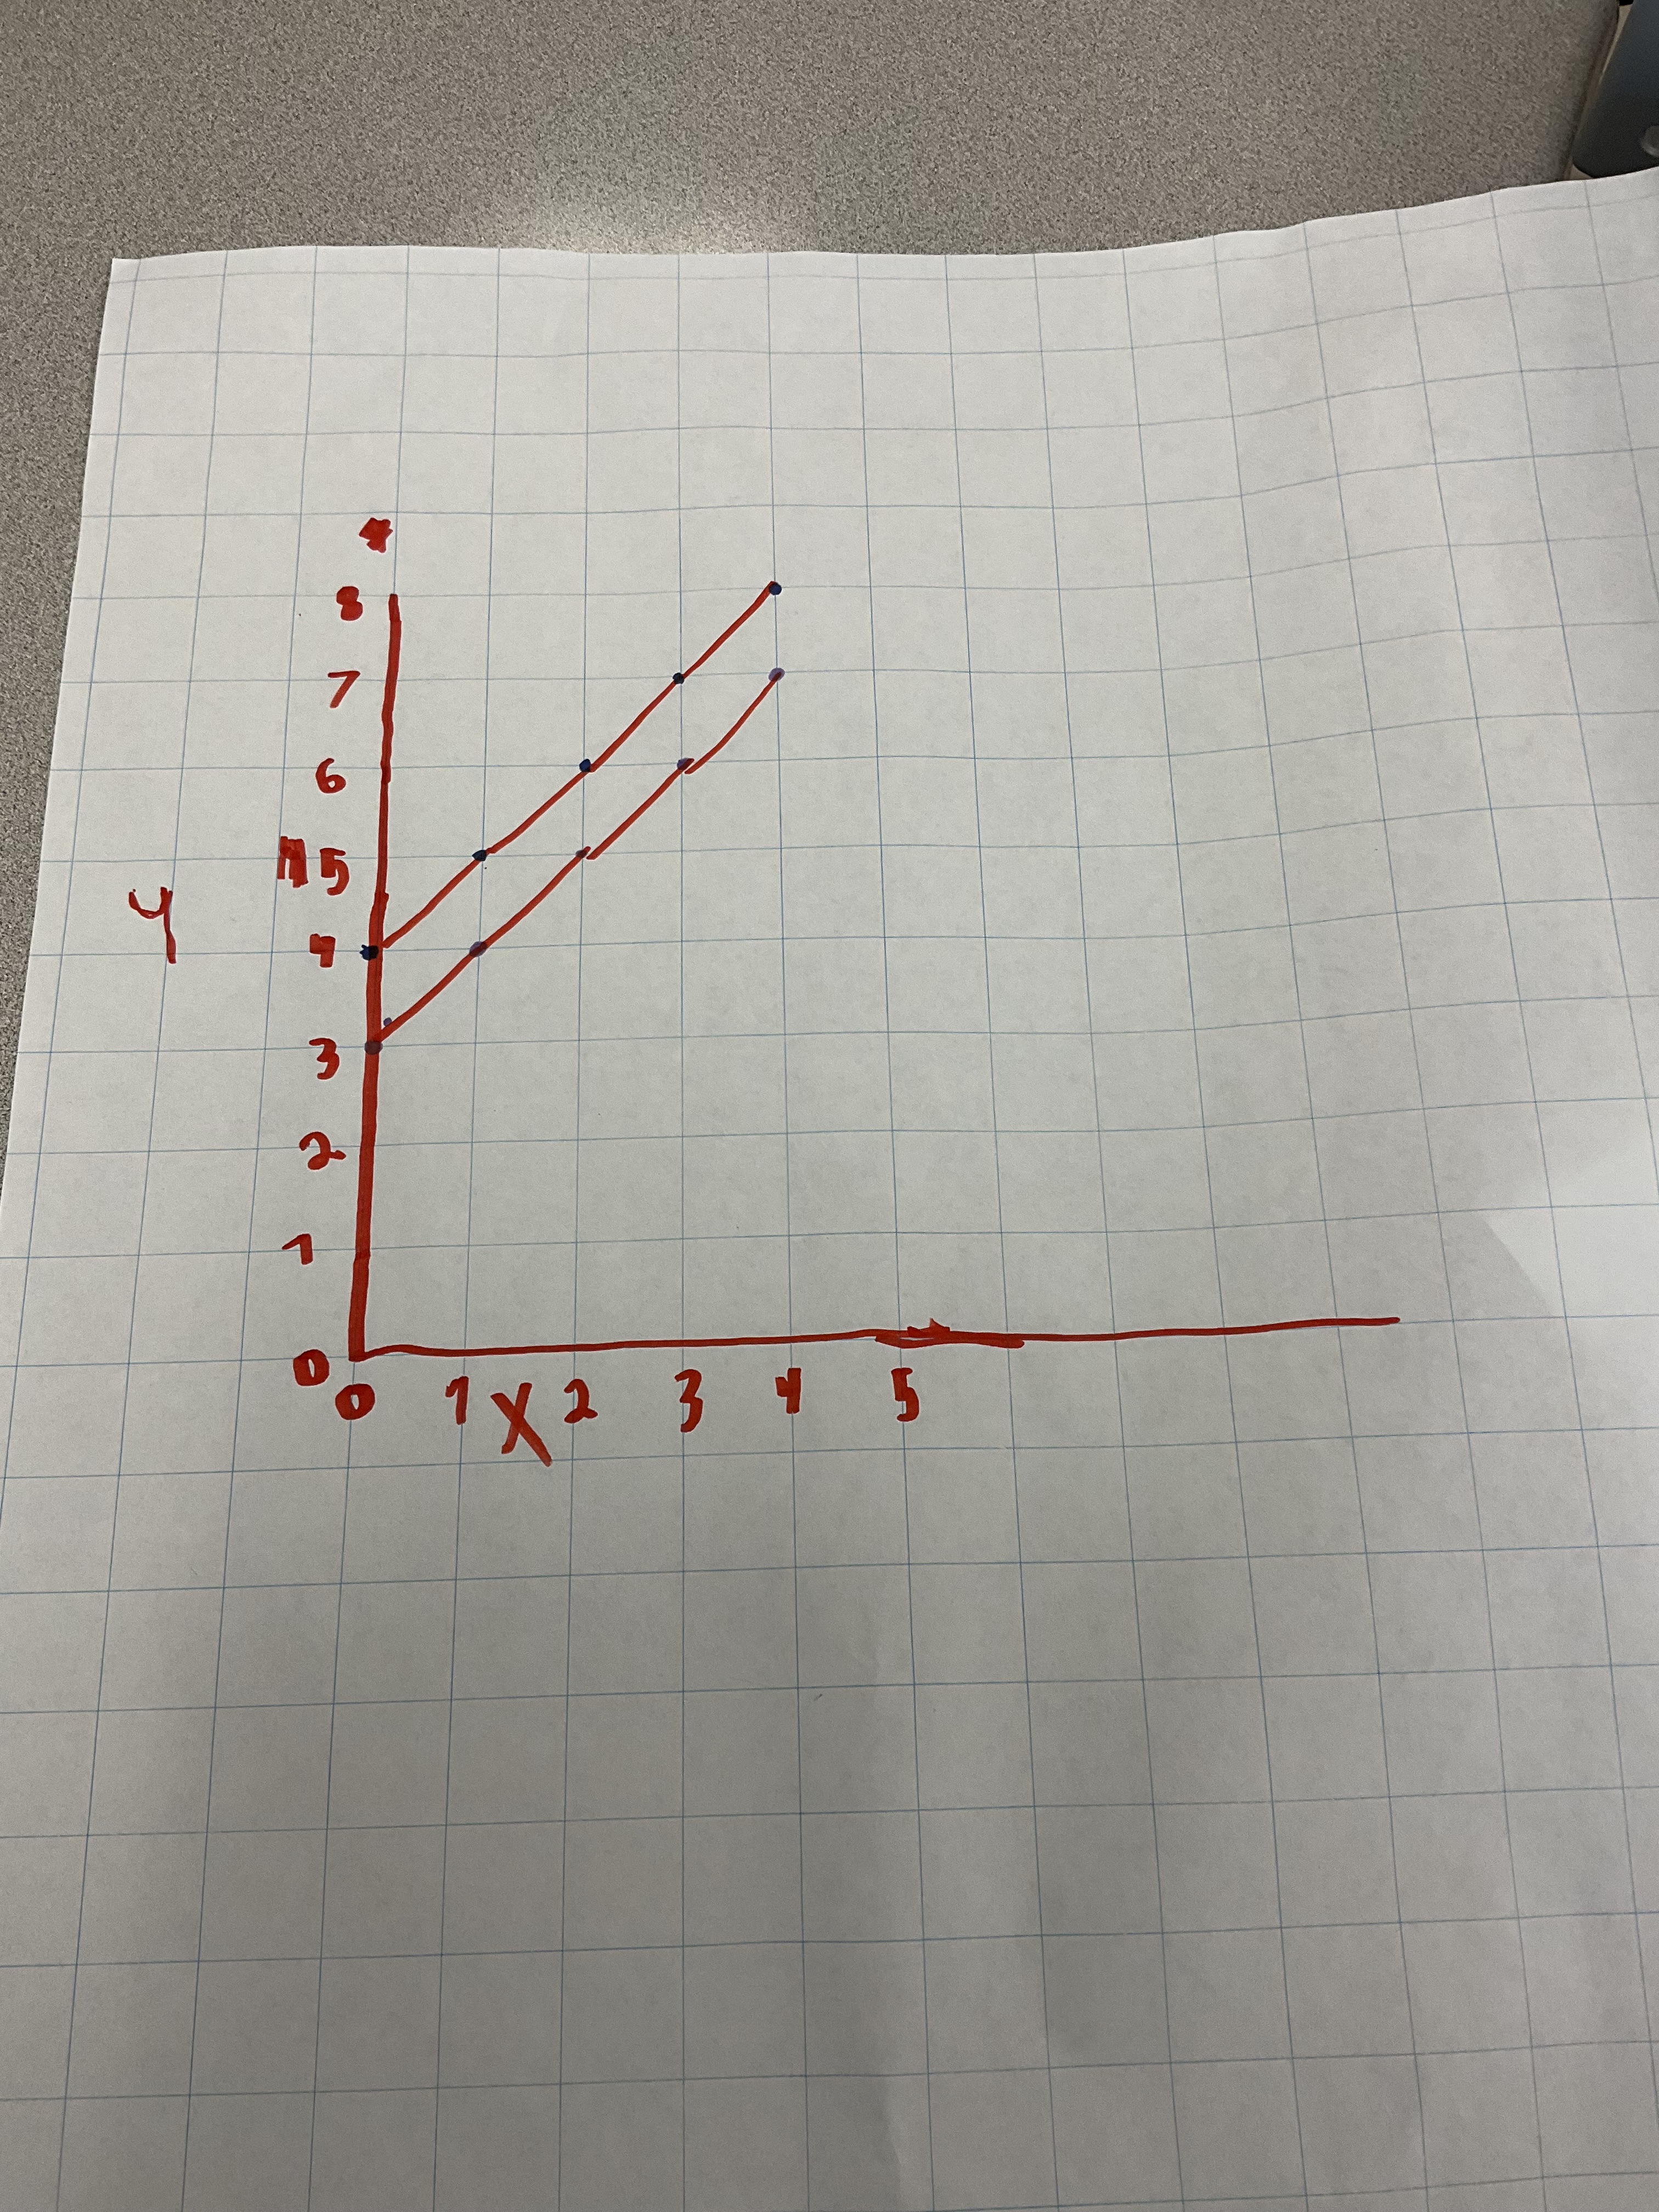
Groups had 2 pattern rules to explore and graph on the same axes with different colours.
here are the results:
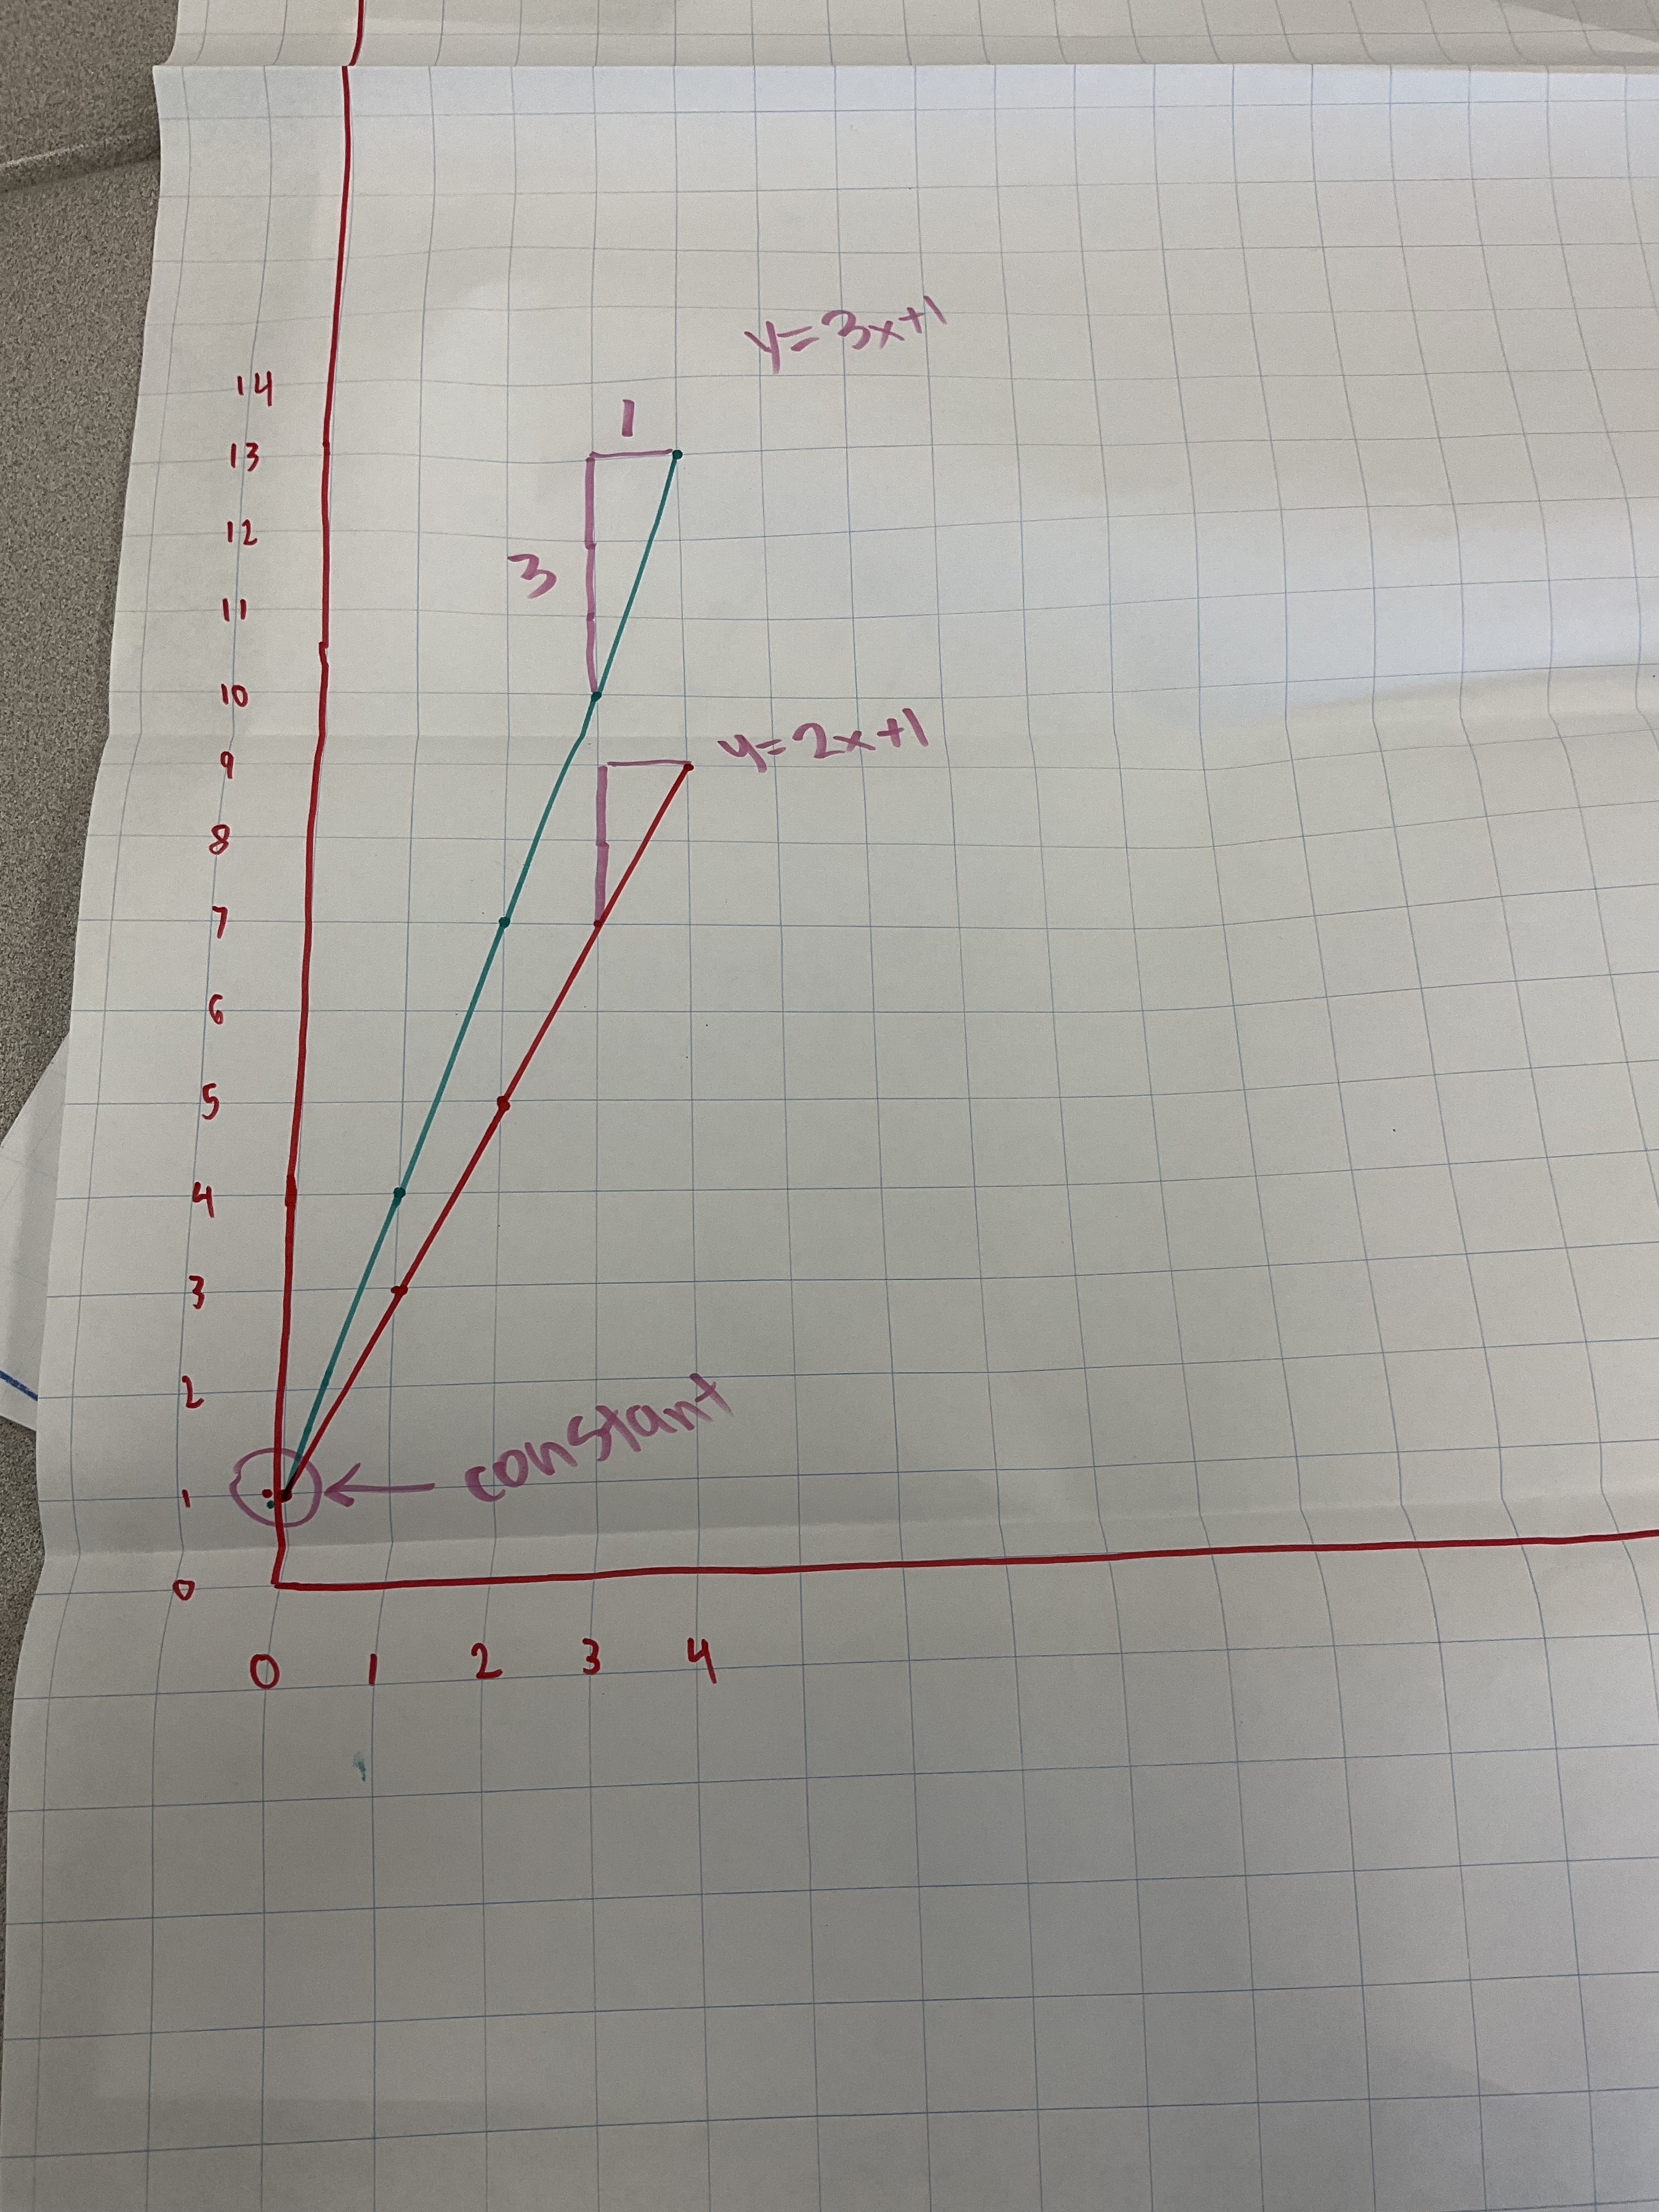
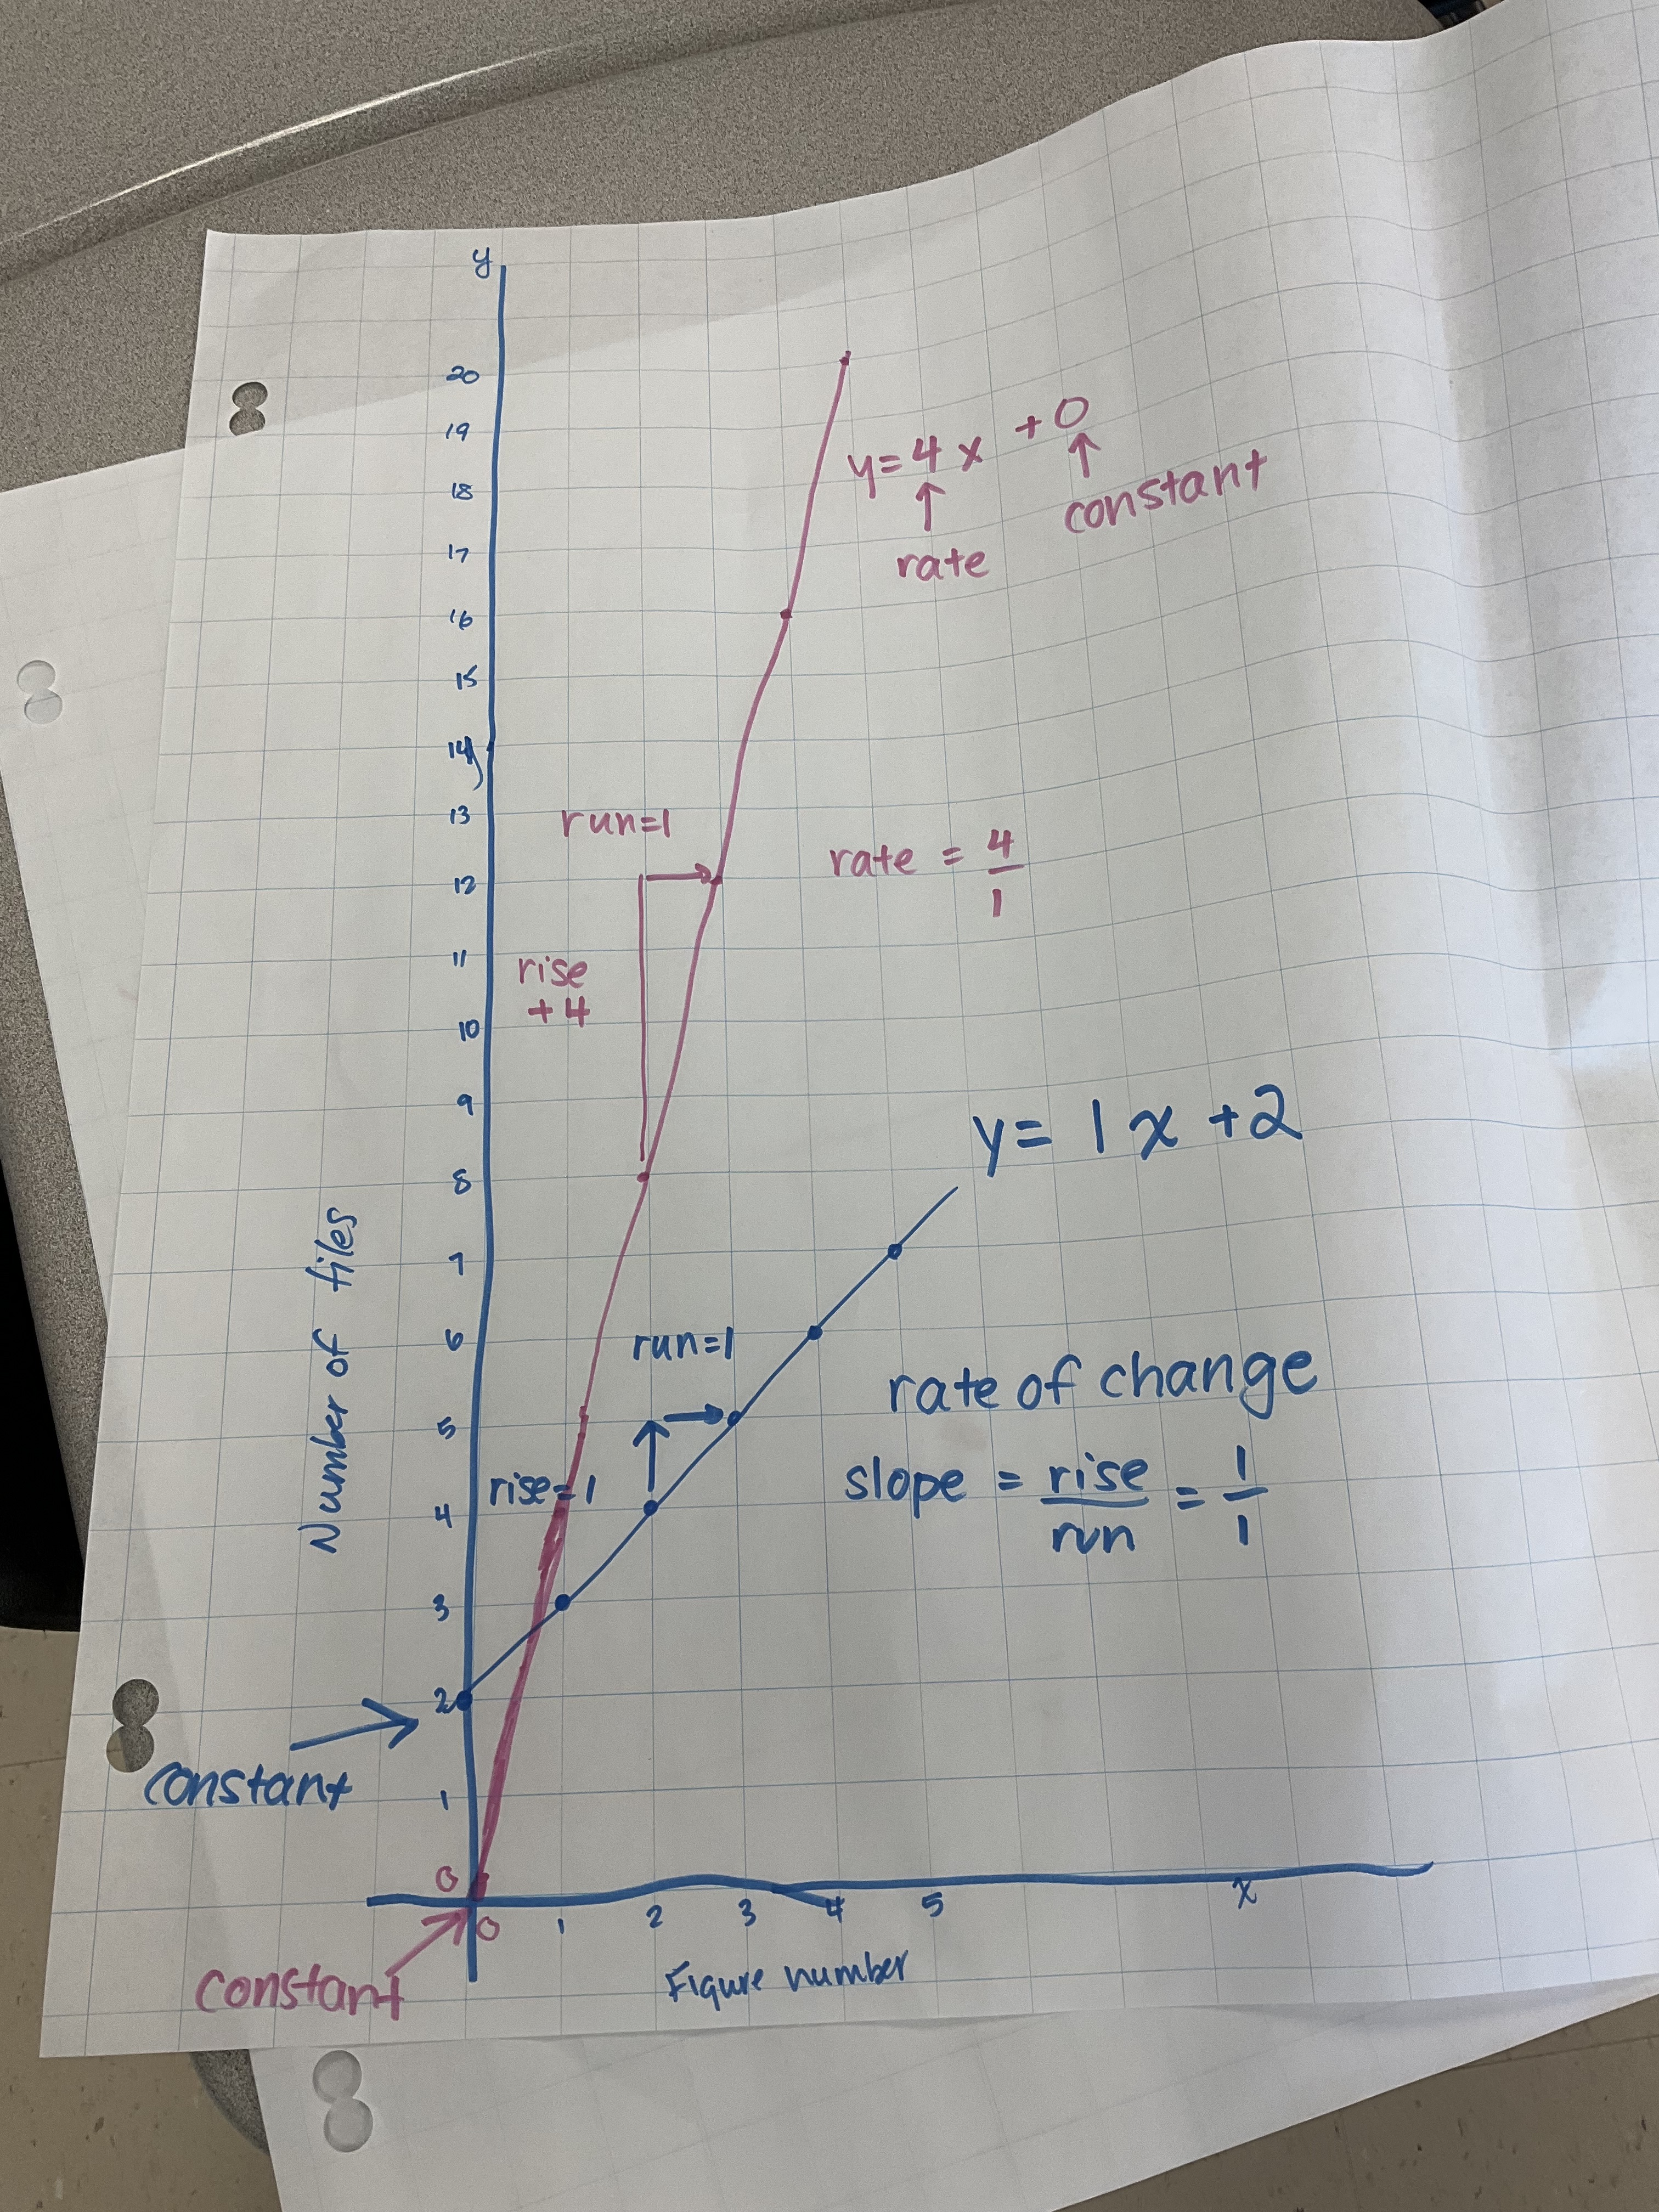
these two lines are parallel, they have the same slope, and different constants, and they will never intersect.
Many thanks to the class for inviting me to come share some activities. I hope to be back again to try something similar with quadratic patterns!
