Circles
We looked at a sprinkler video in grade 10 and then looked at where to place he sprinkler head to make sure that each plant (A,B,C,D) would get watered.
We used the perpendicular bisector (médiatrice) to show all the points that are equidistant to 2 plants. All of these lines intersected nicely to show where to put the sprinkler.
If we wanted to show all of the places that would get watered, we knew that it would be a circle.
We also developed an equation for the circle x^2+y^2=r^2 by using the pythagorean theorem. We know r is the radius. This works for all circles with a center at (0,0).
We can plug in a point (x,y) and calculate r, or we can plug in x and r and calculate y. Our homework will focus on circles to give us lots of practice.
Perimeter and Area
Grade 9s looked at rectangles with a perimeter of 24 today. We learned that there are many ways to make a rectangle with perimeter 24, and that they don’t all have the same area.
Important to note: a rectangle has 4 right angles, by definition, so a square is a kind of rectangle.
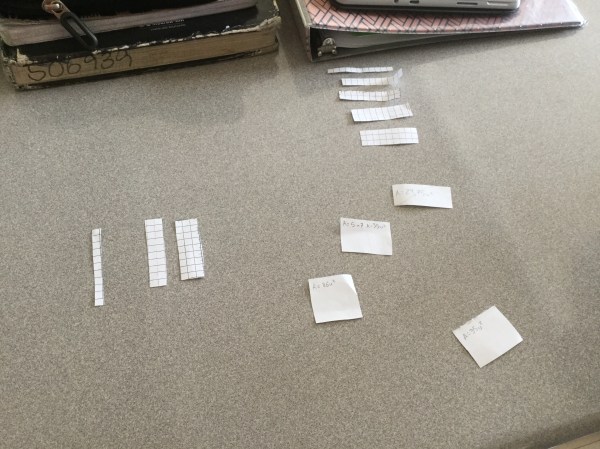
We arranged the rectangles on a graph. Horizontal dimension was the independent variable, and Area was the dependent variable. We used the rectangles as the dots.
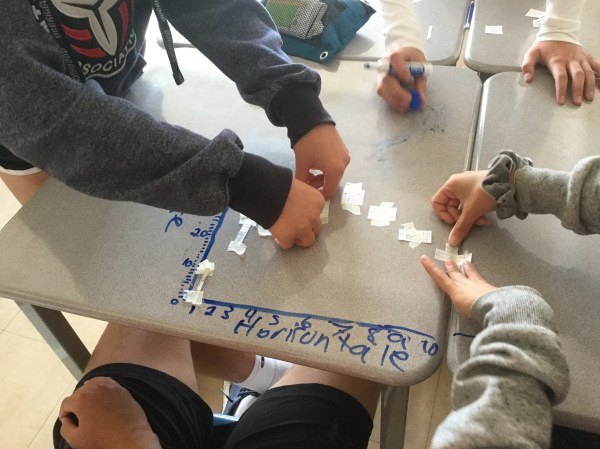
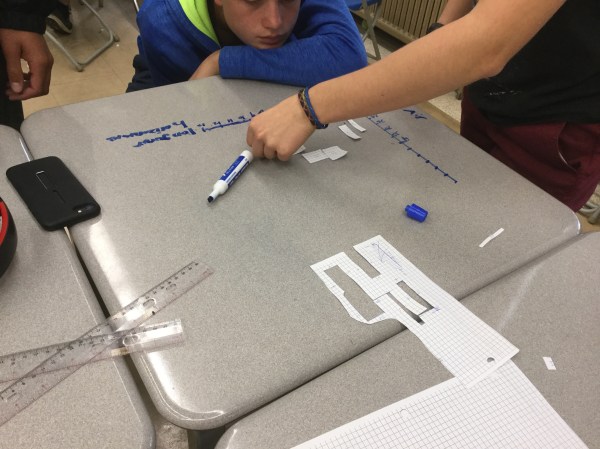

We noticed that in all of the diagrams, the rectangle with the biggest area was the square. We noticed that it’s a non-linear graph, and it’s positive for a while, and then it becomes negative. The graph is also direct, since a rectangle with a horizontal dimension of 0 would have an area of 0 also.

We answered some questions about maximum area, or minimum perimeter for quadrilaterals.

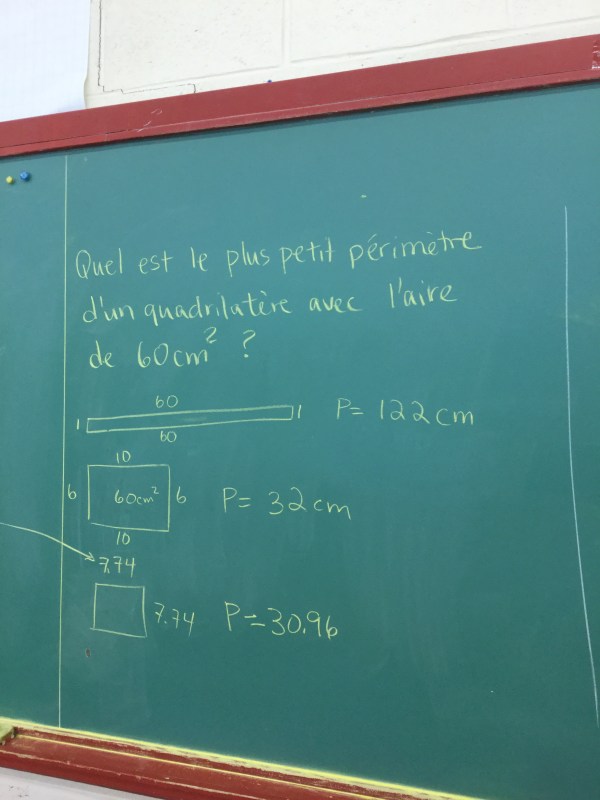
We need to have a good understanding of perimeter, area, and how making a quadrilateral more square, or more snake-like will affect the area/perimeter.
We learned that sometimes we will need to use the square root to find the square’s dimensions, if given the area.
Que remarquez-vous?
Où sont les maths?
Voici une groupe de danse française nommé Géométrie Variable.
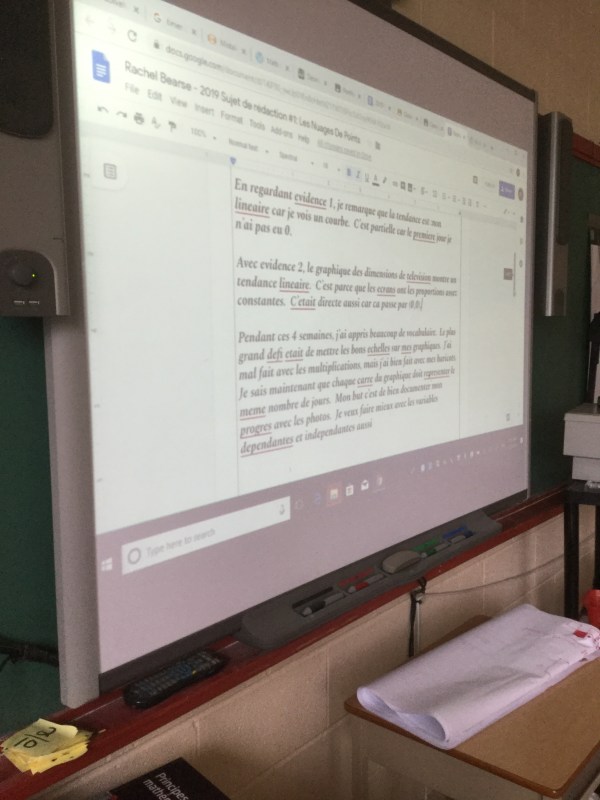
Grade 9 portfolio writing
We looked at the logistics of writing a portfolio composition today. We now know where to find the template (google classroom) and we know how to insert photos, and text and submit. We also know that we need to choose our evidence carefully, explain why we chose it and use it to explain the math that we’ve learned.
We have been reflecting a bit each week in our emails home, so we are getting more comfortable talking about our learning, and our mistakes and corrections.
 we have many examples of scatter plots that we can use, since we’ve done quite a few data collection activities recently.
 we’ve got planning templates to help us organize our thoughts, and today we had time to get started.
 we also had a rainy terry fox walk part way through the class this morning.
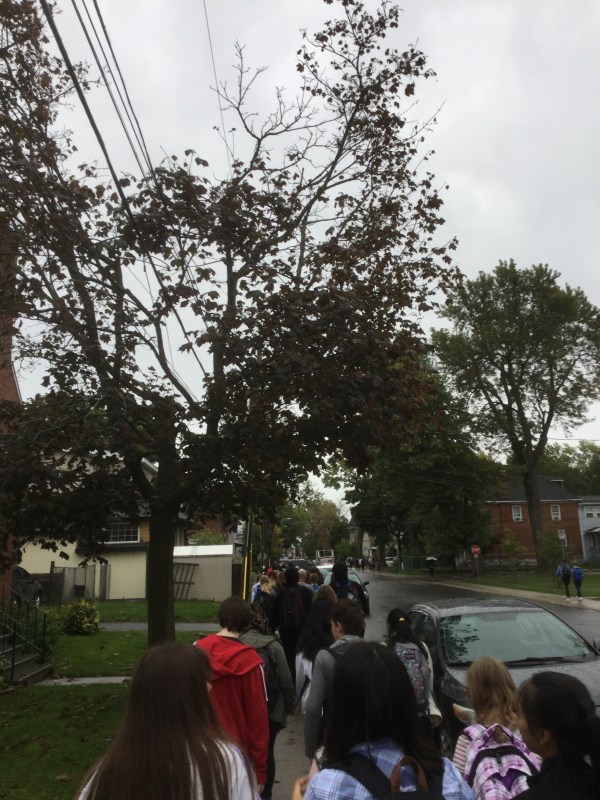
Have a great long weekend!
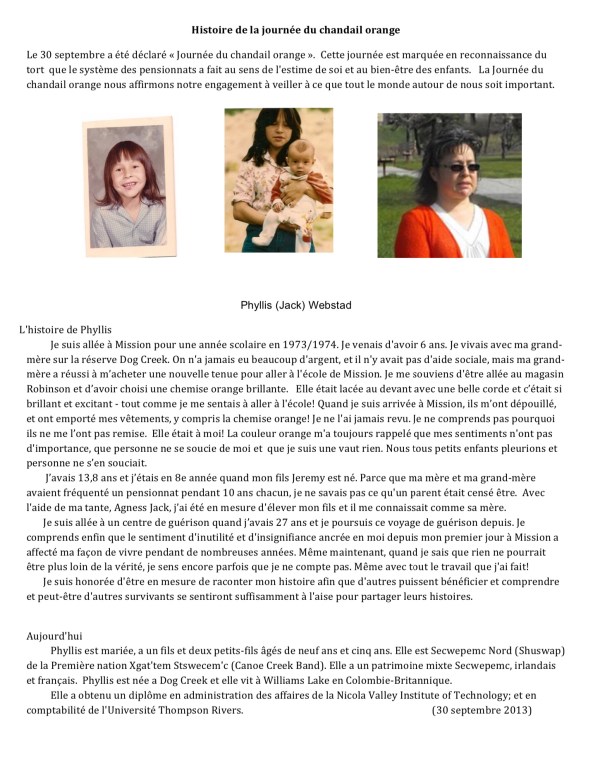
Journée du chandail orange (lundi)
Problem solving
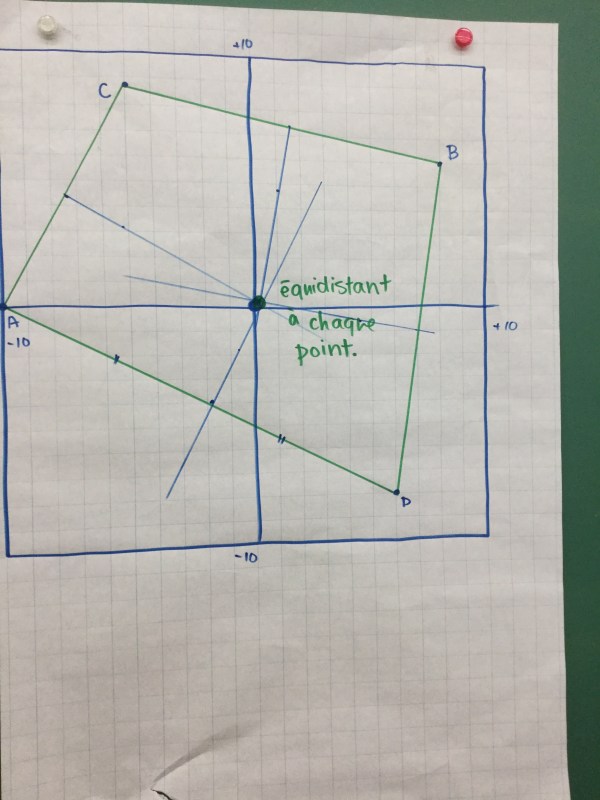
Grade 10s worked hard today solving a series of problems about a triangle. Given only the 3 coordinates of the points of the triangle we classified it (determined it was a scalene right angle triangle). We used side lengths and slopes to help us with that task.
 We also calculated the area and perimeter, and then we found the equations of the perpendicular bisectors of the legs (les médiatrices des cathètes). Since we always need more practice with this, we then found the point of intersection of these two lines with substitution or elimination.

Next we compared that point to the midpoint of the hypotenuse, and found that the two were the same!
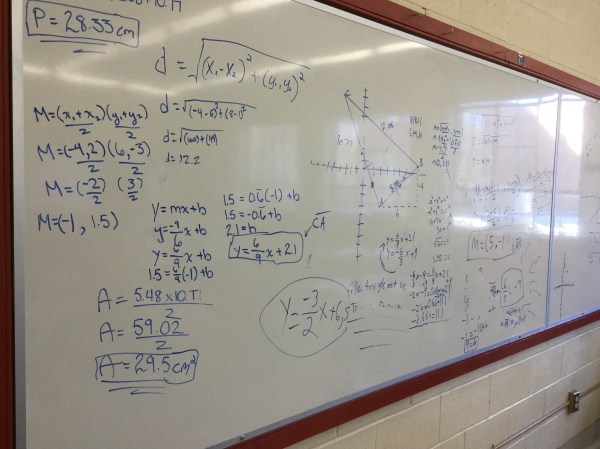
We might need to work on the clarity of our communication, but we have made great strides on solving problems! Good work today grade 10s.
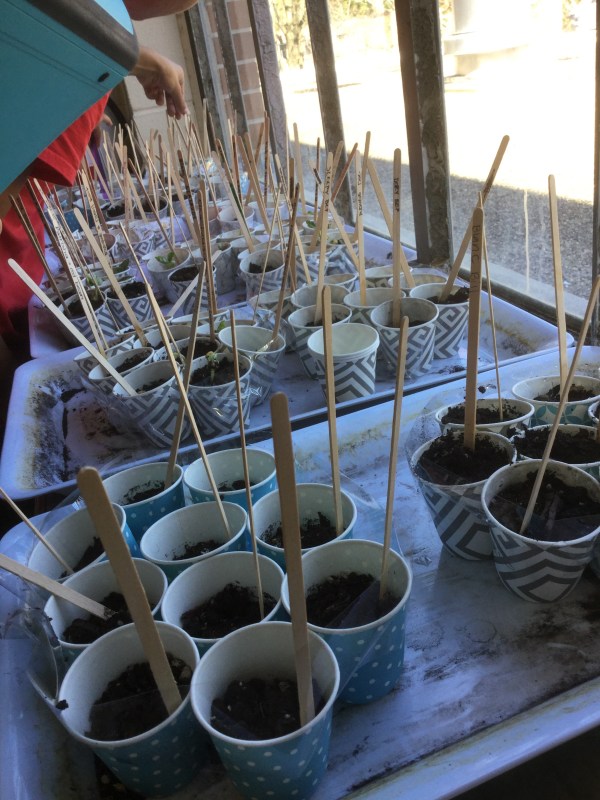
Graphing our bean growth
Grade 9s are graphing bean growth today!

Look at that before and after comparison! We expect to see positive trends!
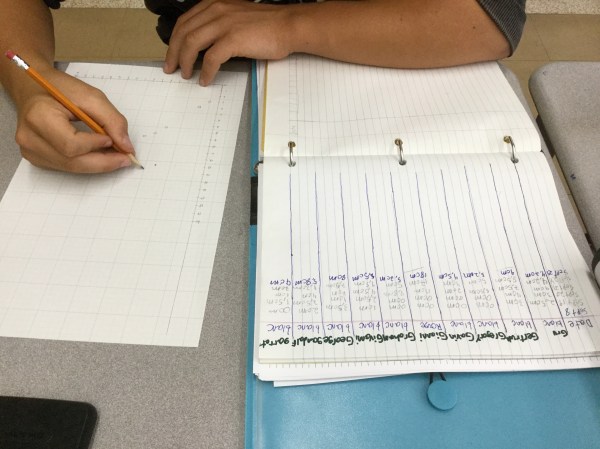
We’ve been measuring and tracking the growth of many plants. Today we chose one red bean and one black eyed pea, and we’re plotting two graphs on the same axes. We are able to compare growth rates, and predict how tall they’ll be in a week.
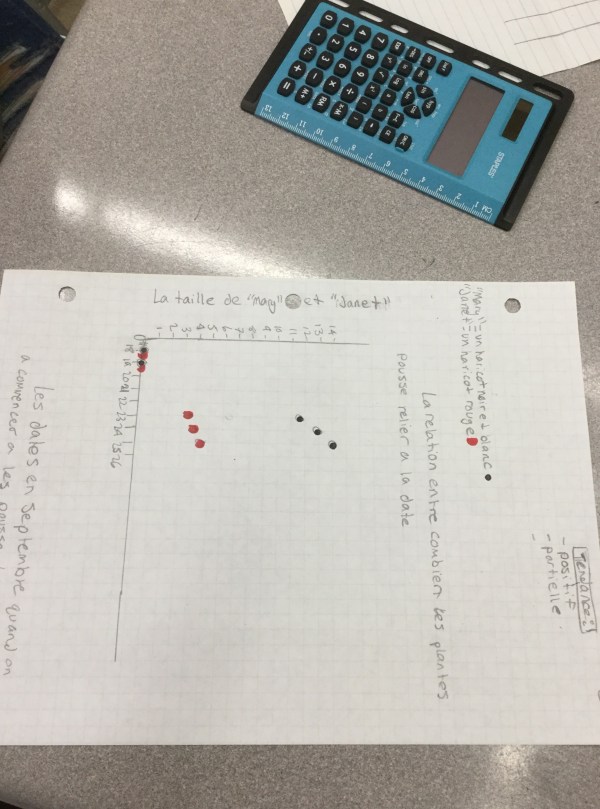

We are making clear scales on axes, plotting points, using a legend, and deciding if our data shows a linear or non linear trend. We made our predictions, and we will report back in October to share how accurate our predictions were.
We are also beginning to work on our math portfolio.

We are making notes and brainstorming using our template, and then we’ll write our submission and hand it in via google classroom.
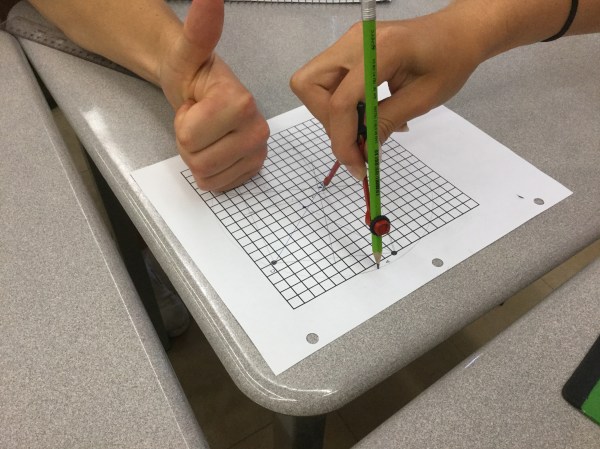
Perpendicular Bisector
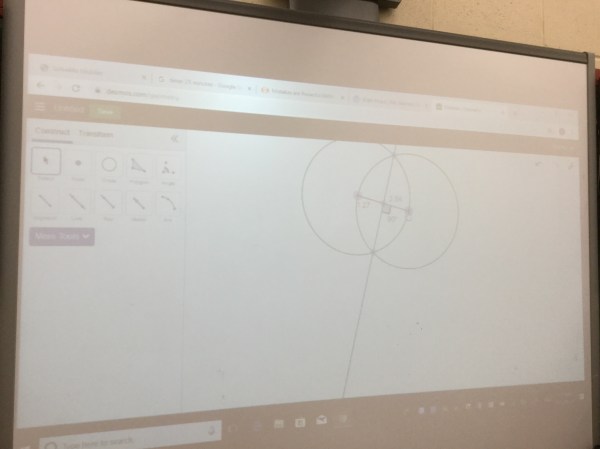
We looked at desmos geometry today to construct perpendicular bisectors (la médiatrice). These are lines that pass through the midpoint of a segment, and run perpendicular to the segment.
We have to use all of our skills (finding slope, calculating midpoint, using knowledge of perpendicular slopes, and calculating the y intercept)
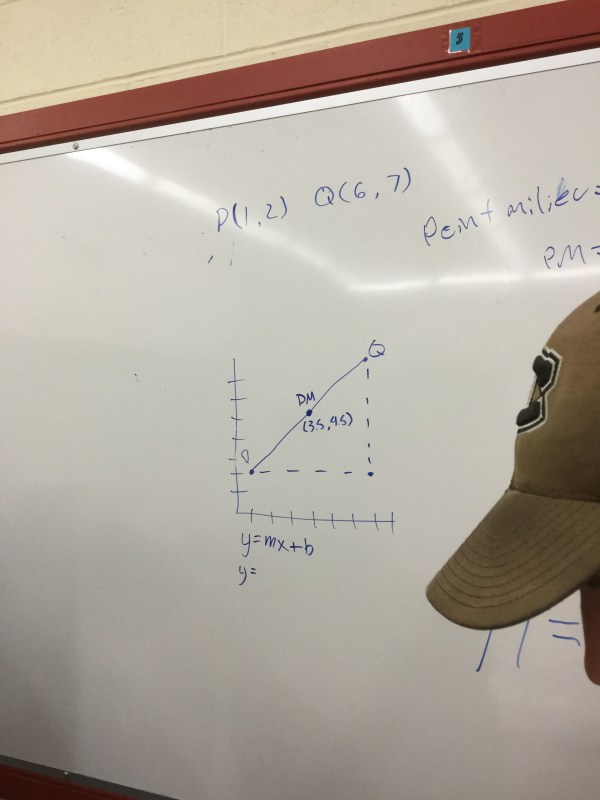
We worked together to represent our solutions, at the board, and then worked a little from our textbook,
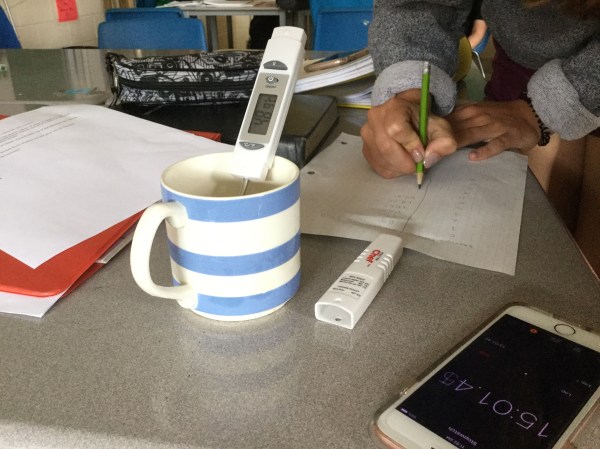
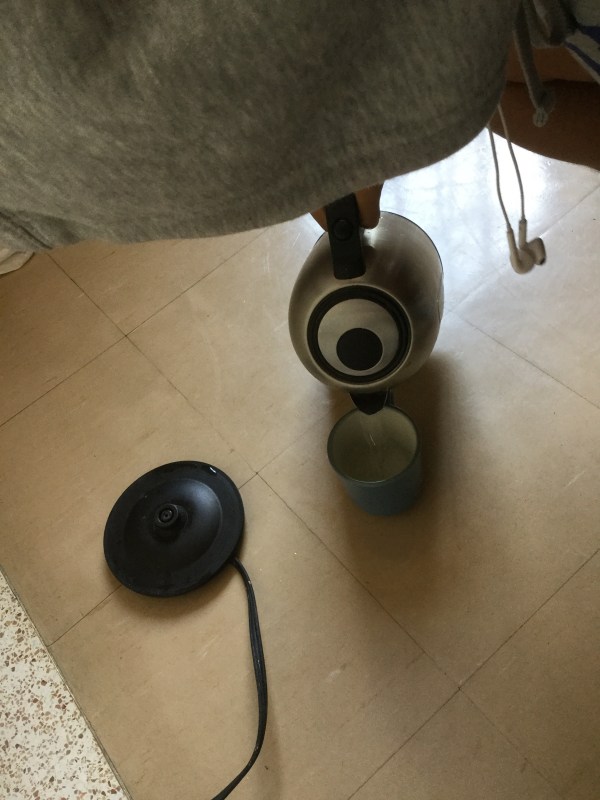
Two math experiments
Today grade 9s did two experiments. One looked at the cooling of hot water, and the other looked at the frequency of sound produced when we blow over the neck of a bottle compared with the depth of water in the bottle.
We measured the depth.
We blew across the mouth of the bottle to make a noise, which is not always an easy task!

We used the app “sonic tools” a free download, to measure the frequency of sound. We then decreased the amount of water in the bottle and tried again and again and again.

We made tables of values and made graphs
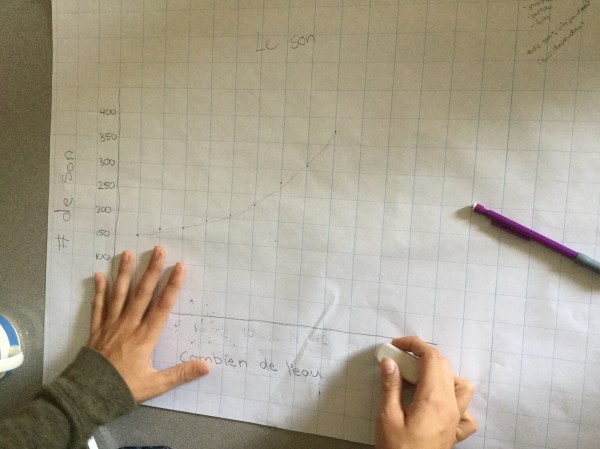 We are looking at trends and scales and axes, and making sure that we are communicating clearly.
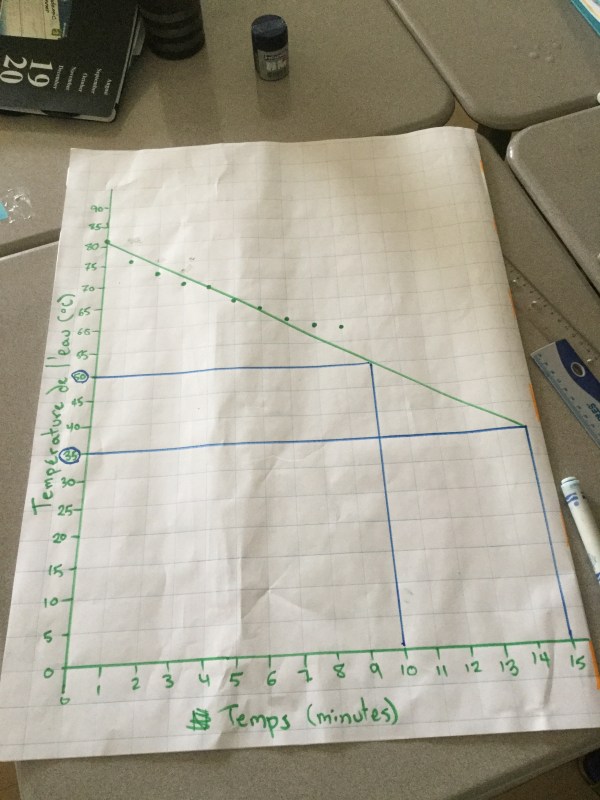
For the temperature experiment we poured hot water into a mug, and took temperature readings each minute.
After 5 minutes, we made a best fit line and extrapolated to predict the temperature at 10 minutes and 15 minutes.

We made clear graphs…
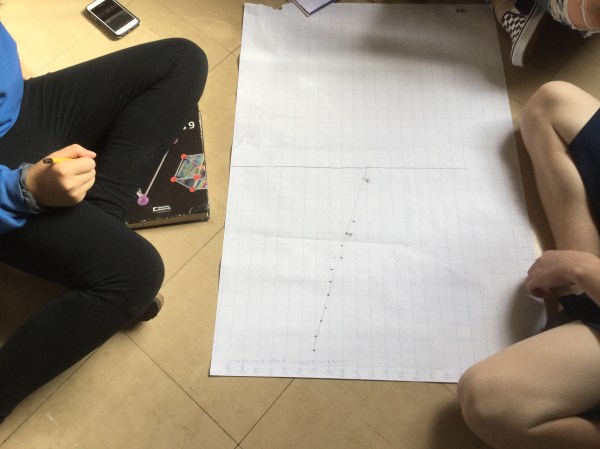
And compared our real data at 15 minutes with the predicted temperature at 15 minutes. In most cases, the water had not cooled as much in reality as predicted. We realized that the data is not linear, but gently curved.