Planning a good strategy
Grade 10s are working on problem solving, especially planning a good strategy.
We looked at how to decipher a problem to pull out important aspects that are hints for what strategies we may need.
We talked through some of the homework questions that had been challenging, and we also learned a new fact about quadrilaterals. If you join the midpoints of each side, the interior quadrilateral that is formed is always a parallelogram).

We calculated slopes and classified that the central shape is a parallelogram, and then we verified that it will always be the case by making a dynamic model with desmos geometry. We can measure angles and side lengths, and then adjust the drawing and see what happens to the side lengths and angles.
Math Speed Dating
Today, in grade 9, we did some problem solving practice, in a new format.
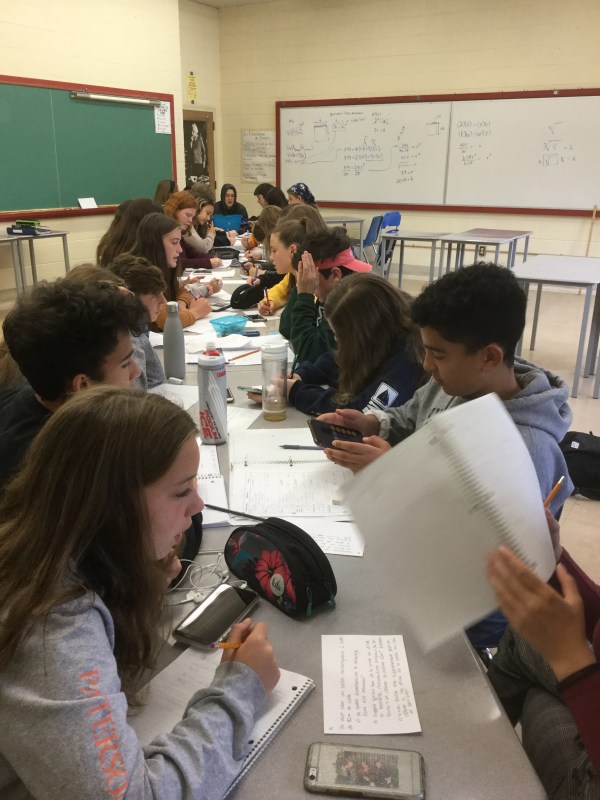
We had a long row of desks, and we worked with our partner across the table. We used our formula sheets, and strategized to solve optimization questions, or composite volume problems, or pythagorean theorem problems.

After all problems are adequately solved, one side of the table is named the “experts”, and they stay put, while the other side stands and shifts to their right. They, the newcomers to the problem, will do the problem, with the support of the expert if needed. 
The newcomer then is named the expert, and they stay put, while the other side, stands and shifts to their right, creating a new partnership.
This reciprocal teaching/review method works well for many activities. We’ll be doing it again regularly.
Cylinders
Today grade 9s had an interesting problem to solve. We investigated the cylinders made from a sheet of paper lengthwise vs widthwise. We compared the volumes of these cylinders.

We made the connection between the page dimensions and the circumference, and then calculated the diameter and radius.
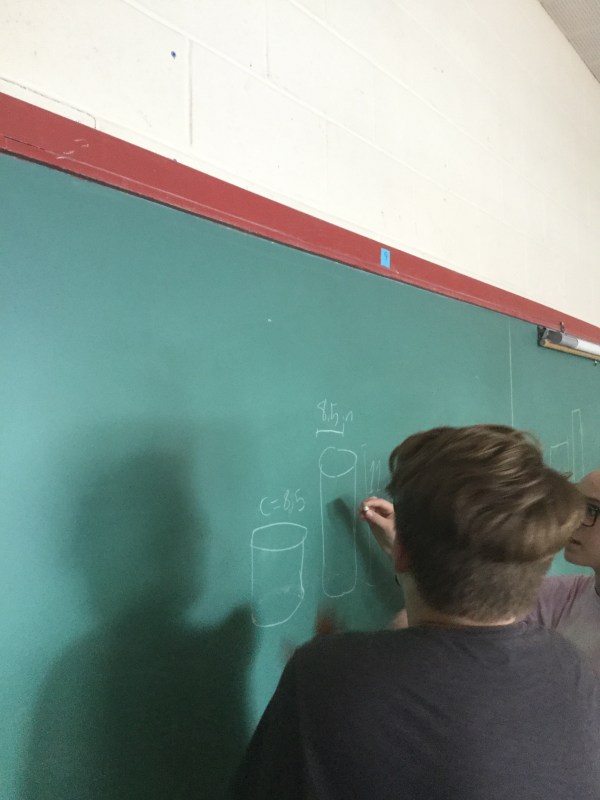
We used the radius to calculate the volume.

And then we compared the two cylinders based on their volumes.

We did a lot of great thinking today!
Finally we consolidated and learned that the more cube like the cylinder, the smaller the area will be for a given volume. So when the cylinder’s height is equal to the diameter, the area is the smallest. Or for a fixed area, the volume will be the largest.
Que voulez-vous savoir?
Same volume, different areas.
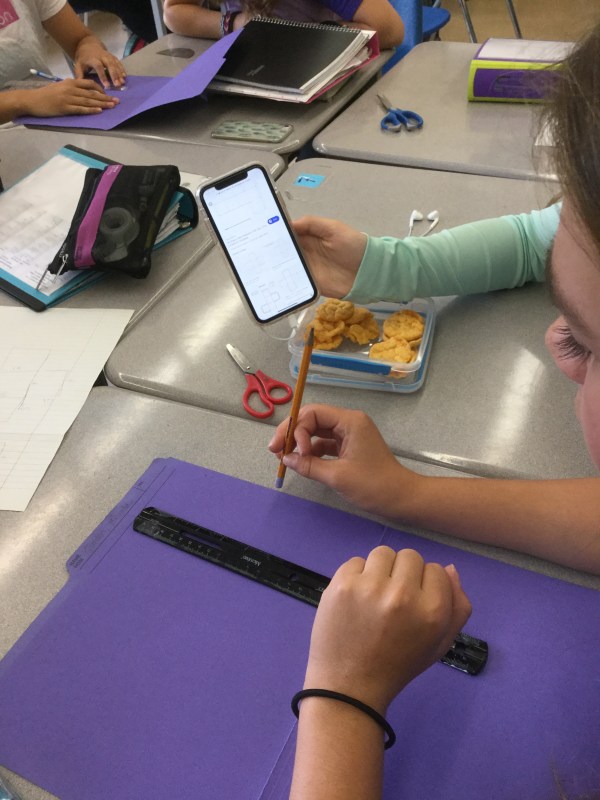
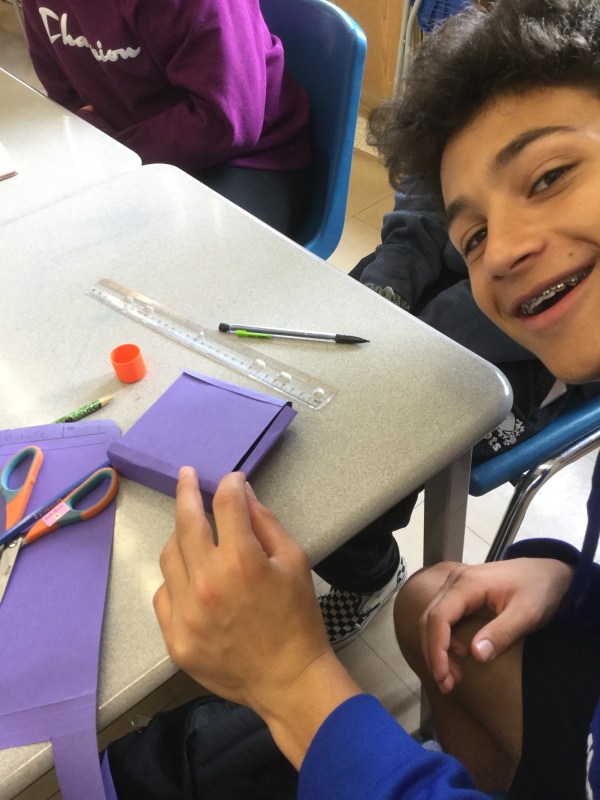
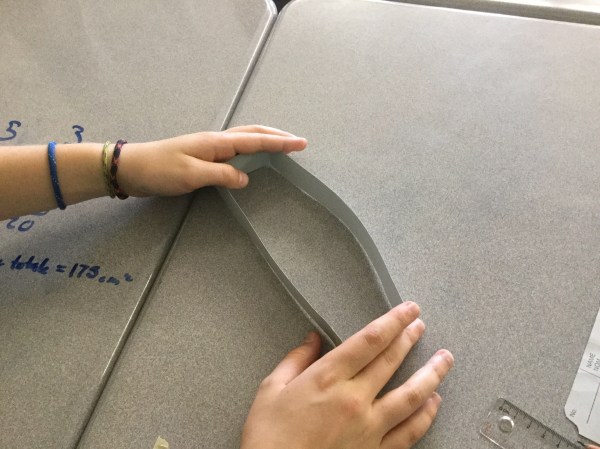
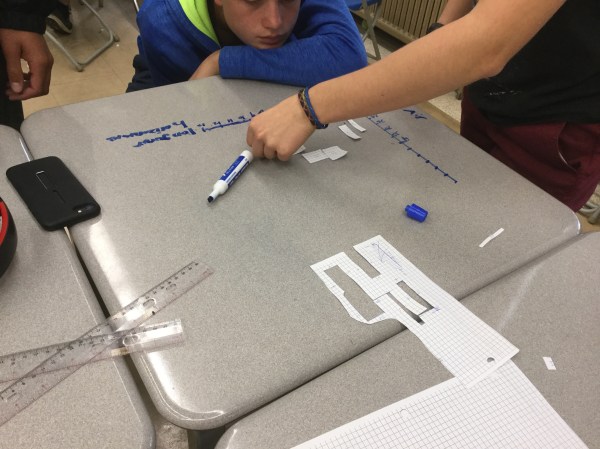
Grade 9s were tasked with creating rectangular prisms today with volumes that were 300cm^3.
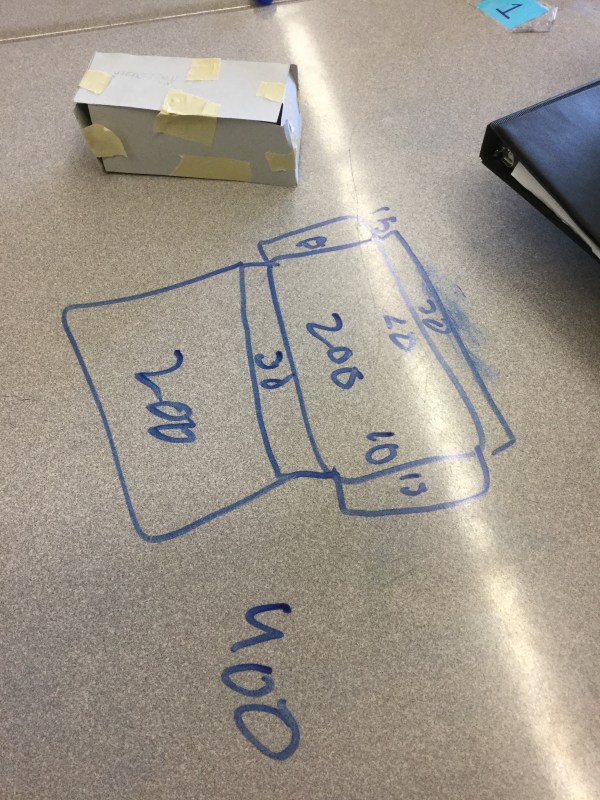
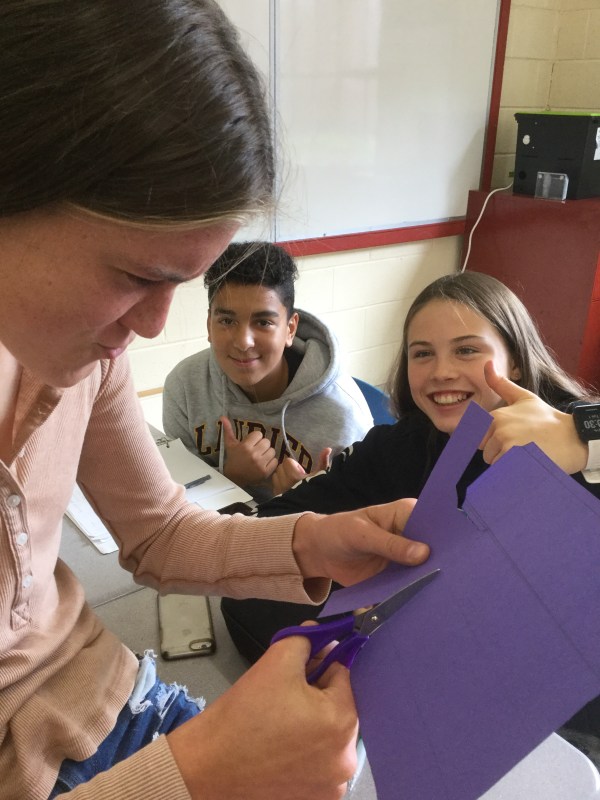
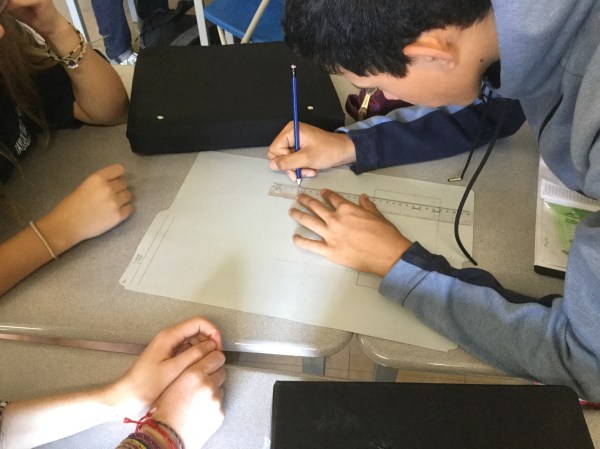
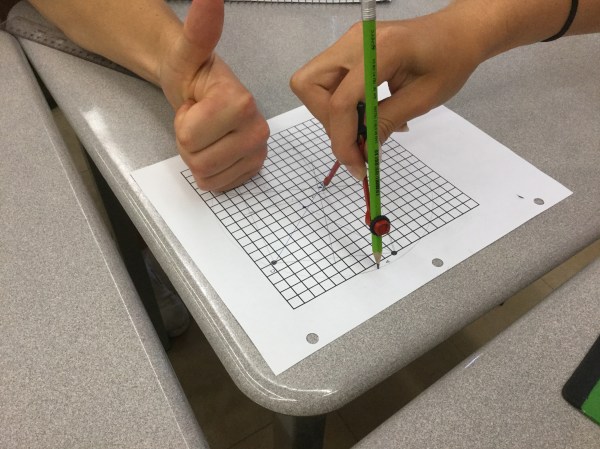
Many groups made plans first, then measured and cut out their boxes.
Each group had to then calculate the surface area of their prism.

And then were tasked with making another one, with the same volume and a bigger or smaller area.
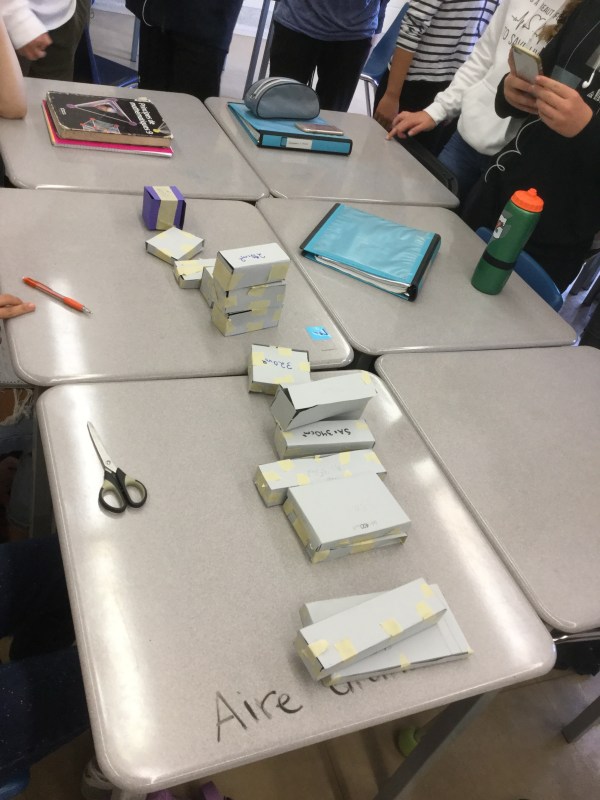
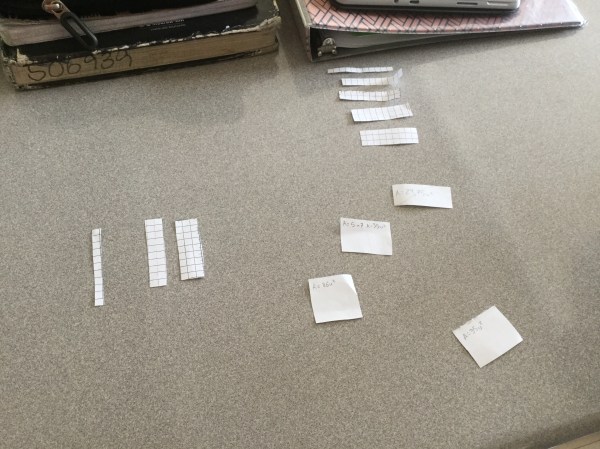
After all of the prisms were made, we arranged them from smallest to biggest surface area.
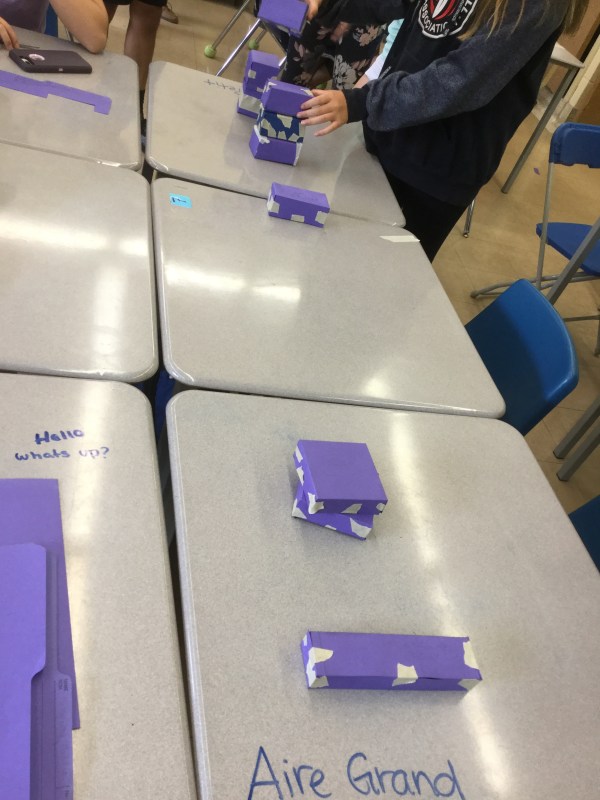
We now know that if the volume is the same for two prisms, the surface area is not always going to be the same. The surface area can be bigger or smaller in number than the volume.
We noticed that the closer the dimensions get to being the same, the smaller the surface area gets (a cube is always the least area), and when the dimensions get really different (plate or snake shapes) the area gets big.
Applications of this are when we package objects, we aim for the most cube shaped box, to save money (less material needed for the box). We also can find this surface area/volume ratio in biology, as the reason for cell division, why we have dense spongy lungs, and why worms can breathe through their skin.
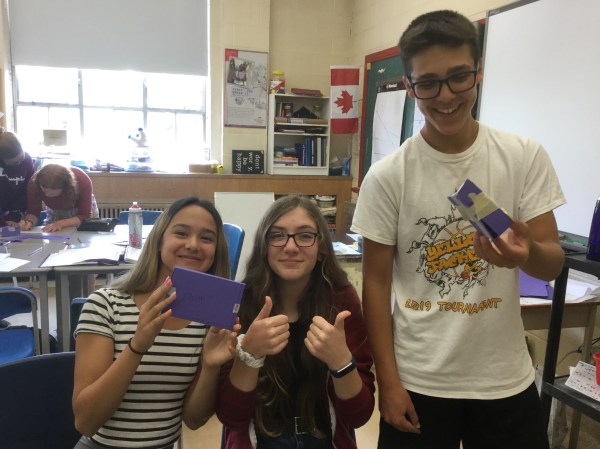
Good work today grade 9s!
Que remarquez-vous?

Circles
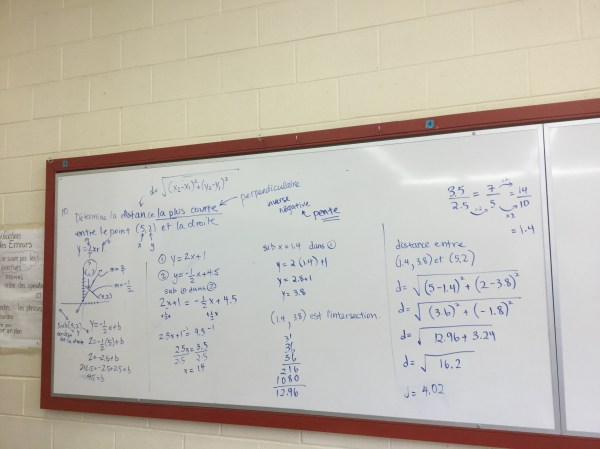
We looked at a sprinkler video in grade 10 and then looked at where to place he sprinkler head to make sure that each plant (A,B,C,D) would get watered.
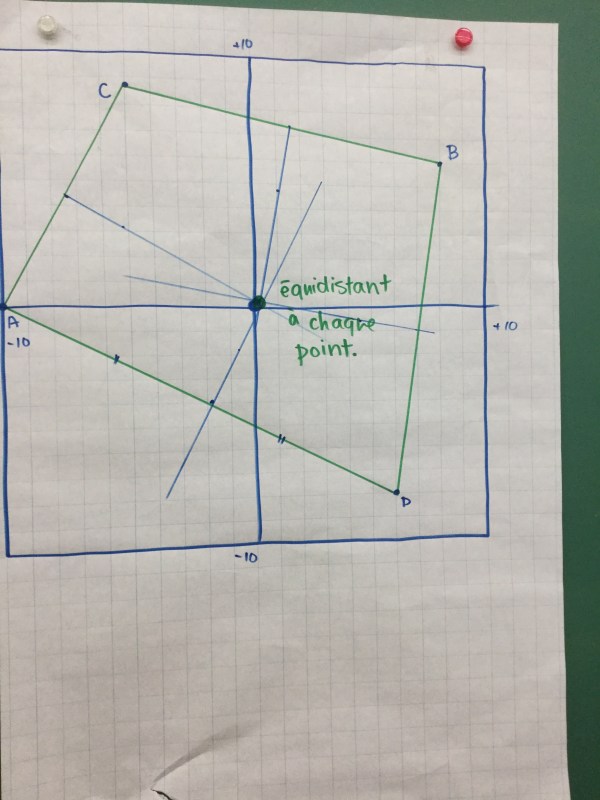
We used the perpendicular bisector (médiatrice) to show all the points that are equidistant to 2 plants. All of these lines intersected nicely to show where to put the sprinkler.
If we wanted to show all of the places that would get watered, we knew that it would be a circle.
We also developed an equation for the circle x^2+y^2=r^2 by using the pythagorean theorem. We know r is the radius. This works for all circles with a center at (0,0).
We can plug in a point (x,y) and calculate r, or we can plug in x and r and calculate y. Our homework will focus on circles to give us lots of practice.
Perimeter and Area
Grade 9s looked at rectangles with a perimeter of 24 today. We learned that there are many ways to make a rectangle with perimeter 24, and that they don’t all have the same area.
Important to note: a rectangle has 4 right angles, by definition, so a square is a kind of rectangle.
We arranged the rectangles on a graph. Horizontal dimension was the independent variable, and Area was the dependent variable. We used the rectangles as the dots.
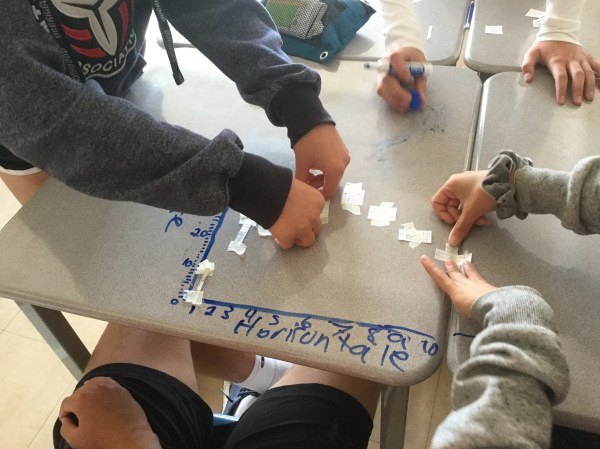

We noticed that in all of the diagrams, the rectangle with the biggest area was the square. We noticed that it’s a non-linear graph, and it’s positive for a while, and then it becomes negative. The graph is also direct, since a rectangle with a horizontal dimension of 0 would have an area of 0 also.

We answered some questions about maximum area, or minimum perimeter for quadrilaterals.

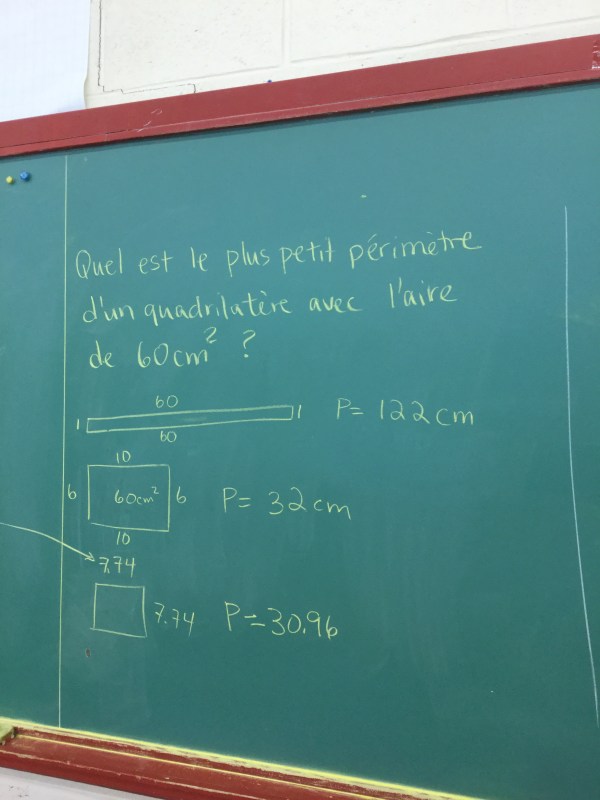
We need to have a good understanding of perimeter, area, and how making a quadrilateral more square, or more snake-like will affect the area/perimeter.
We learned that sometimes we will need to use the square root to find the square’s dimensions, if given the area.
Que remarquez-vous?
Où sont les maths?
Voici une groupe de danse française nommé Géométrie Variable.
