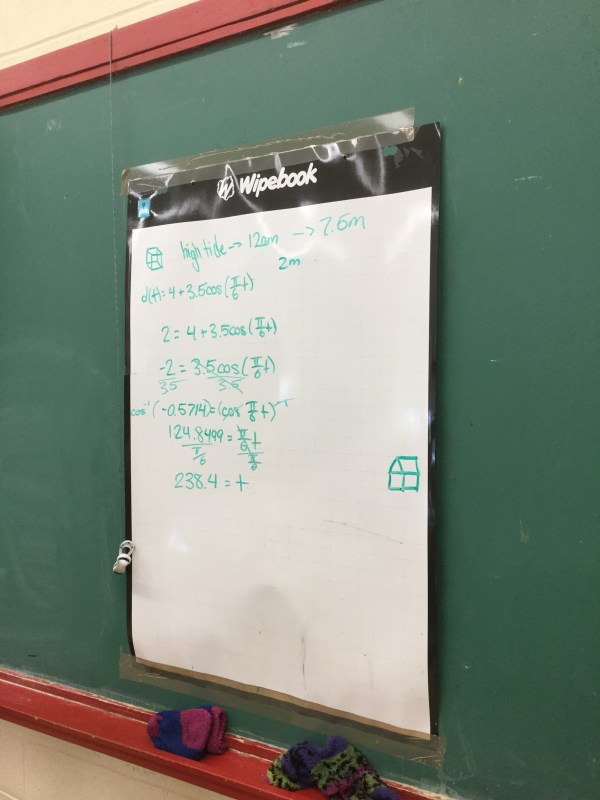
Solving linear and quadratic trigonometric equations
grade 12 are working hard to draw graphs and find intersection points using algebra, and then to interpret the intersections to make conclusions.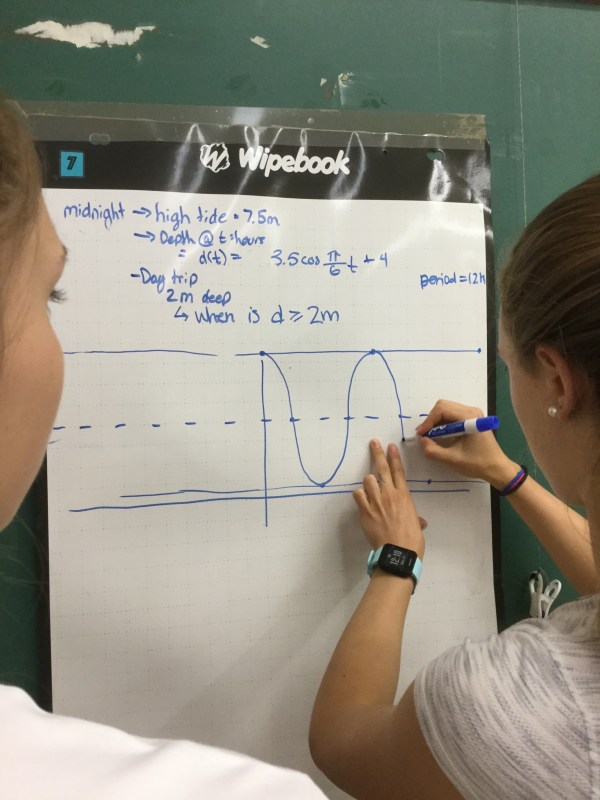

Lines and Angles
Grade 9s are working hard to review all their analytic geometry skills before their summative tomorrow.

We graphed lines from an equation (6x-2y=4) that we needed to rearrange first. We looked at calculating the x and y intercepts using various reasoning strategies using proportions, and also by substituting in zero for x or y and calculating the other.
We drew another line that was parallel (same slope) but different y intercept. We looked at how to calculate the x and y intercepts.
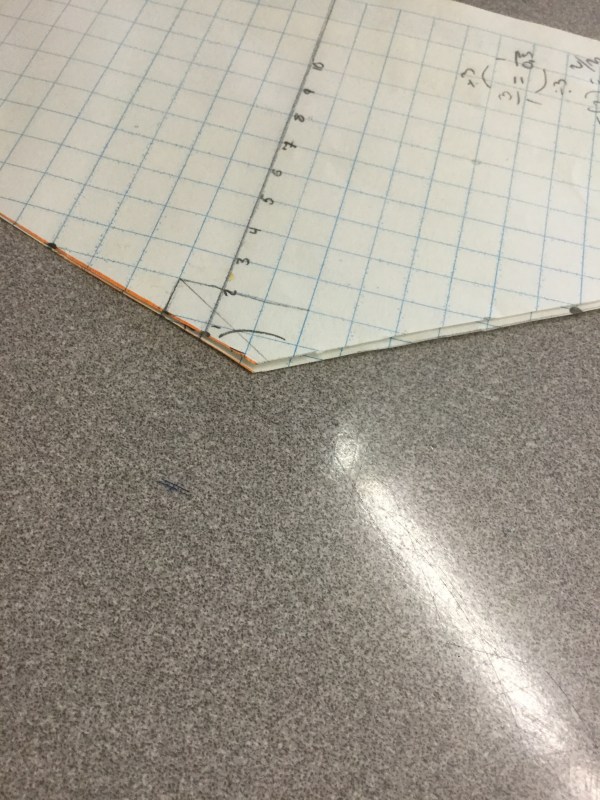
Next we drew a line through 2 given points (-5,8) and (3,-6). We calculated the slope, and the y intercept and then graphed the lines. Our last step was to label the angles and cut along the parallel lines and the transversal.

We noticed the acute angles we made are all congruent….so are the obtuse angles.
These angles are also supplementary (add to 180 degrees).
Look at the beans!

Graph Game
Grade 9s are working on Position Time graphs, and how the slopes of lines relate to the speed/direction of the object.
We’re looking at the graph game here
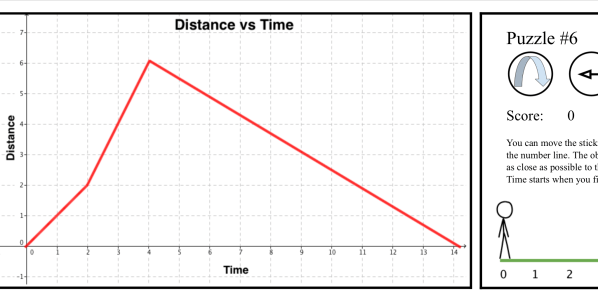
We need to slide the stick man in order to get the position time graph to match what is drawn. It’s a fun challenge.
Visual patterns
we’re practicing how to make equations from visual patterns in grade 10. We are using colours to show different terms. In this we have 2 n by n squares, and 3 groups of n in each figure. We see figure 1,2,3 shown.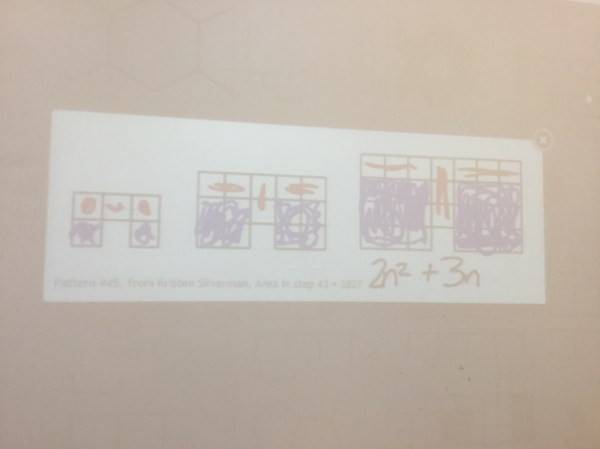 we can make tables of values and show that our pattern is growing quadratically, since the second differences are the same.
 sometimes there are a few ways to view a pattern, and we can make different equations (that would all simplify to the same thing in the end)
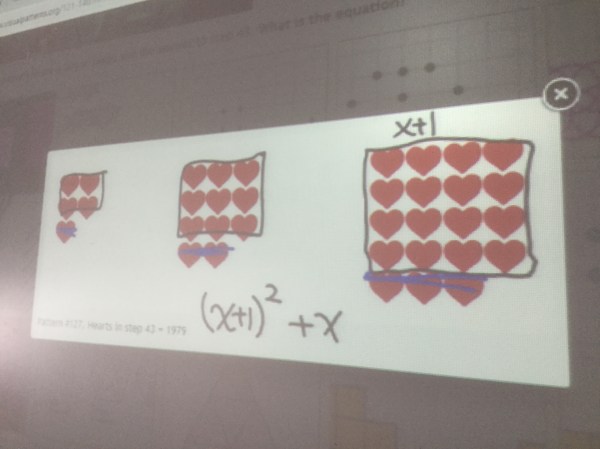 we looked at how to find the vertex of this equation. We decided to complete the square just to see if we could, even though the numbers are not so friendly. We use the same visual method, and use fractions or decimals.

We could also have used the quadratic formula to find the roots, then found the axis of symmetry and then the vertex. It’s great there are so many options!
Eqao practice stations
We are working hard to get ready for our linear relations test and also practice EQAO questions at the same time.

We are getting better at using our reasoning to work through multiple choice problems

And we are showing our thinking in many different ways.

Word problems
Grade 10s are working on quadratic word problems. We’re looking at maximum areas for fields, and maximum revenue for bushels of potatoes. In any situation we need to first identify variables, make an equation, or two, with the goal to make something quadratic. We are looking here for the maximum area or revenue, so we want to find the vertex (sommet) so we need to remember all the ways to do that, and hopefully choose a way that is quick. It’s often easy to find the zeros, the midpoint, and then the vertex. our revenue problem involved a farmer who started with 600 bushels of potatoes to be sold at 2$/ bushel. If she waits, she gets 100 more bushels a week, but the price drops by 10 cents a bushel. She needs to know when to harvest, to get the highest revenue.
We can make a table and solve, but there are sometimes situations where a table becomes a very long tedious method. From the table we notice it is quadratic data. We notice that revenue is equal to price times number of items sold, and we also can make expressions for price and number based on waiting x number of weeks. using the table we see the maximum revenue occurs at 7 weeks. We also see the y intercept is 1200$. If we expand to make the trinomial we see the constant is 1200. We also noticed something neat. The 2nd differences are always double the “a” value of our quadratic.
  We can use the trinomial form and the quadratic formula, or go back to the factored form and solve for the zeros, we could also complete the square..so many ways to get to the vertex! We find the ridiculous cases (the “stupid” case) where revenue is equal to zero. In this question if the farmer waits 20 weeks there will be lots of potatoes to sell but the price will have dropped to zero. If we sold 6 weeks ago the price would have been higher, but there would have been no potatoes to sell!
  we look to the graph. We can plot those ridiculous cases with 0 revenue, and then find the sweet spot in the middle where the revenue is maximized. We calculate the midpoint to be 7 and then can calculate the revenue when x is 7 by using our formula.
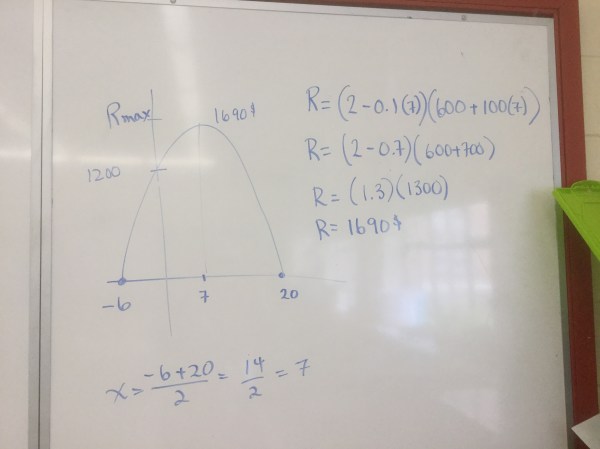
It’s a bit of a surprise for some of us to be seeing parabolas appear in problems that do not involve kicking a ball. We are seeing them in area problems, price problems, and patterning too. We follow the same steps as we’ve done before, but now need to keep a context in mind and make good choices of the path through the problem.
Speed dating
Grade 9s are working on graphing lines, and making equations for graphs.

We’re working across the table from eachother in “speed dating” style. Both partners solve the problem together, then one side stays as expert, the other side rotates and tries a new question. The first side helps their new partner to become an expert before they themselves shuffle to the next question.
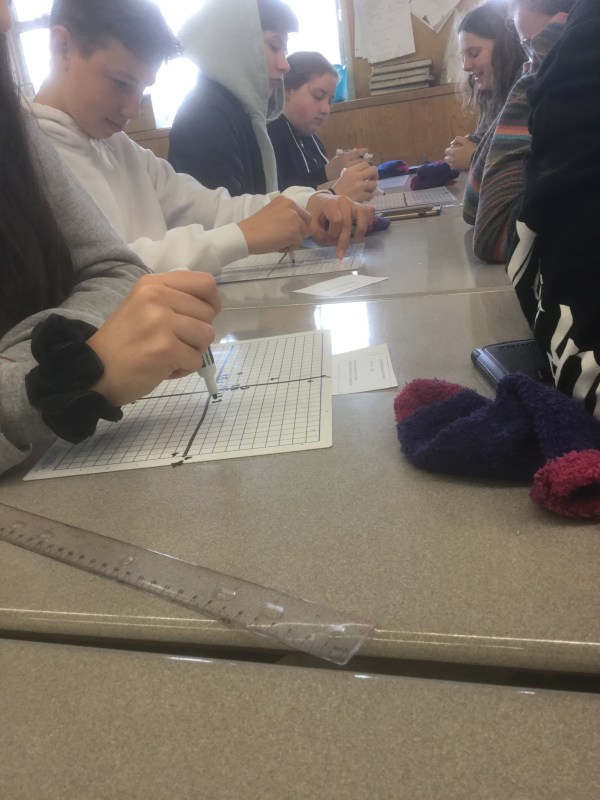
There’s a lot of reciprocal teaching happening, lots of clarifying questions being asked, and some big “aha” moments!

We looked all together at how to calculate the constant (initial value/y intercept) when we have a line that passes through 2 points.
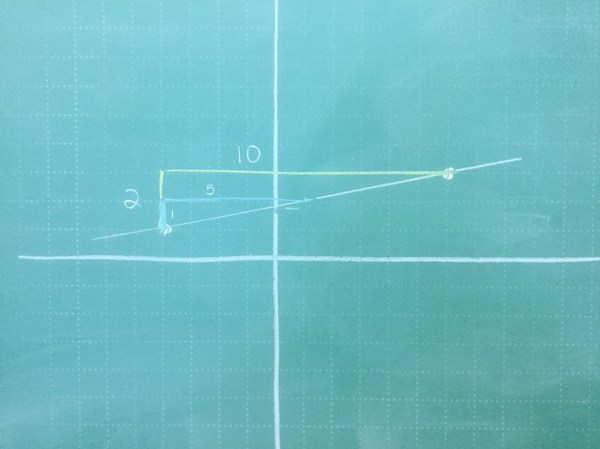 by graphing we could get close. We know the slope is 2/10 or 1/5 and we know that the y intercept is just less than 2.
We can do better than that! Some of us figured that for each 1 square we move forward, we should go up by 0.2 since that’s 1/5. Using that logic the y intercept is 1.8
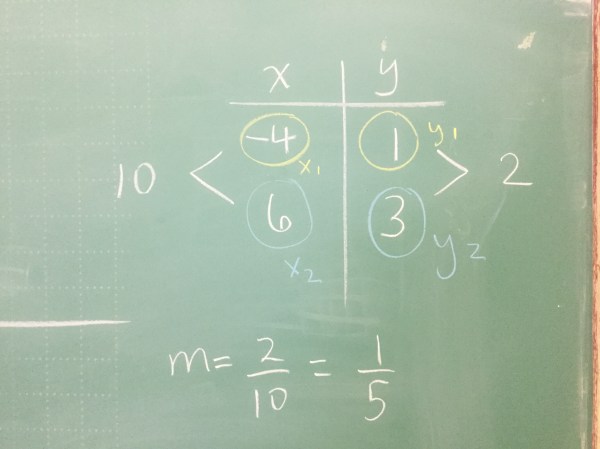
We looked at how a table can be helpful to find the slope as well. And how this connects to the equation for slope.

It’s all “rise over run” no matter how you look at it.

And the slope ends up being 1/5 again!

We can calculate the y intercept (b) by subbing in a point on the line for x and y. We then use algebra to get b.
 it doesnt matter what point we choose to use, b will be the same! 1.8 in this case.

If we are not keen on algebra, we looked at how desmos sliders can be helpful, and also how desmos can do regression for us! Here’s a different equation, of a line that goes through the points that are in the table above. Technology is pretty cool!
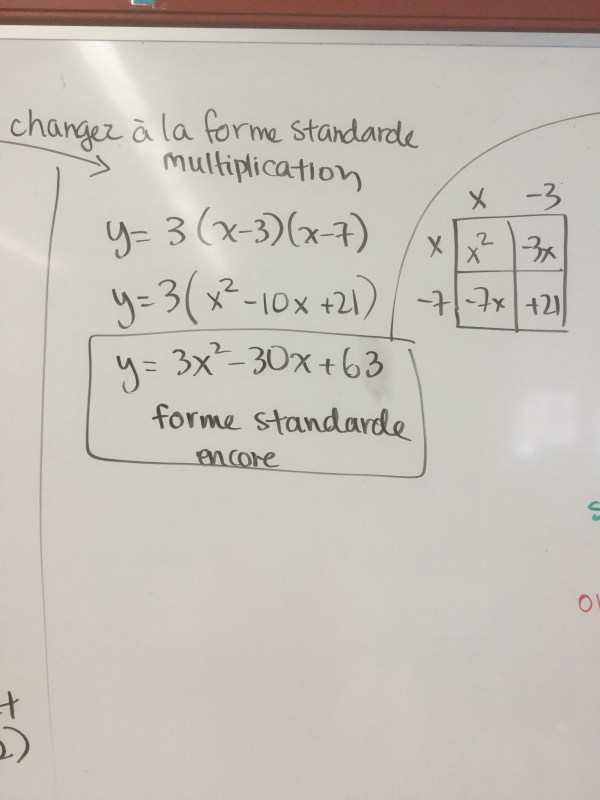
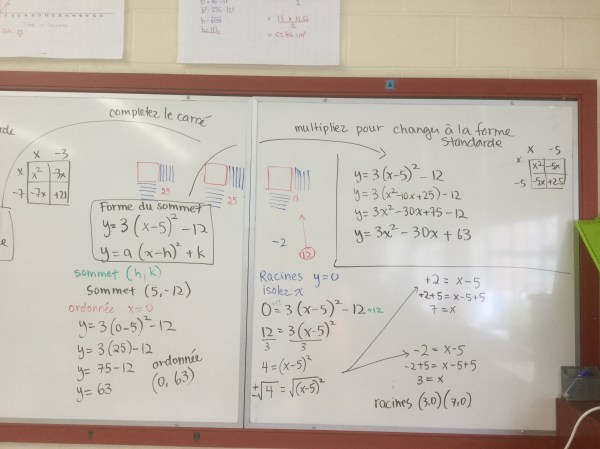
All the forms of quadratics
Some quadratics work nicely in all forms. Here’s an example of one that can be factored, and also one that we can complete the square of, with no decimals. This is not always the case. Some cannot be factored, some have no roots. Some have a vertex (sommet) that has decimals. We can always complete the square, but it can be a lot messier than in this case.

Beans!
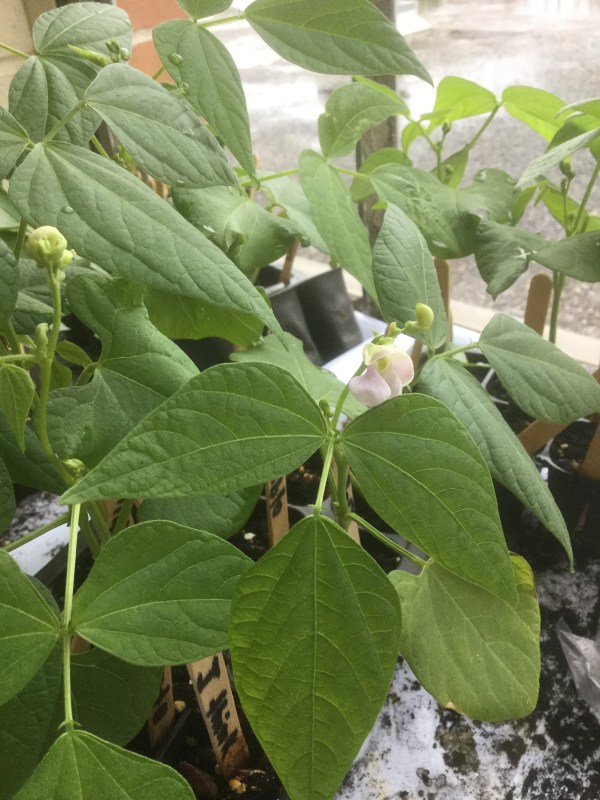
We have our first flower.
