Determining growth rate

Grade 9s looked at their bean graph to try to determine the growth rate for kidney beans and black eyed peas.
We noticed that the red beans grew earlier, and faster than the black eyed peas. This meant that their points made a steeper line of best fit, and their x intercept was lower than that of the black eyed peas.

We saw that sometimes for an individual bean the trend was not linear. More often than not the bean started at a higher rate, and then grew less and less each day after a certain point. This trend is non-linear. We did not have any magic beans that got increasingly tall each day by a bigger amount.
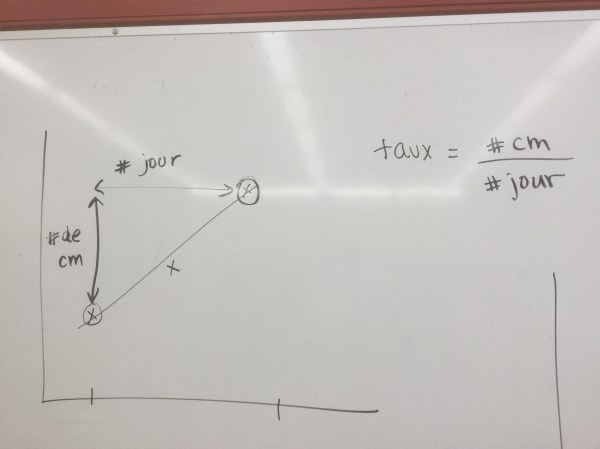
We looked at how to find the growth rate of a bean between 2 days. We calculate the number of cm grown and divide that by the number of days elapsed between measurements.
For the group of beans we can do this for our line of best fit.

Some groups found many averages

We looked at how to do a regression on desmos. We can make desmos do the figuring for us, and come up with the line of best fit. We can use the line created by desmos to do interpolation and extrapolation. We can also notice the intersection point. At that time the two plants were the same height (on average).
Technology can save us a lot of time!
