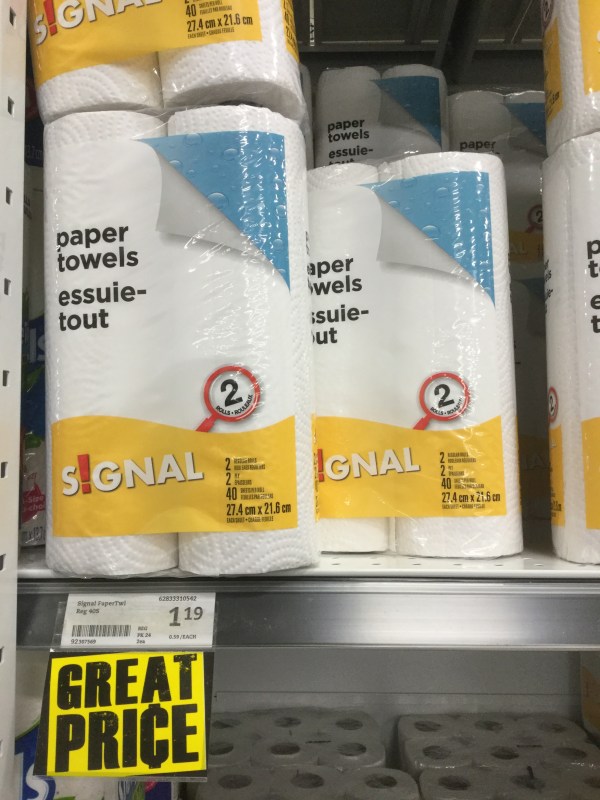
Quel est le prix?
Regardez cette présentation
Il y a un jeu de “devinez le prix”.
How tall is that house?
We’re limited today by not being able to cross the road to measure to the base of the building.
We used a home made clinometer today to figure out how tall he house is across the street. We made our clinometer by taping a string to the middle of a protractor and tied a washer to the end of the string. When the clinometer is horizontal, the string falls vertically and hits the 90 degree mark. When we tip the clinometer up toward the peak of the roof, we measure the angle by looking at where the string falls, and comparing that number with 90.

We walked backward (measuring that distance) and then took another angle measurement to the roof.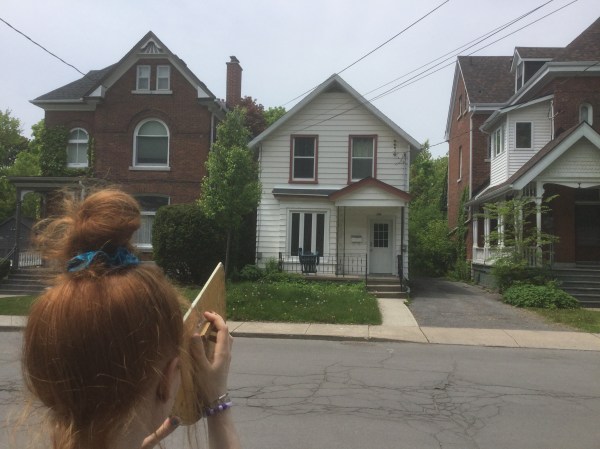
We need to know the height up to the measurer’s eyes too.
And then we can calculate the height of the building
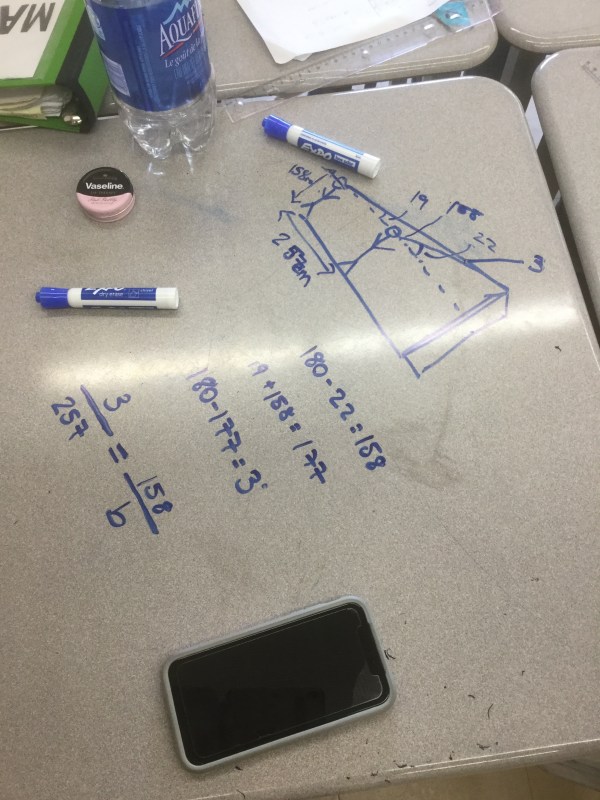
We use our understanding of supplementary angles and sine law and the sine function to do it.

Cutting a cake
We are having cake today and looking at angles.
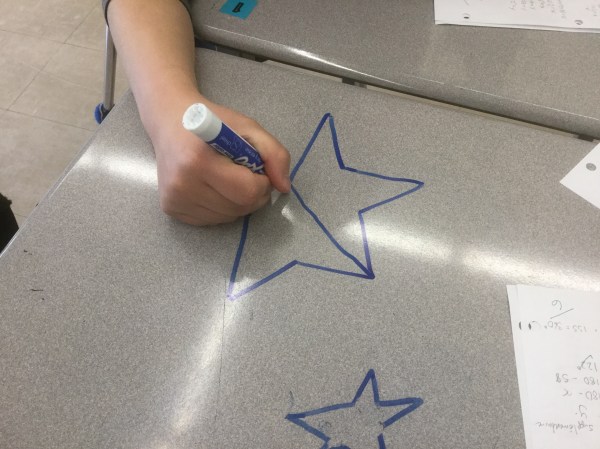
The cake is in a star shaped pan, and we want to cut it into 20 equal pieces.


There were lots of creative ways
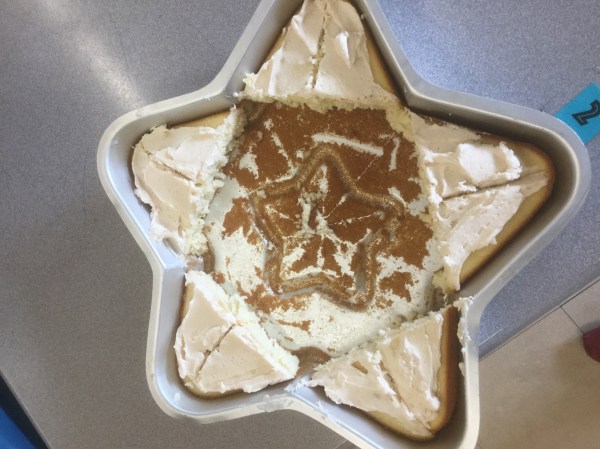
We cut each point in half, along a line of symmetry. We then cut each of the 5 rhombus in half perpendicular to the other diagonal.
We noticed a pentagon in the middle!
How tall is the school?
Grade 10s used mirrors to explore similar triangles. They needed to apply their knowledge of the law of reflection with a plane mirror which was learned in science class.

We made a triangle with us (height to eyes) and the distance between the mirror and our feet. We had to be sure we could see the edge of the school roof in the mirror without leaning over.

Next we measured the distance between the mirror and the school.
 sometimes there were obstacles!

We then calculated the height of the school using similar triangles.

We were hoping to use shadows too, but sadly there hasn’t been sun during math class for the last week!
Math Dilemma… which one is the best price?


Commuter challenge
Interested in tracking some data? We’re looking at our carbon footprint as part of the commuter challenge. Sign up here.

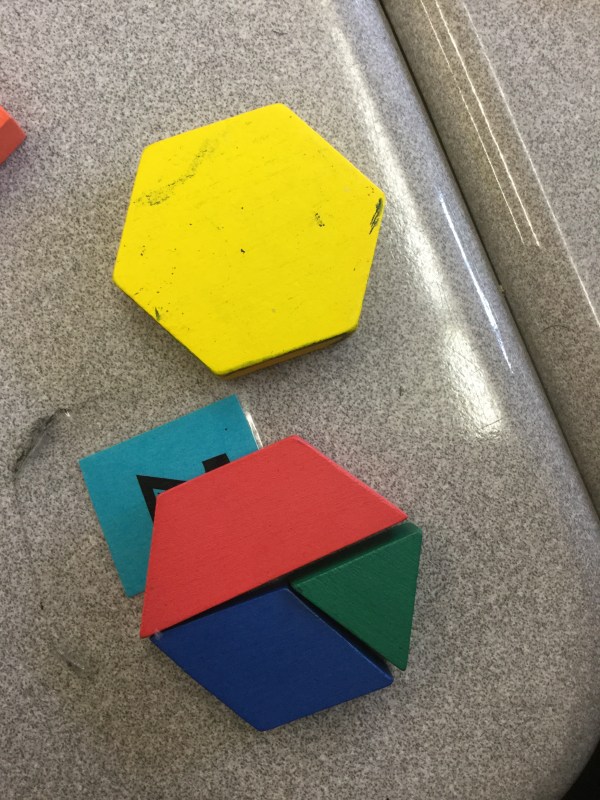
All about angles
We used polygon tiles to build shapes and discuss angles. this first demonstration was more about fractions, but one blue rhombus is 1/3 of a hexagon, a trapezoid is 1/2 and a green triangle is 1/6 so we know that 1/3+1/6=1/2. We noted that the angles in the trapezoid and the rhombus were the same as the hexagon (120 degrees, since it’s regular) and the triangle had each angle as 60 degrees.
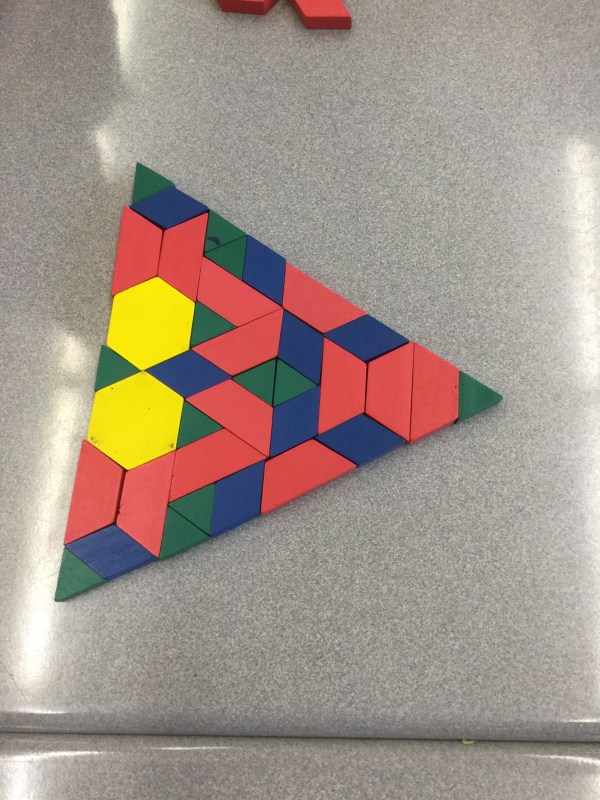
we made shapes that showed symmetry, and we also found lots of supplementary angles, and opposite angles to point out. We know that the angles around any point will add up to 360 as well.
This shape has rotational symmetry, and we were able to use the sum around a point being 360 degrees to figure out that the white rhombus has an acute angle of 30 degrees. We also noted that a lot of the sides are the same length, so that the shapes fit together nicely.
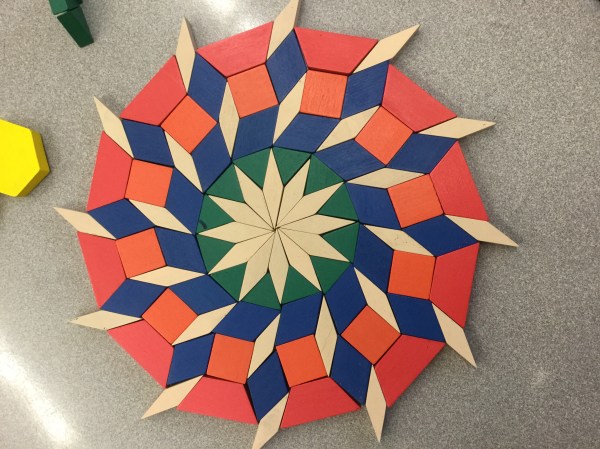
We also showed what we knew about opposite, supplementary, corresponding and alternate internal angles and transversals.
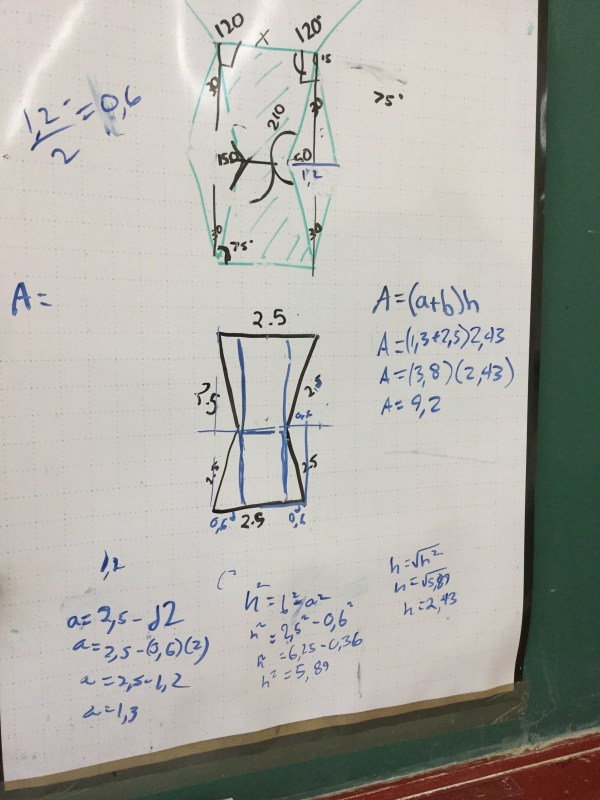
Finally we looked at an artistic bird image:
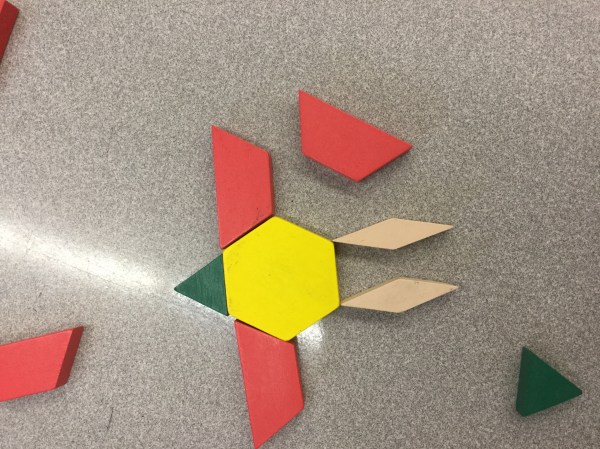
The task was to determine the dimensions of the shape we’d need to fill the negative space between the white rhombuses, and to calculate the area. A few measurements later, and we had it figured out! We’re always up for a neat challenge.

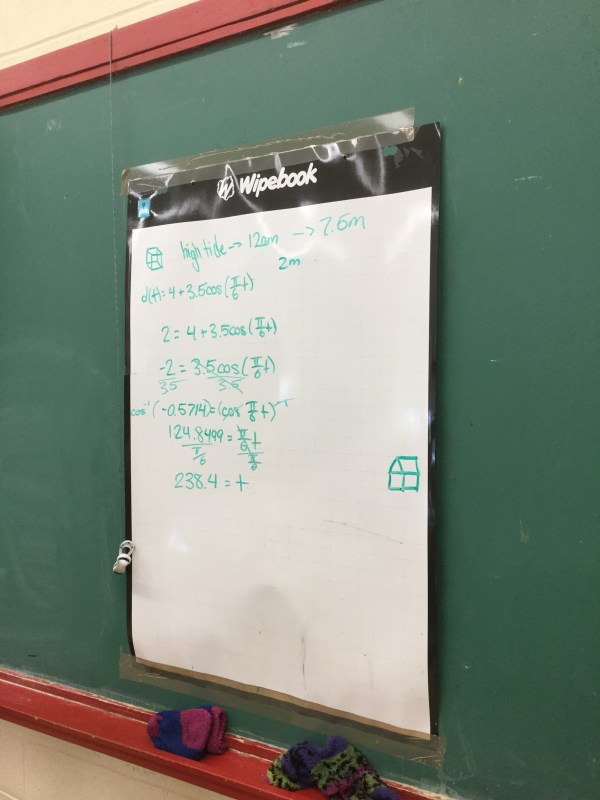
Solving linear and quadratic trigonometric equations
grade 12 are working hard to draw graphs and find intersection points using algebra, and then to interpret the intersections to make conclusions.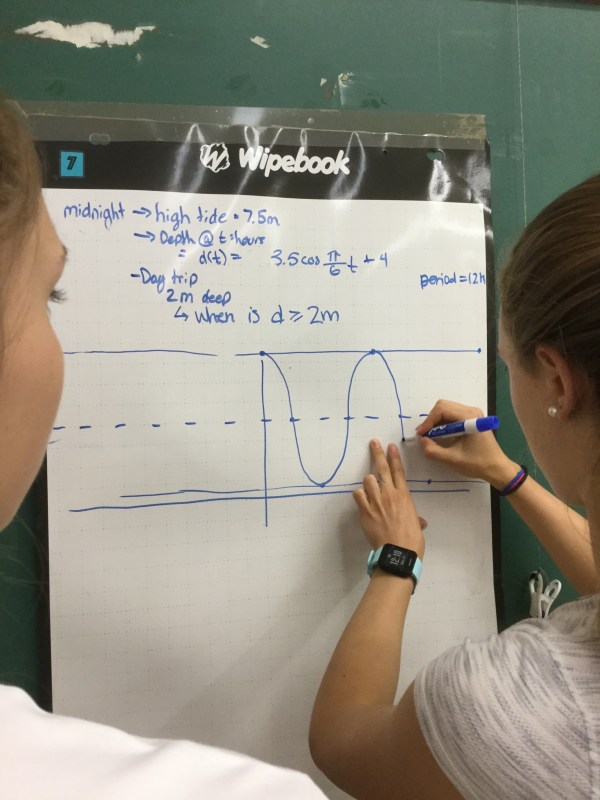

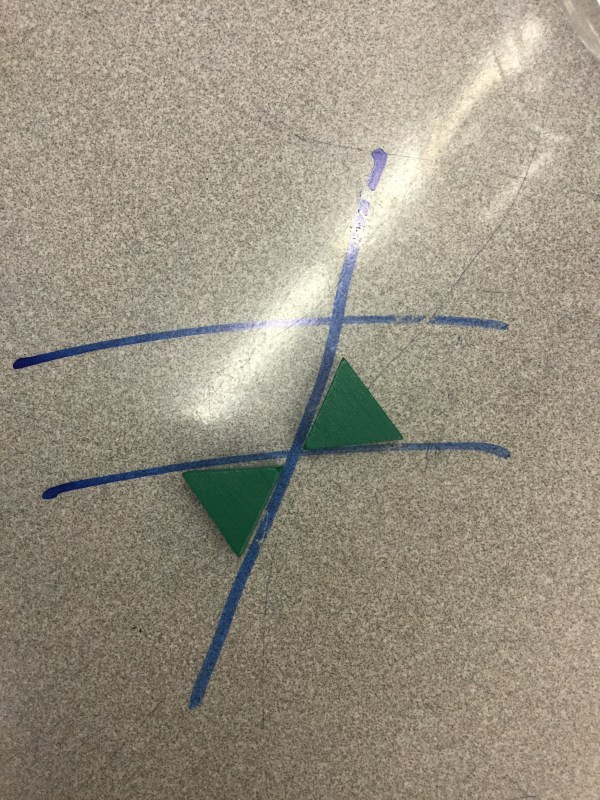
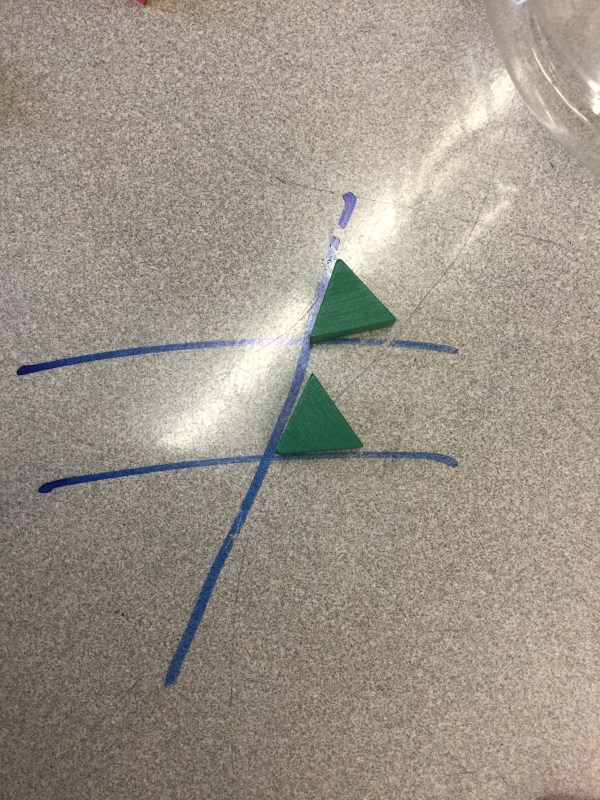
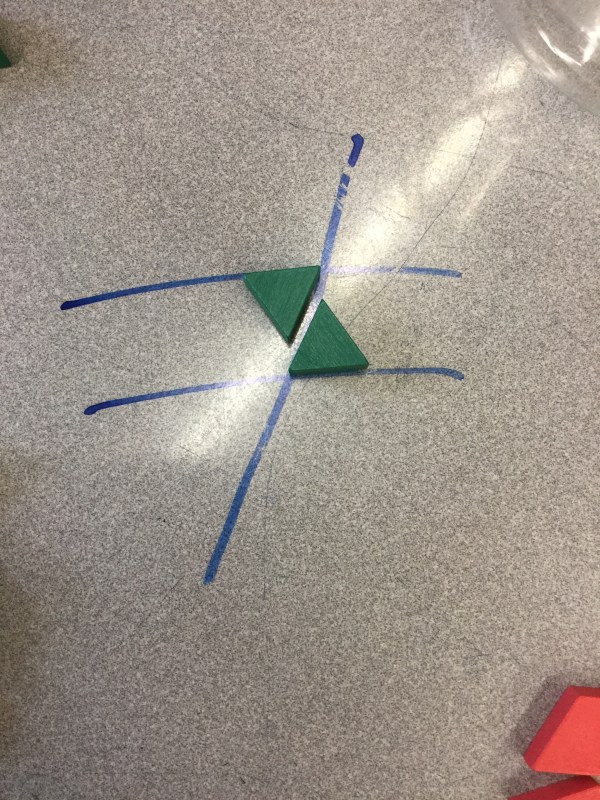
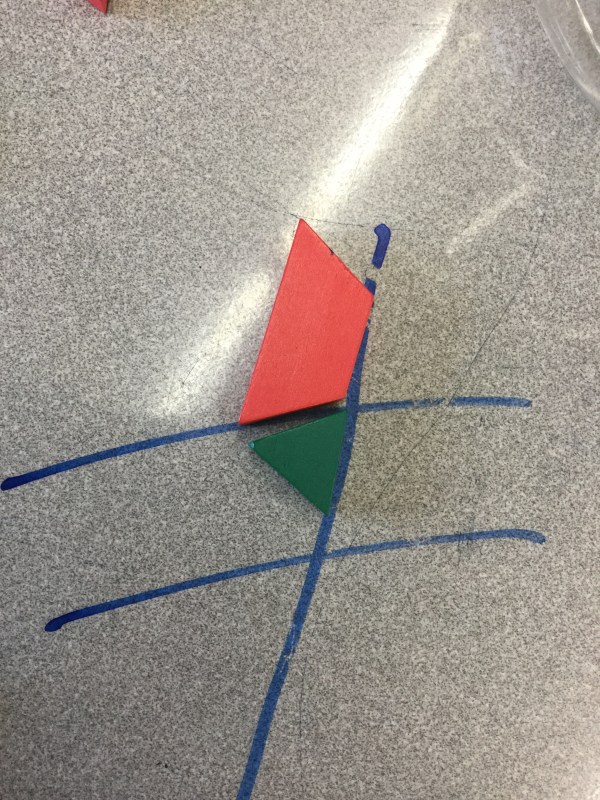
Lines and Angles
Grade 9s are working hard to review all their analytic geometry skills before their summative tomorrow.

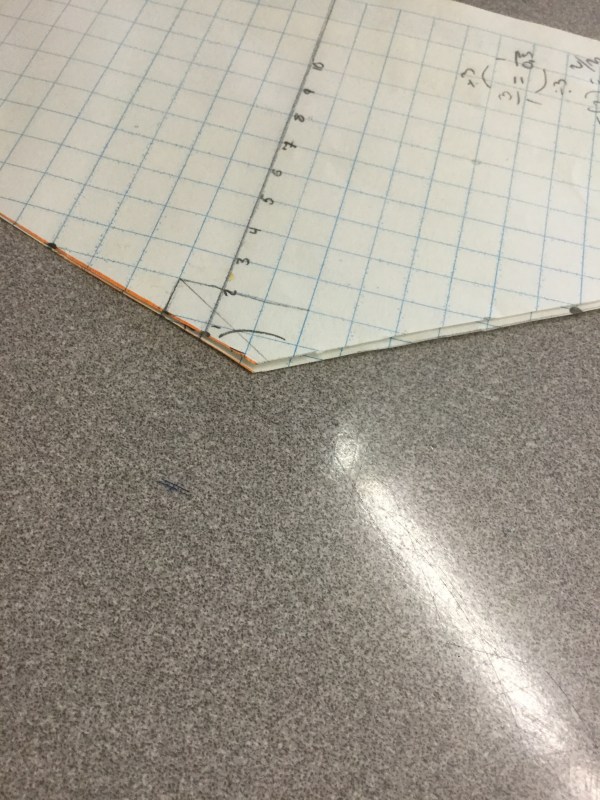
We graphed lines from an equation (6x-2y=4) that we needed to rearrange first. We looked at calculating the x and y intercepts using various reasoning strategies using proportions, and also by substituting in zero for x or y and calculating the other.
We drew another line that was parallel (same slope) but different y intercept. We looked at how to calculate the x and y intercepts.
Next we drew a line through 2 given points (-5,8) and (3,-6). We calculated the slope, and the y intercept and then graphed the lines. Our last step was to label the angles and cut along the parallel lines and the transversal.

We noticed the acute angles we made are all congruent….so are the obtuse angles.
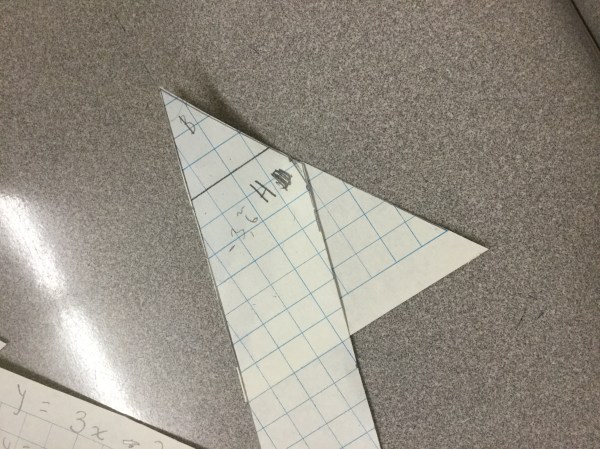
These angles are also supplementary (add to 180 degrees).
Look at the beans!

