Learning Our Thinking Routines
My grade 9 class learned several thinking routines today. We did a 3 act task, where we started up at the boards in random groups. We did a “notice and wonder” chart as we watched act 1.
We watched it a few times until each group had at least one notice and one wonder.
We debriefed the list of notices and wonders and then set off to determine how many post-its it’d take to finish the picture. Students felt they could do it with the limited information they had, so gave it a good try. I was impressed at their ideas and estimating skills. They weren’t sure of the answers they got, and eventually asked for some more clarifying information.
I wait until students ask for more information to give them the “act 2” material. Here are the dimensions of the post-it and the board.
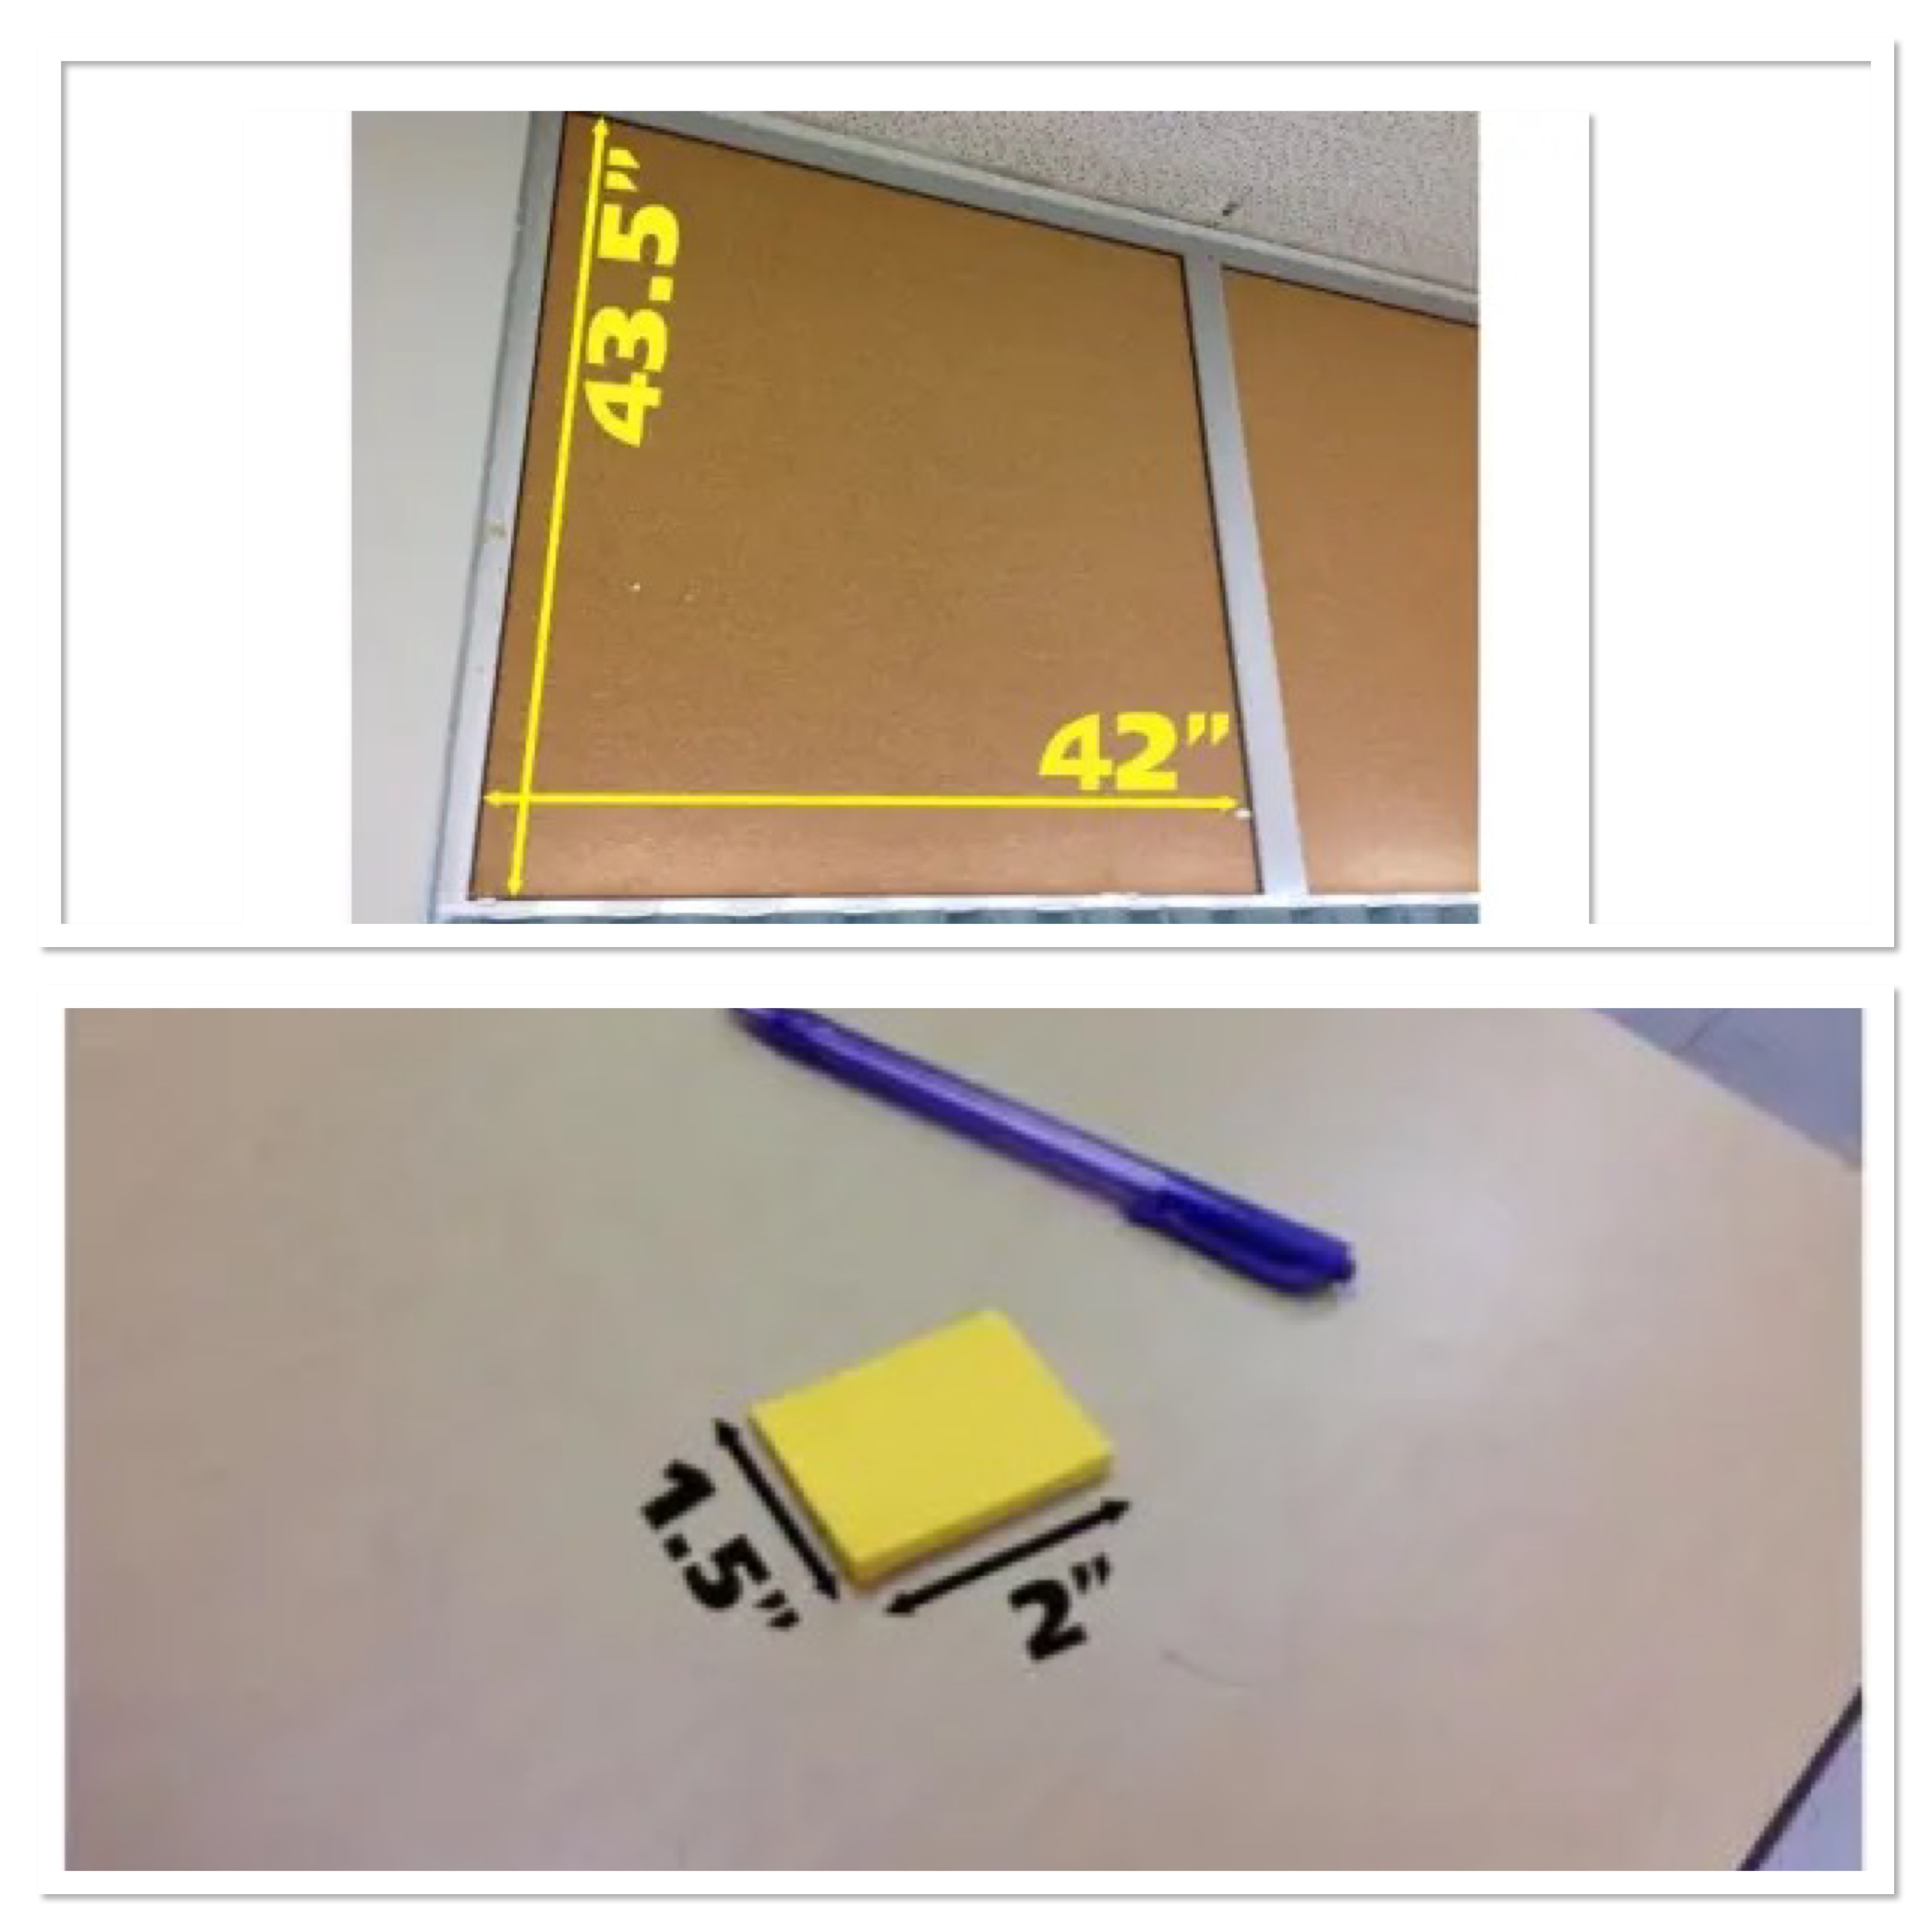
They got back to work again, figuring out how this information helped. I was purposefully not helpful, hanging back to watch how they tackled the problem, and only coming around to get people to stay on task and stay thinking. There’s a lot of good energy, so I didn’t do much but watch the action unfold.
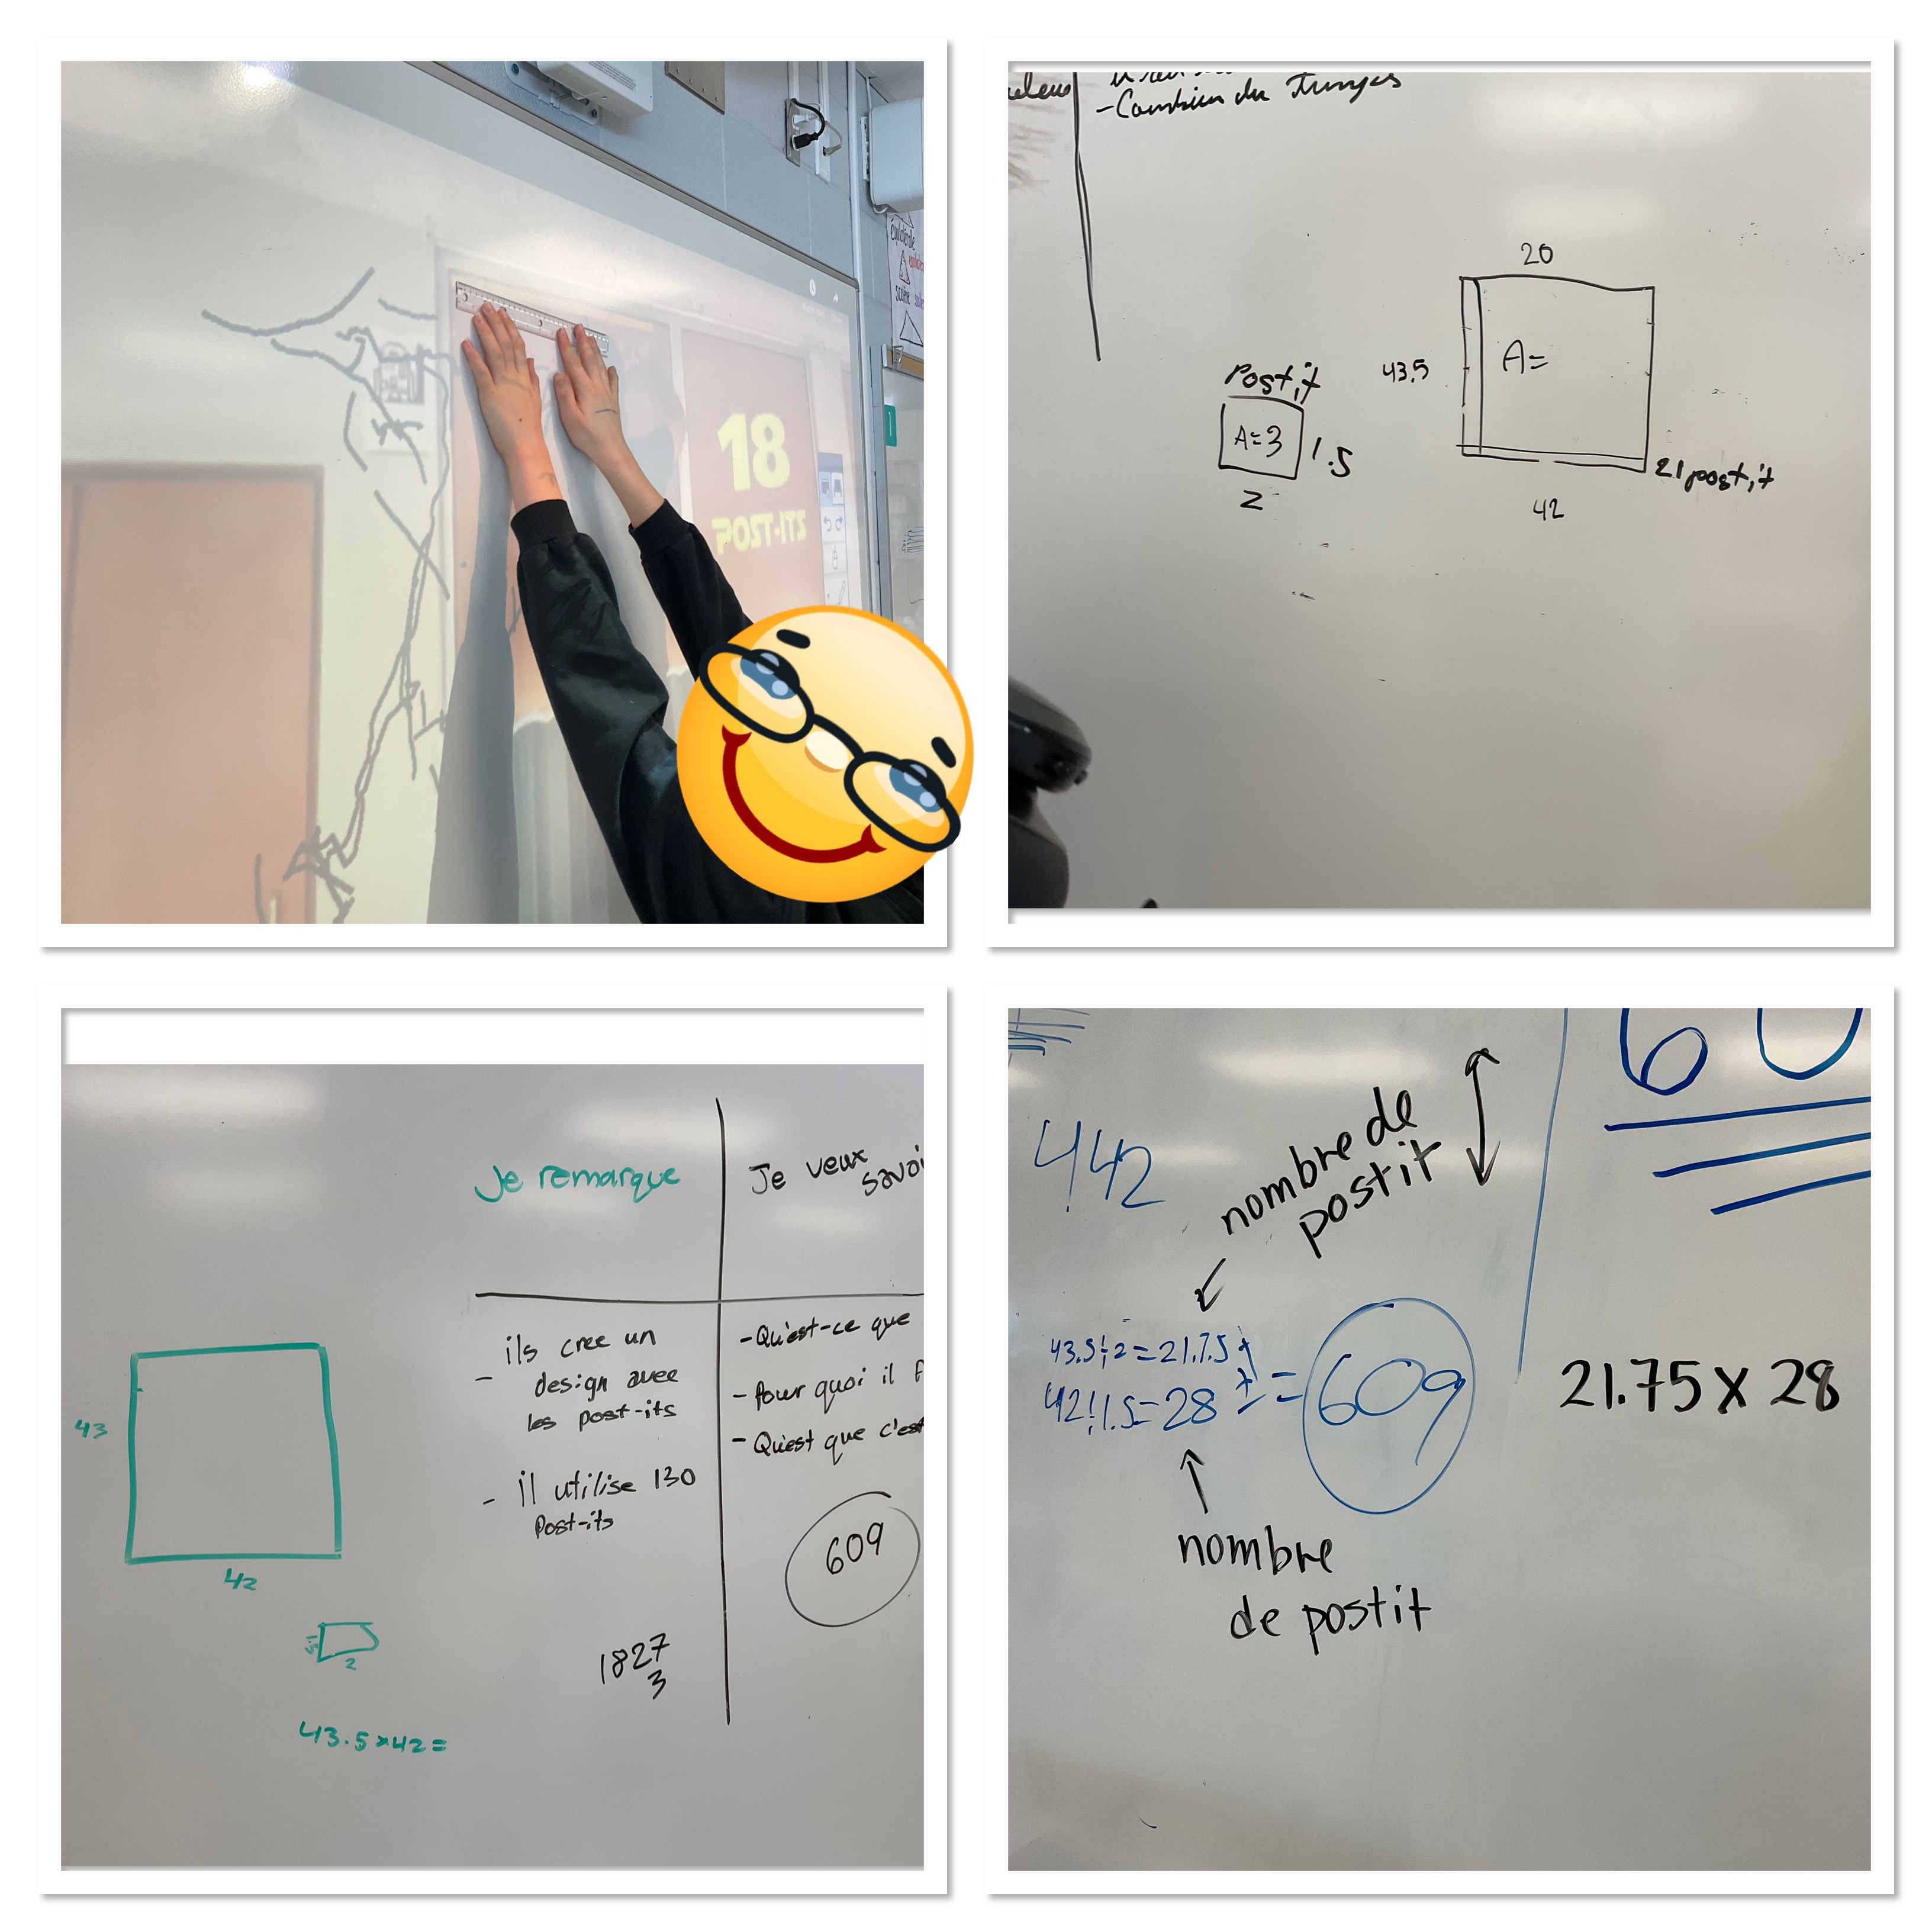
We gathered to the centre of the room, and I consolidated from the edges, we noticed that most groups drew a diagram and labelled it well. Some groups showed their mathematical thinking, and others only wrote some numbers down before arriving at a conclusion. I added some titles or formatted their numbers to be in equations to show how we can improve our communication, and I also pointed out how some groups solved it by doing area calculations and then dividing, while other groups divided dimensions of the board by dimensions of the post-it and then multiplied those values to find the answer. There were 2 solid approaches, and both were shown.
We sat down and then watched the final act
We had succeeded in our first 3 act task. We will be doing more of these over the term, and the process of getting into groups, up at the boards, noticing and wondering, asking for information, calculating and communicating, and consolidating will get better each time we practice.
We next looked at the thinking routines used for number talks. We did several dot talks today (images from here)
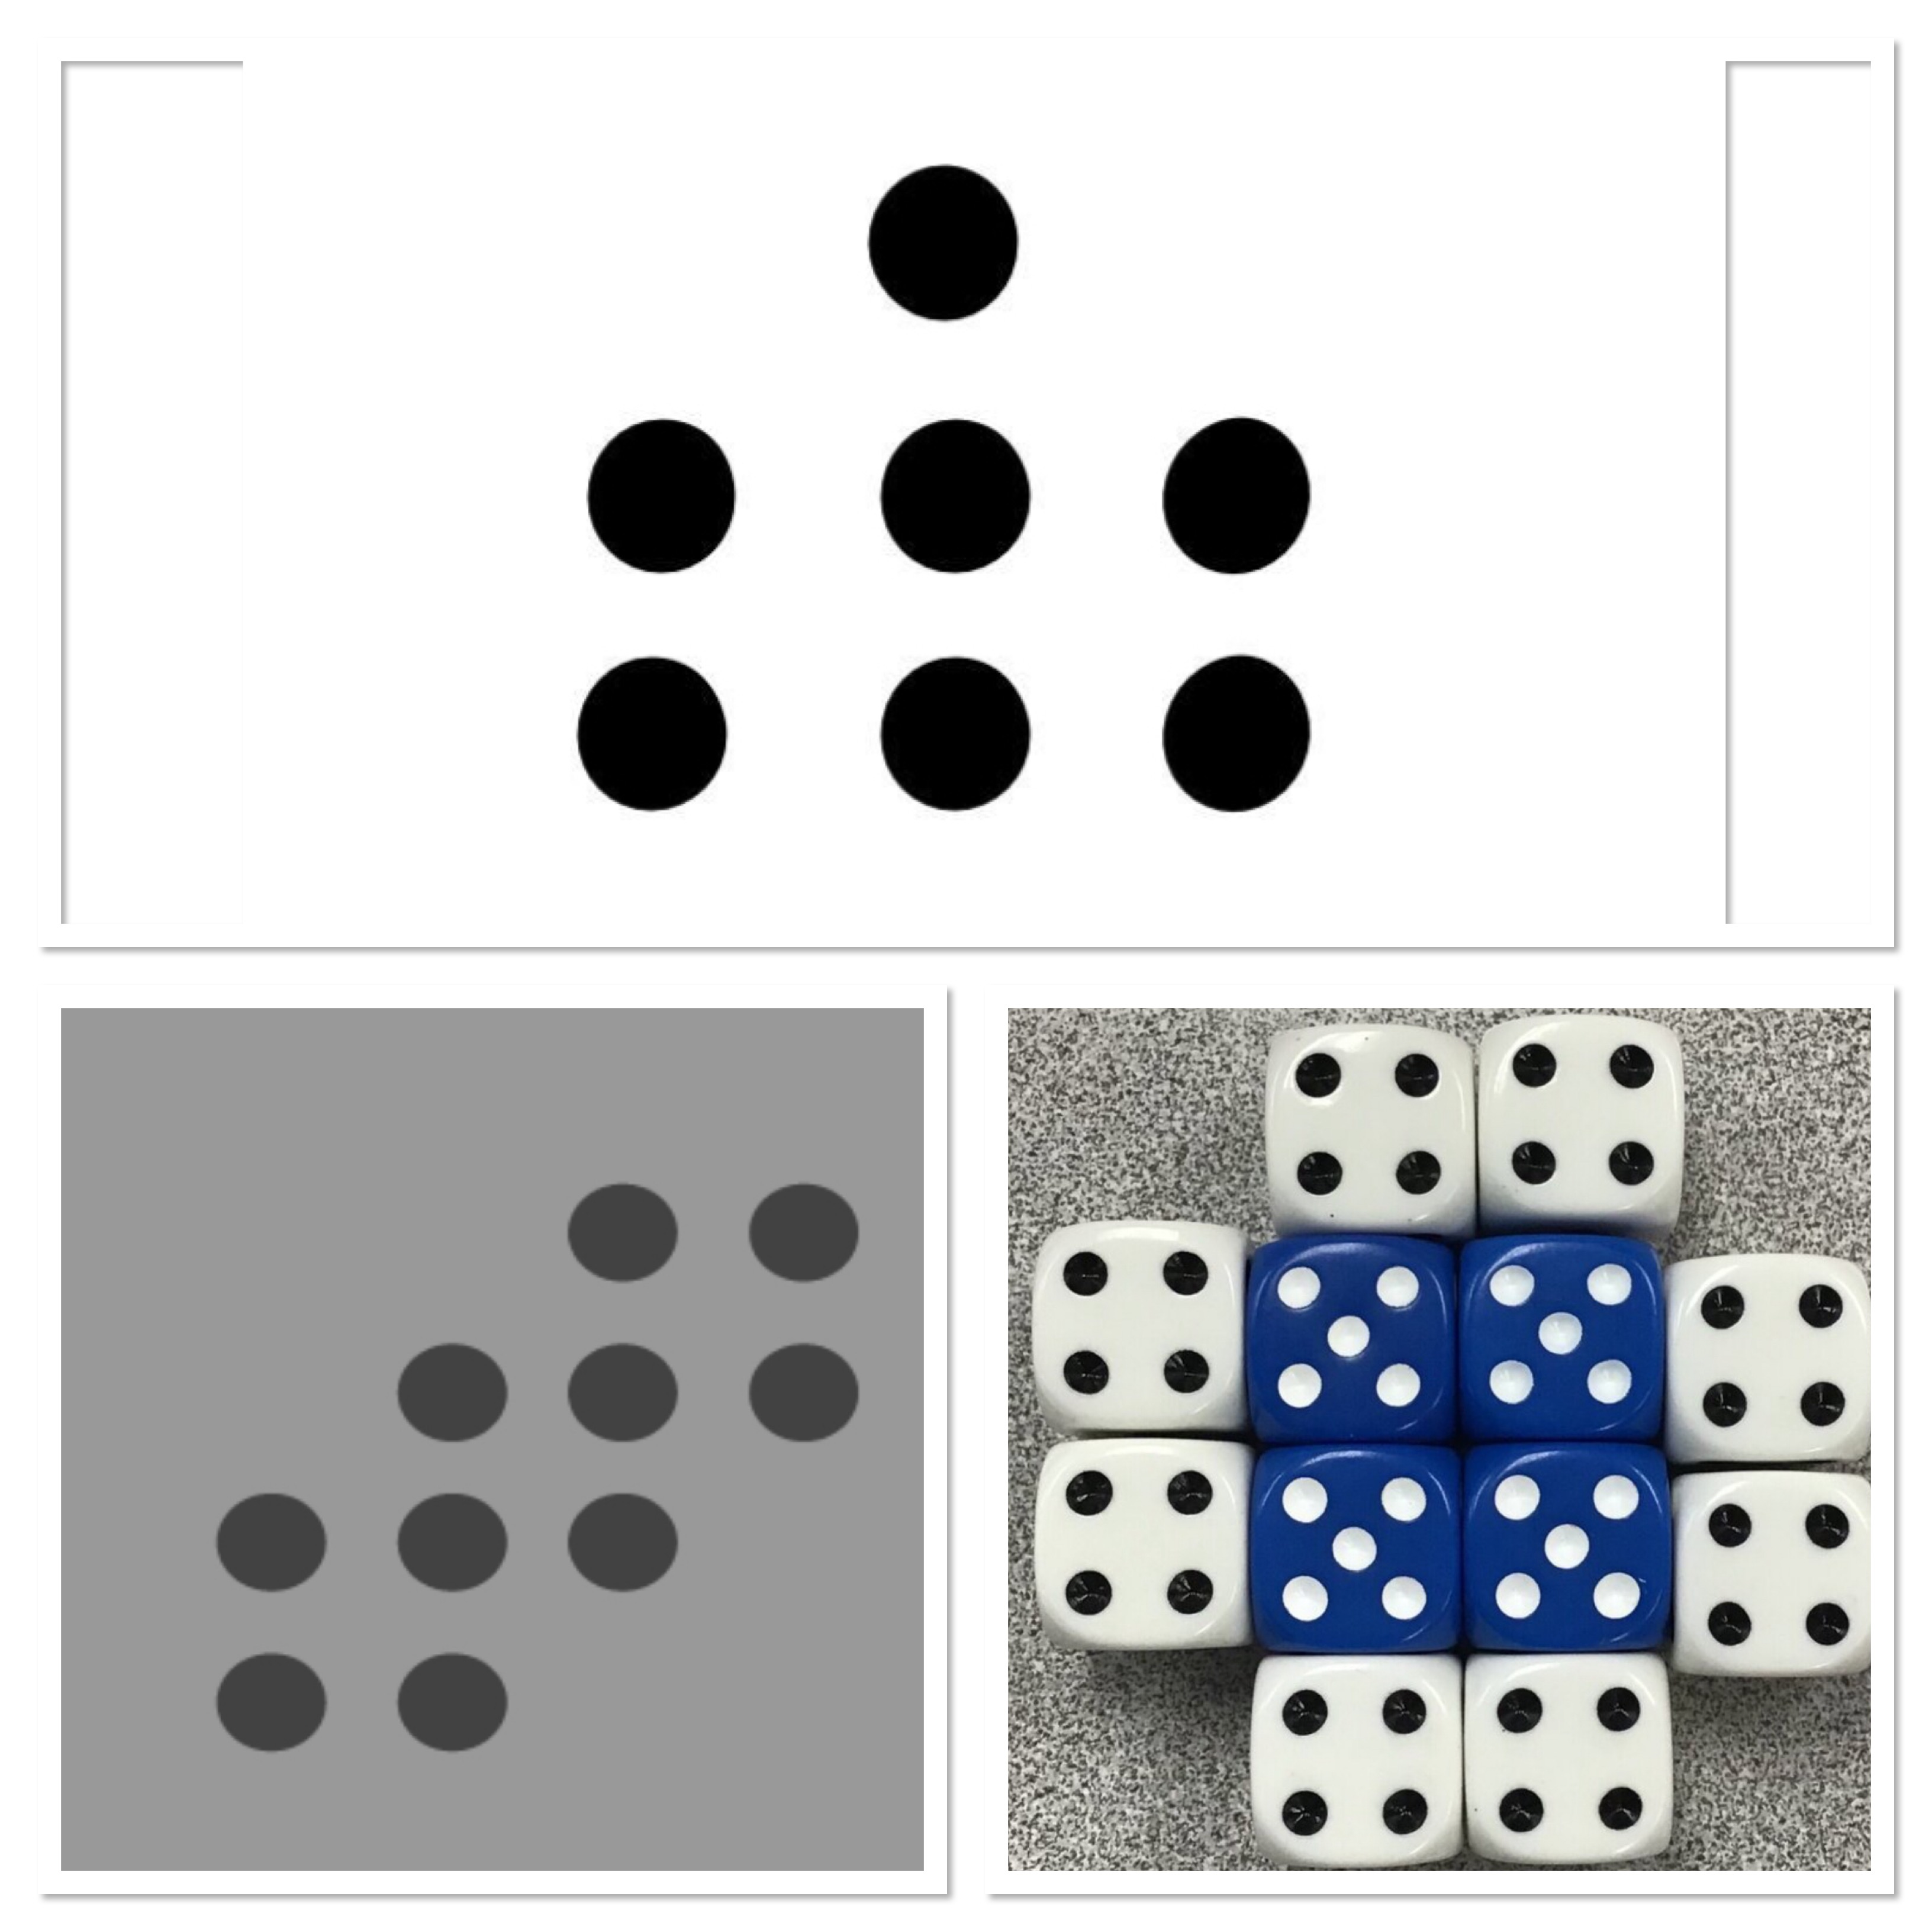
Each of these images were shown for about 3 seconds with the prompt: how many dots are there, and how do you know?
We mostly got the right answer, but that’s not the point. Looking at how we got the answer allowed us to see that different brains process the visual information in different ways. Using the projector markers we outlined how different people viewed the information in different colours, and in the end we saw that we can see things in different ways and that’s cool. Our different approaches can help others see the situation differently as well, so it’s important to share our ideas and viewpoints. We talked about subitizing and also being able to take a visual snapshot and keep it in your head to process when the image is gone, and how those skills can be worked on too.
The final image with the dice led to some conversations about multiplication and how we could represent the process we used to get the answer with algebra. Many did 4×5+4×8, but others did 4×5+4(2×4), and others did 4×8+2×10. Some even saw each dice as a 5 to start since counting by 5 is easy so they did 12(5)-8. Again, it was neat to see different approaches, and also to see how the enthusiasm to share their approach was building in the class.
We looked at the “which one doesn’t belong” routine as well, to spark conversation and get everyone keen to participate.
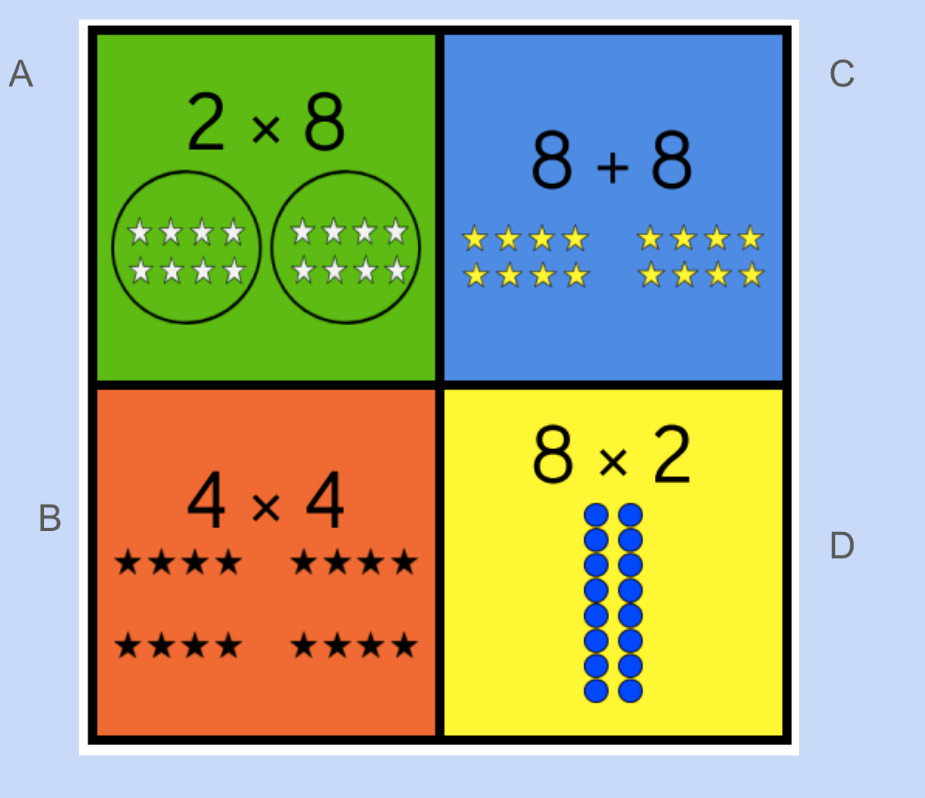
We noticed that there was multiplication and one addition, so maybe corner C didn’t belong. We noticed that each corner had an 8 except corner B, so maybe it didn’t belong. We saw that corner A identified 2 distinct groups, in circles, so maybe A didn’t belong, and that corner D has an array, and also we’re counting circles not stars, so maybe D doesn’t belong. There are reasons for each corner to not belong, and we can debrief ideas like “groups of” and repeated addition and multiplication and arrays. We had a lot of participation in the thinking and sharing of ideas, which led to lots of participation in our next number talk: “how many eggs”?
These talks are not so much about the answer, but about how we get there, and appreciating and sharing our thinking. Some immediately saw an array 4×9, but others said they counted groups of 8 (4×2 seen vertically) and there are 4.5 groups of them. I took the opportunity to show the skill of “doubling and halving” and how we could double the 4.5 and halve the 8 and arrive at the 4×9 multiplication as well. Others were keen to show how they counted by 2s, or counted by 4s, or how they subdivided it into 3 dozens. (2×6), (2×6) and (3×4) which again was lovely as a way to see how arrays of 12 can have different dimensions. As we debriefed, I was trying to touch on some multiplication fluency, as we will be embedding fluency as we proceed most days when we can.
Finally, since there was some time left, we got back to the boards and did the 4 4s challenge. Using only 4 copies of a number 4, and all the mathematical operations, and any exponents, and brackets, we were trying to create expressions that have a value of 1,2,3,4,5,6.7,8,9,10. I started them off with 4+4-4-4 as my example of how to get 0.
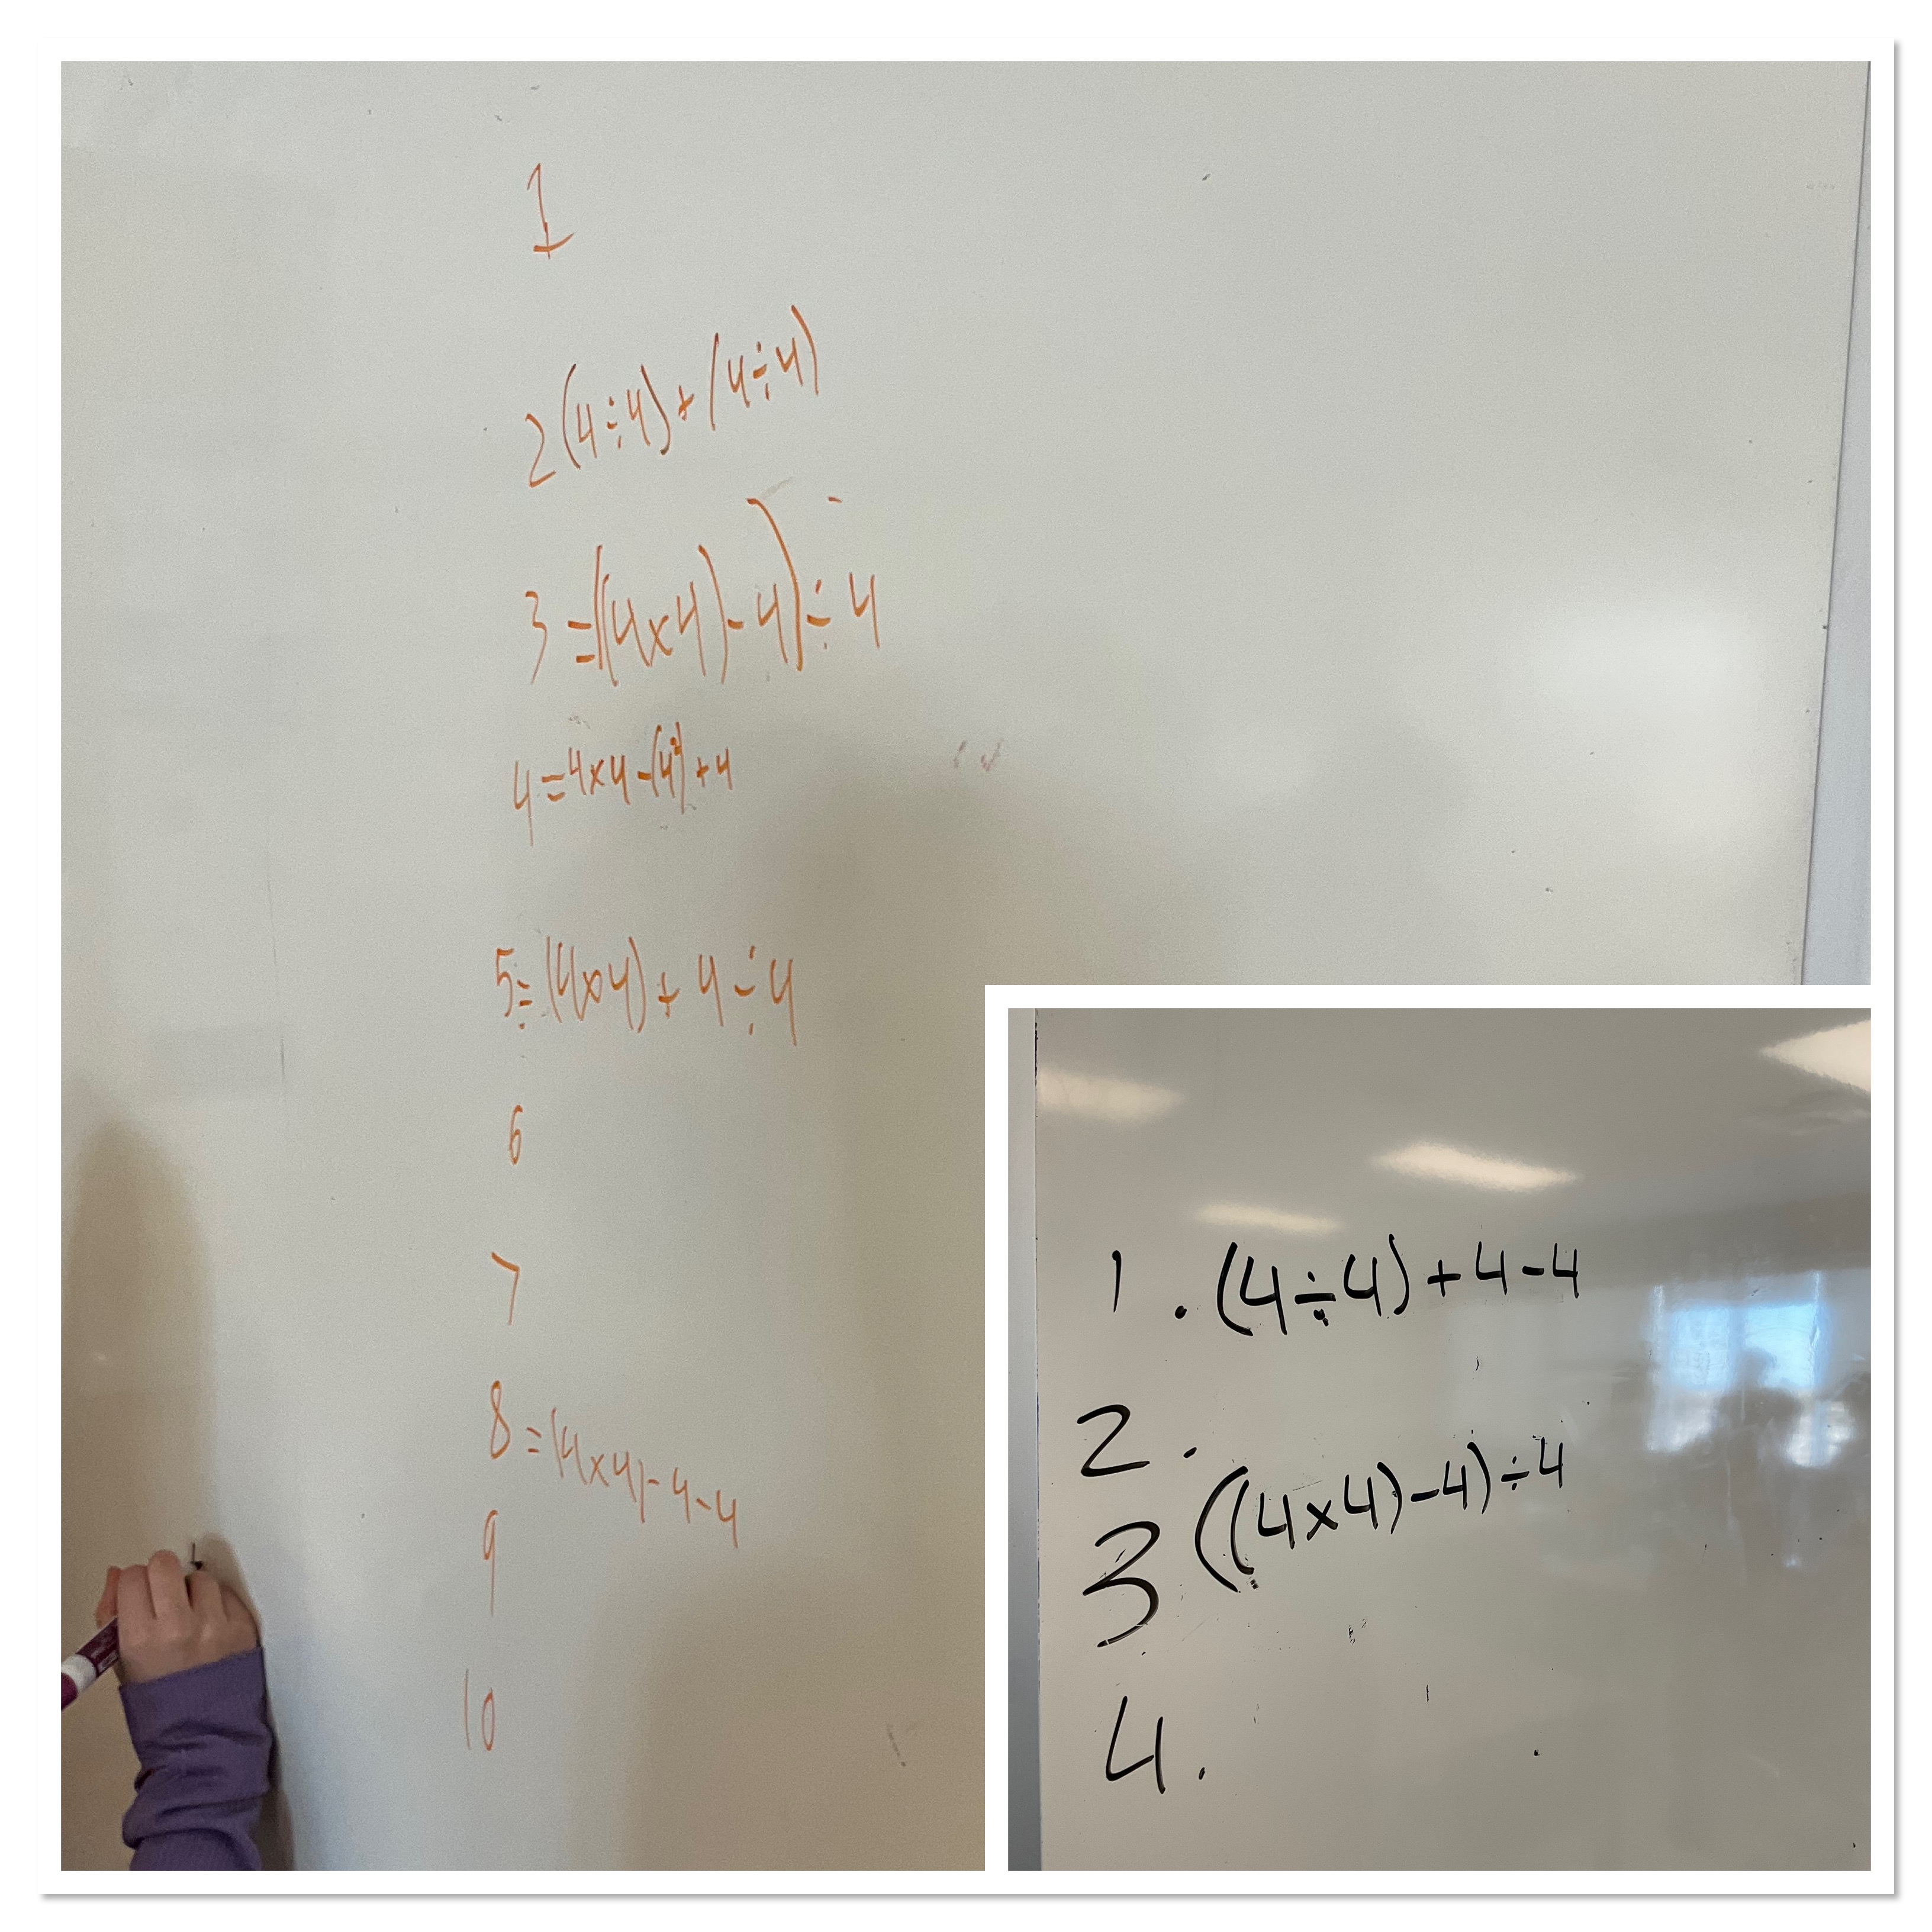
We had so many great conversations about if brackets are needed, and where to put them. Students were talking about BEDMAS before I got the chance! I love it when that happens. I just need to echo their “bedmas” realizations out loud to the class when I hear it as they work at the walls, and then so many memories are jogged, and they are all discussing what order to write things, or where to place brackets.
In the final moments of class (I am amazed at how much we covered) there was time for one of my favourite songs.
What an earworm!
Looking forward to more fun tomorrow. We’re building the routines we will use all term. So far it’s going great!
Unusual Baker
Today I was in a grade 9 math class while they worked through the unusual baker task from building thinking classrooms. There’s a baker who cuts cakes in unusual ways. If each cake has a total price of $10, what is the price of each piece.
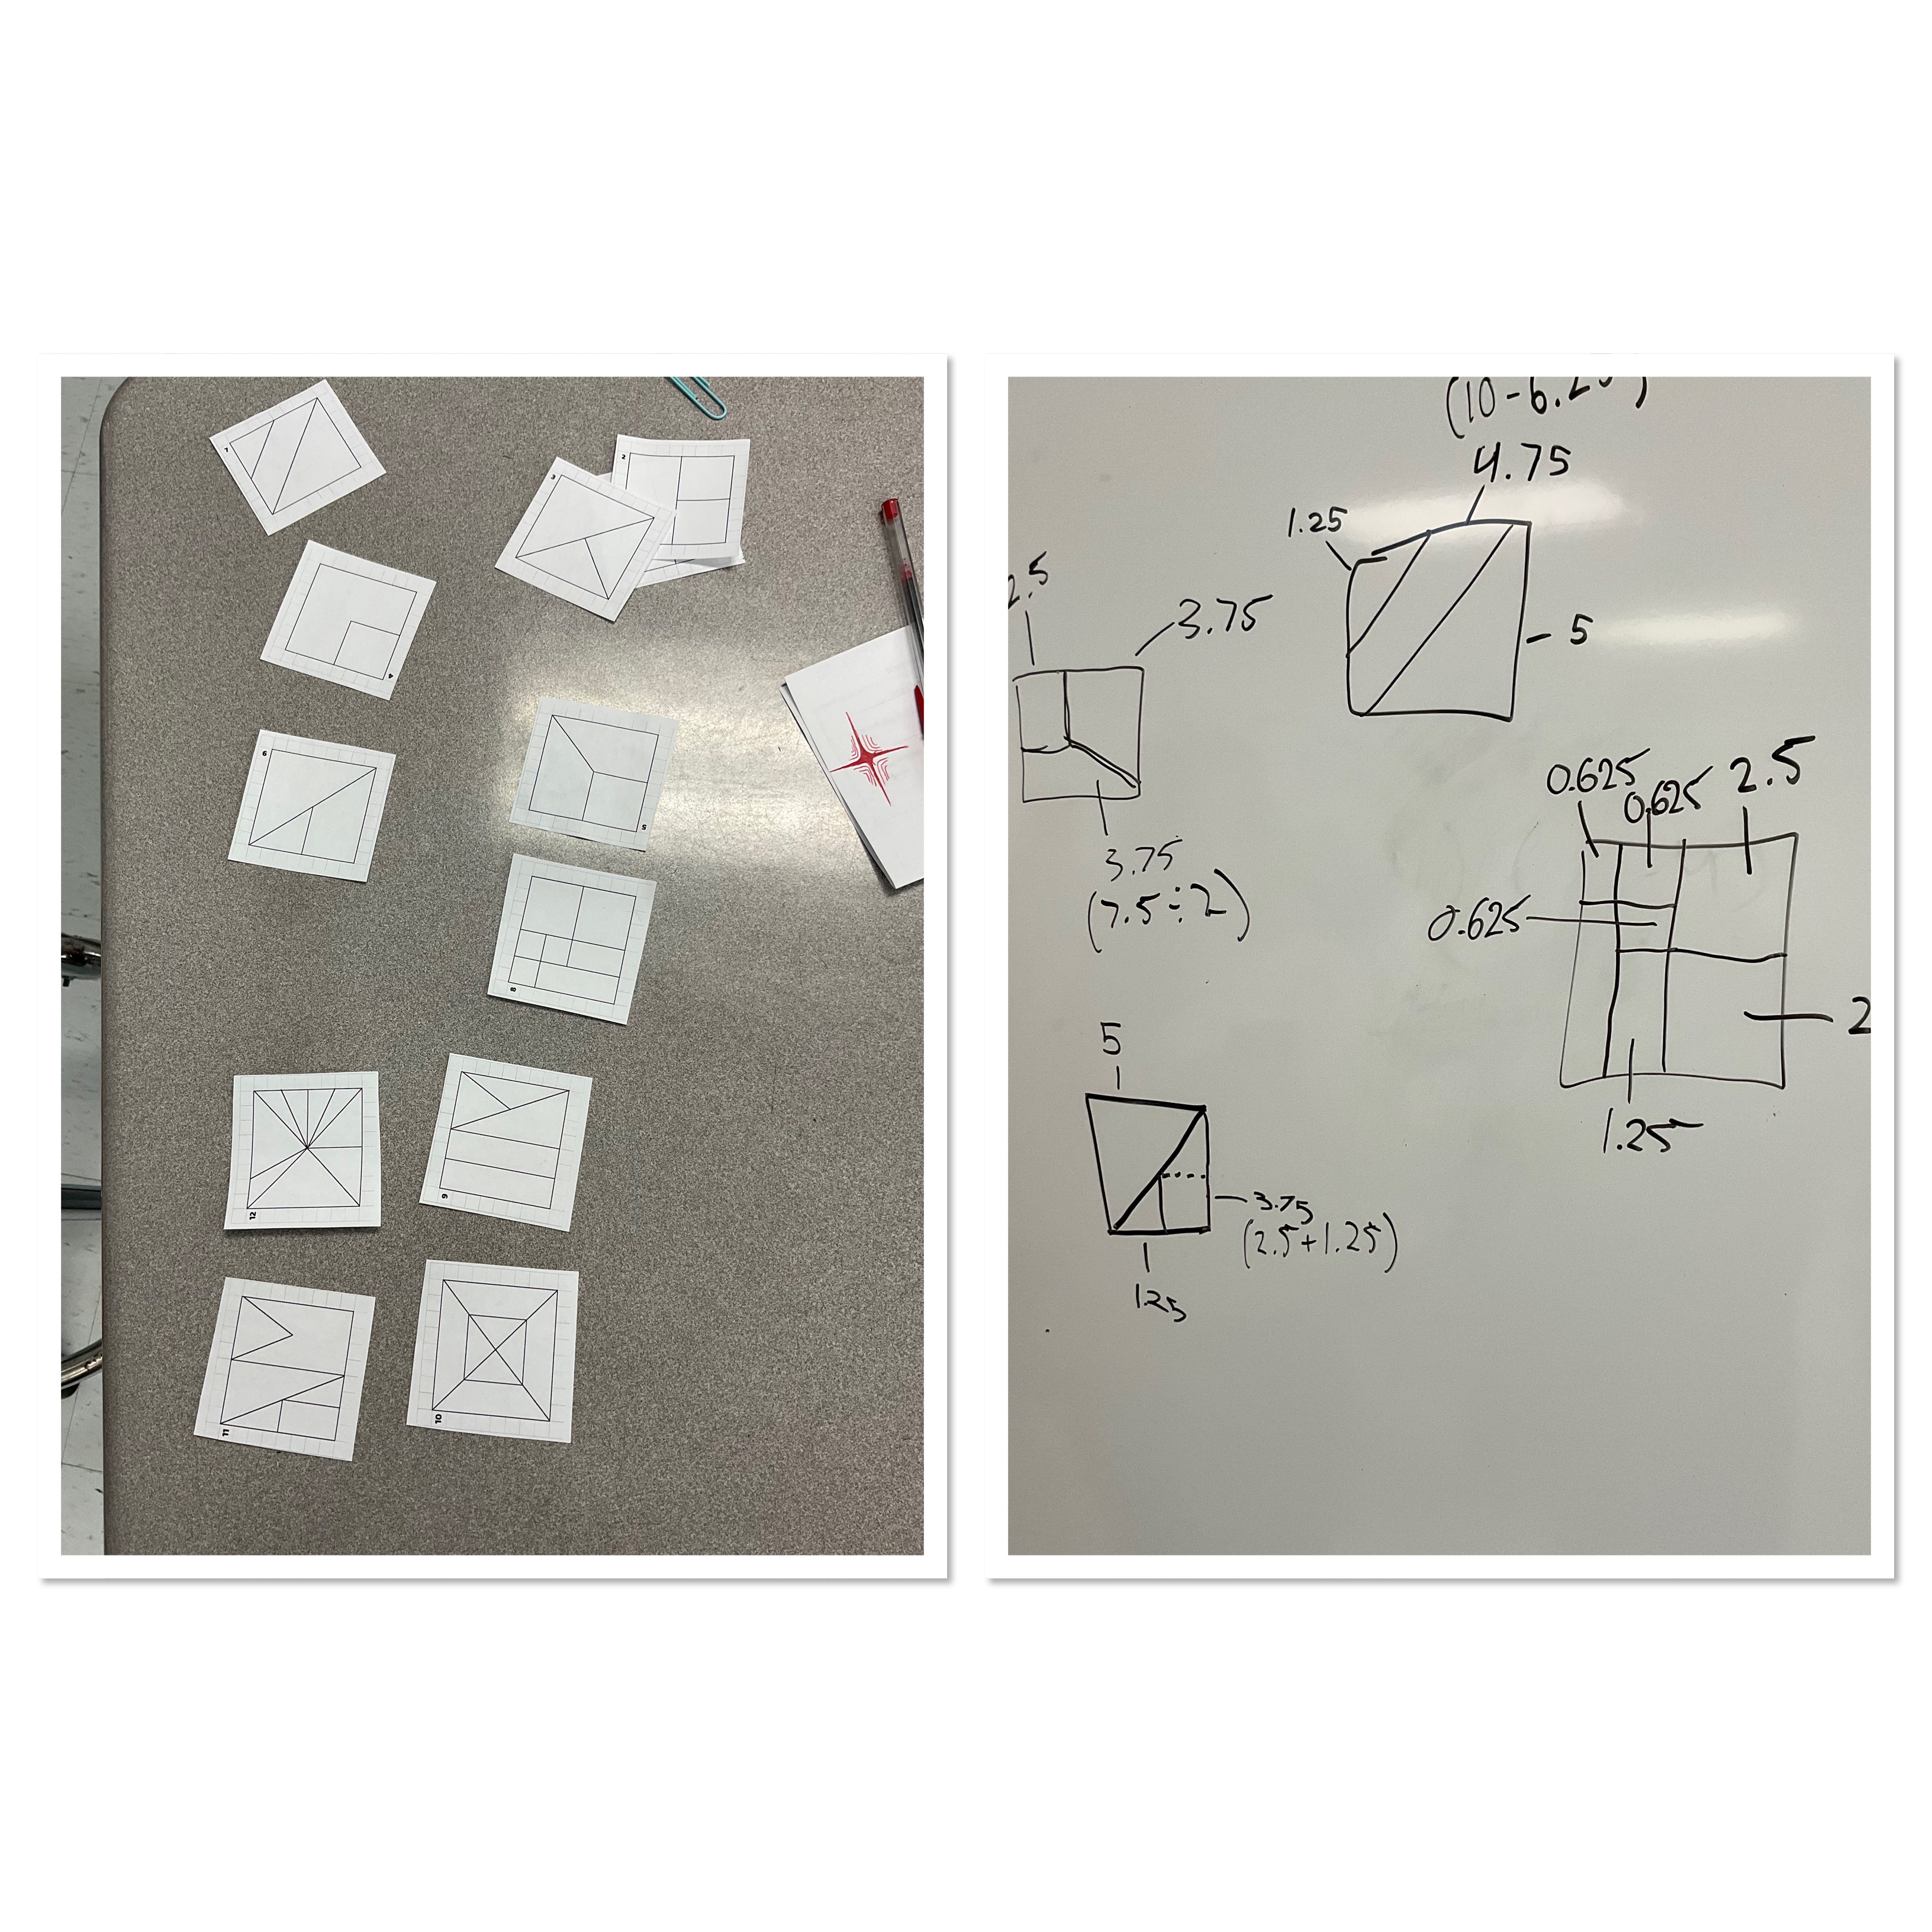
The class was using their reasoning skills and their fraction sense to split up the cake and split up the price. Once groups were done with one cake, they got the next more challenging cake to try.
I was working with a group that were unsure of how to approach the question. The visual representation was too abstract, so I brought it back to the concrete. Sometimes that will help.
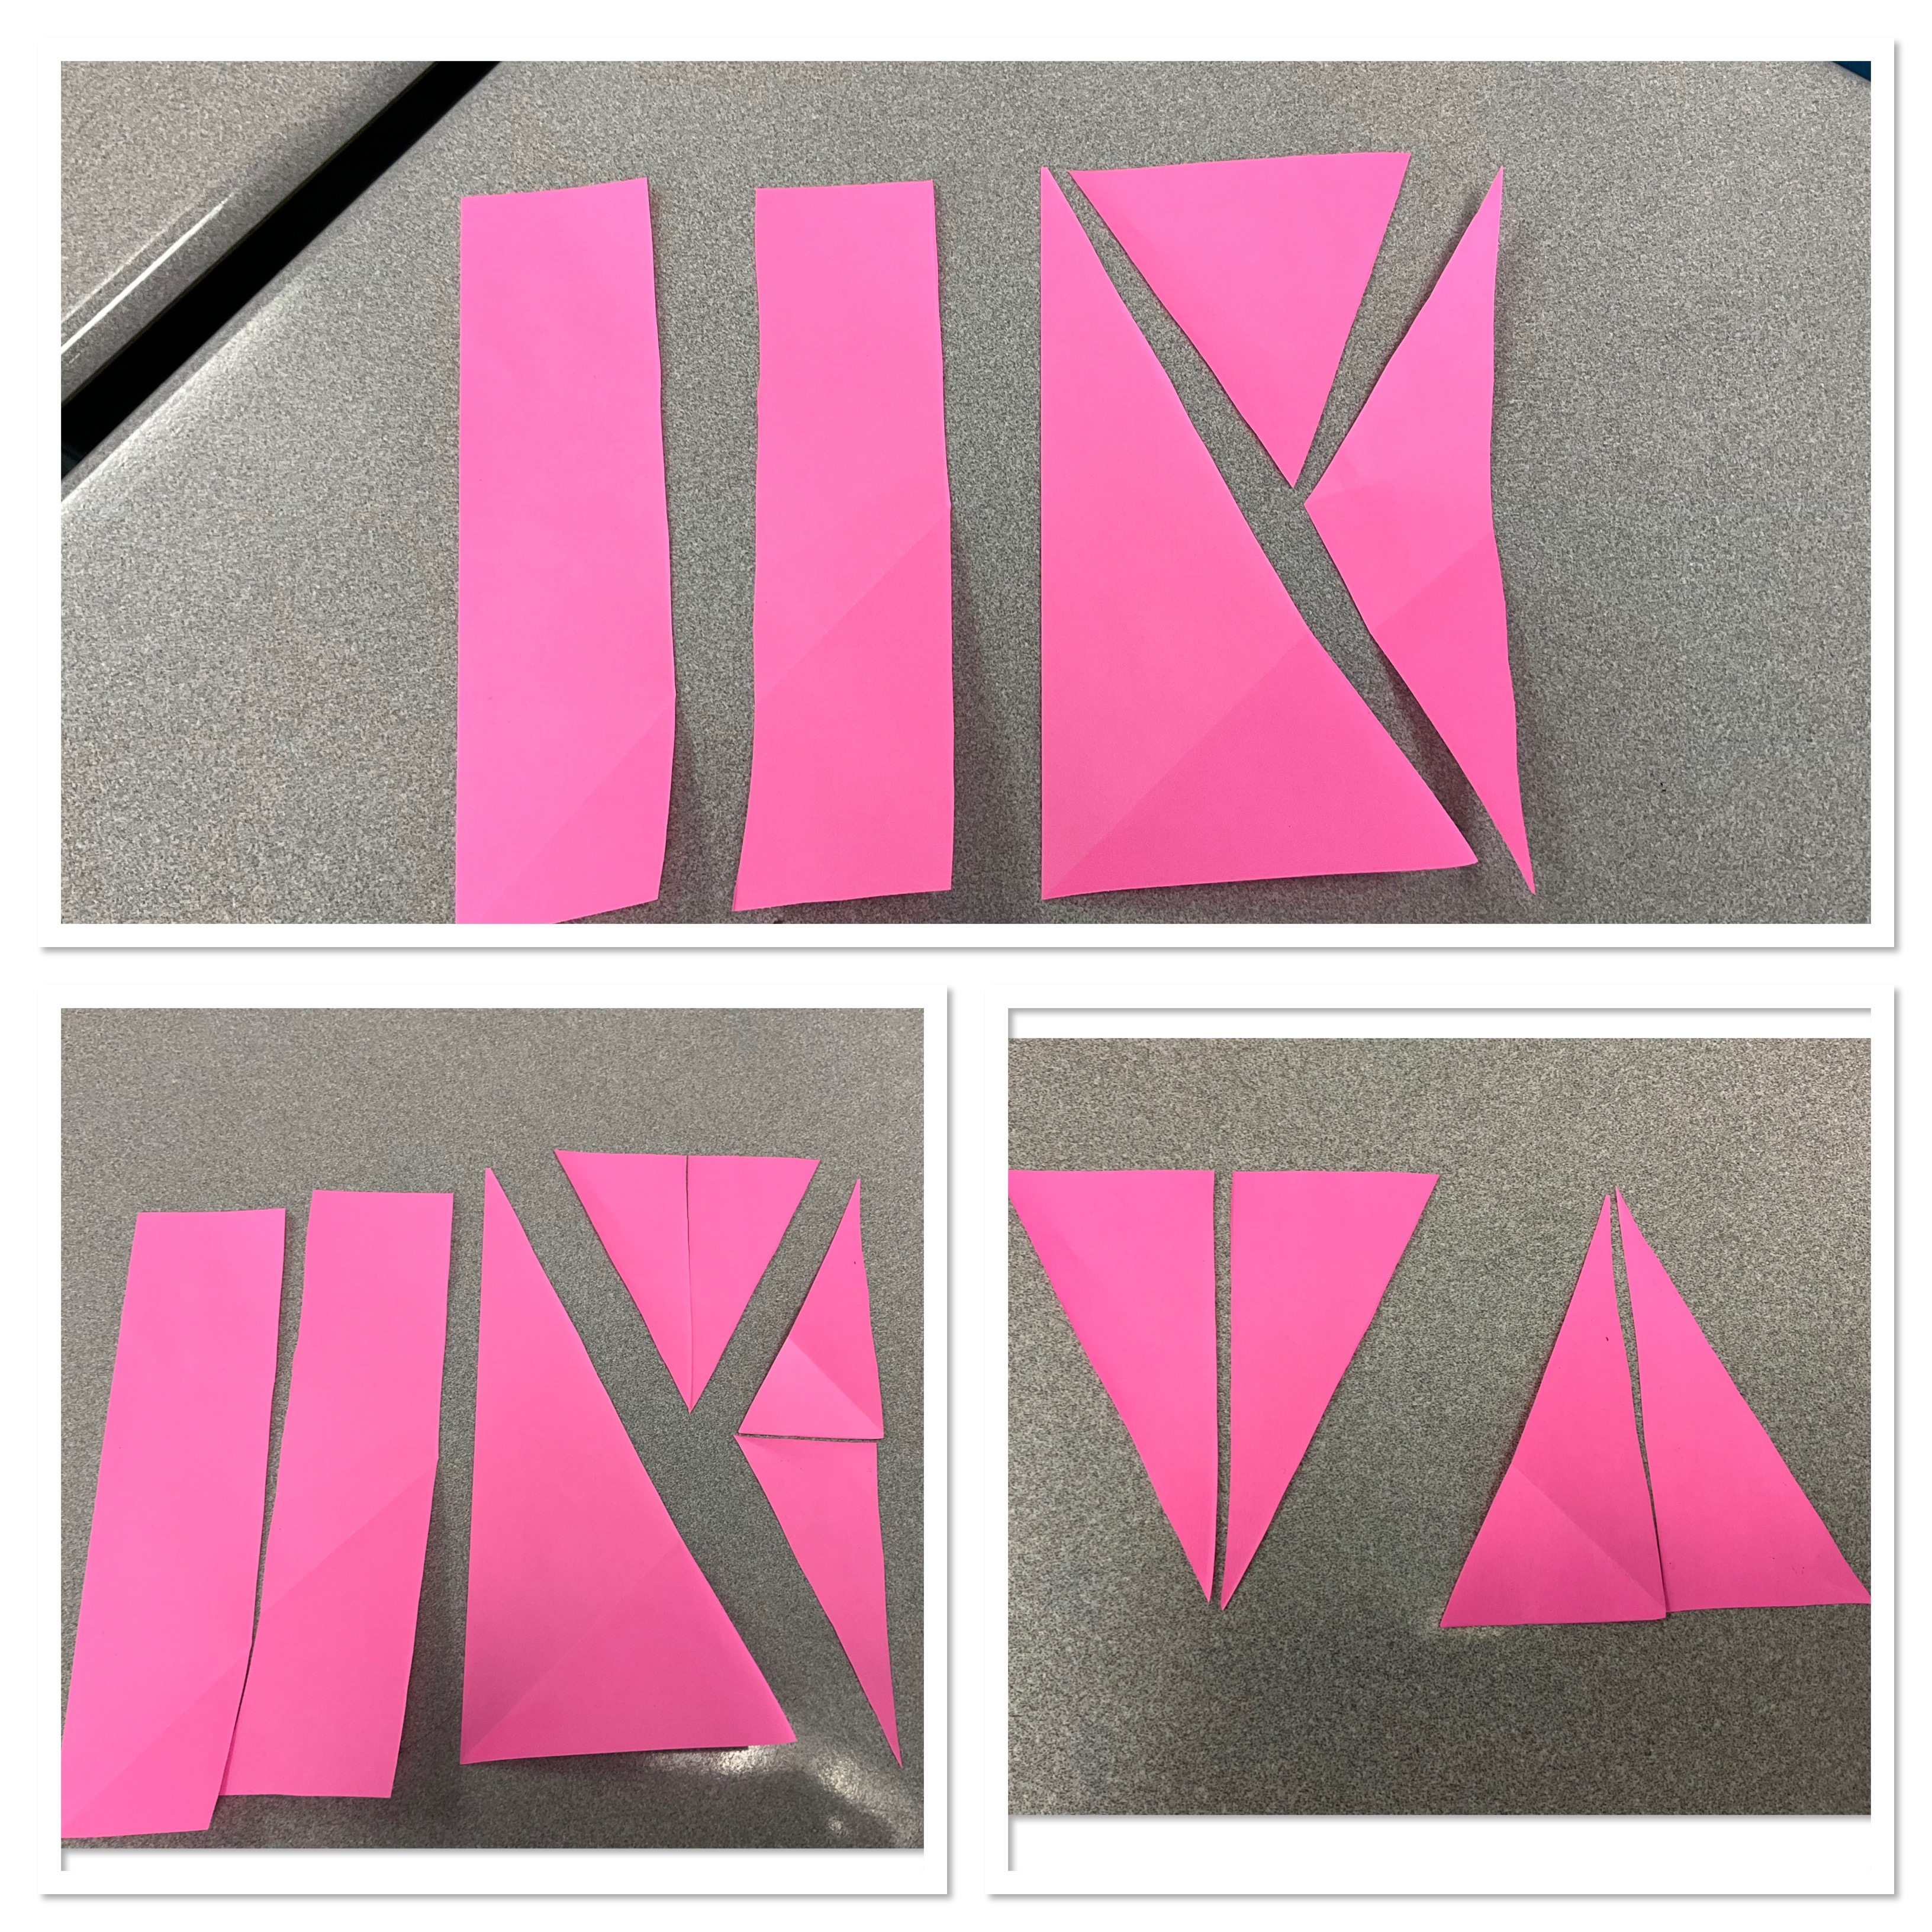
we looked at the entire cake, and one by one cut it up. We agreed that the 2 thin rectangles make up 1/2 of the cake, so they are each $2.50, and then with a bit more cutting and rearranging we could see that the big triangle was also half of half of the cake, so it is also $2.50. The tricky part was the 2 smaller triangles. If you cut the 2 smaller triangles in half, then rearrange them they are equal in area despite being different dimensions, so they are each $1.25
The concrete representation helped these students understand that 1/4 can look quite different, it could be a square, a rectangle or a triangle.
Factoring and expanding
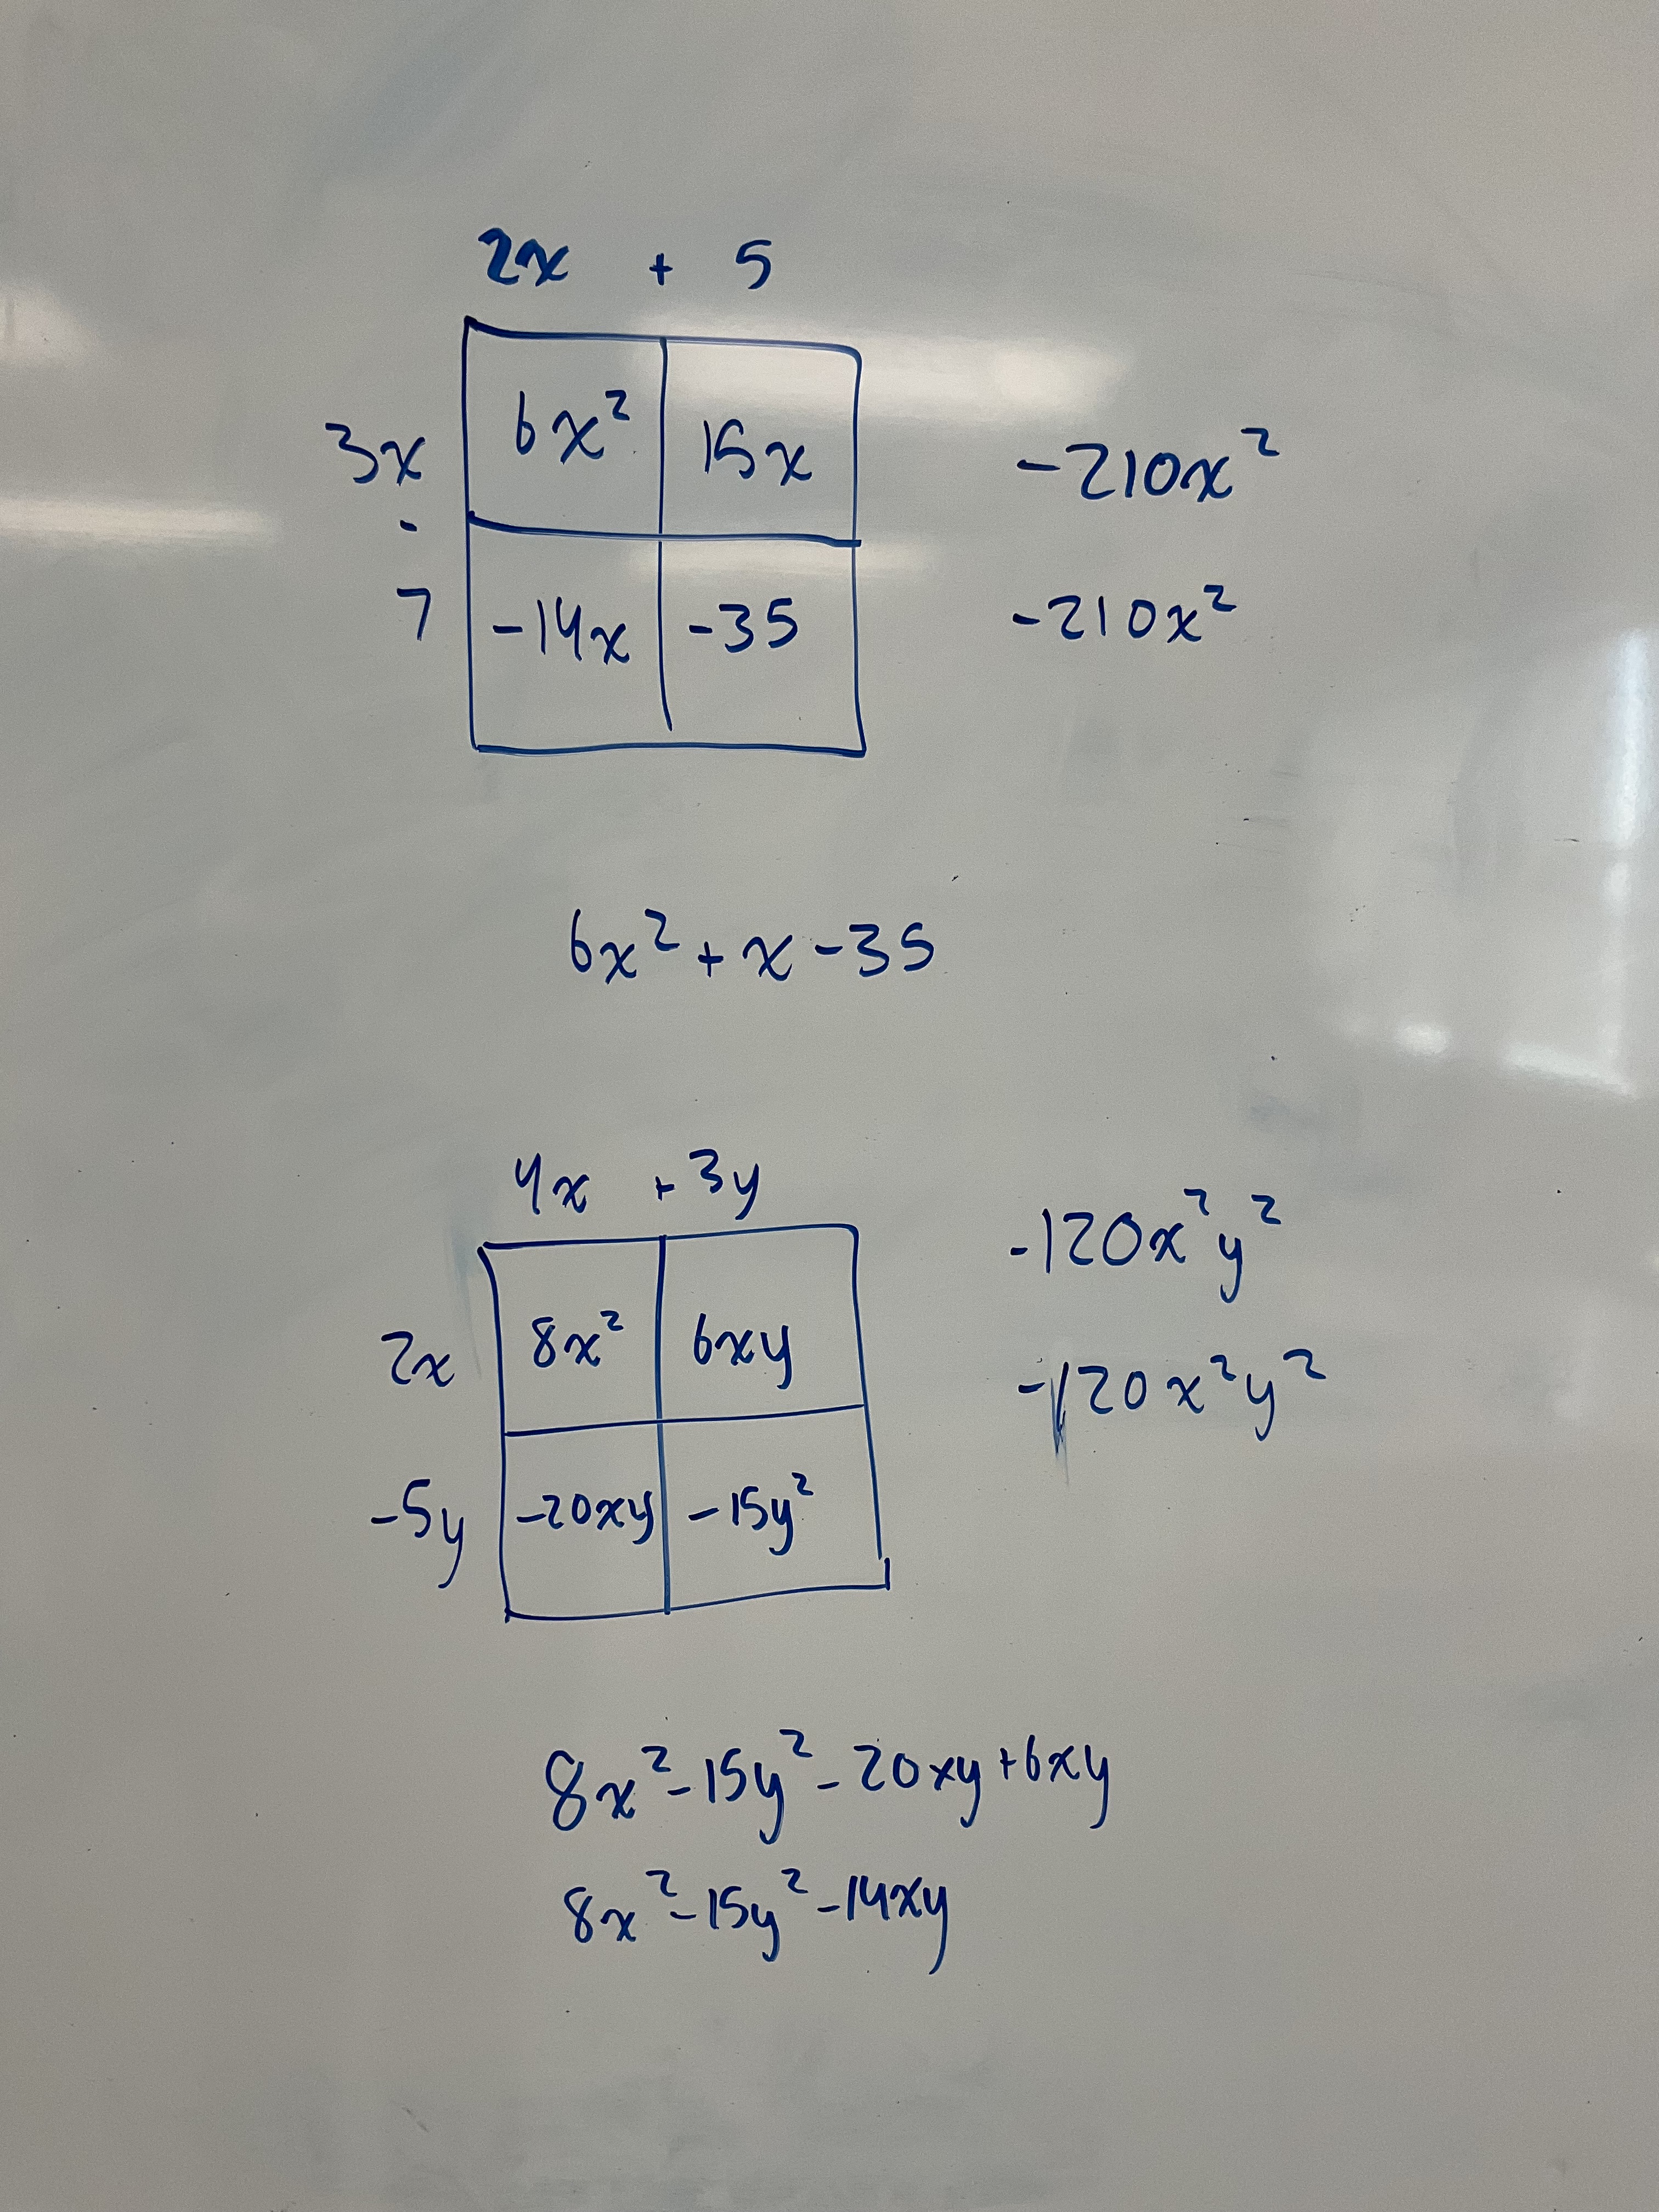
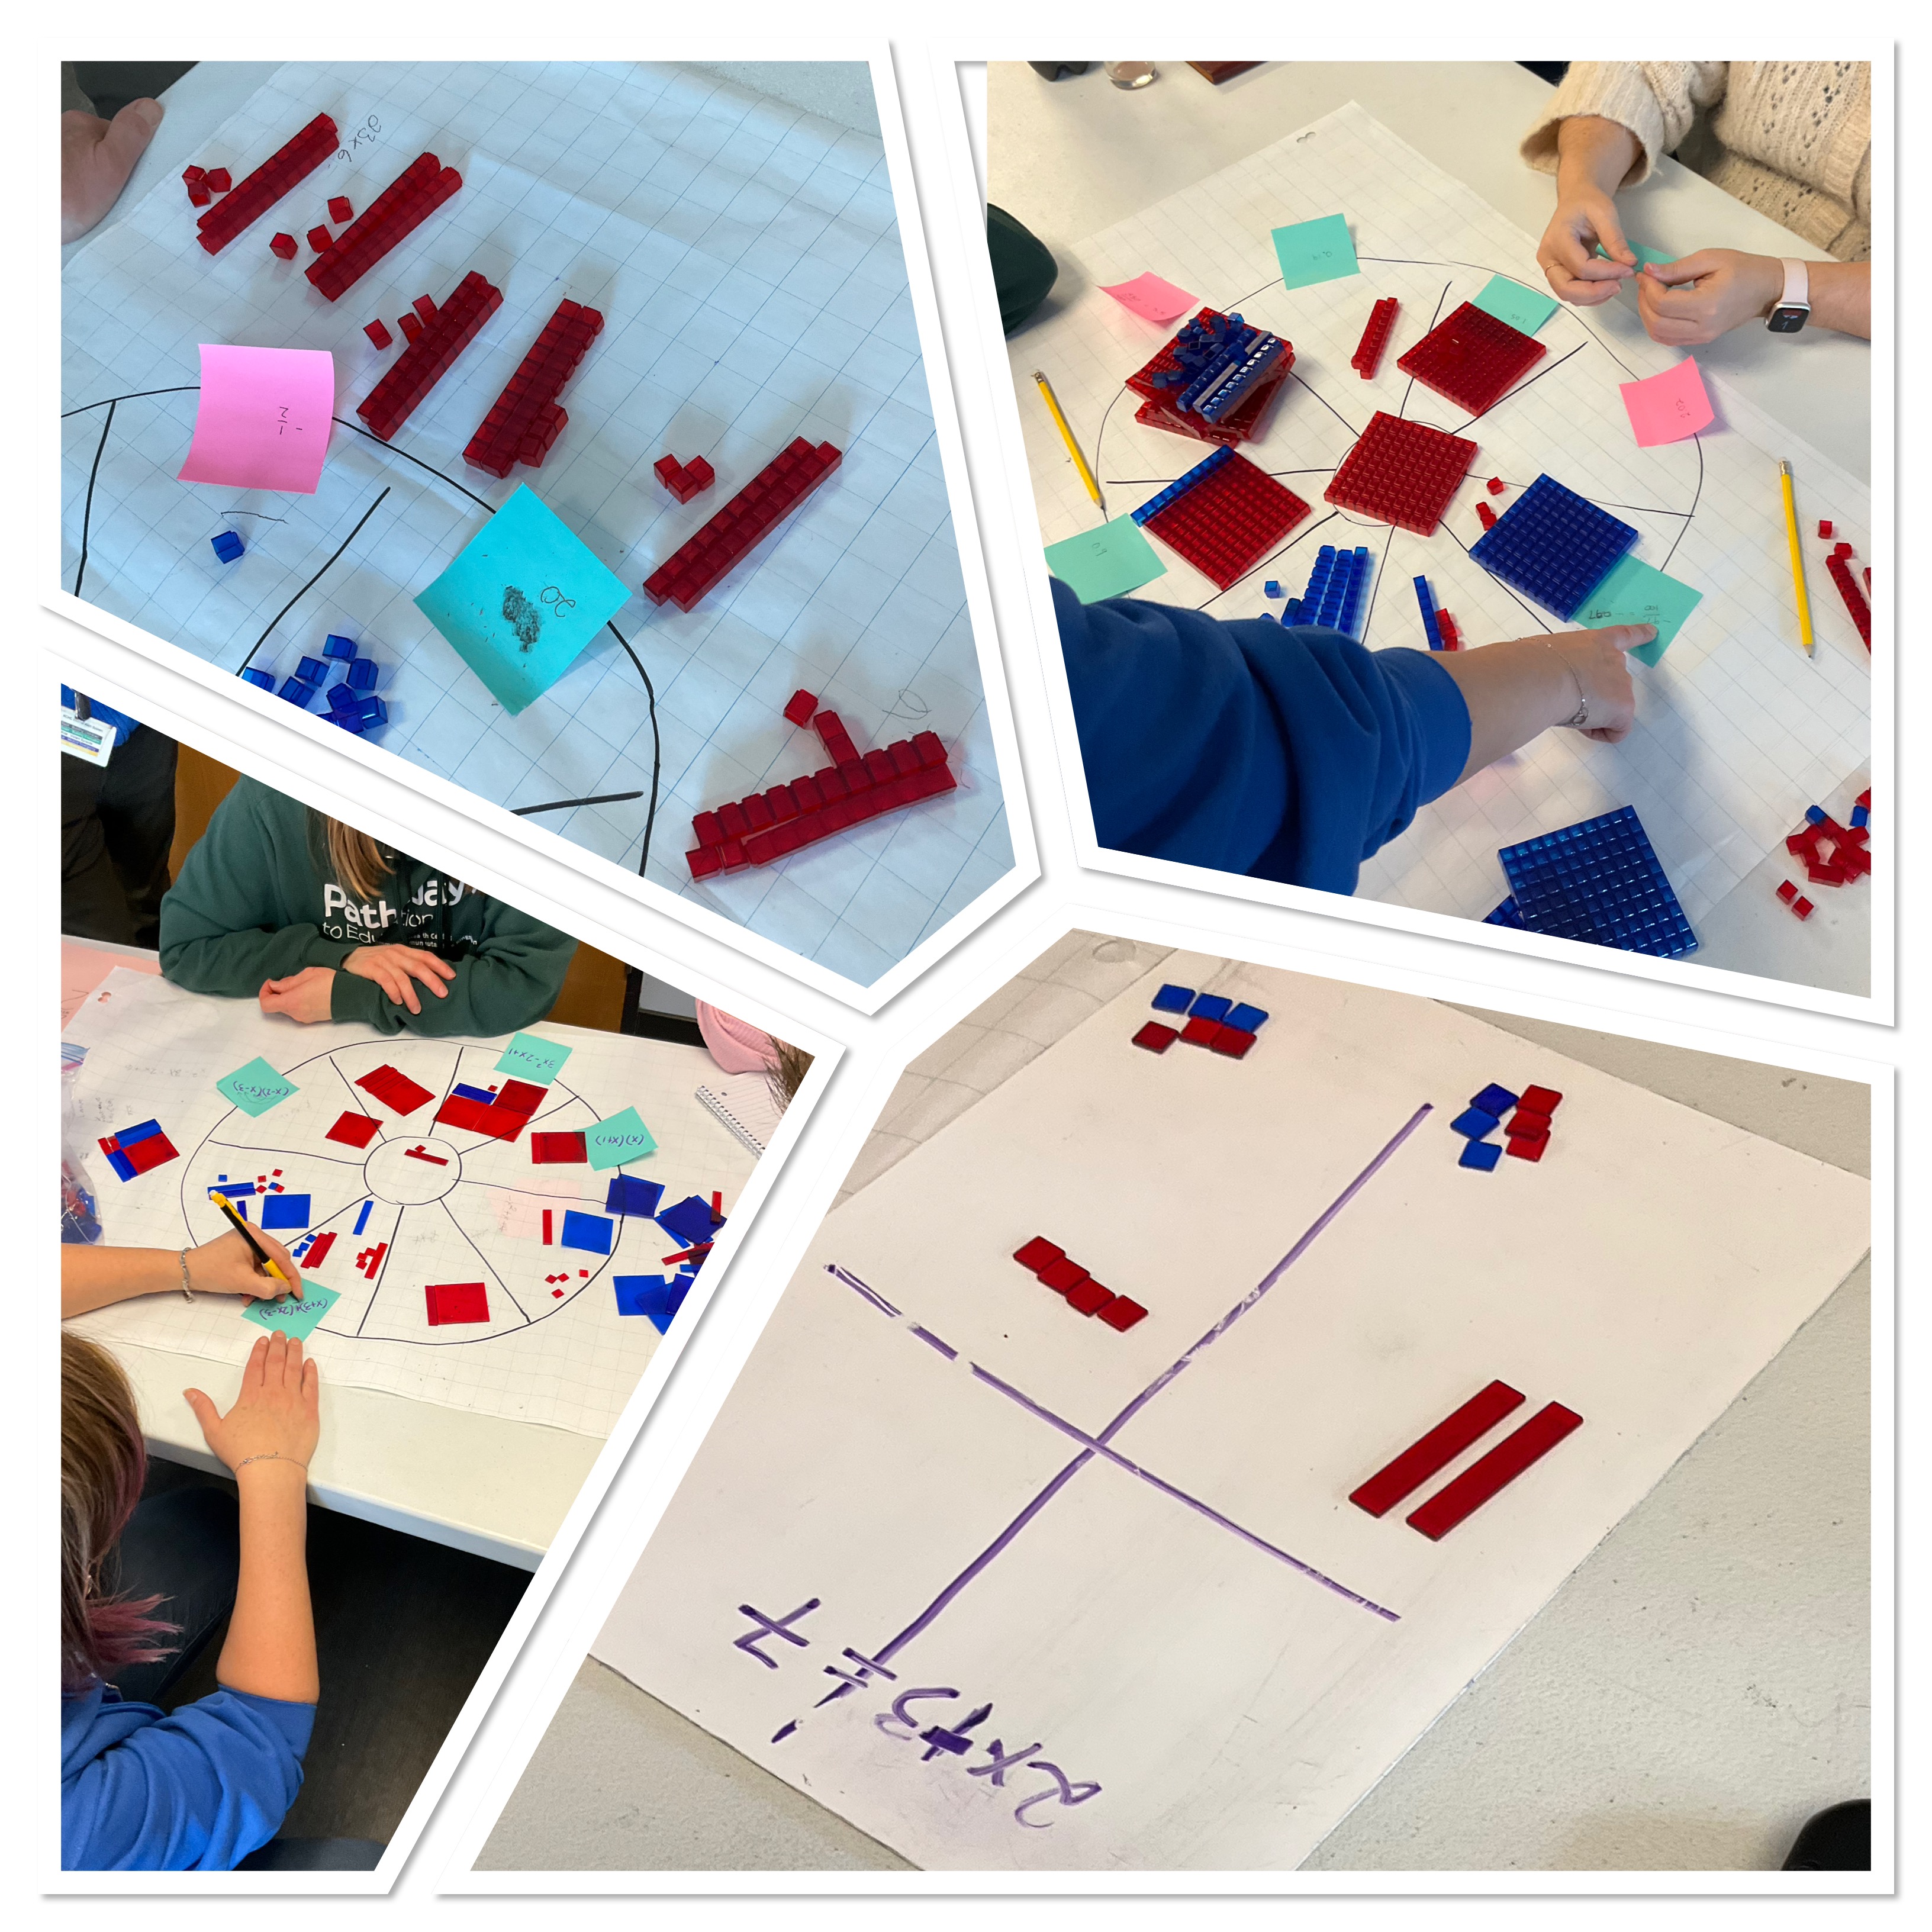
Today in grade 11 we continues to work on factoring and expanding. We saw how the area model can be helpful when multiplying all kinda of things, like binomials, trinomials, and even mixed numbers. Arrows and the distributive property also work, but sometimes we can lose track of what we’ve multiplied.
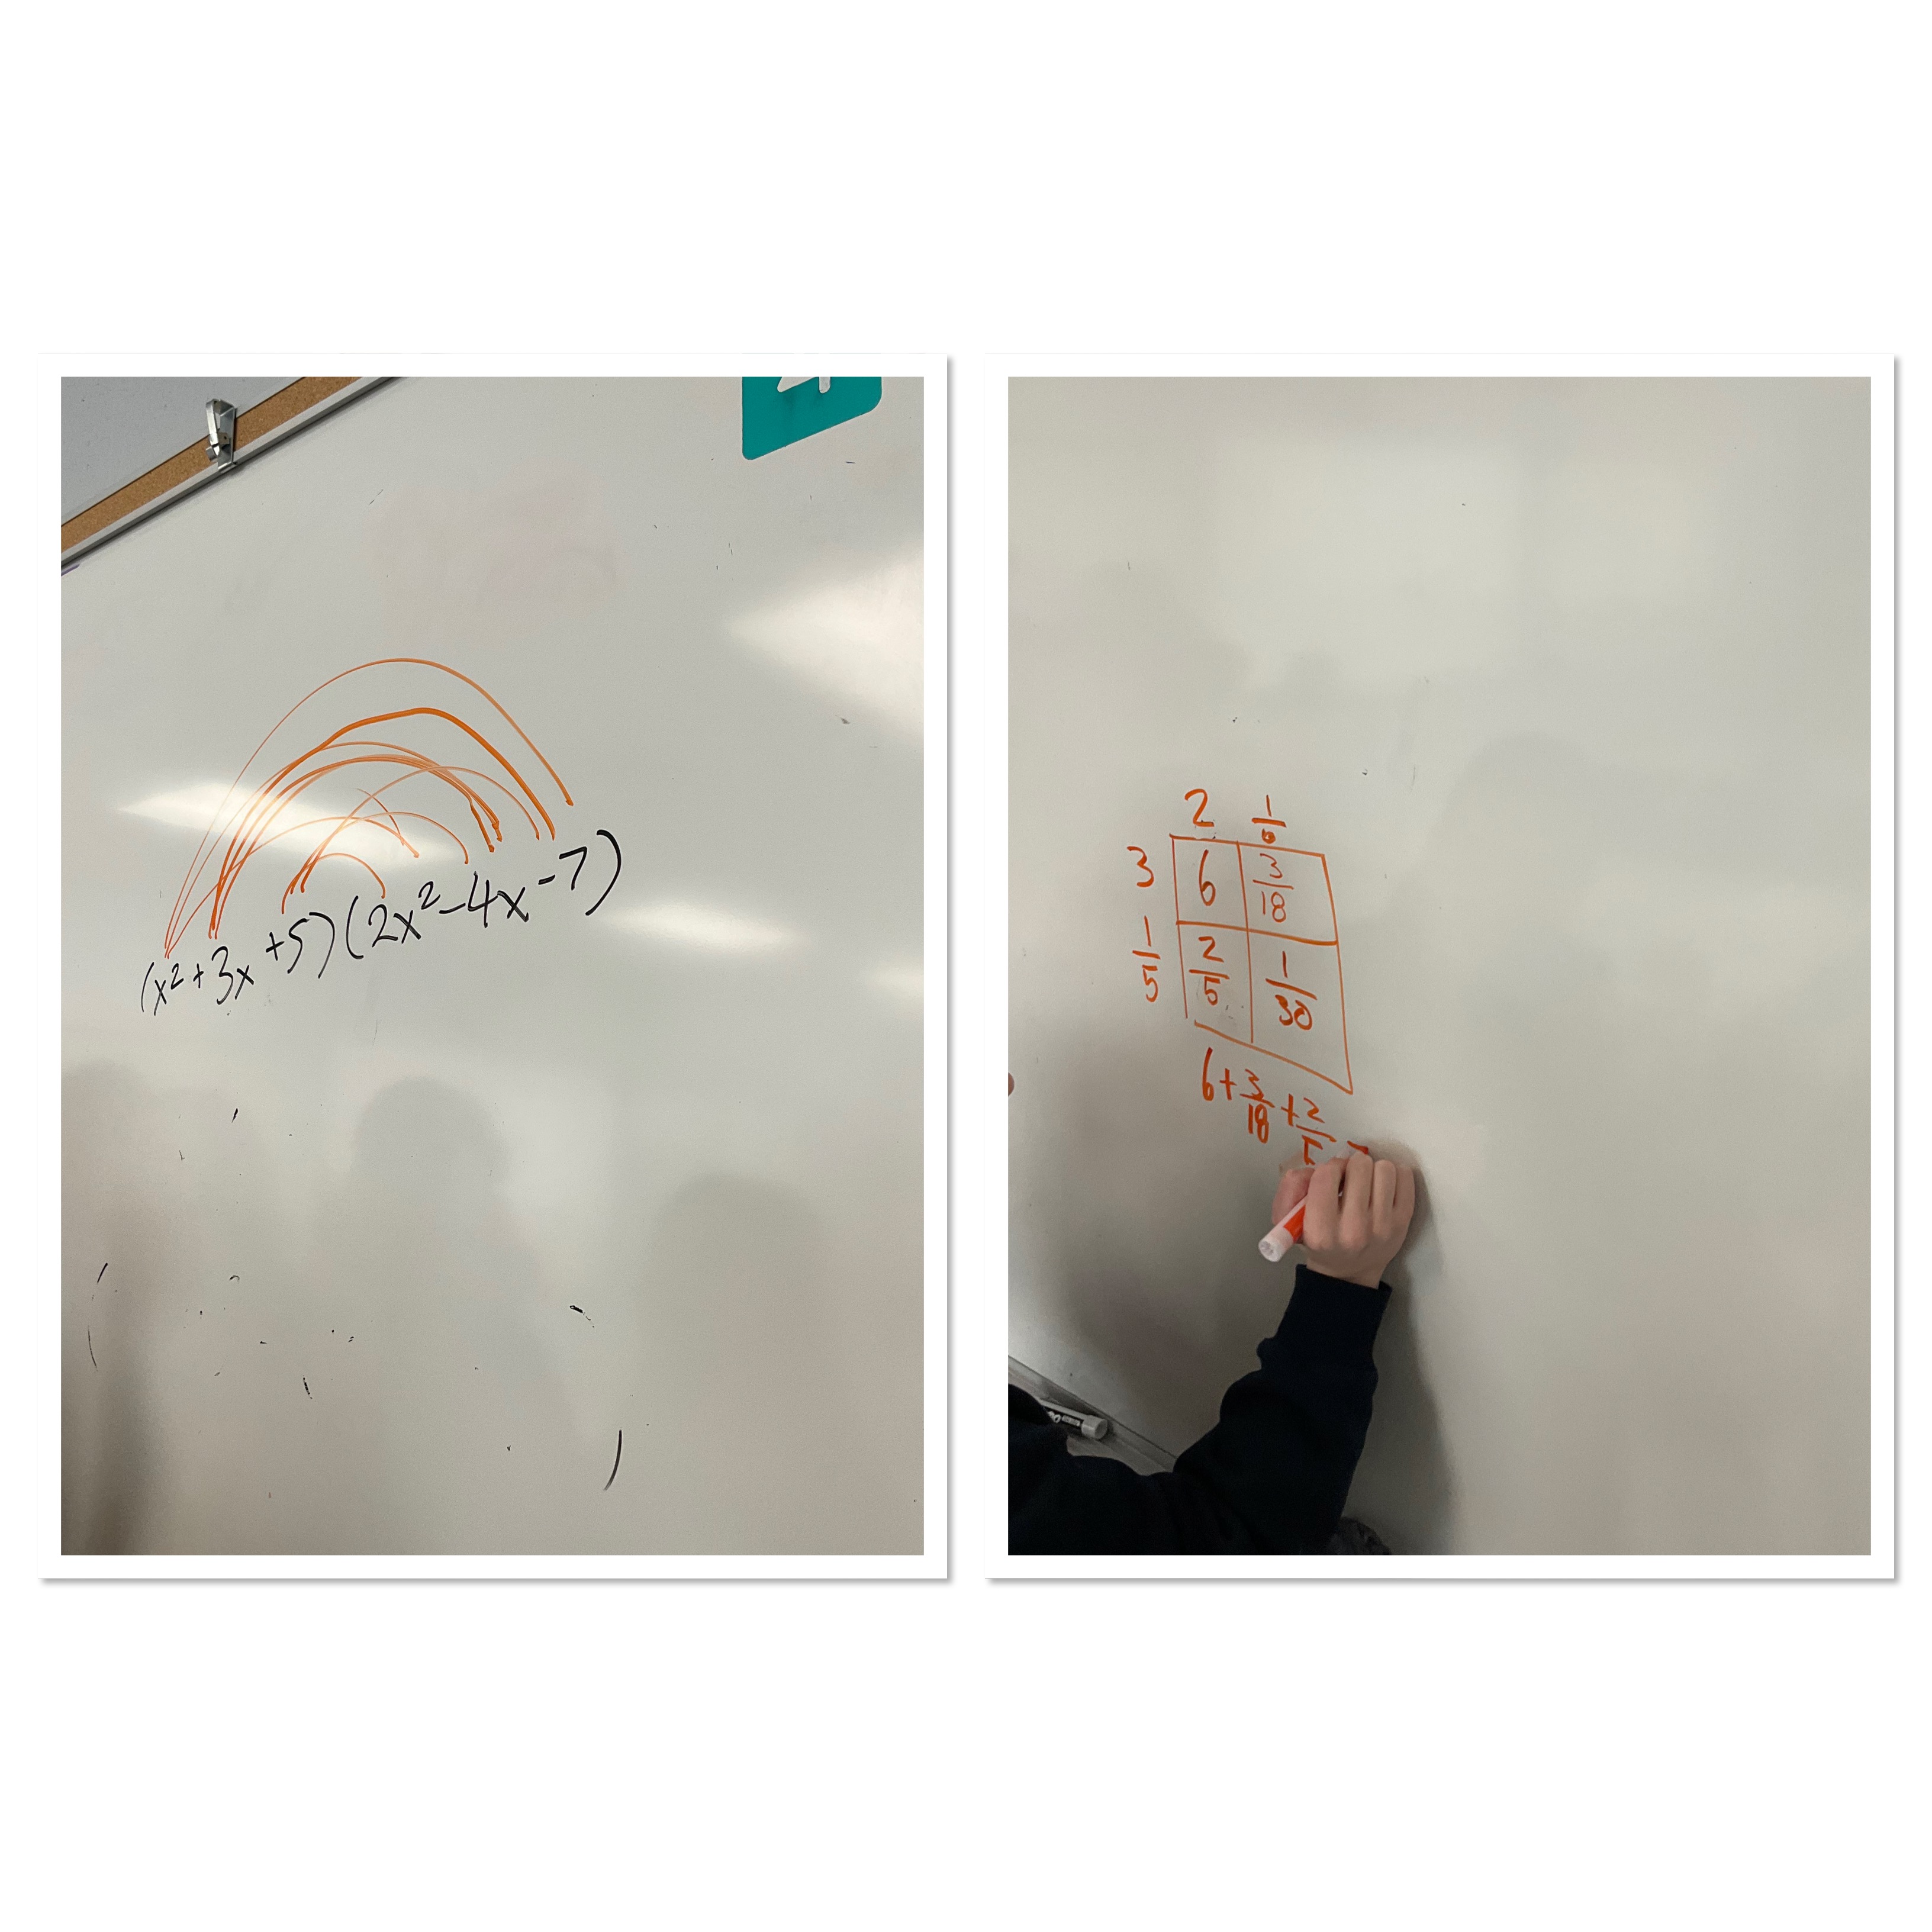
Here are 2 groups who tackled the same question in 2 different ways. The area model allows us to see that like terms are all along the diagonal and easy to collect together.
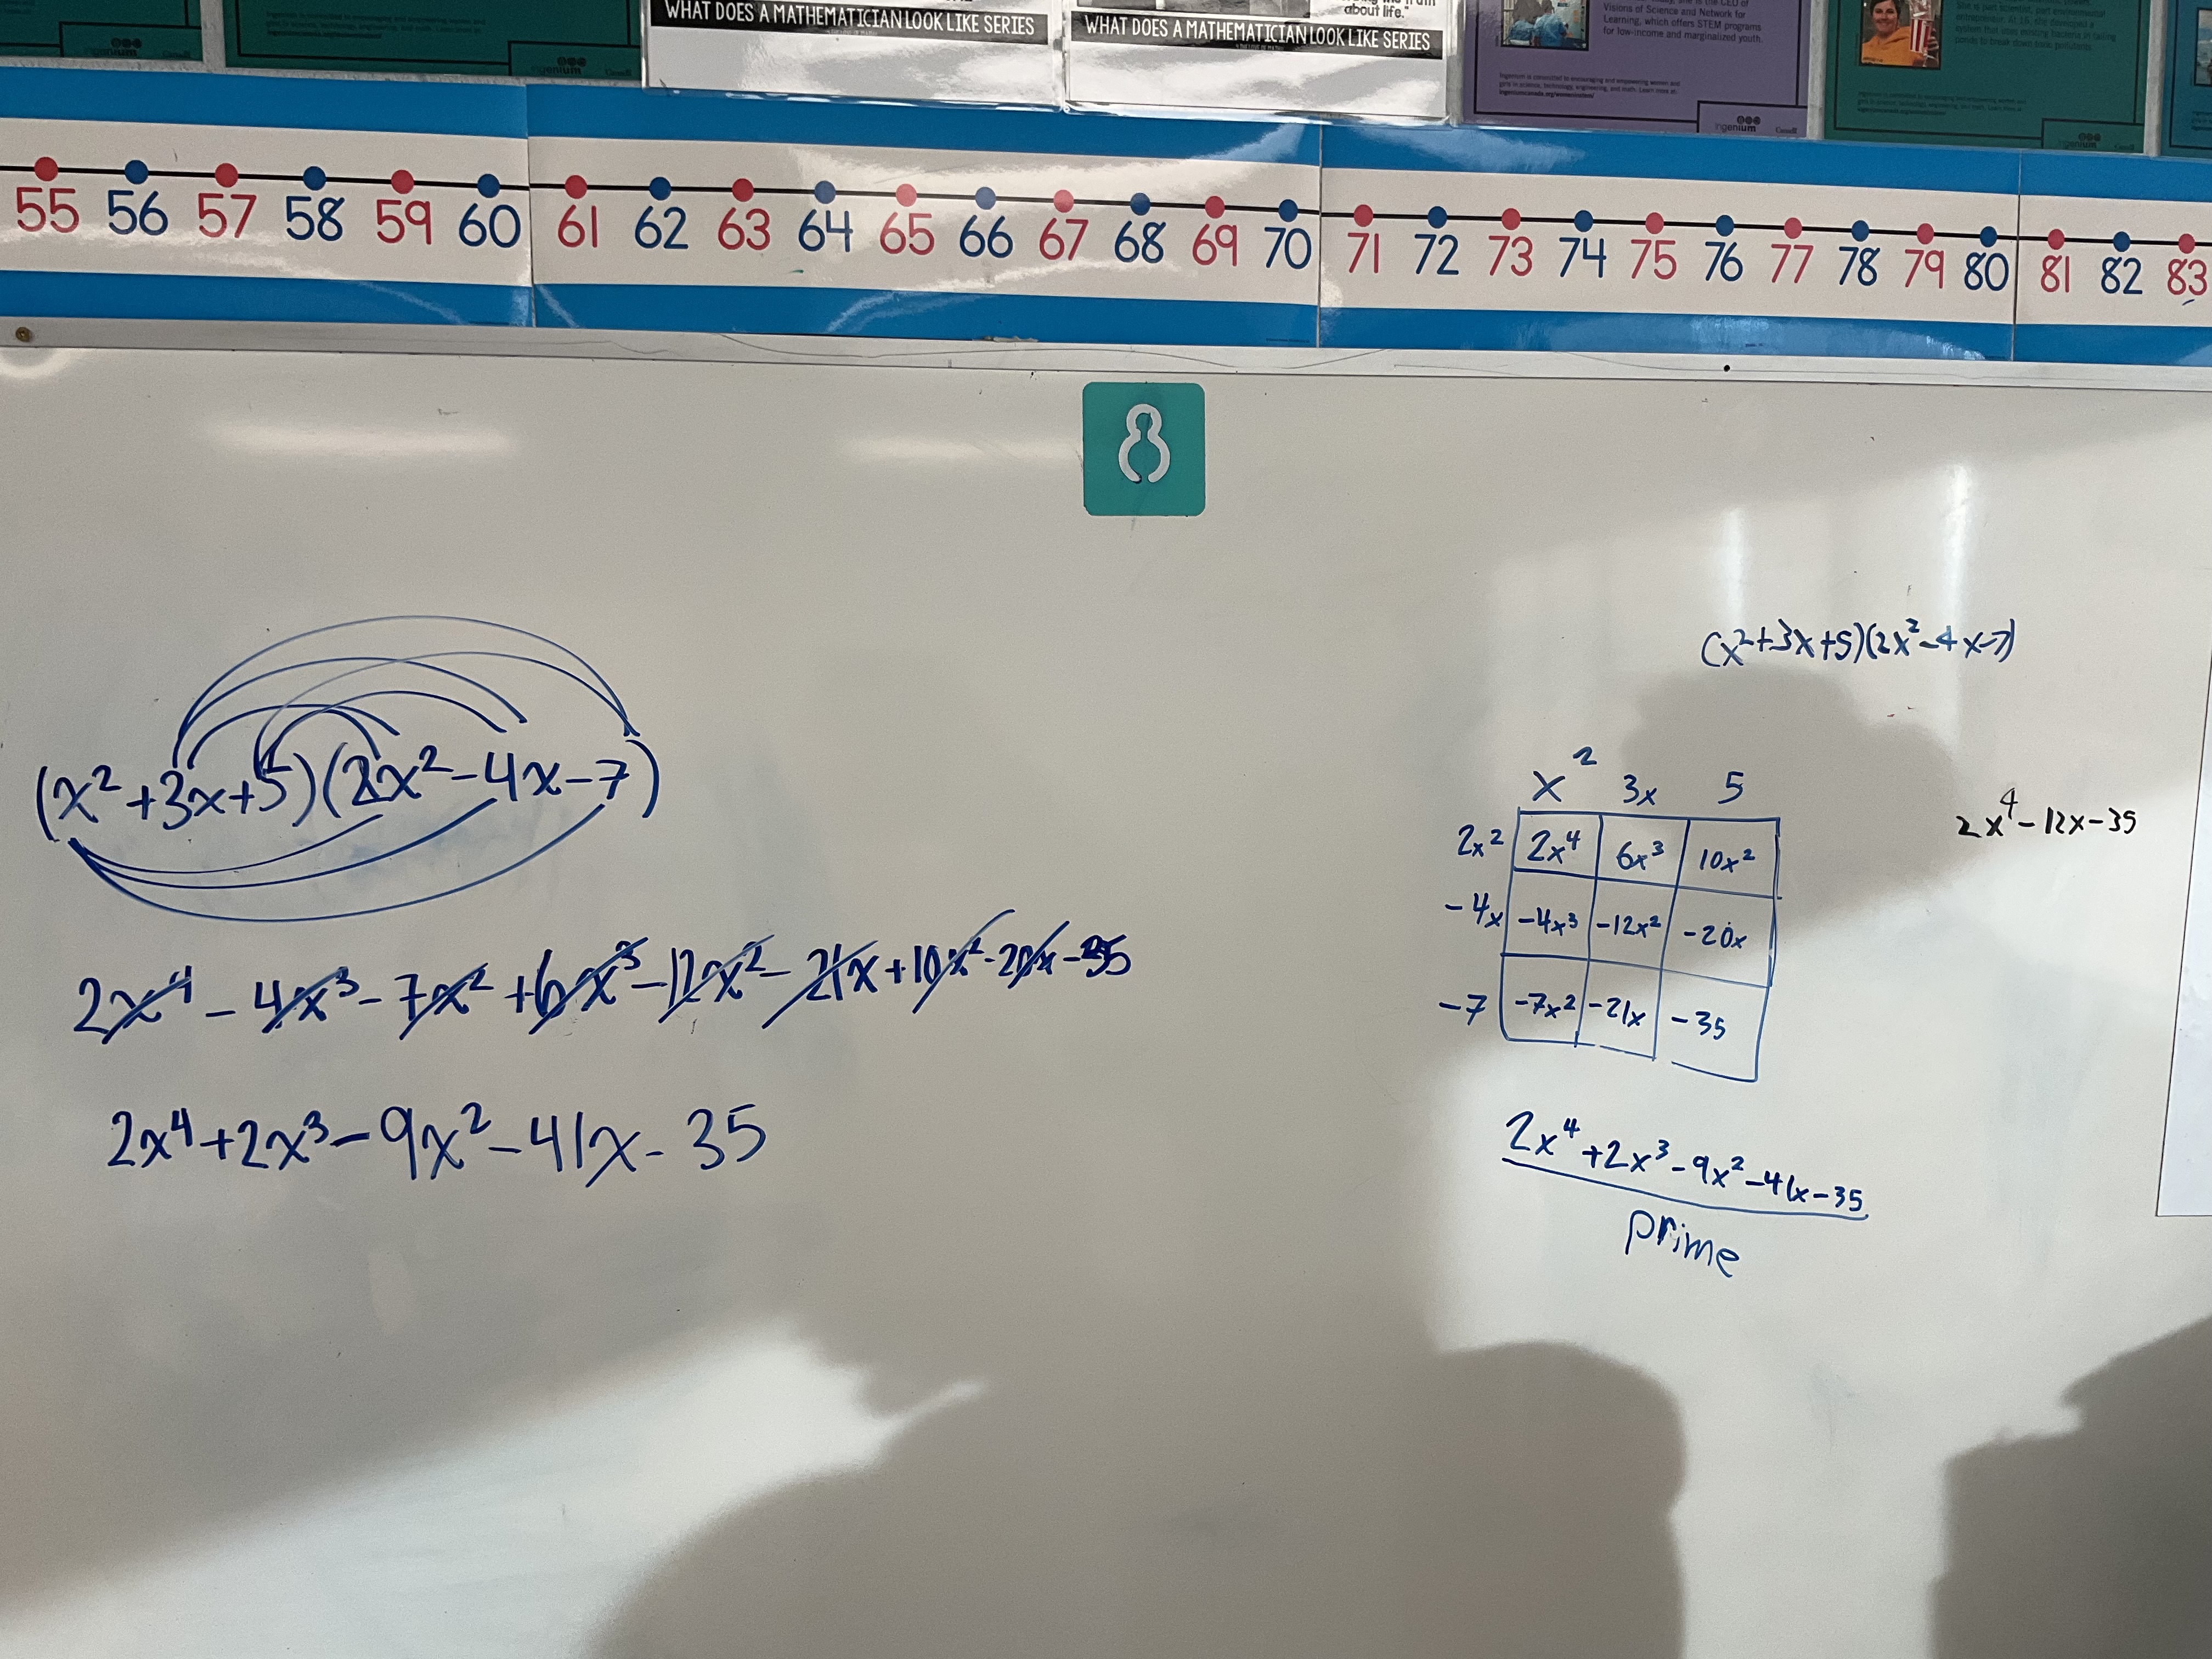
We also had some practice working backwards with both common factoring and factoring trinomials. We watched 2 excellent factoring music videos as well to get us pumped up.
Collaboration
Today we worked on our collaboration skills. We did the 1-100 task by Sarah Van Der Werf.
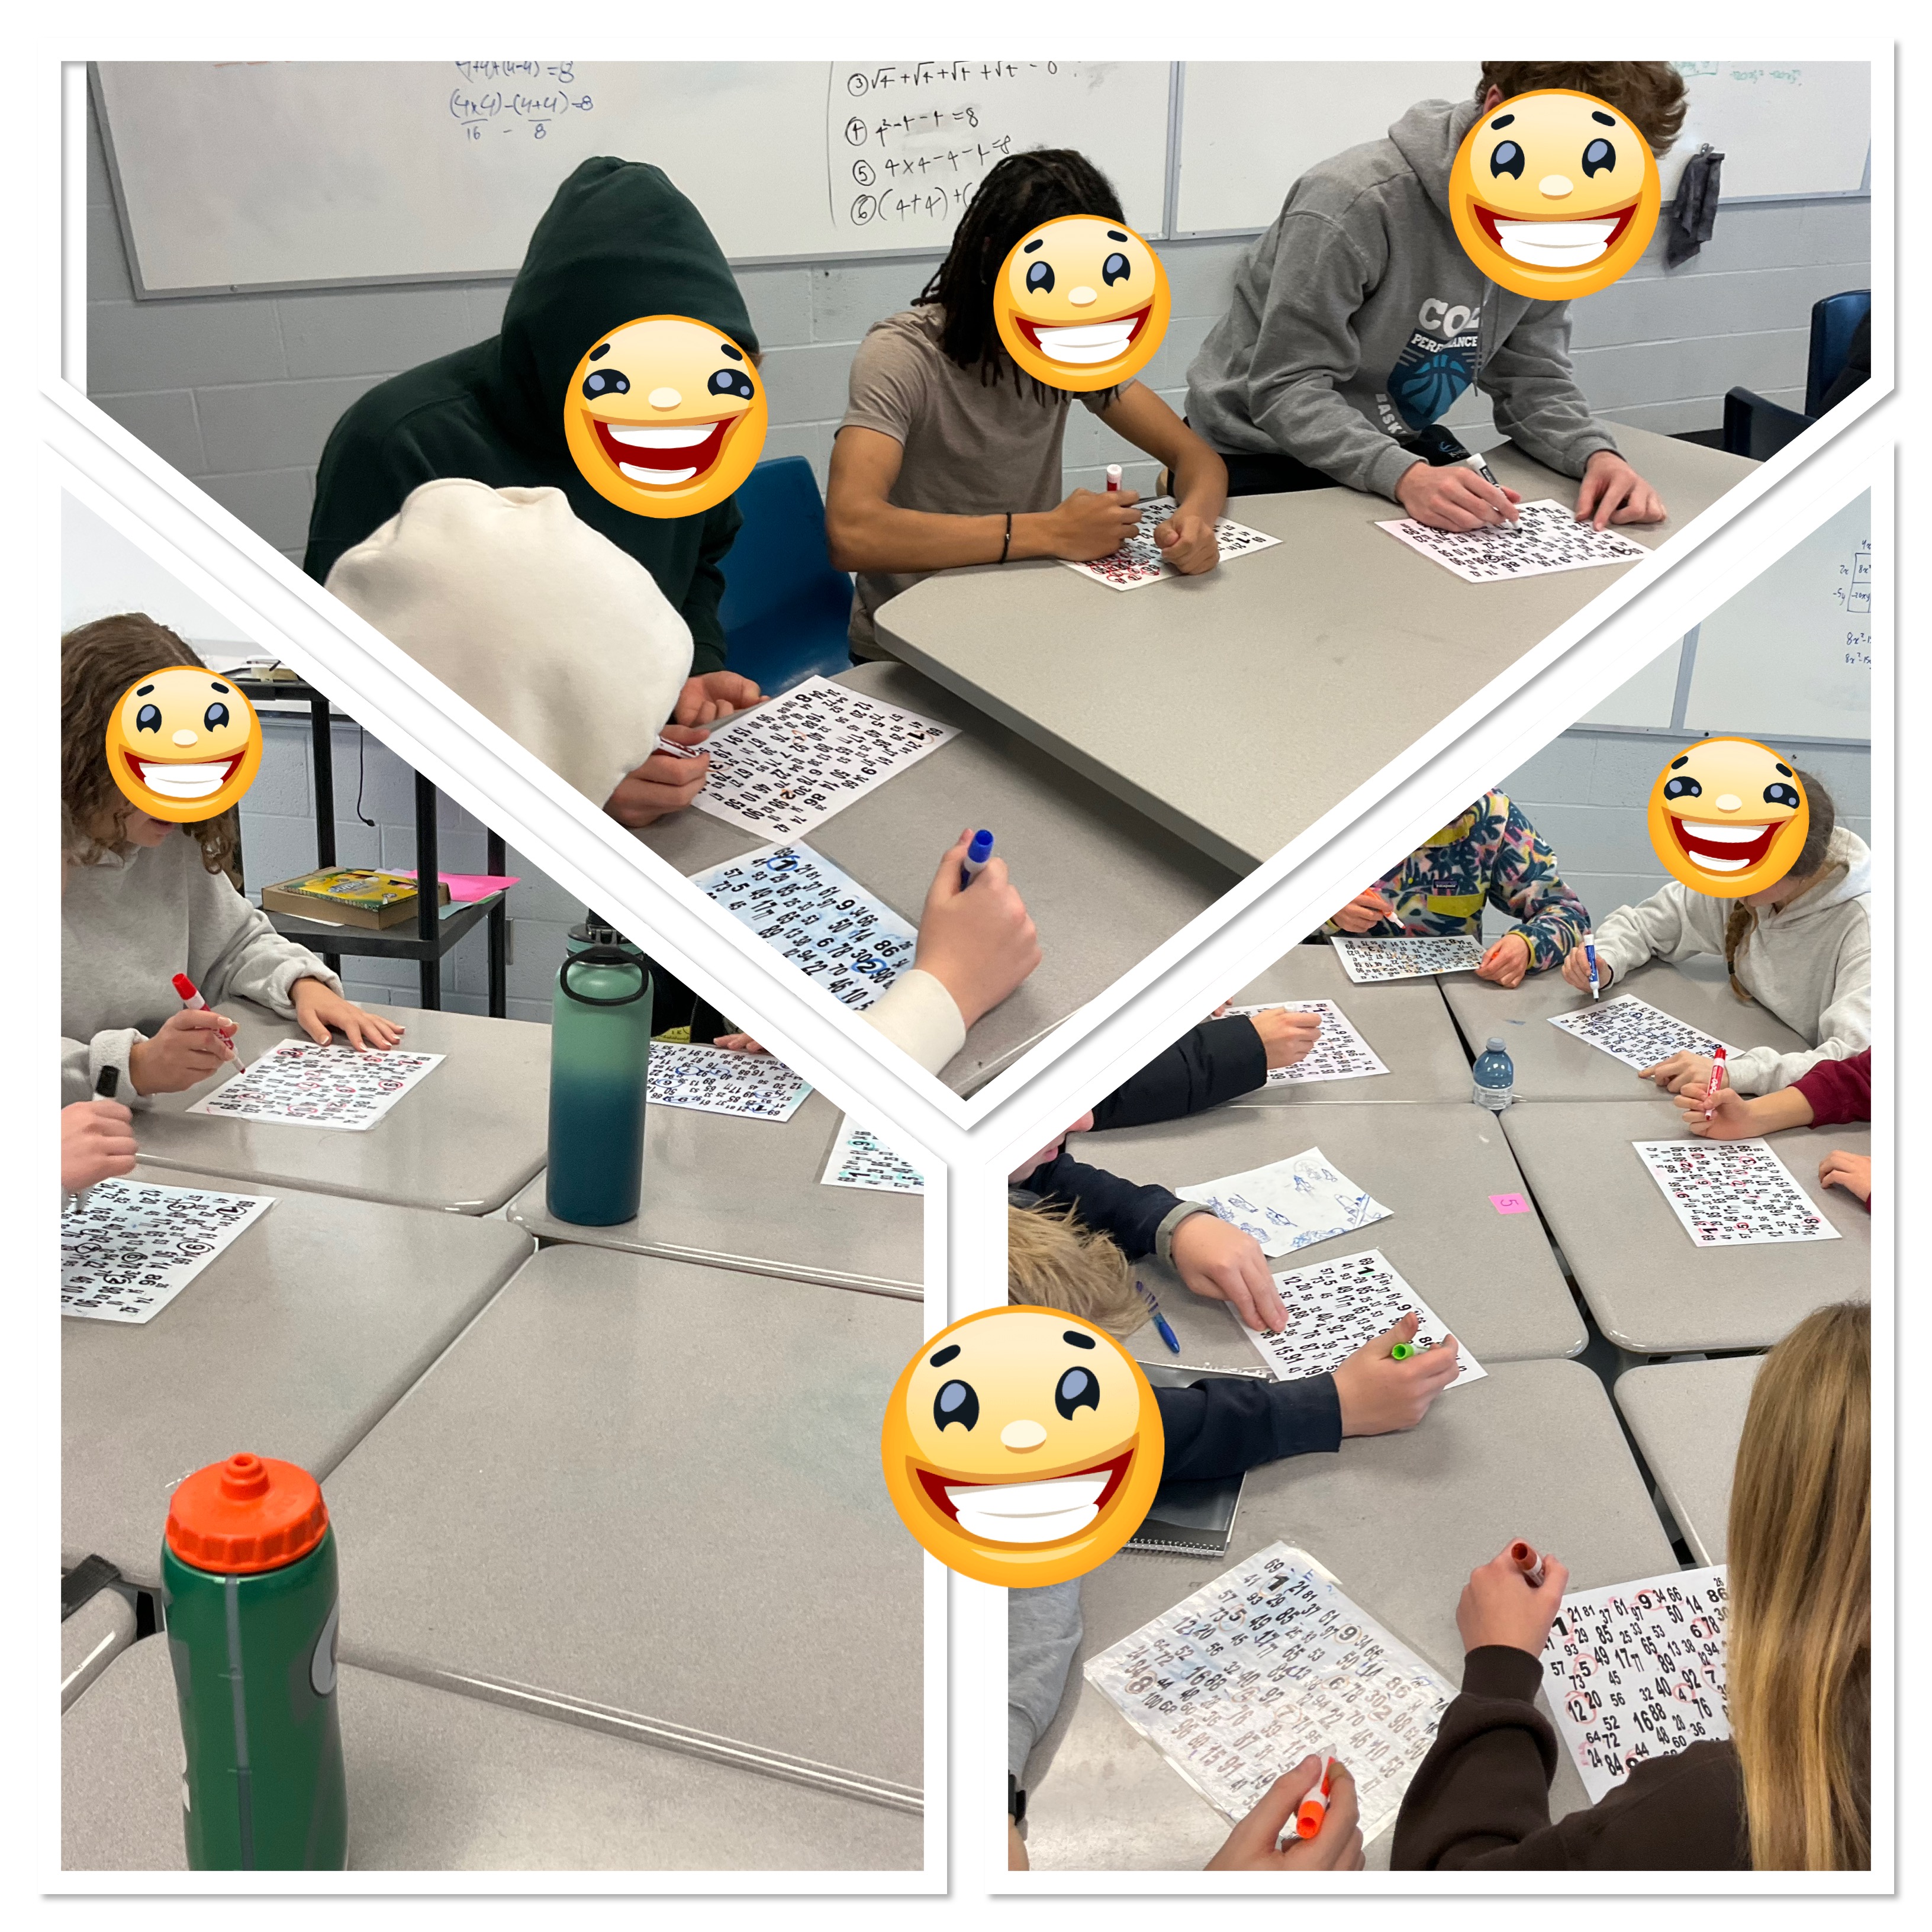
We did the task solo. It was estimated that we’d take 100 seconds to circle 100 numbers in order. That was a massive underestimation. It took us about 10 minutes and some were not finished after 10 minutes.
Next we tried in a team.
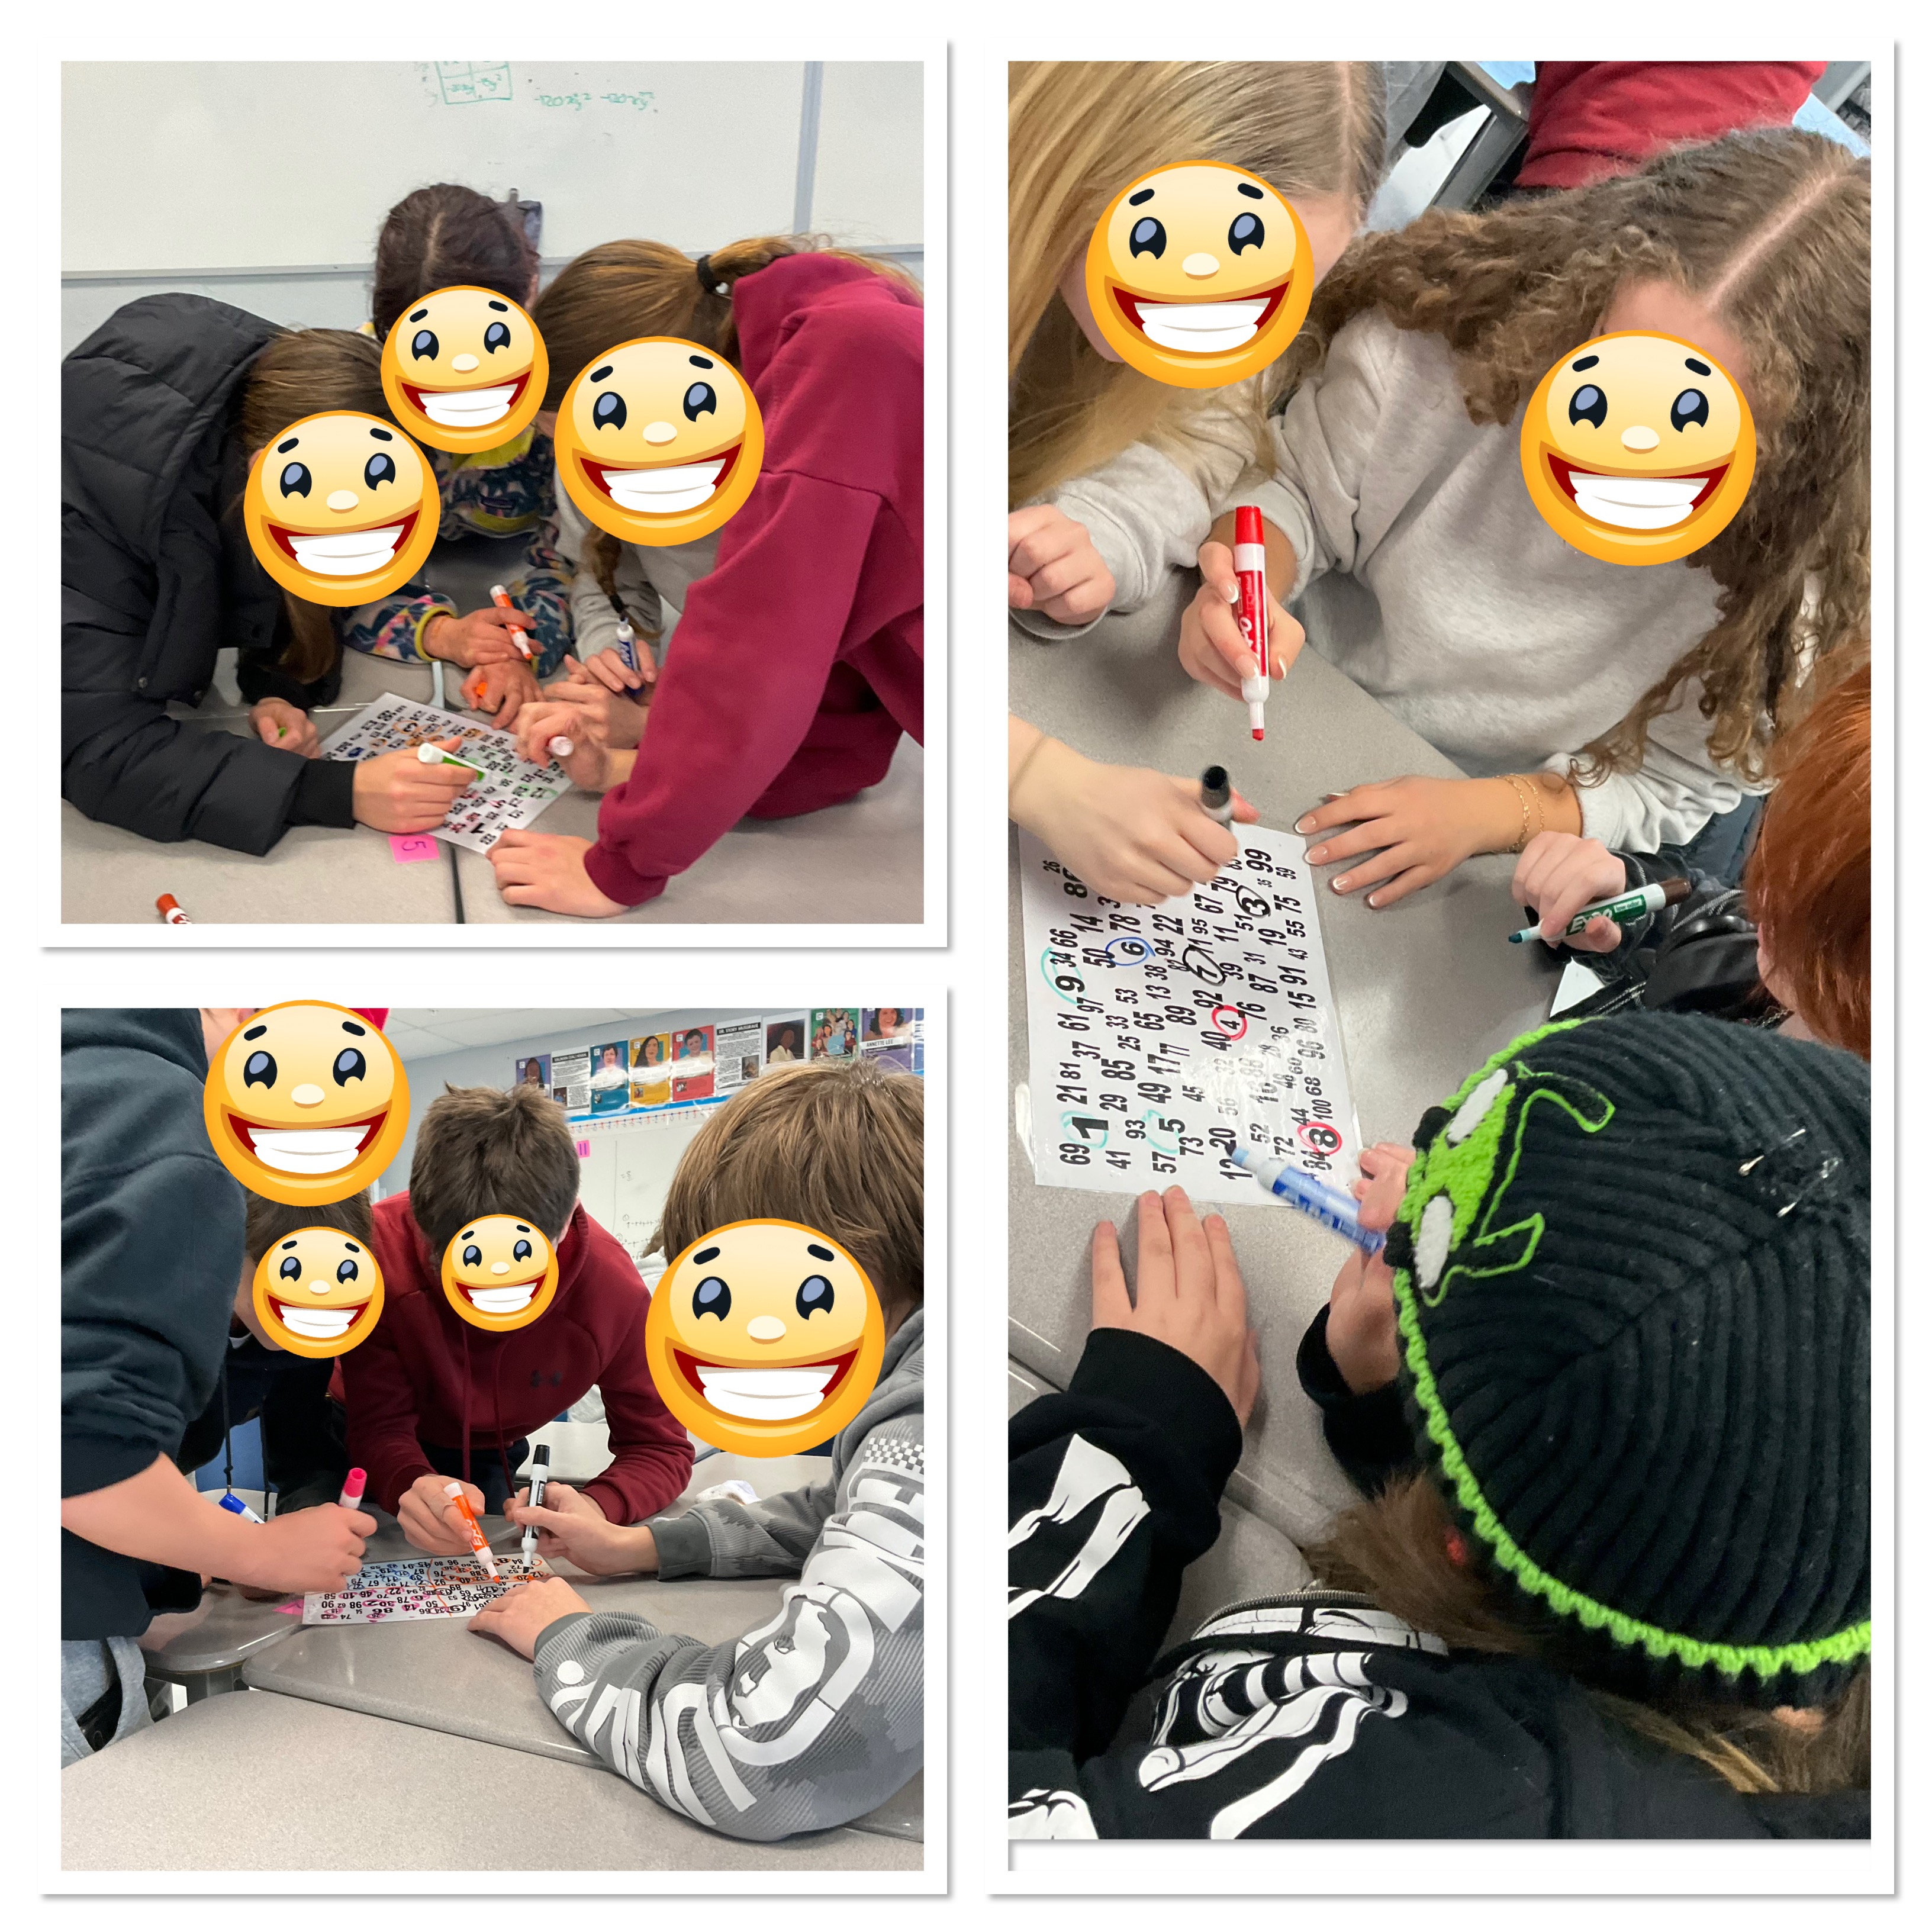
We did 2 different trials as a group, adding different strategies each time. We got the time down to about 2 minutes!
We debriefed by looking at pictures of our groups doing excellent work together. We noticed how we were on task and helping each other. There were positive encouraging words, and we were all included and participating equally. There was such an intensity of good stress, and joy and enthusiasm. It was a challenge to calm ourselves down after all that!
We ended the class celebrating our very first Vennsday, where we explore number sets using Venn diagrams.
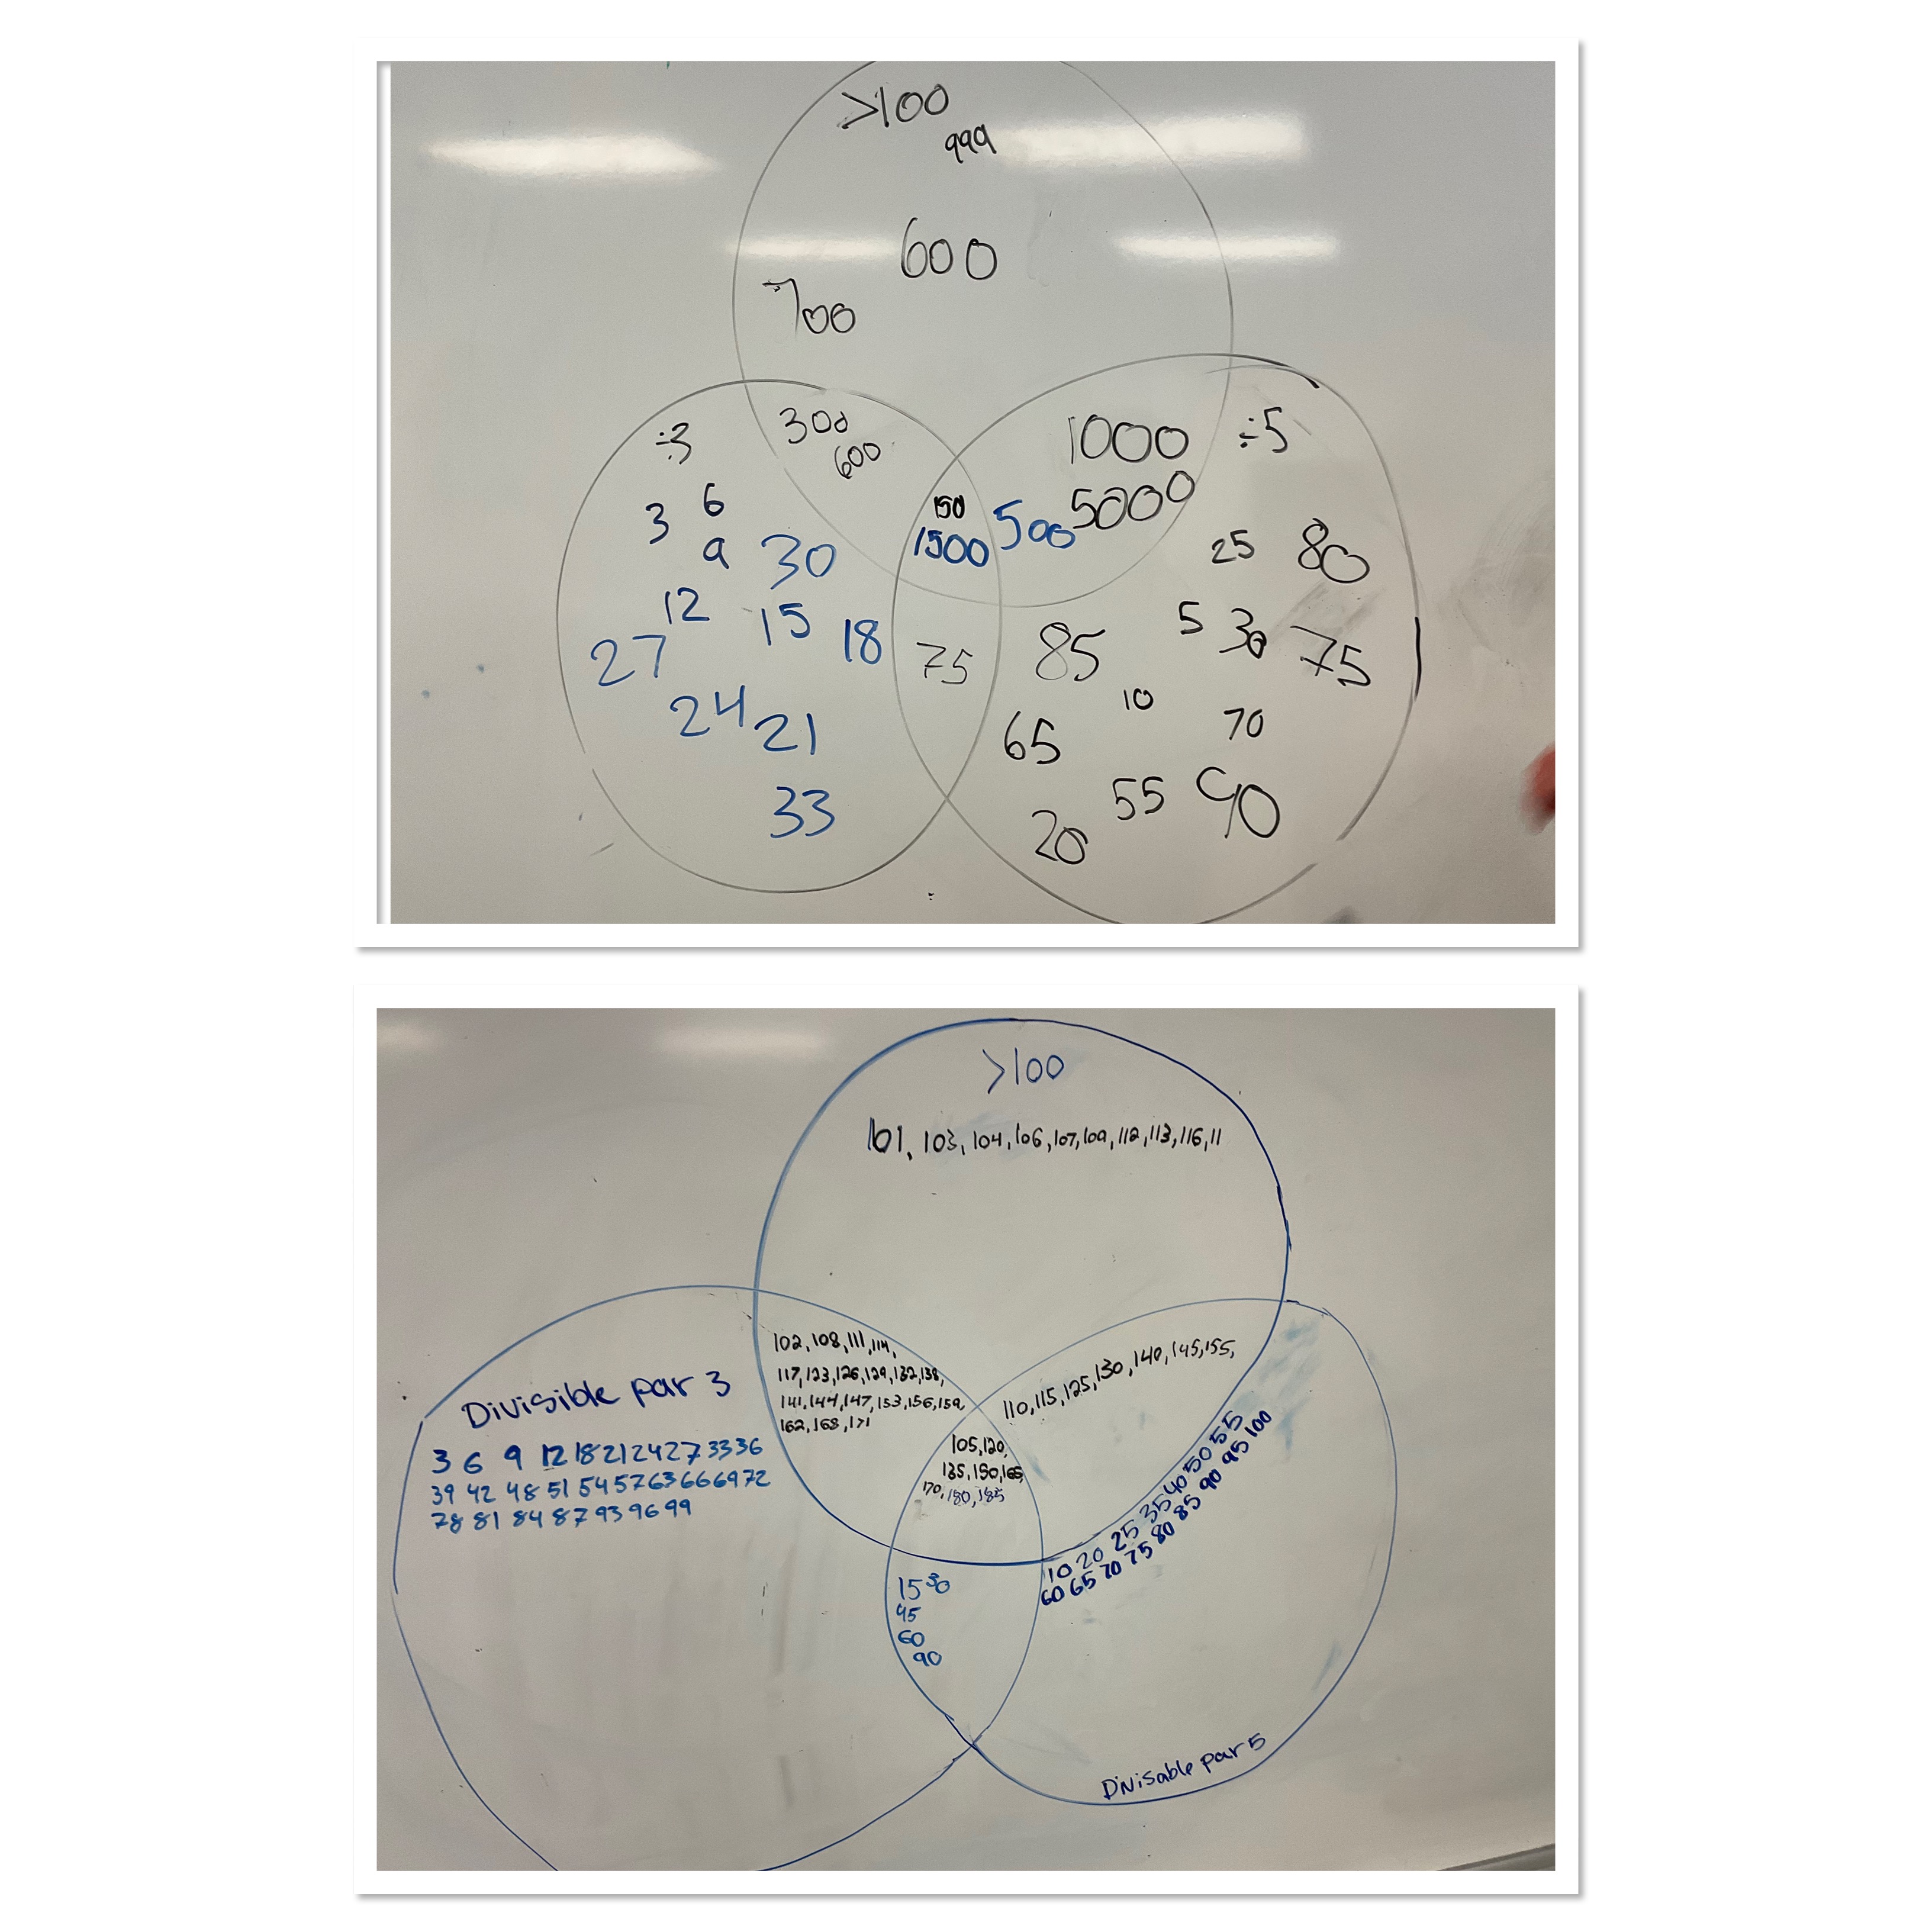
We looked at numbers that are greater than 100, divisible by 3 and divisible by 5. We debriefed some divisibility rules together at the end of the class. What a great collaborative day!
Area Model
In Grade 11 today we were doing grade 10 review, and looked at many topics but spent some time on multiplying with an area model.
One lovely thing we can observe when we use an area model is that the diagonals in the box have the same product. It’s always true! This relationship helps us when we come to factor. We can work backwards and use logic to help fill in the box as we factor.
We’re growing beans!
Today I was invited to do a lesson in a colleague’s grade 10 applied math class. We’re going to do a long term activity that starts off with germinating some beans. I used to do this task all the time at KCVI, and packed up the beans when we moved to KSS, but due to windowsill limitations, I’ve not embarked on the task again, until today.
We wondered a bit as a class about how to grow beans in the classroom, and if different beans grow differently. We have the old beans from 2014, but I was nervous that they might not germinate, so I also got some new beans last night.
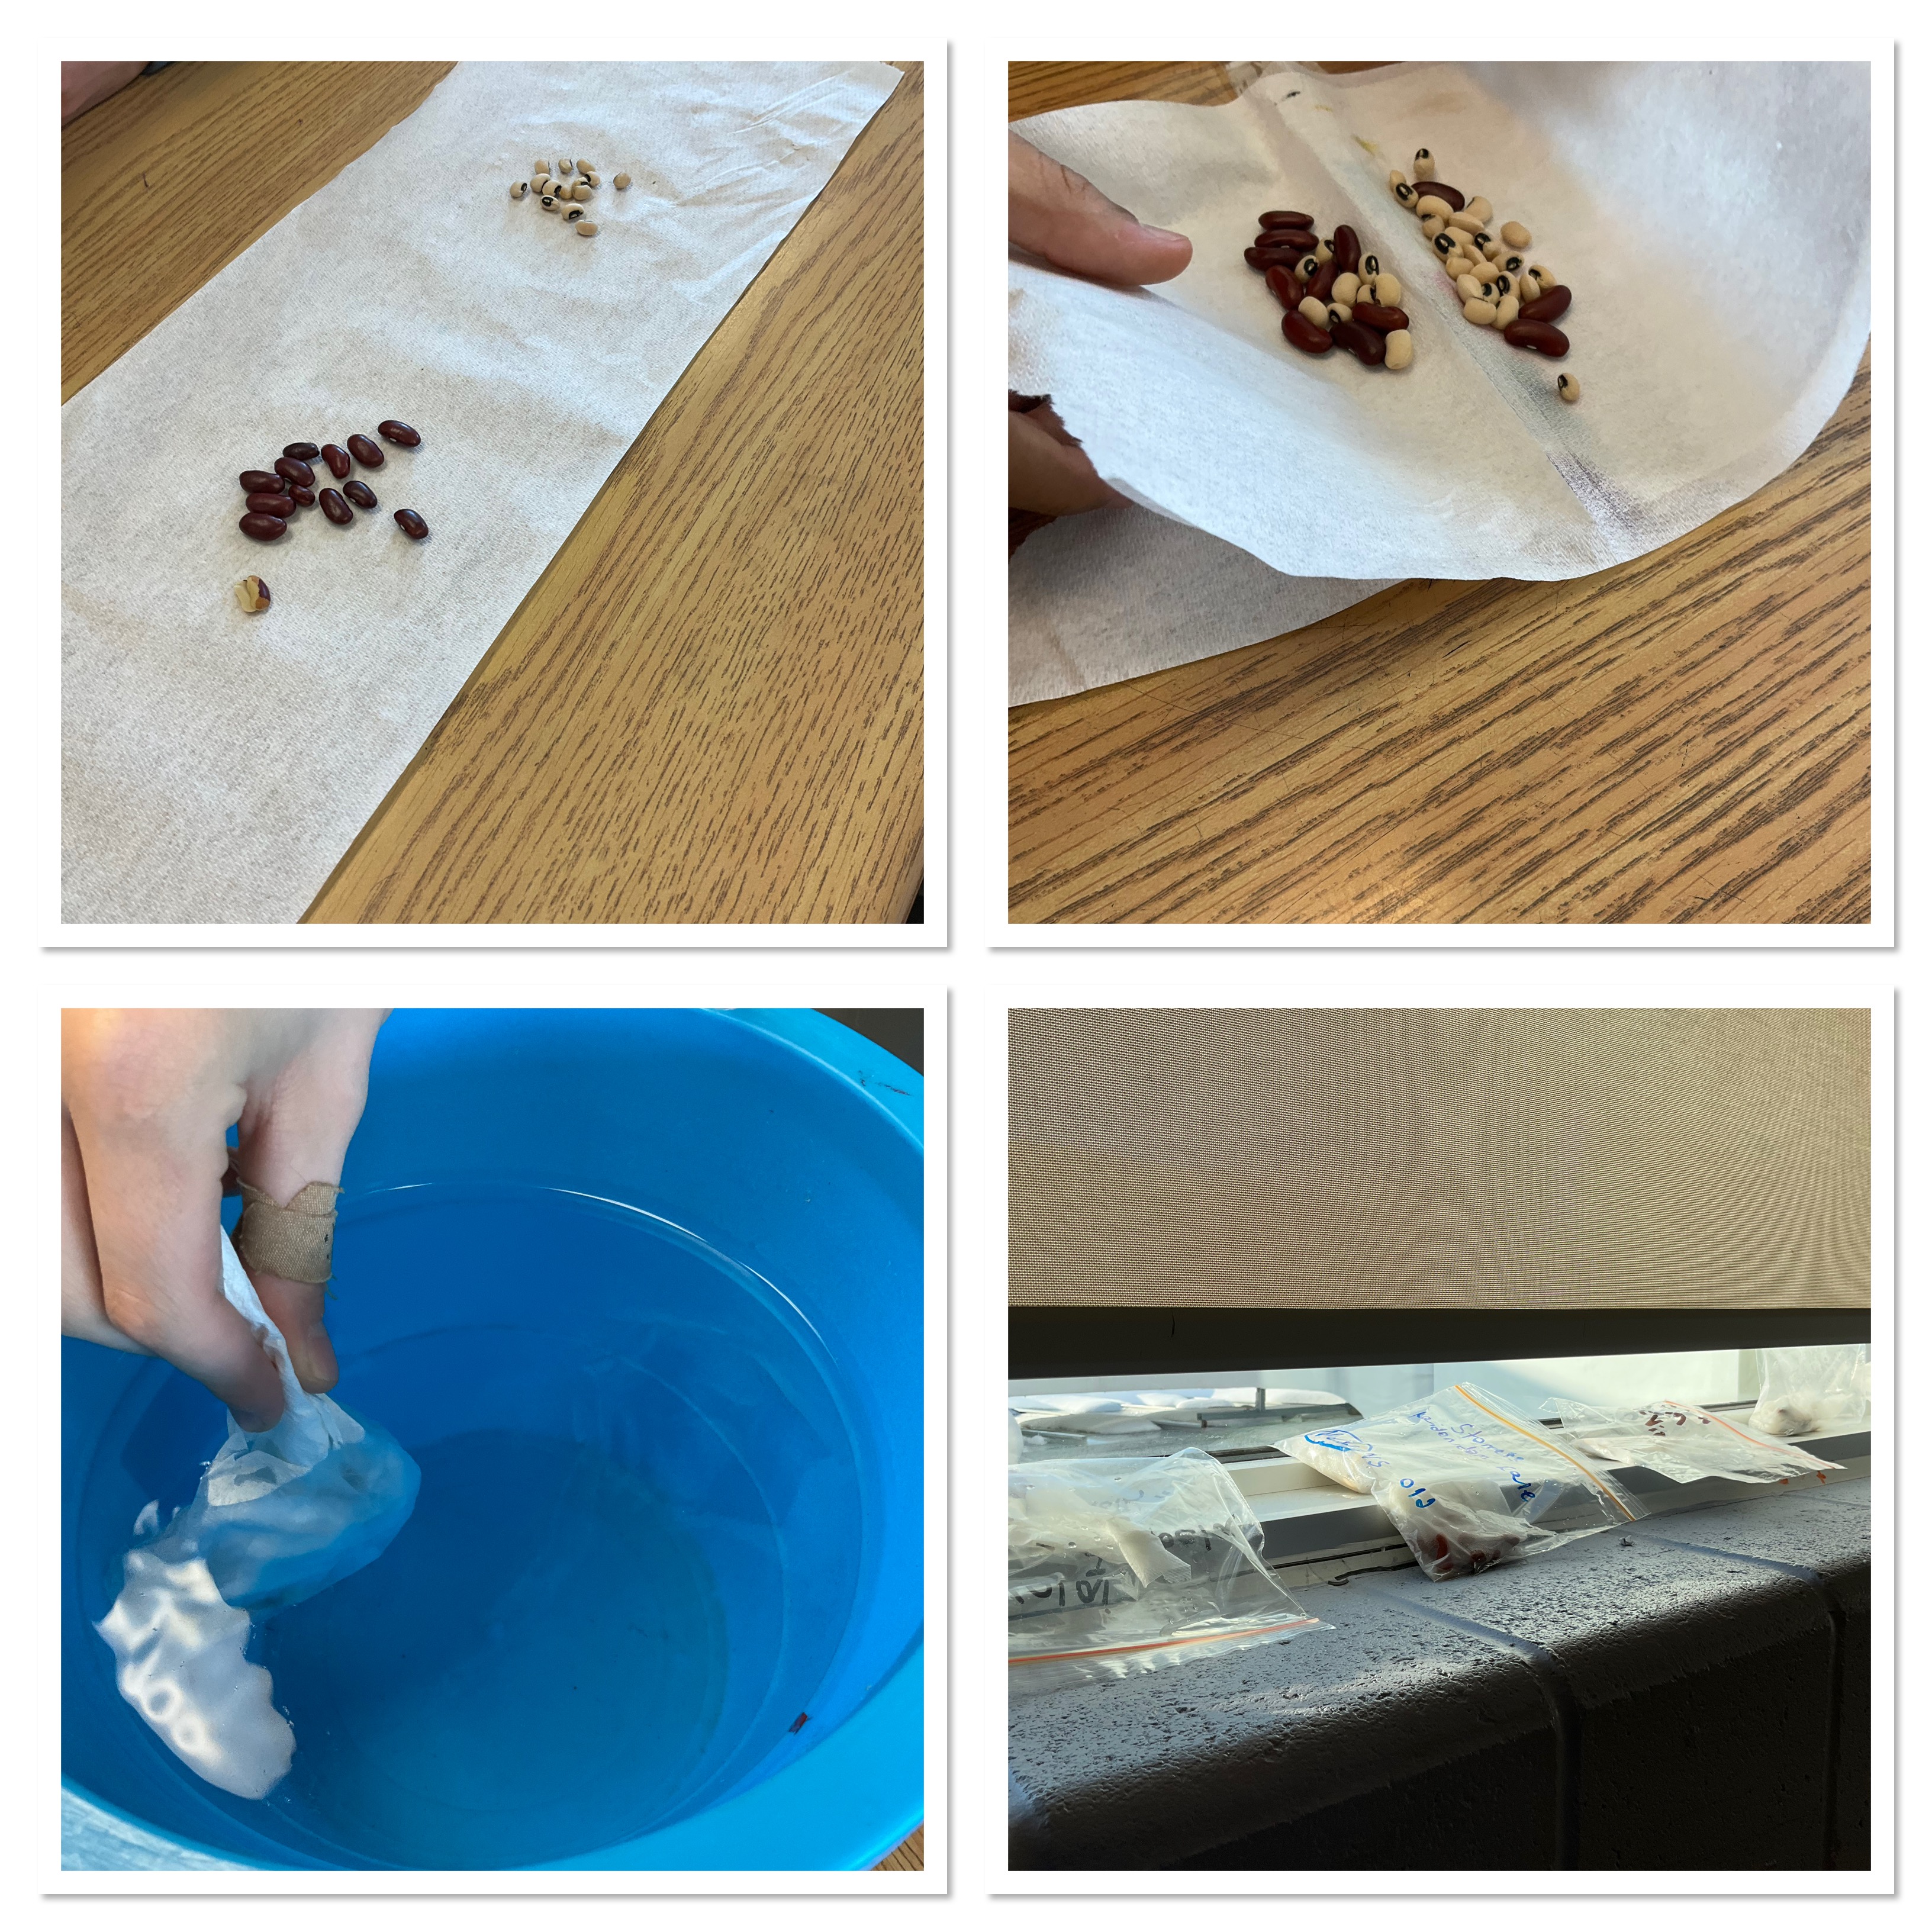
Each group of 3 students made a team name, and chose either old beans or new beans. We counted the beans, wrapped them in paper towel, dunked them in water and then put them in a baggie on the windowsill. We also estimated what fraction or percent of each type of bean will germinate. We will compare this to our actual results which we’ll explore next week. We’ll plant the beans and water them and measure them as they grow, and graph them and make some predictions. It’ll be great! Stay tuned for updates.
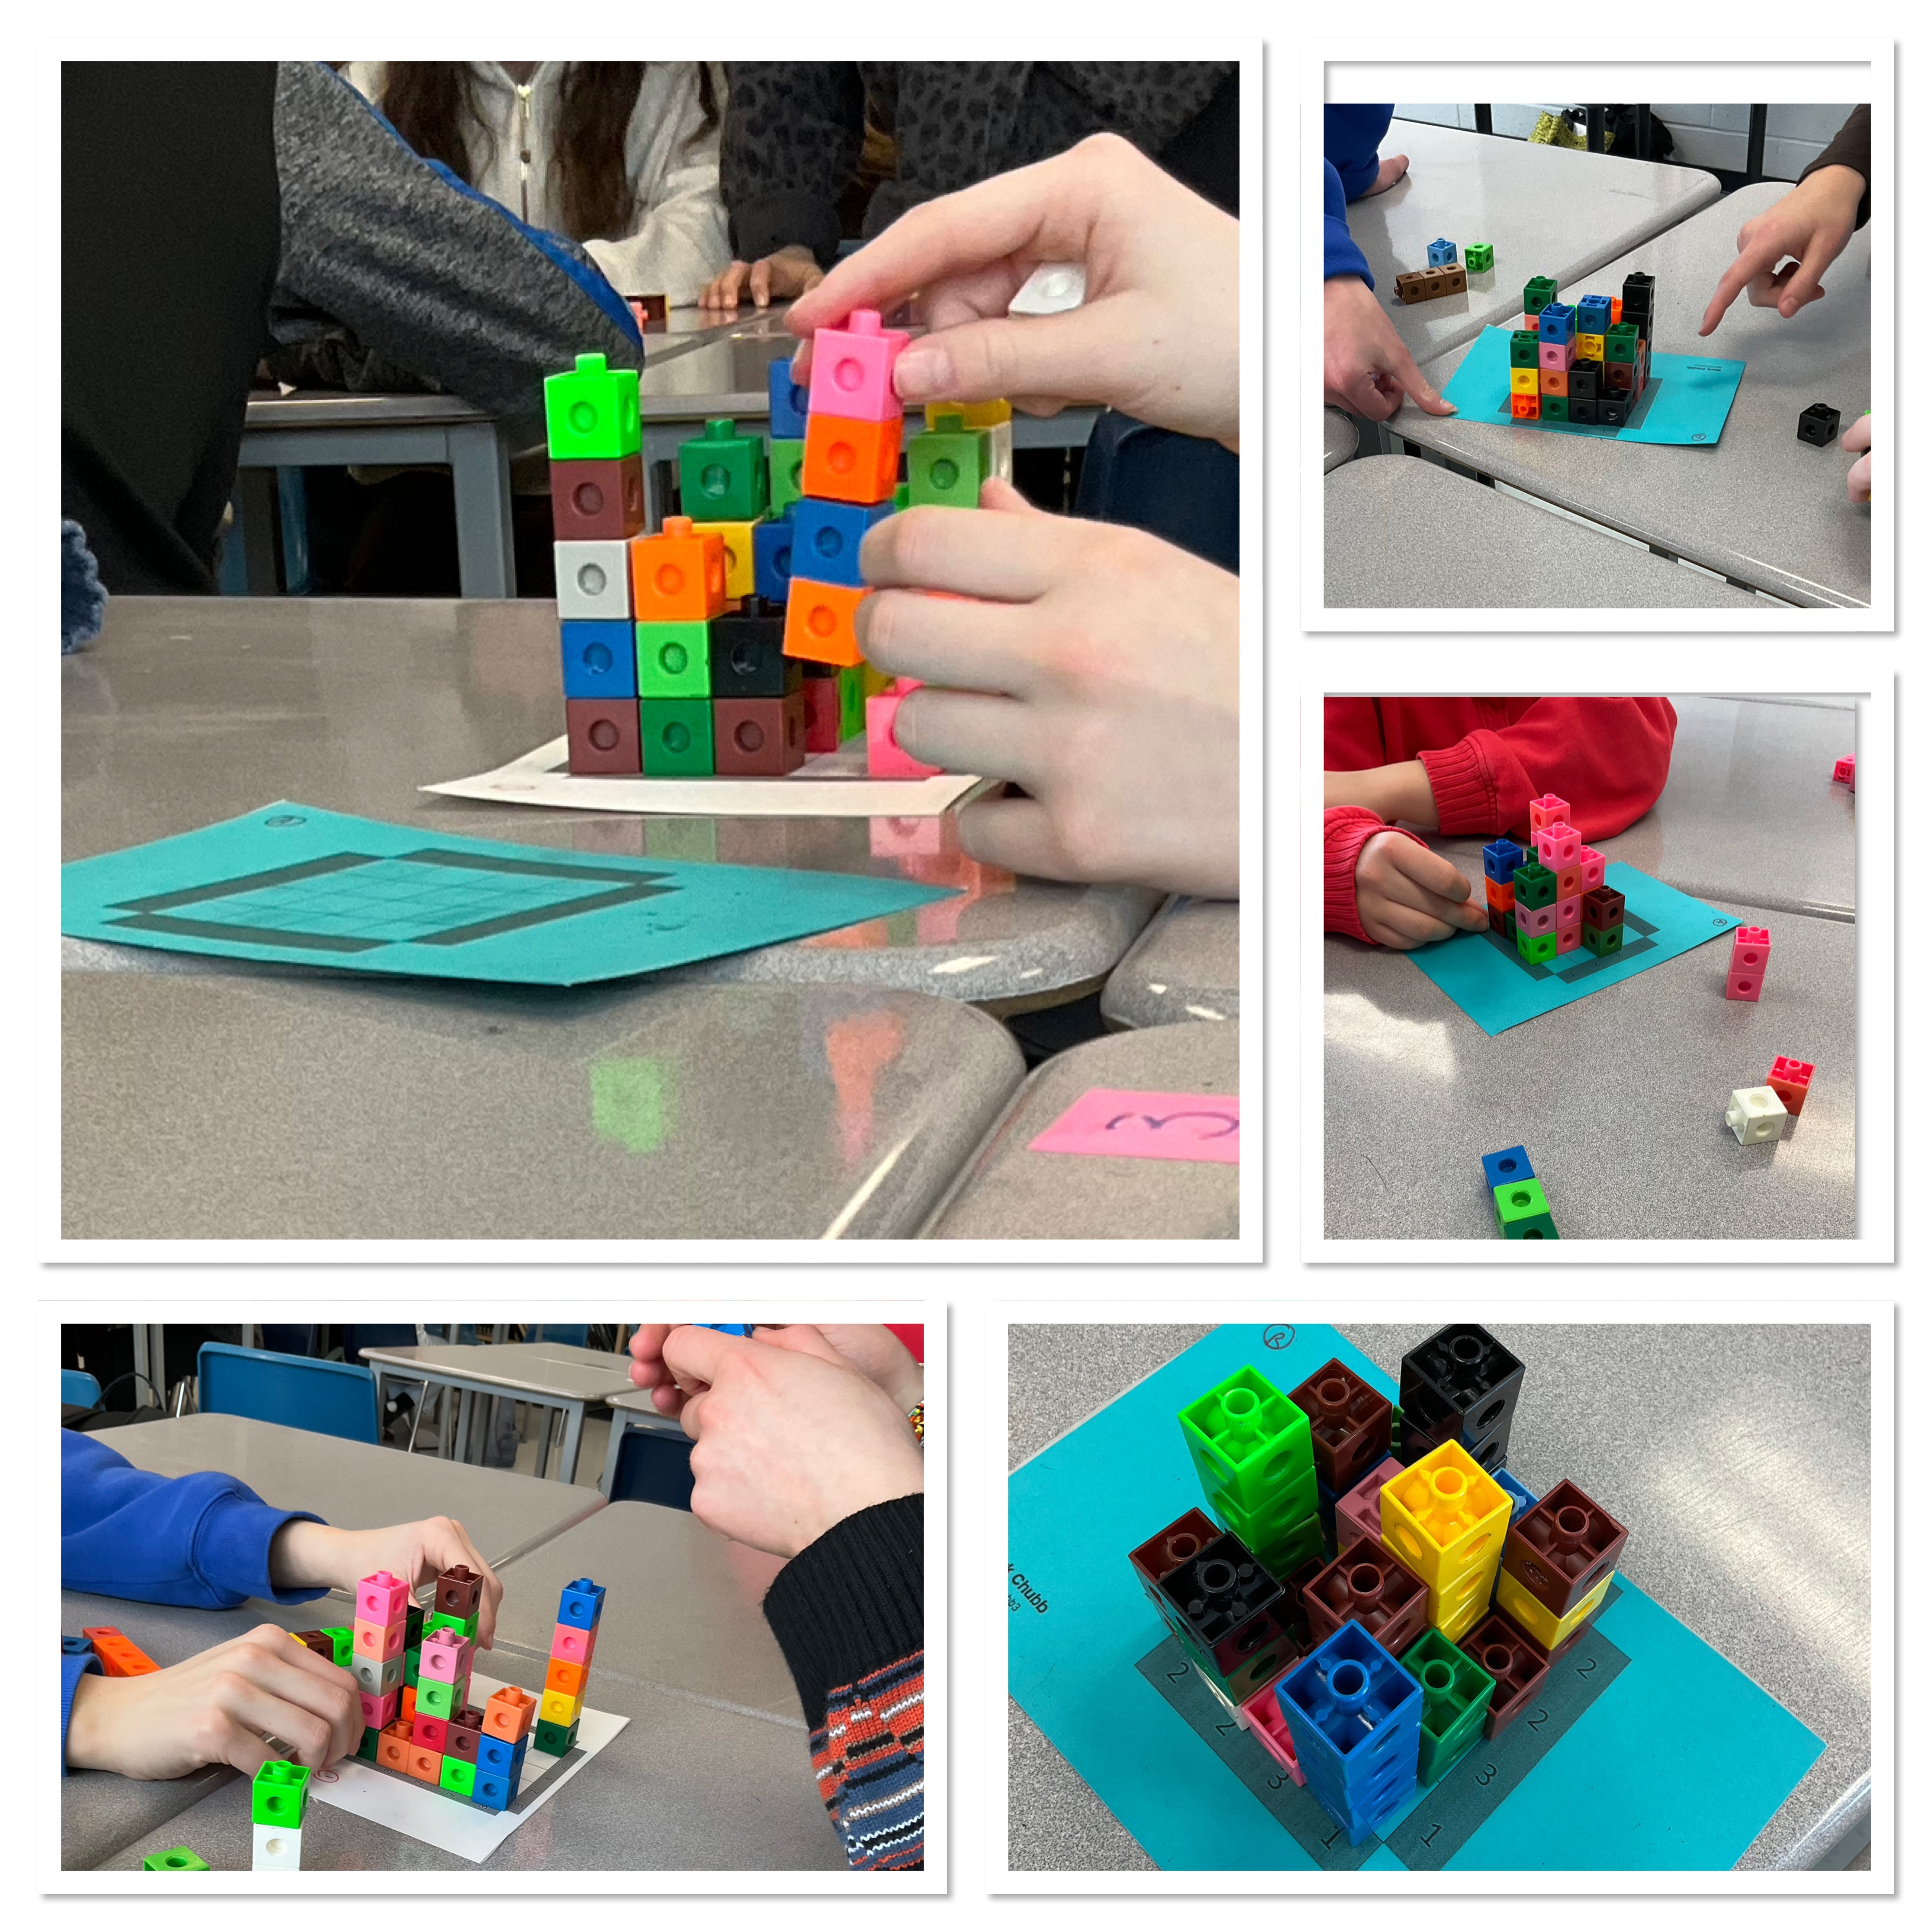
After starting our bean project we did some dot talks and explored the idea of multiplication as an array, or as a “groups of” model.
We next got out the base 10 blocks and worked on representing multiplication.
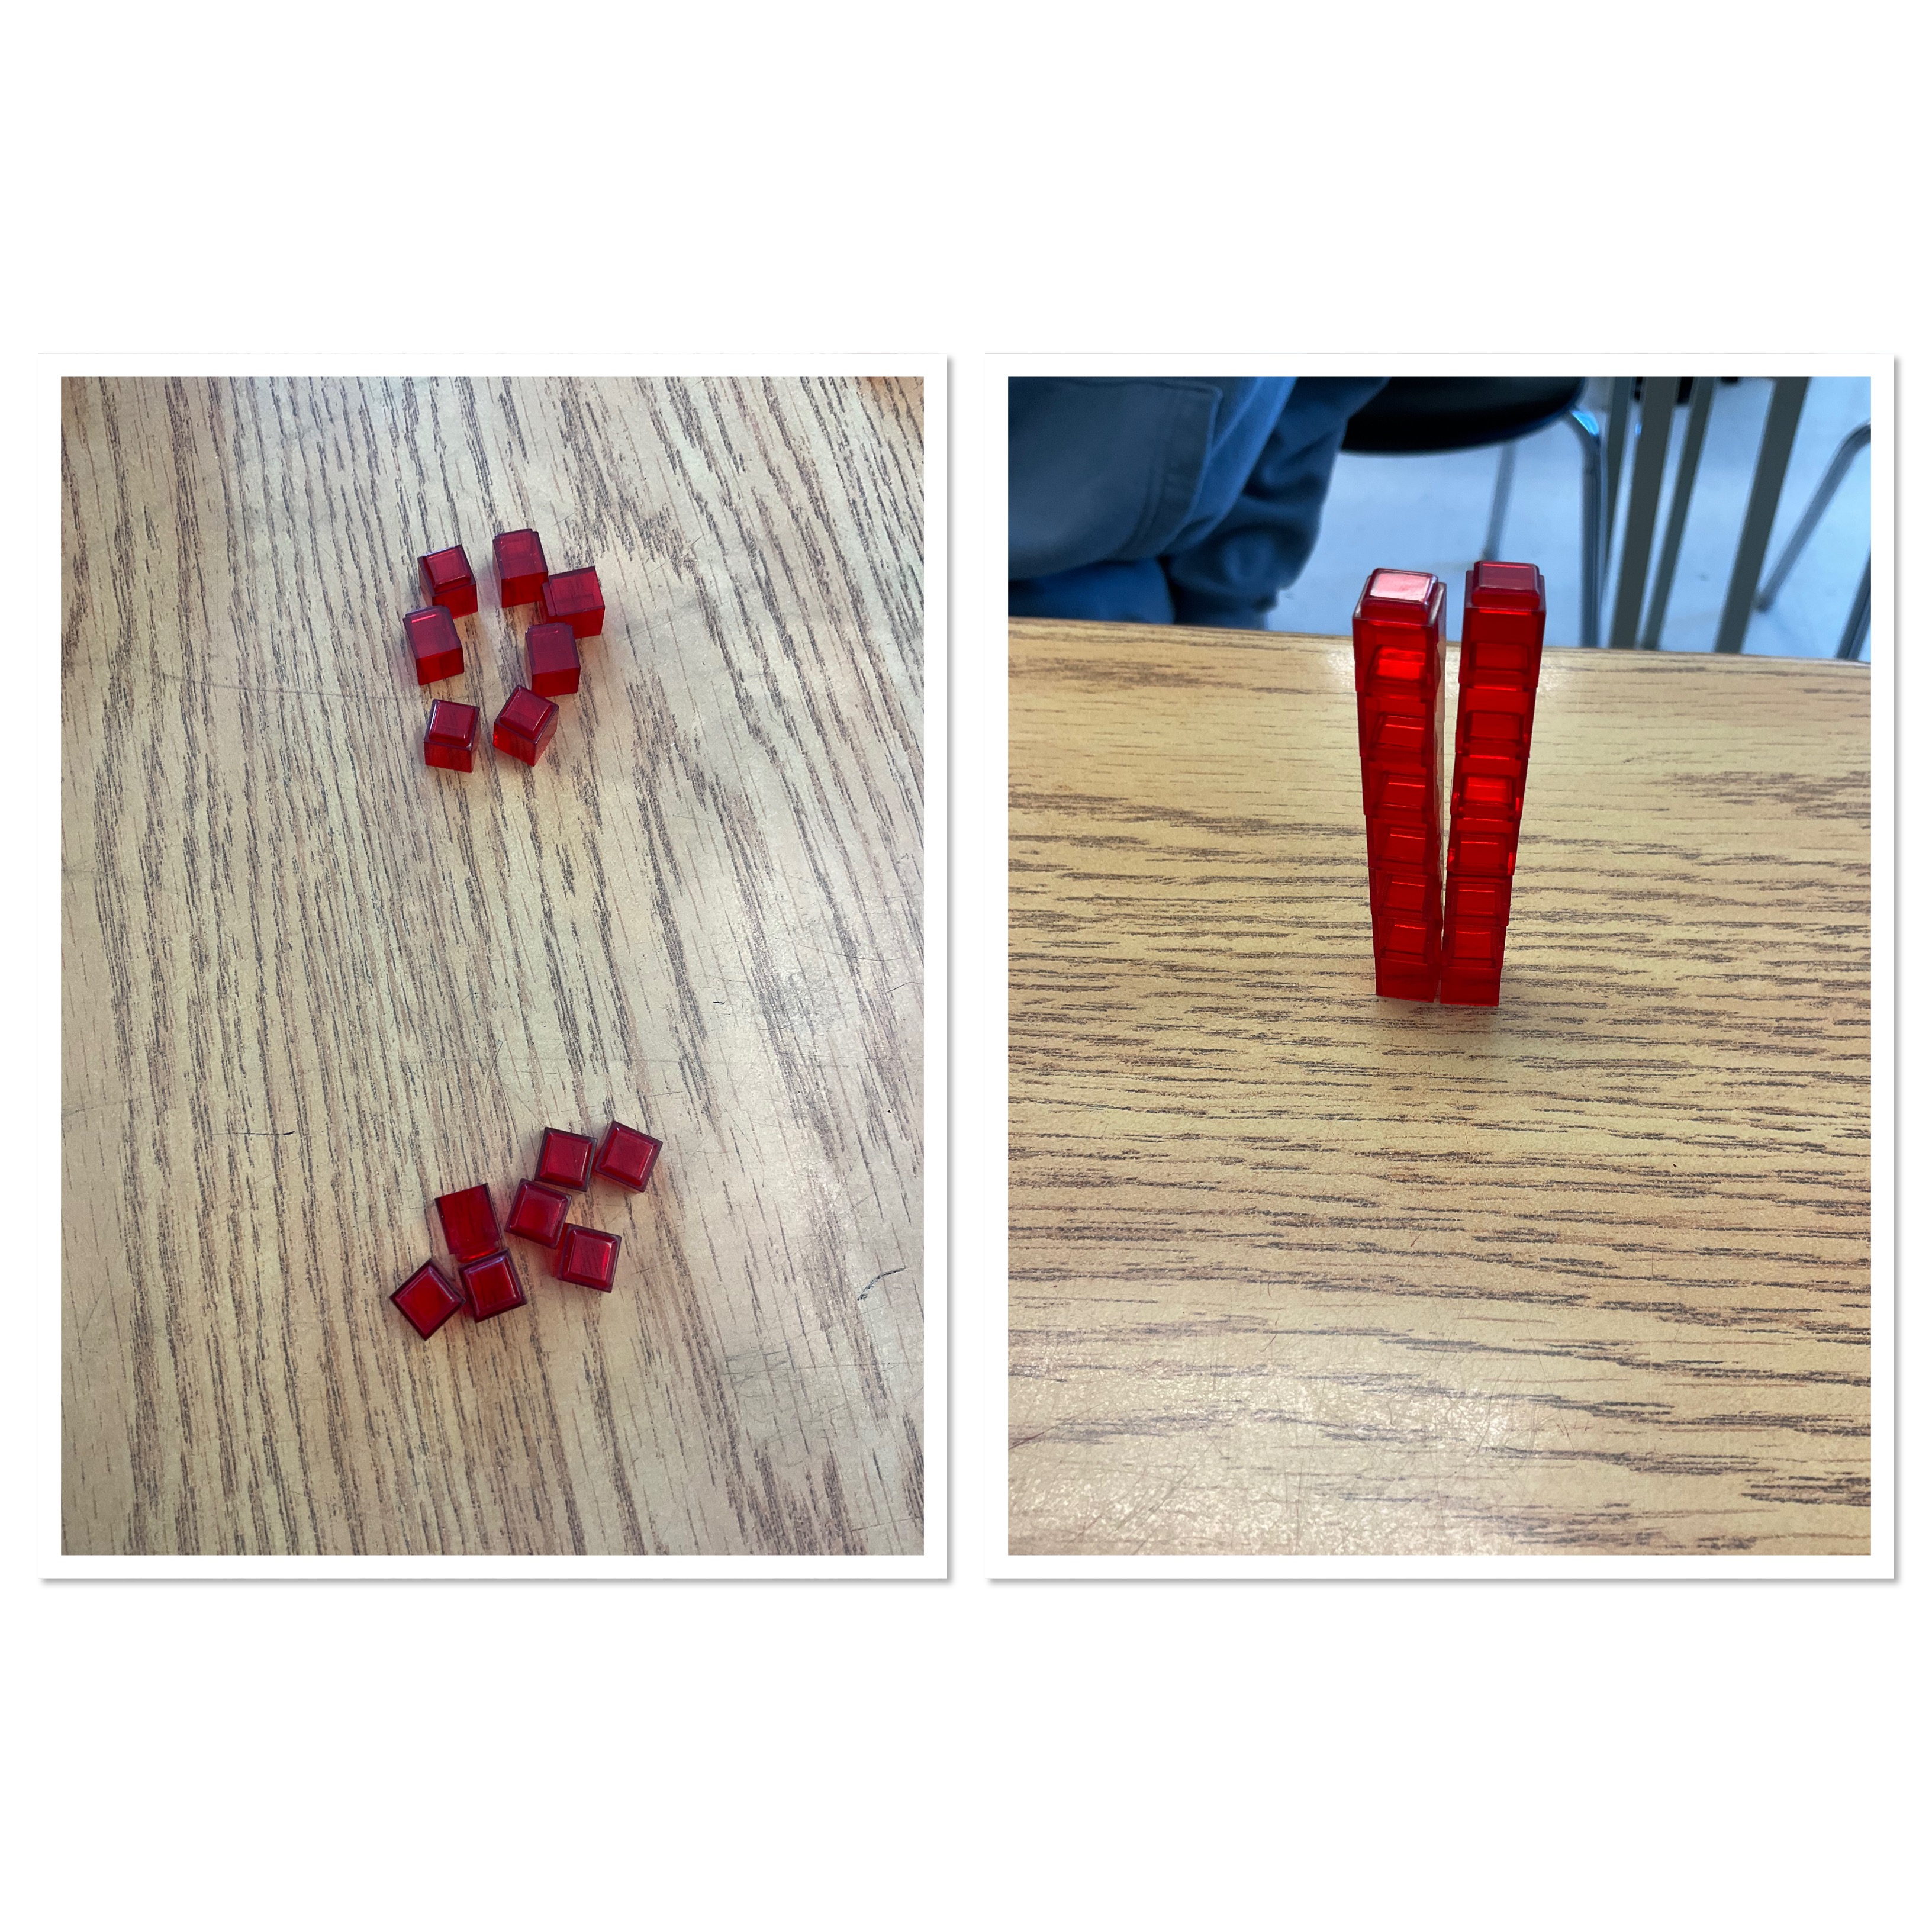
Here is 2×7 as 2 groups of 7 or a 2×7 array.
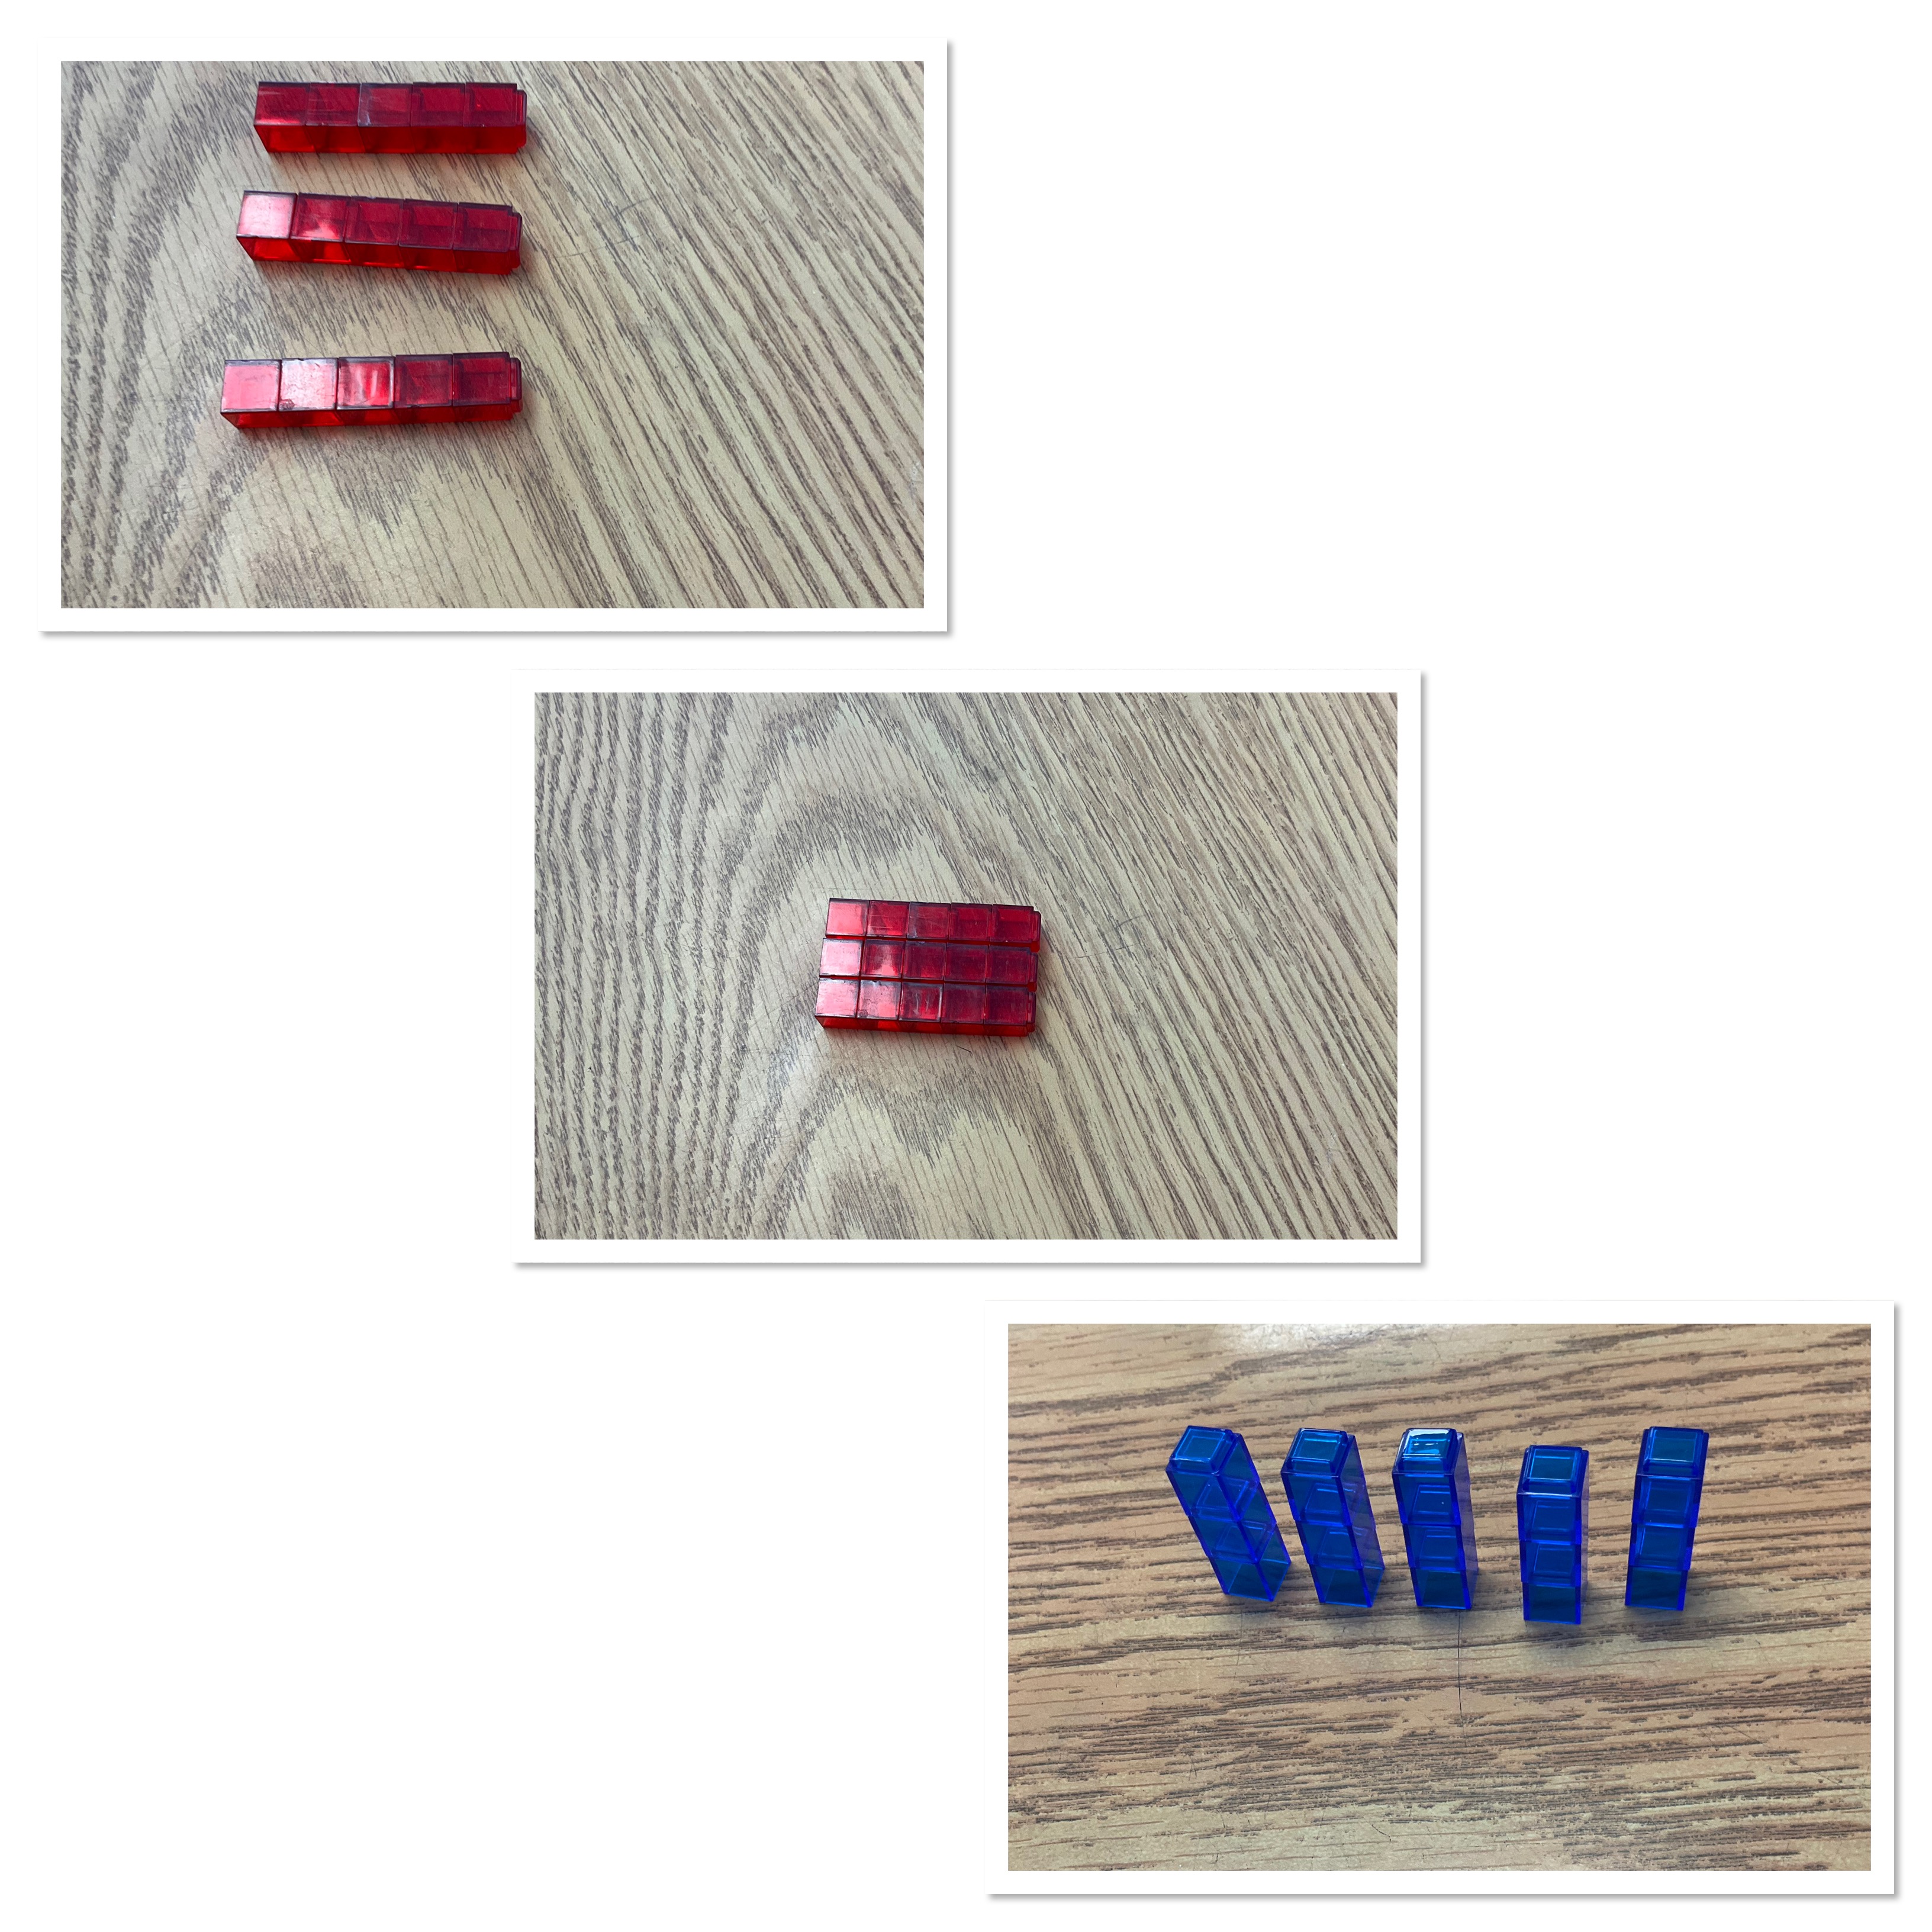
Above we did 3×5 as 3 groups of 5, 5 groups of 3, or an array that is 3×5.
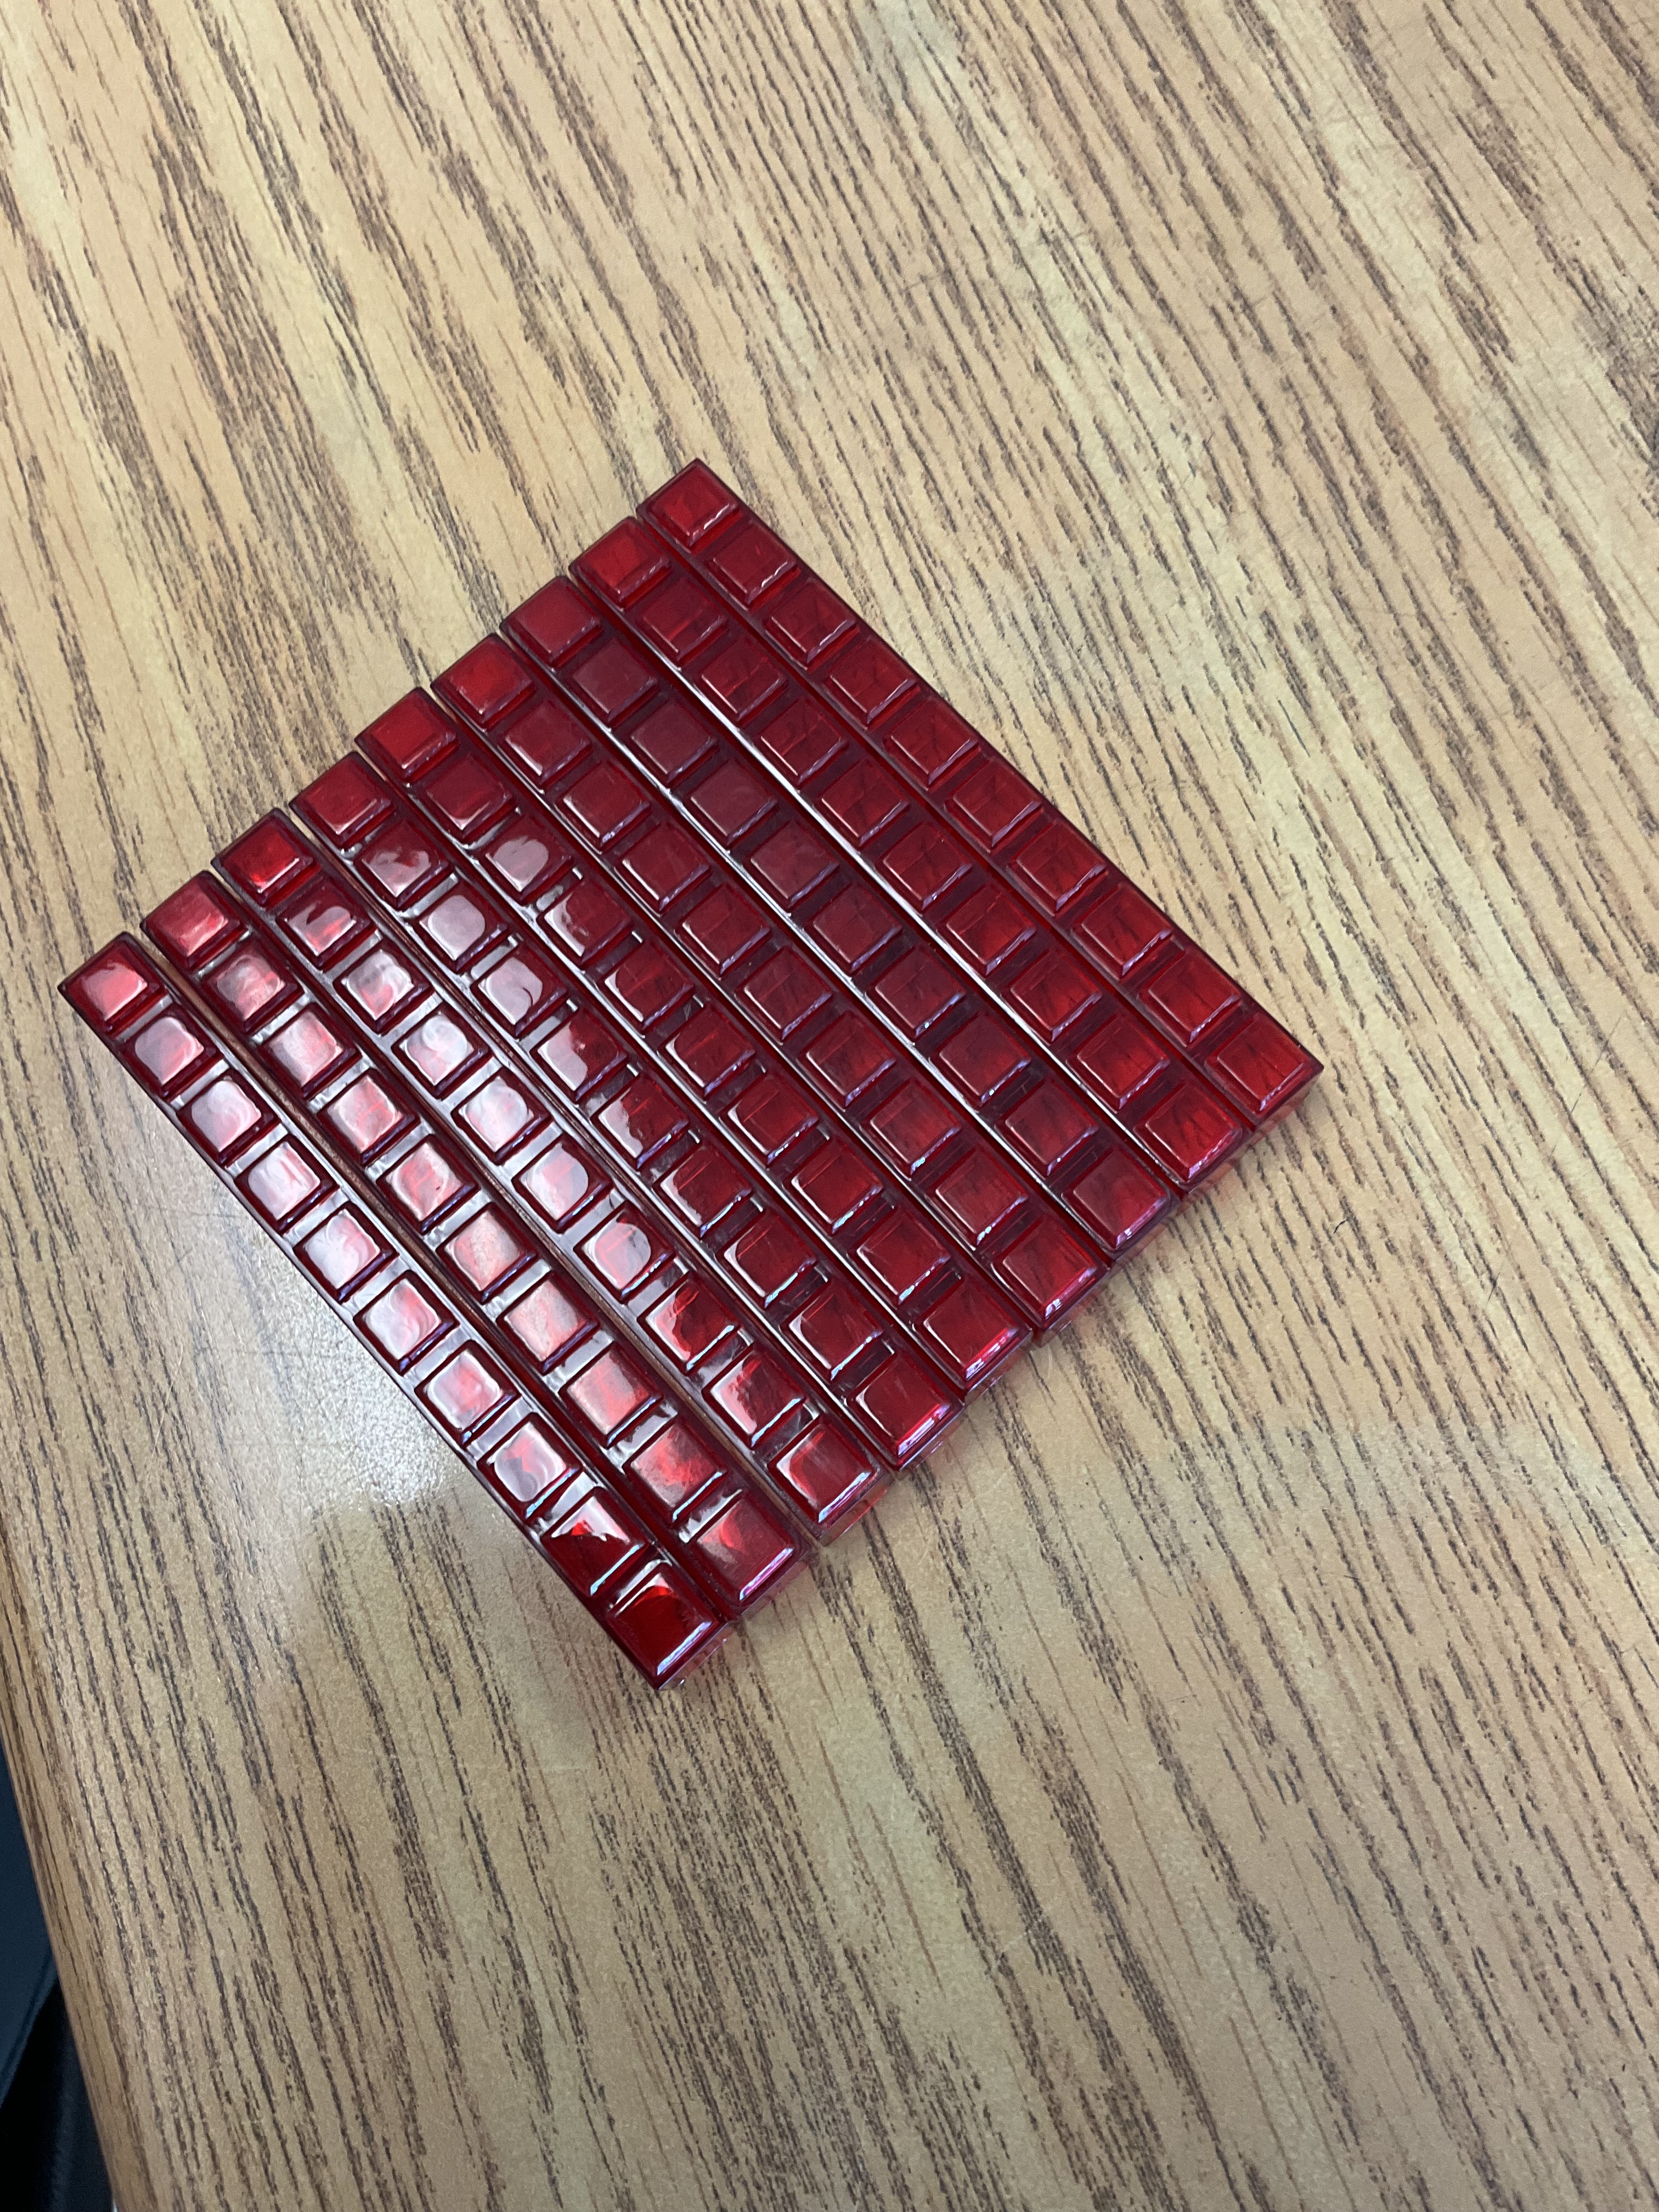
Here is 9×10, not quite a square.
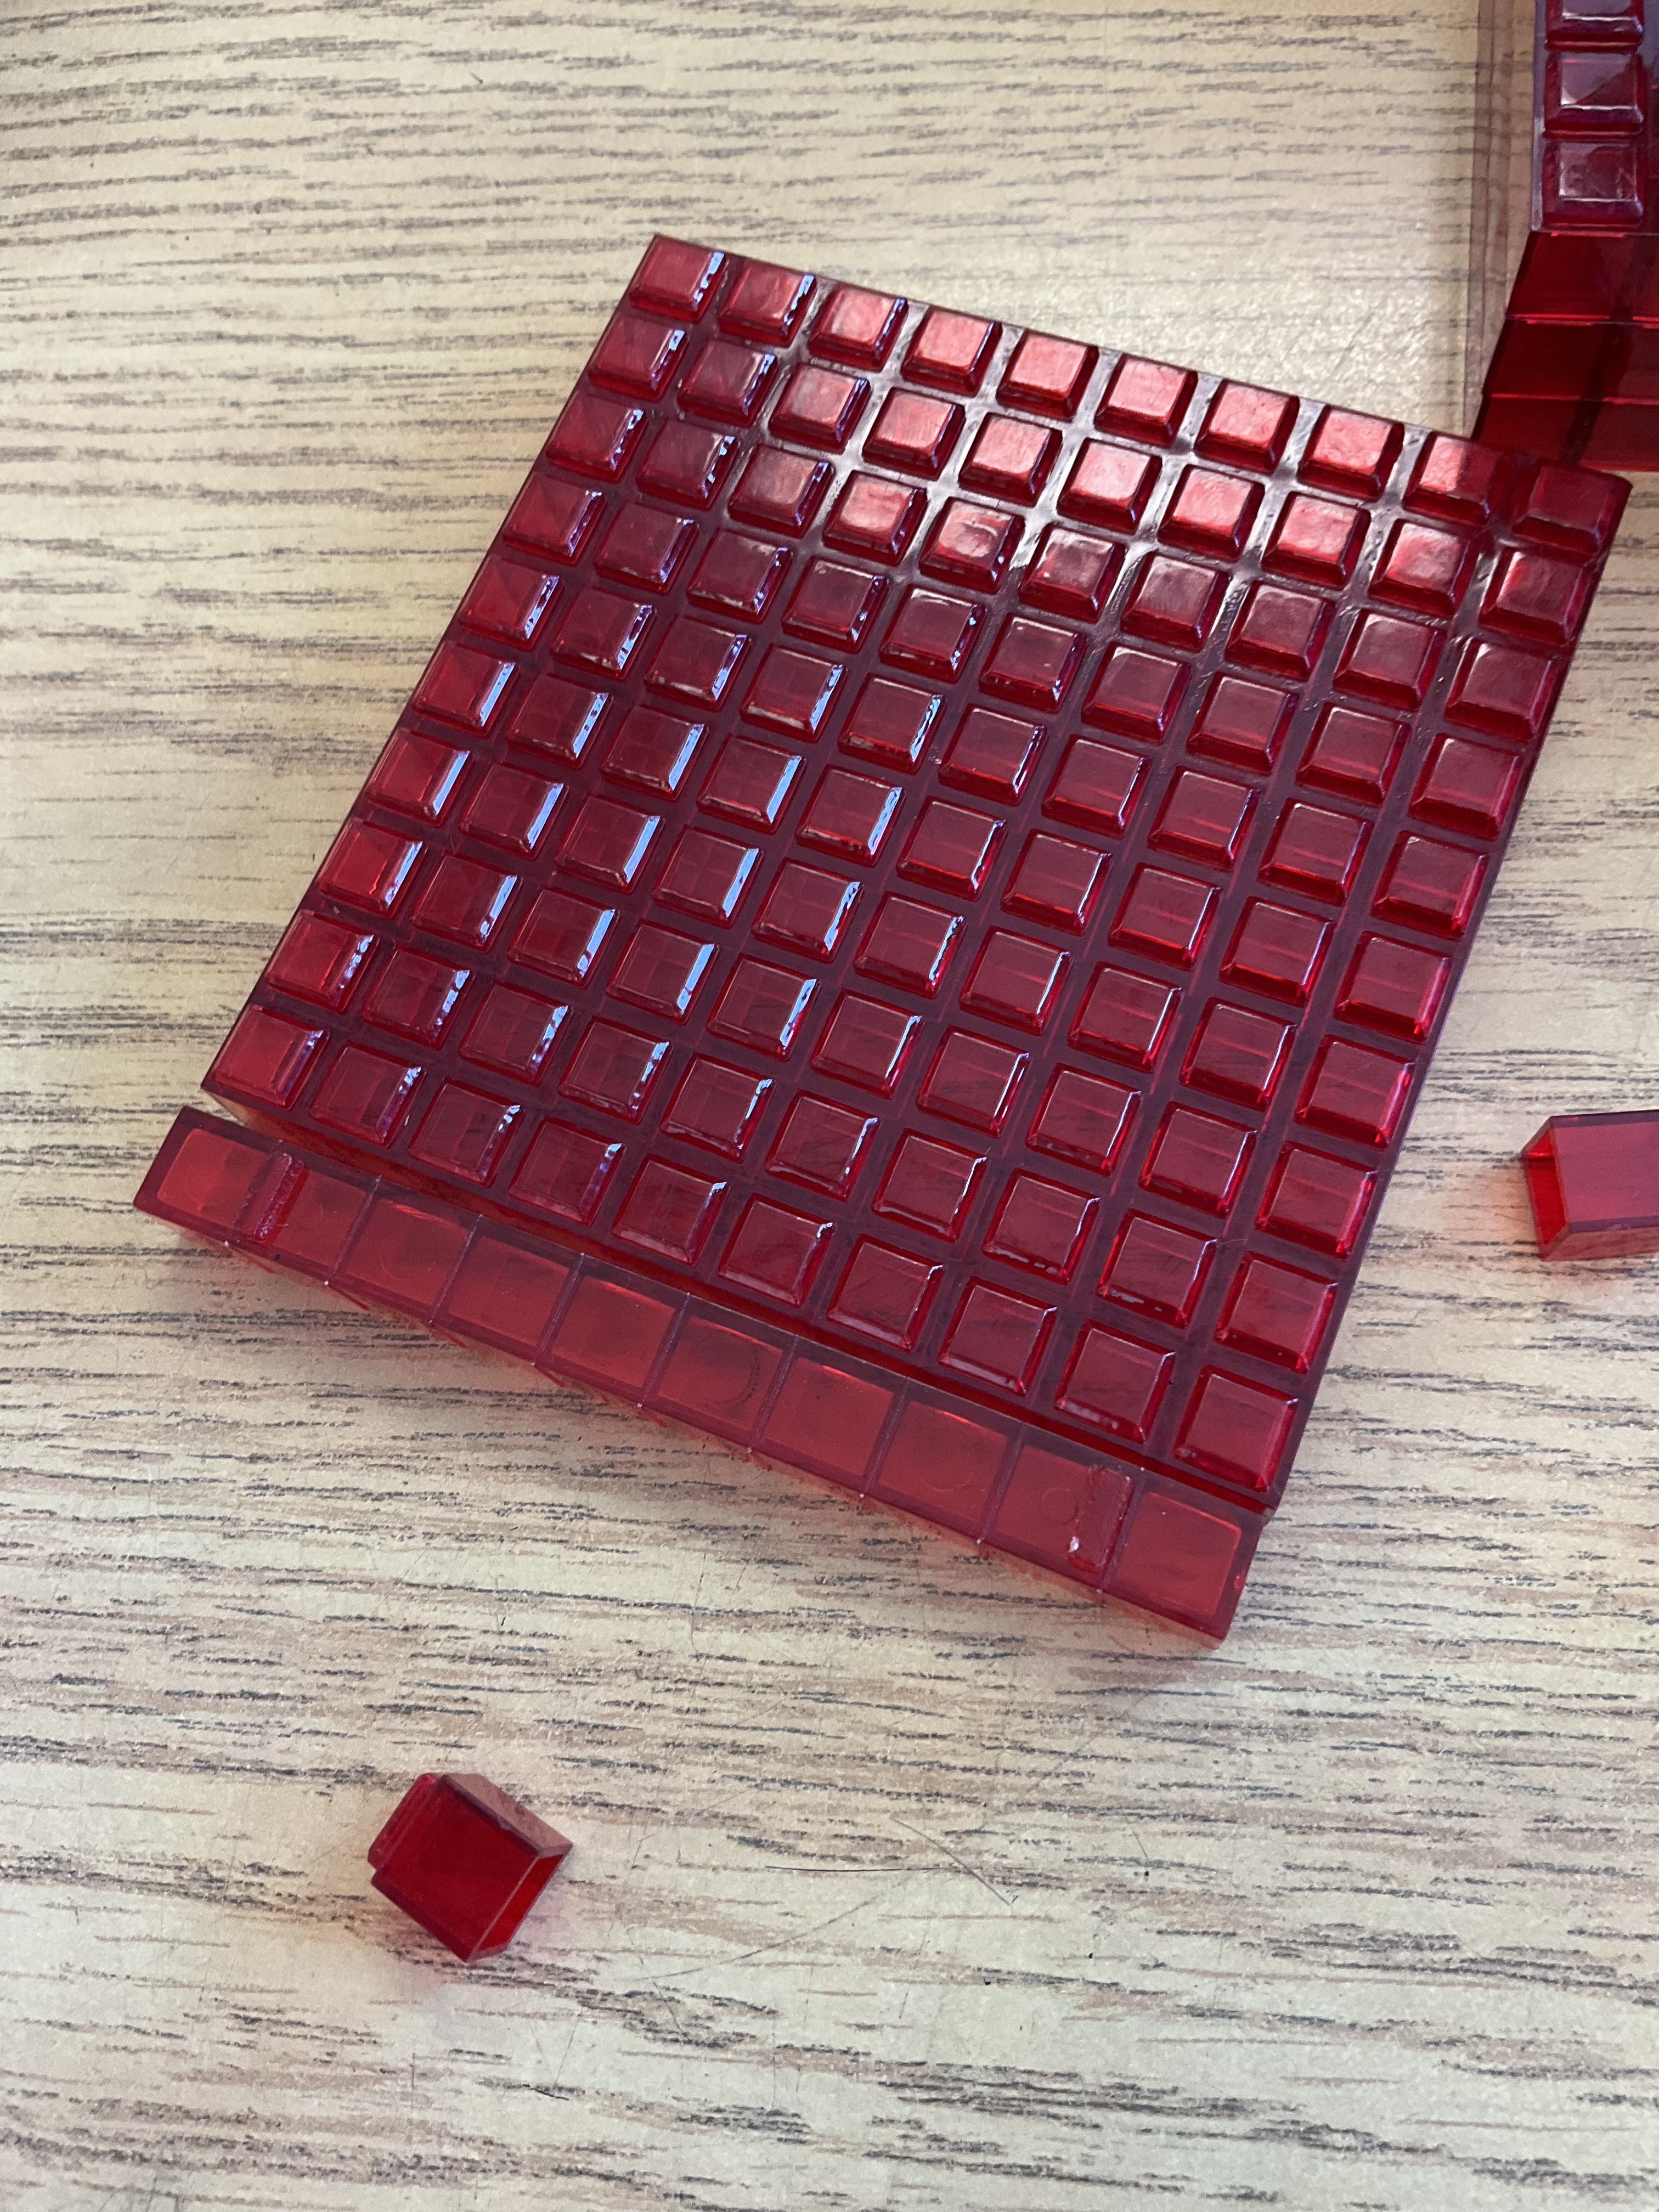
Here is 10x11done with a 10×10 and 1 bar of 10.
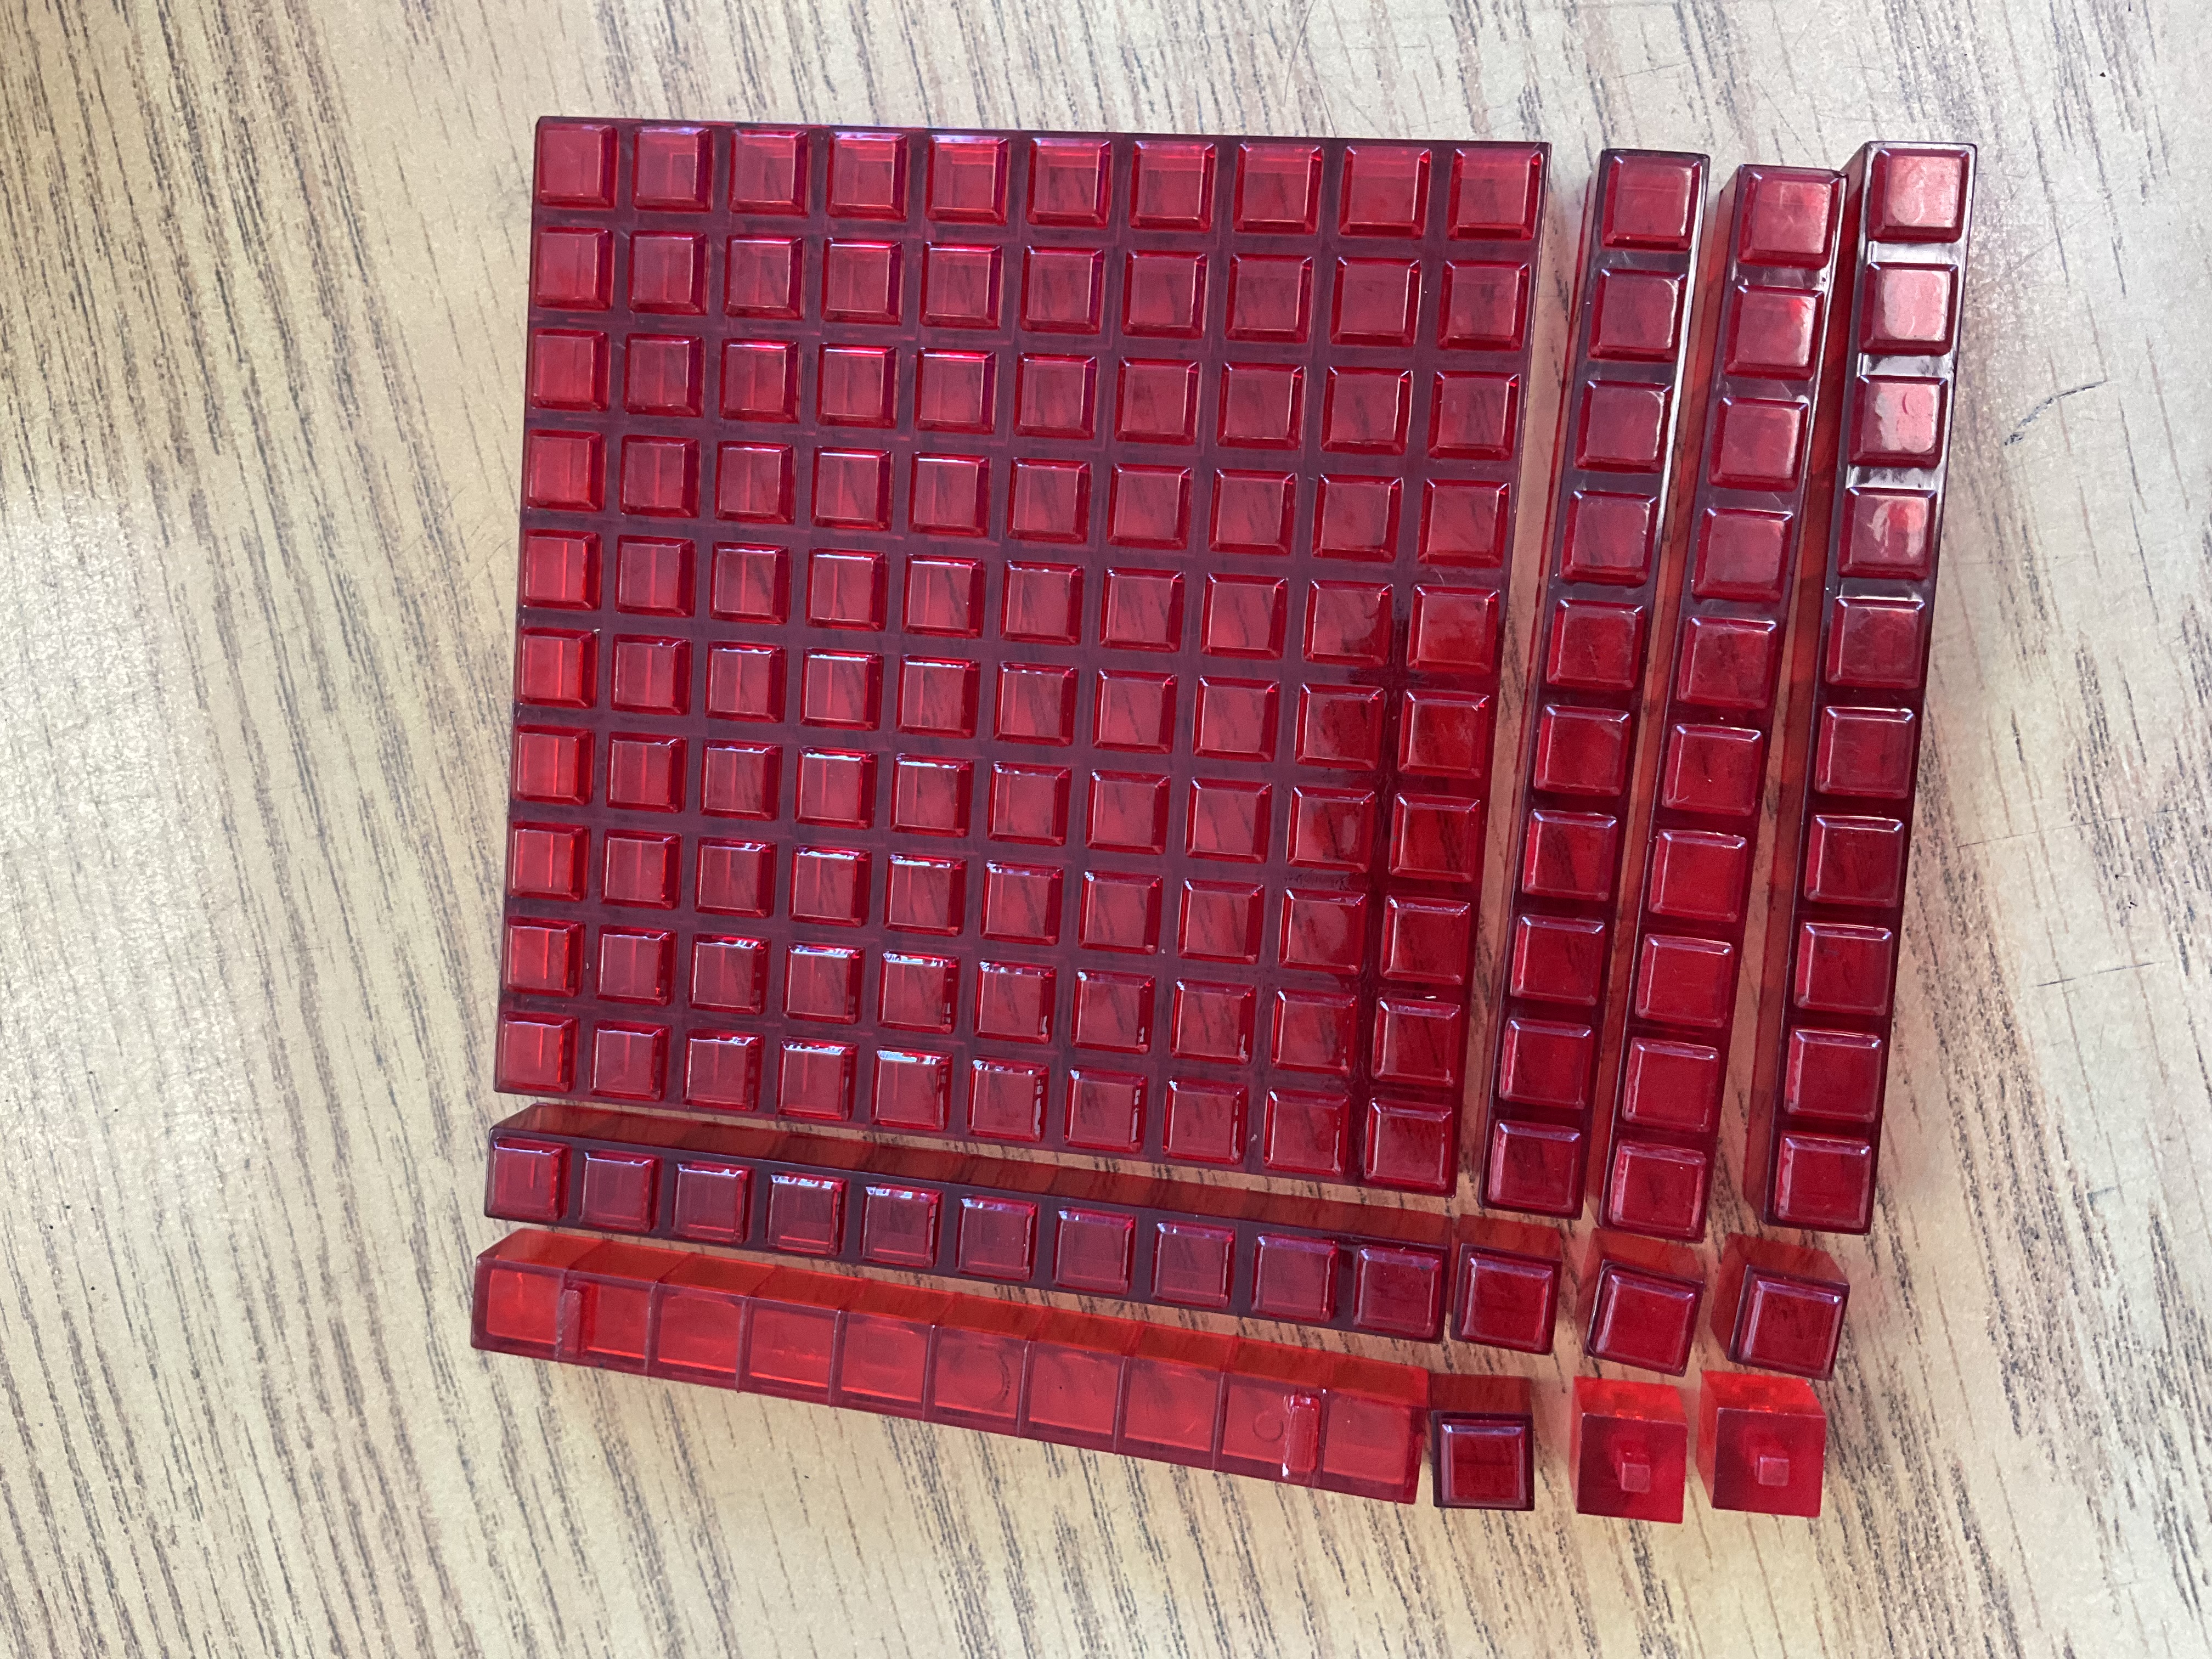
Here’s 12×13, we can see it as a width of (10+3) and a length of (10+2). We can count this as 100+30+20+6 which is 156. Area models are so important. It was nice to practice with manipulatives.
Welcome to grade 9
We started off the term with skyscraper puzzles.
In random groups of 4 or 5 we worked on solving these puzzles. Each row and column contain a skyscraper of height 1,2,3,4. Also, each edge has a number which indicates how many buildings are visible from that point of view. After a few false starts we were all on task and striving to complete the puzzles.
Some groups even mastered a 5×5 puzzle!

We debriefed the task together talking about how important it is to work as a team to solve these puzzles because each person has their own perspective and can see different information from each position around the puzzle board.
We also talked about perseverance and how to keep working even when frustrated. We talked about strategies to manage our emotions, like taking a break, taking a breath, getting some water, looking from a new direction, doing some pushups, asking a friend or working together with someone who knows more. All of these skills are very transferrable to math problems, where we need to lean in and enjoy the productive struggle.
We are off to a great start in grade 9!
Welcome to Grade 11
Today was the start of semester 2, and we hit the ground running in grade 11. We’re sitting in random groups, and working at the walls in smaller random groups.
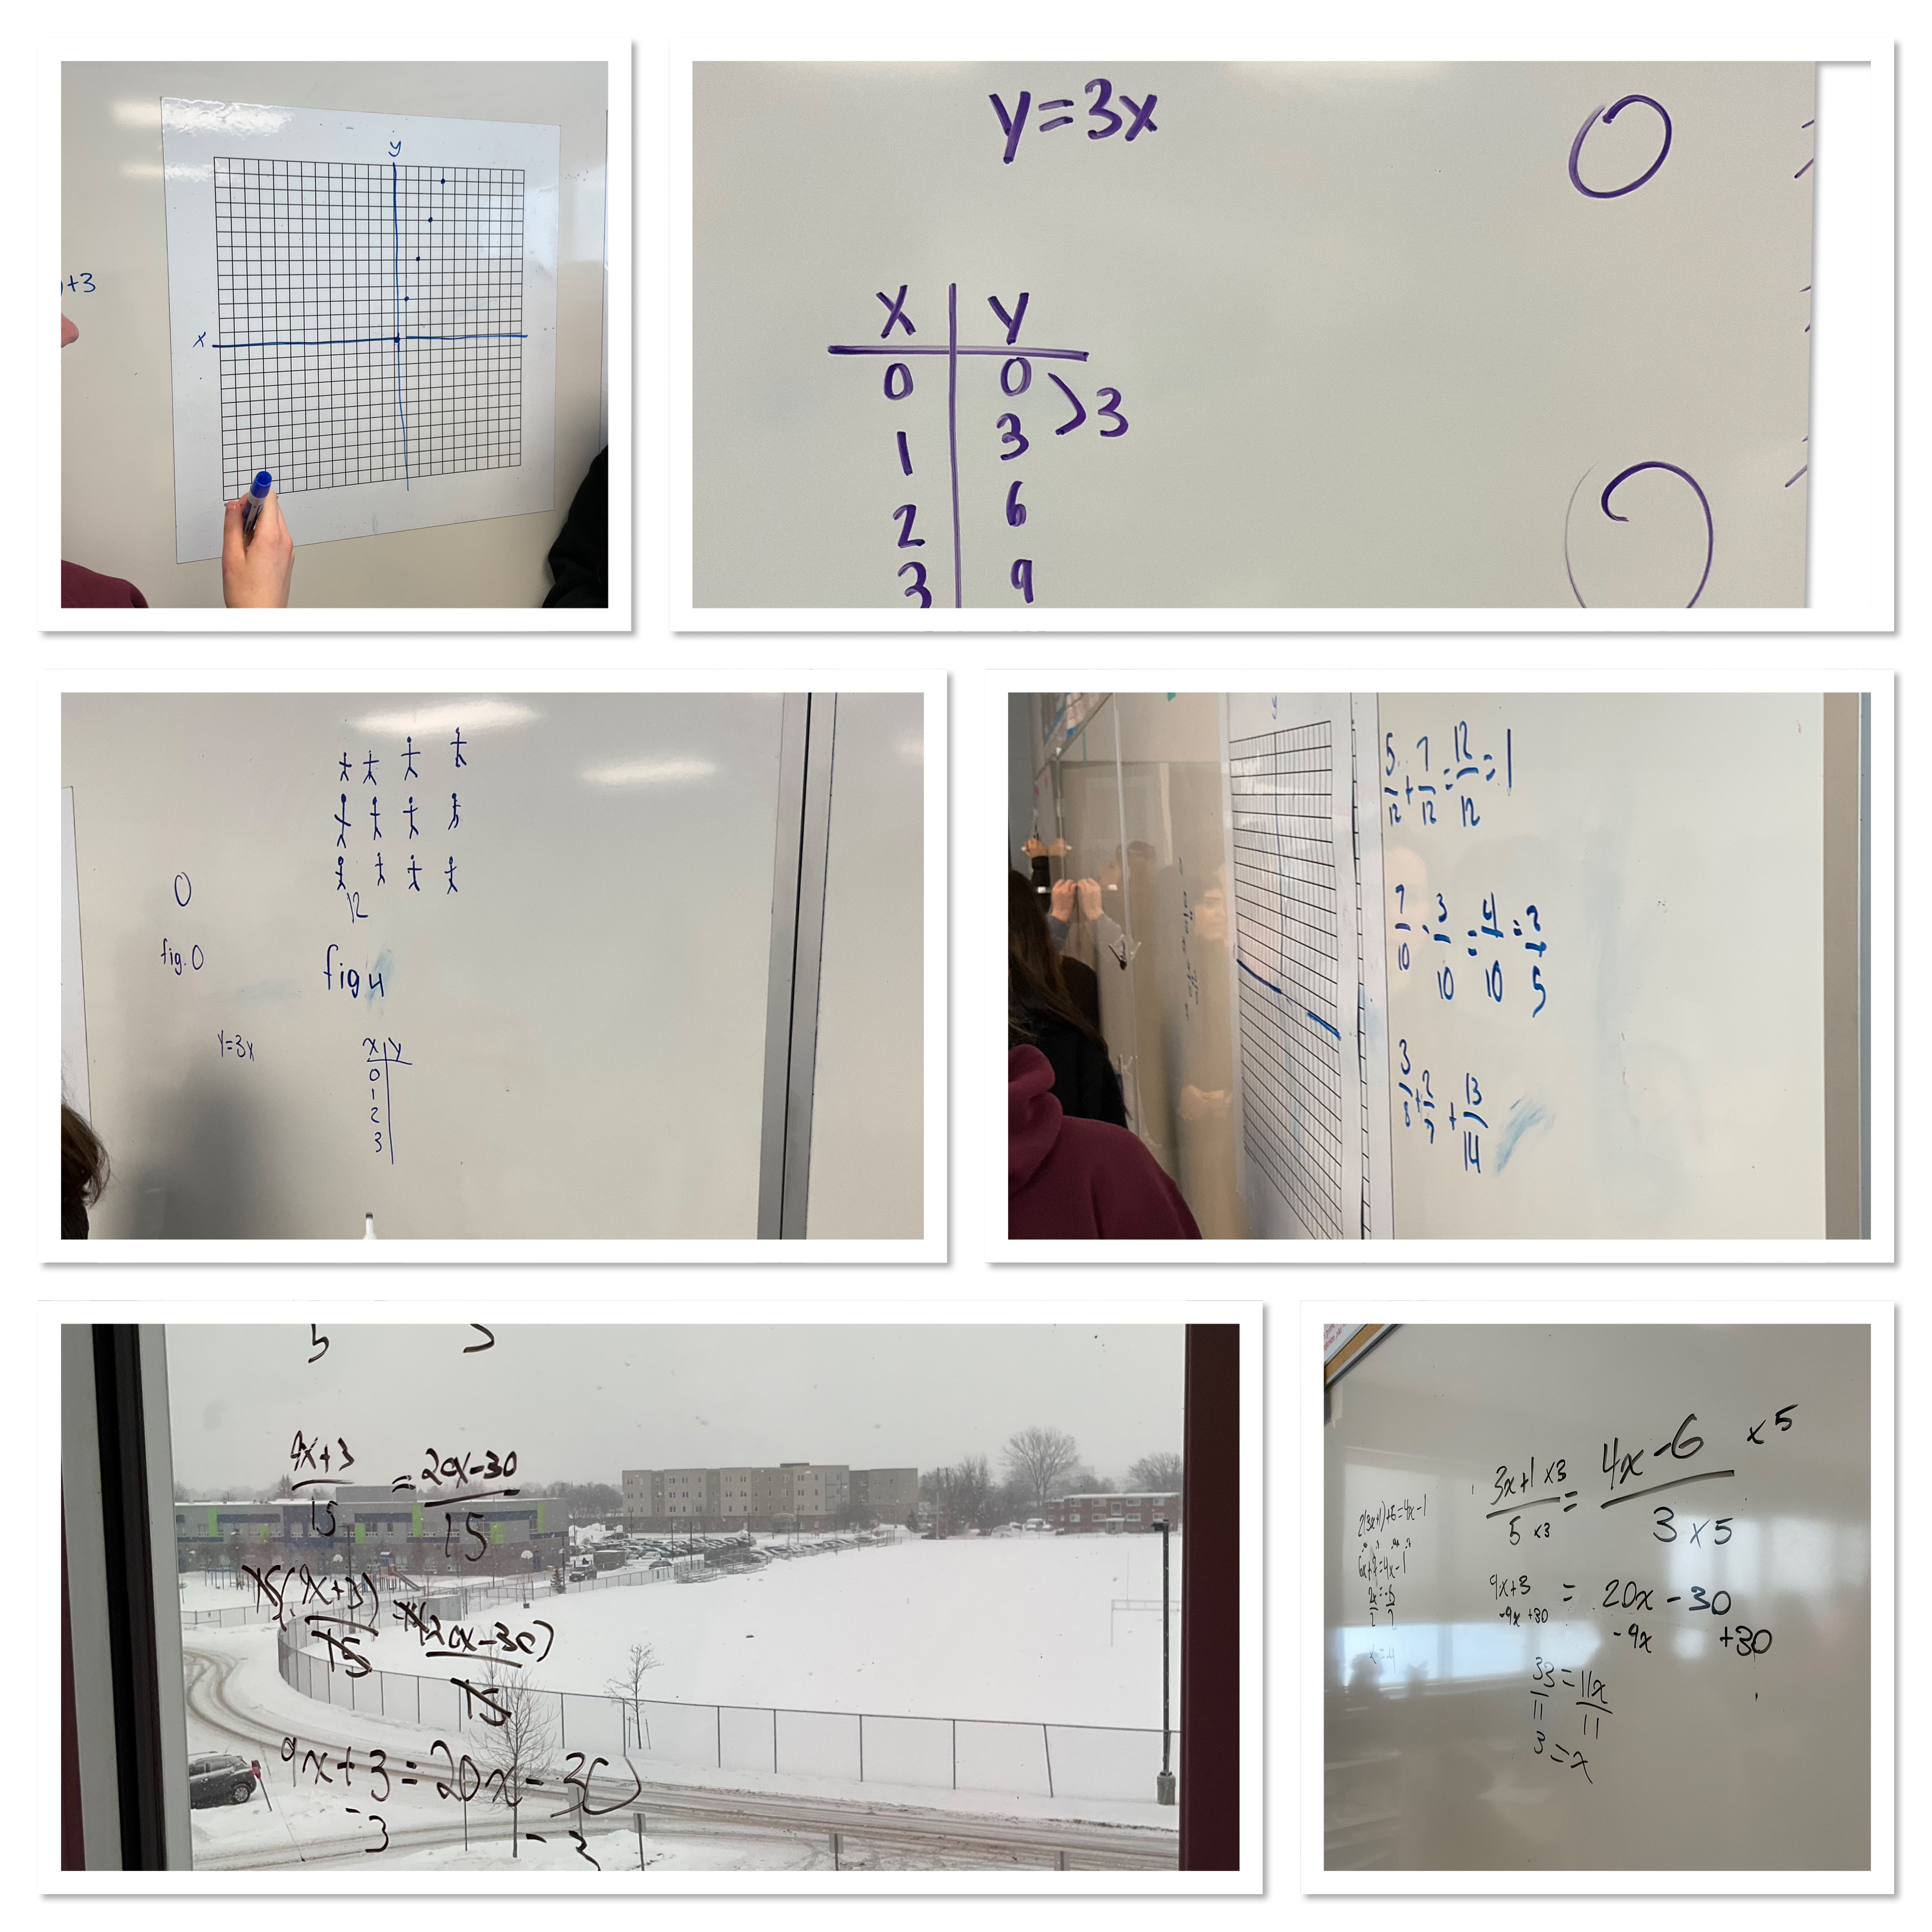
Today the goal was to review grade 9 and 10 math. We did some work on fractions, prime factoring, patterning and modelling relations with tables, equations and graphs. We saw the very first function notation to calculate figure 10, or f(10) for each equation. We also practiced adding and subtracting polynomials, and solving equations with and without fractions.
We have such a big class we’re working on walls AND windows! It was an impressive start to the term, shaking off the cobwebs and working on our collaboration. Looking forward to a great semester together.
Pathways P.D.
A colleague joined me to do a math professional development session at Pathways to Education for their staff and volunteers.
We used concept circles to explore base 10 blocks and saw how to use them to practice place value and integers.
We worked on multiplication, like 6×23 and how to represent that as 6 groups of 23 (an additive approach) and also how those 6 groups can be made into a rectangle with length 23 and width 6. The area is the product. We can then visually split up the area model into 6×20=120 and 6×3=18 so 6×23=138.
We looked at algebra tiles and how we can represent multiplication with the area model using tiles, and also how to simplify and add polynomials. Finally we used tiles to solve equations.
I hope we’ll do more sessions over the term to build on these skills.
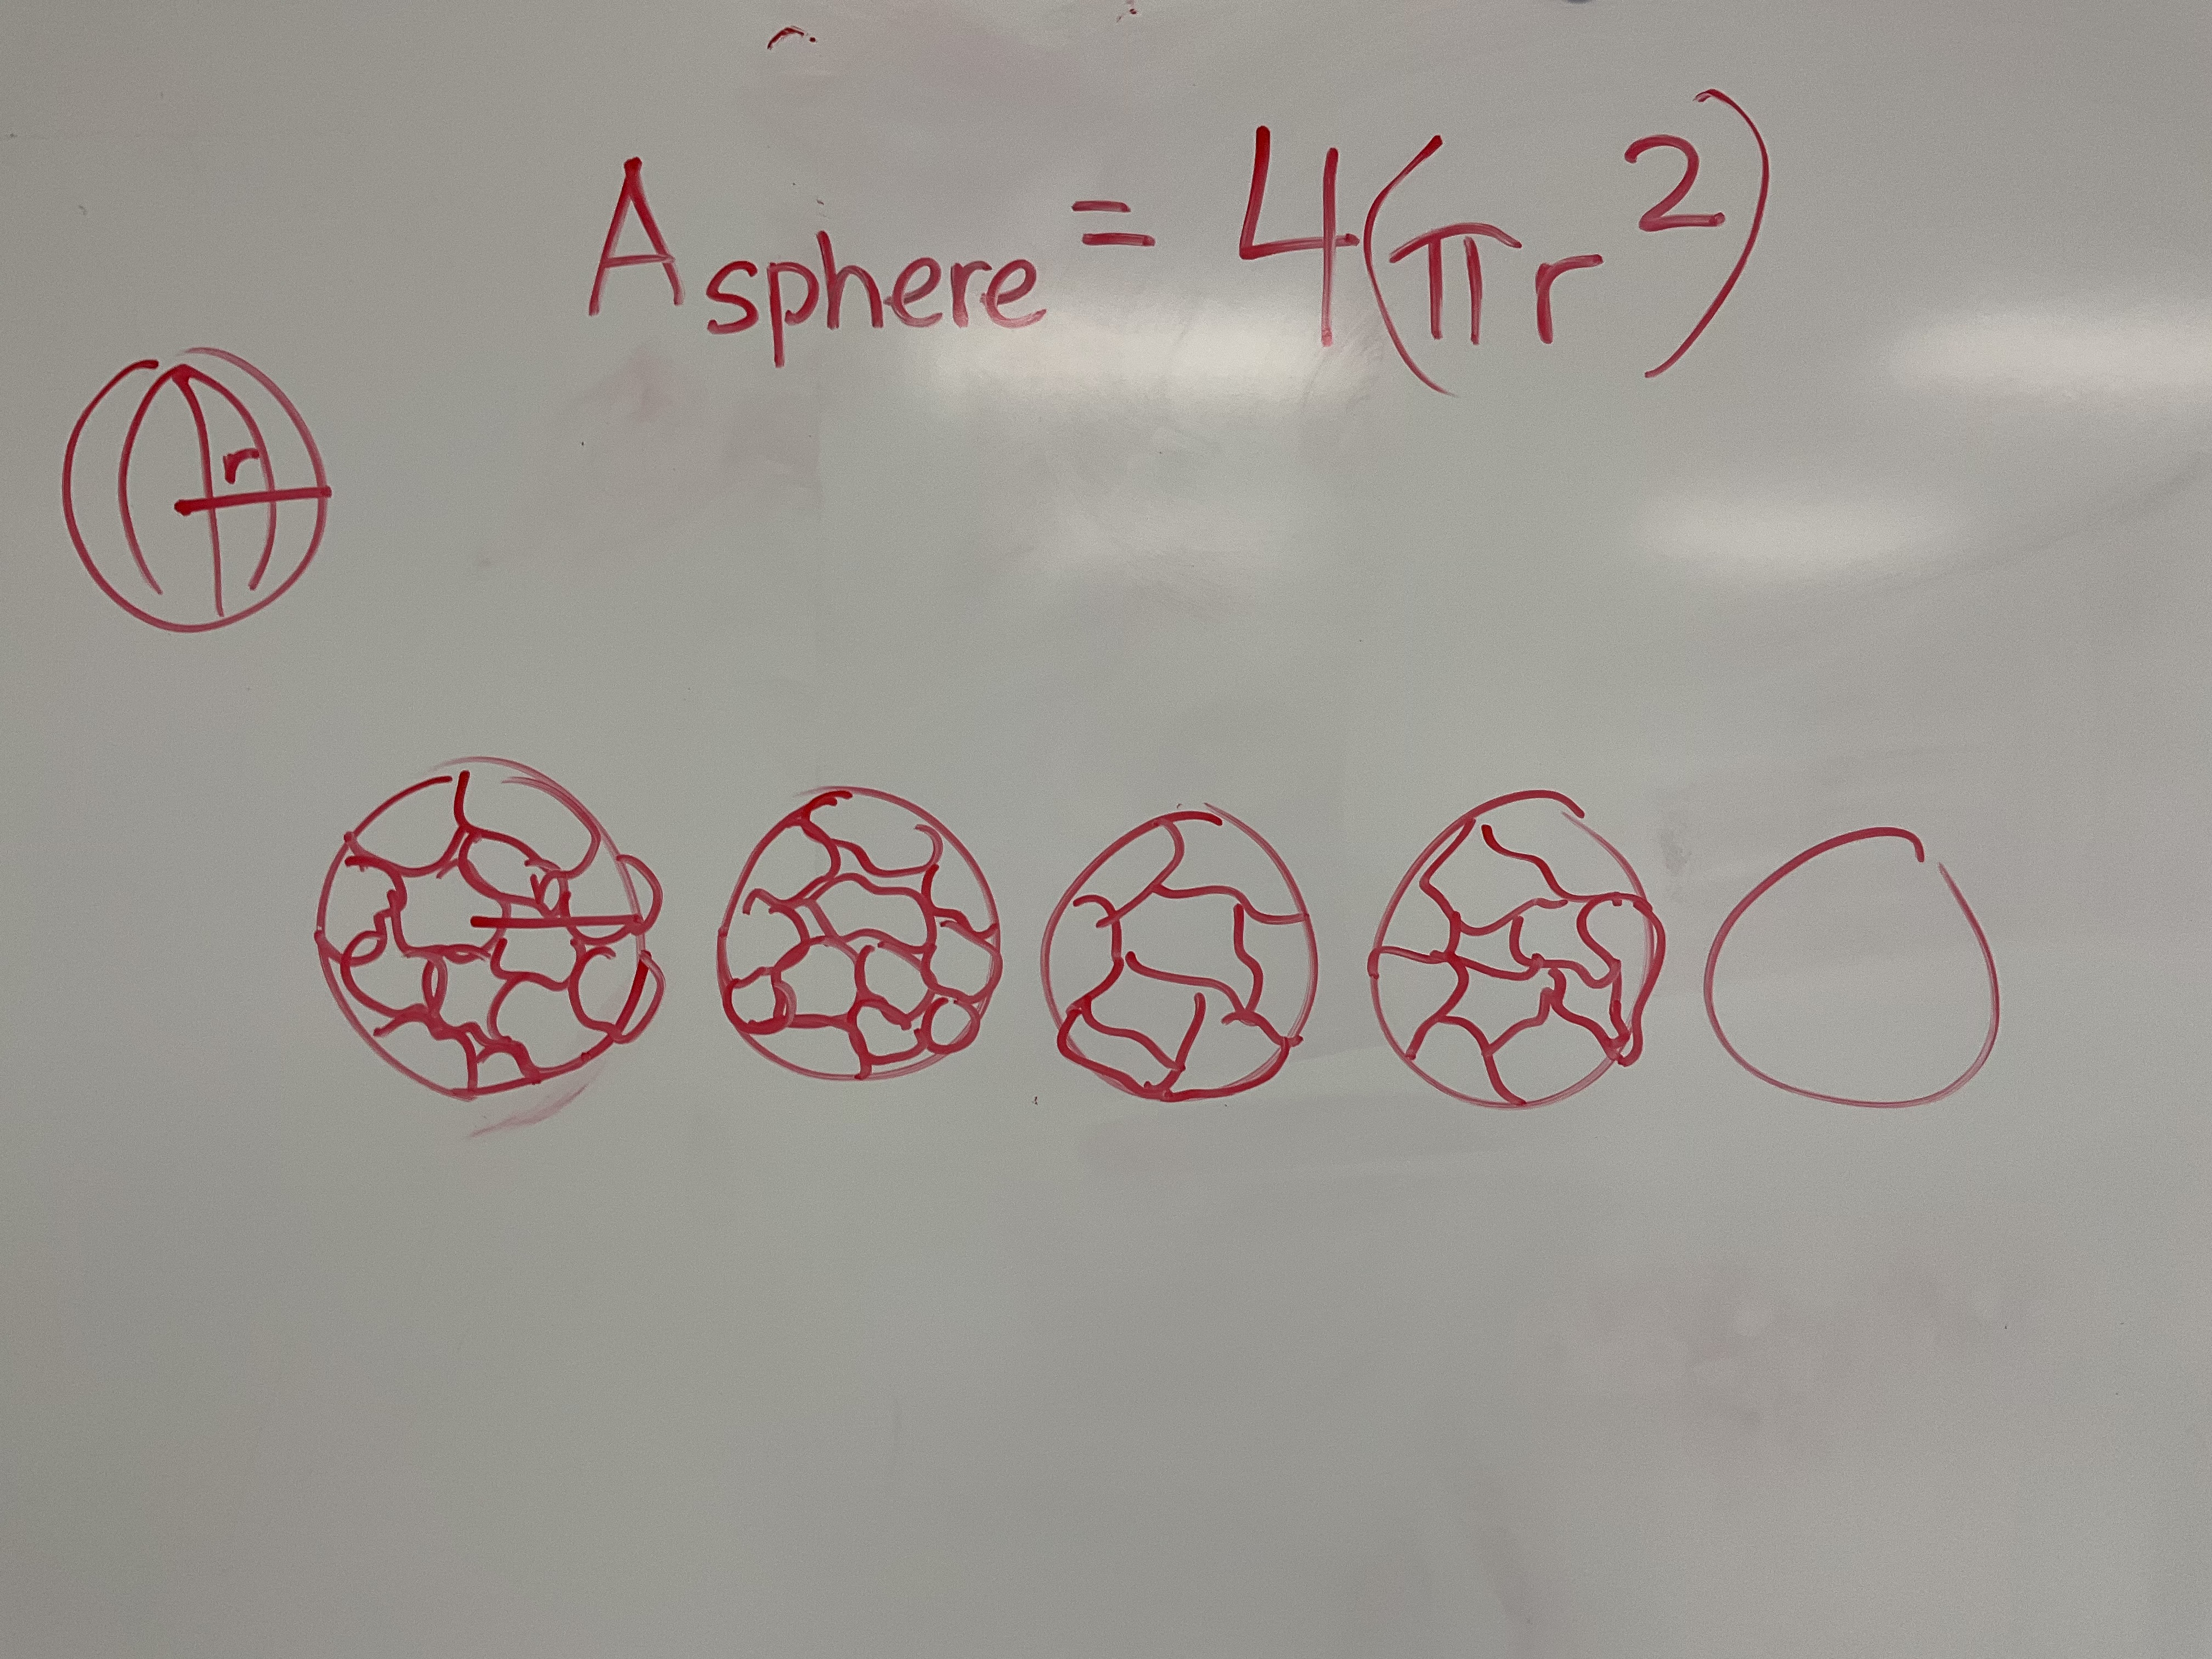
Sphere Day!
Today we calculated the surface area and the volume of spheres.
We explored the volume with a displacement tank. A tennis ball just happens to fit perfectly in a juice concentrate can, so I made a cylinder that is perfectly suited for the tennis ball by cutting the cylinder down so the height of the can is the same as the height of the ball.
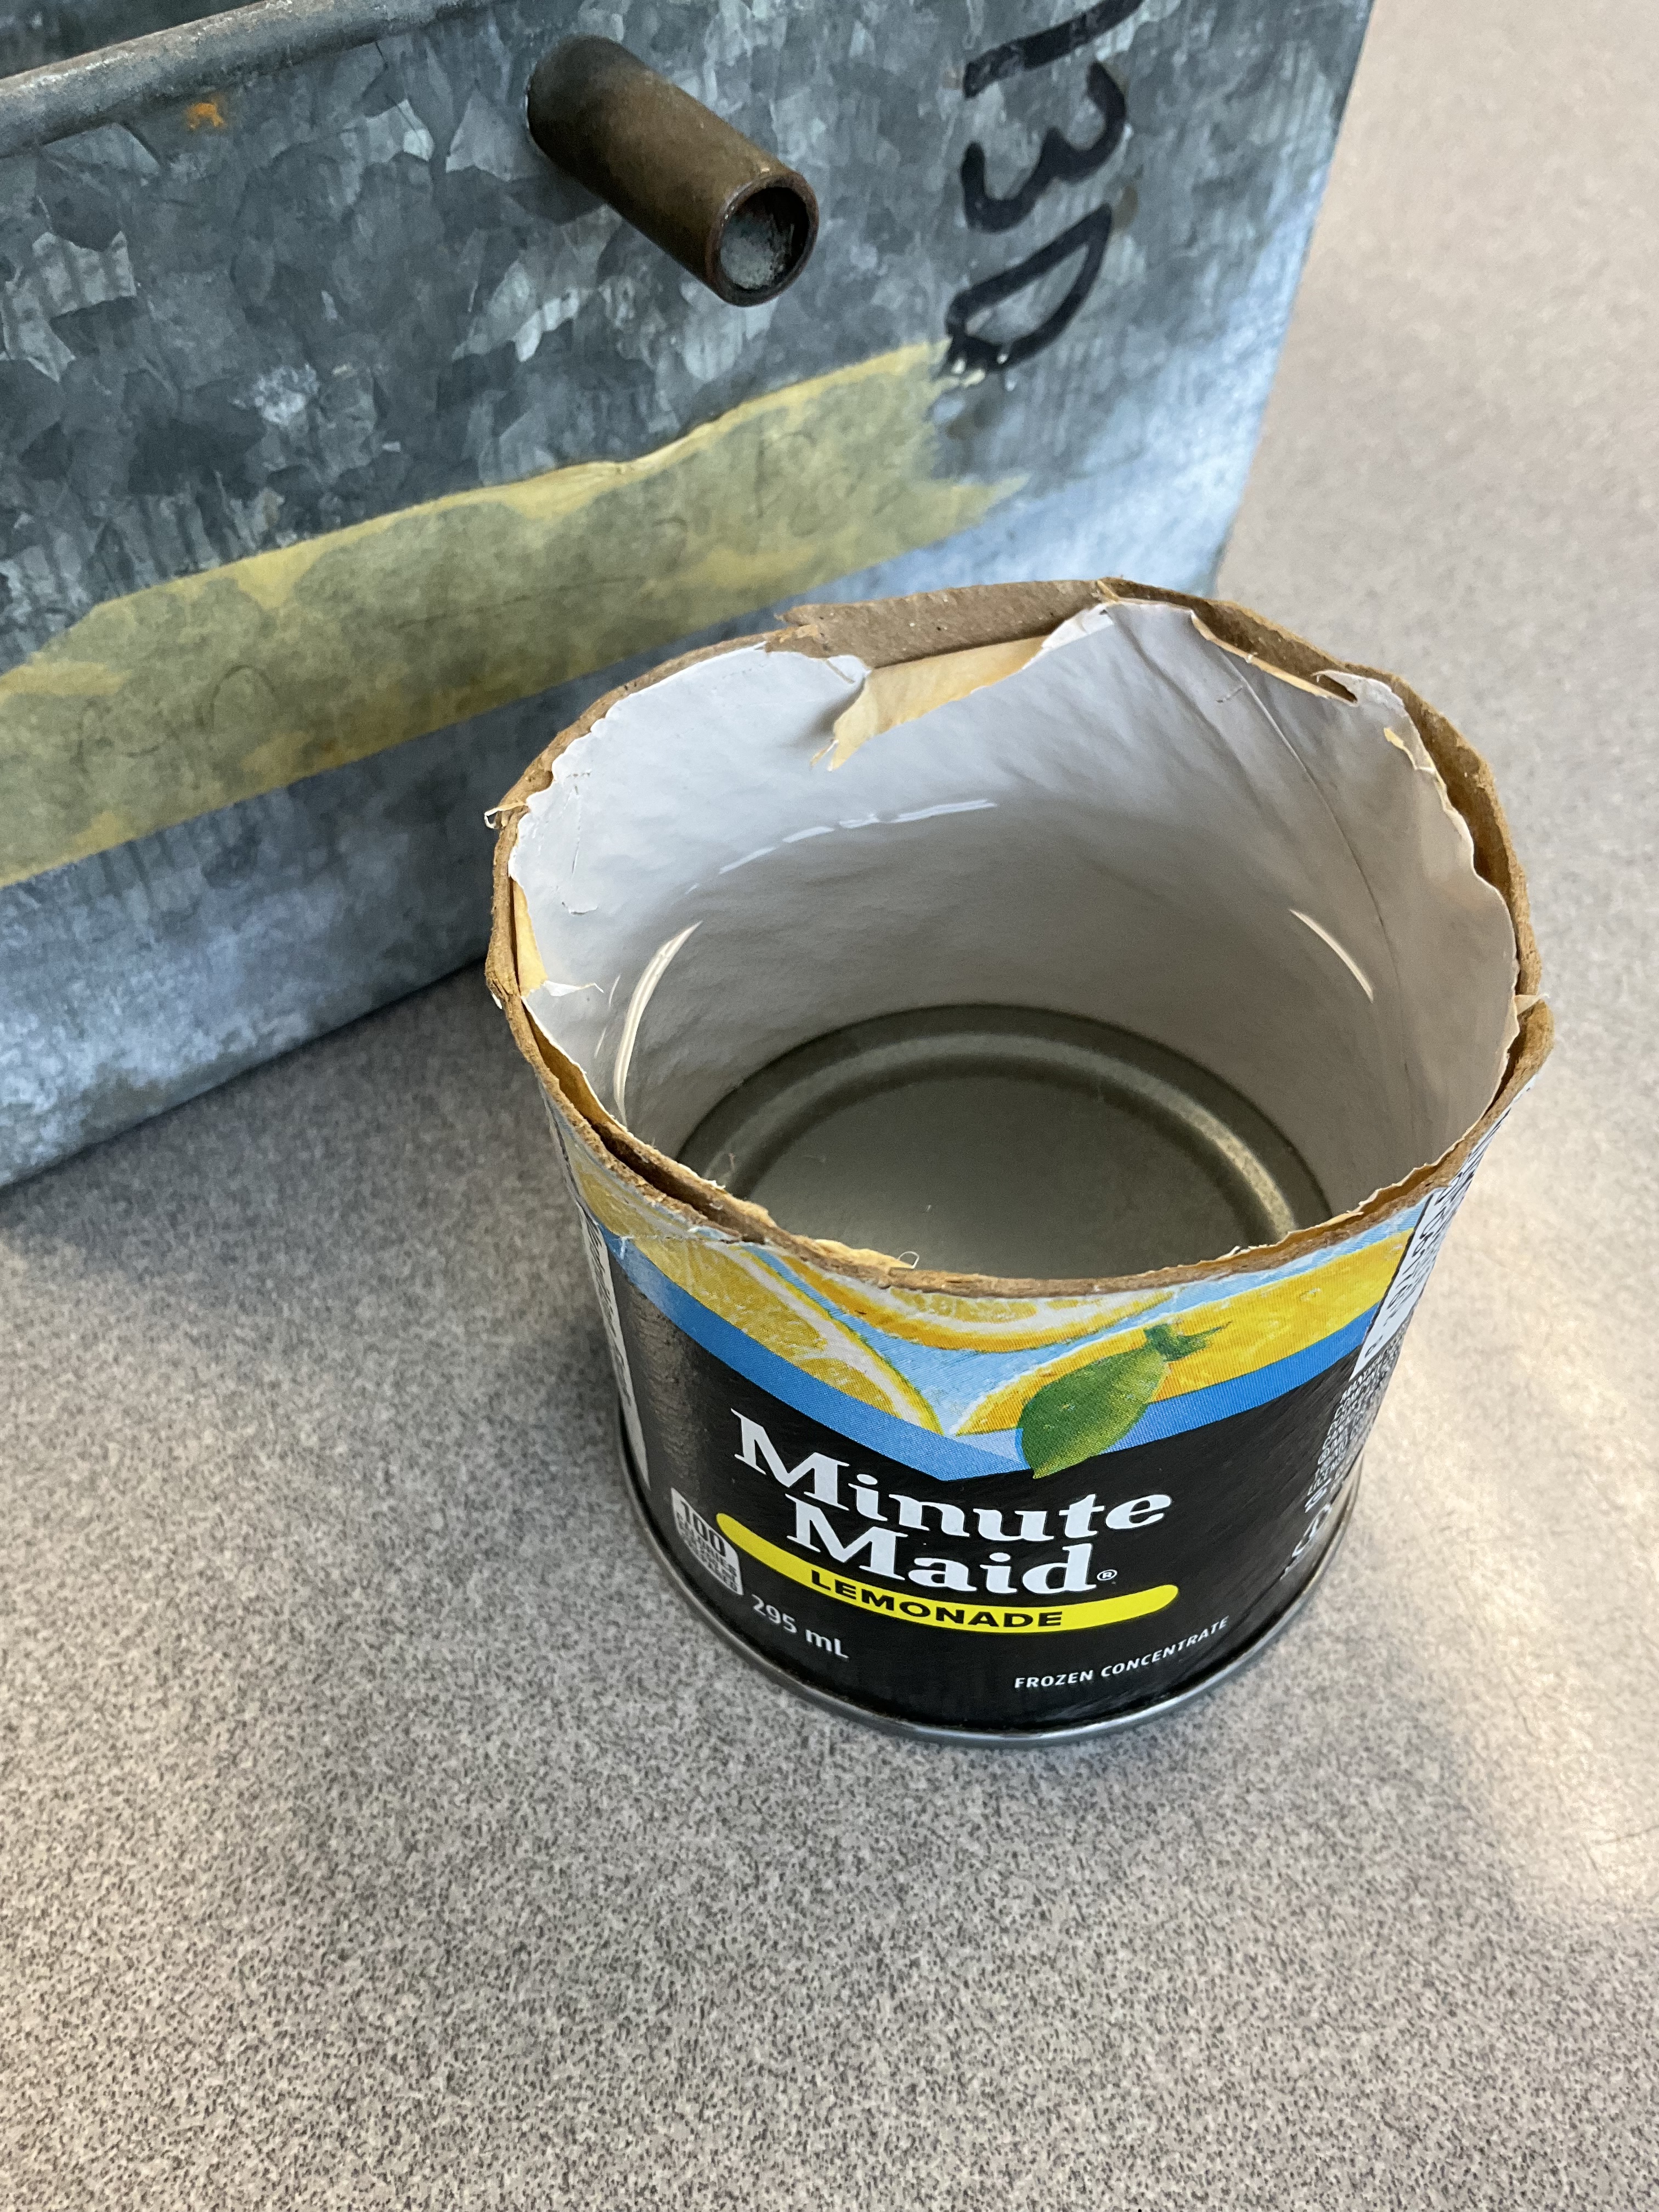
We put the tennis ball into the displacement tank and had to press it down since it floats. We caught the displaced water in the cylinder. It filled it 2/3 of the way.
To prove that it was filled 2/3 of the way, we used the cone and sphere from the solids set.
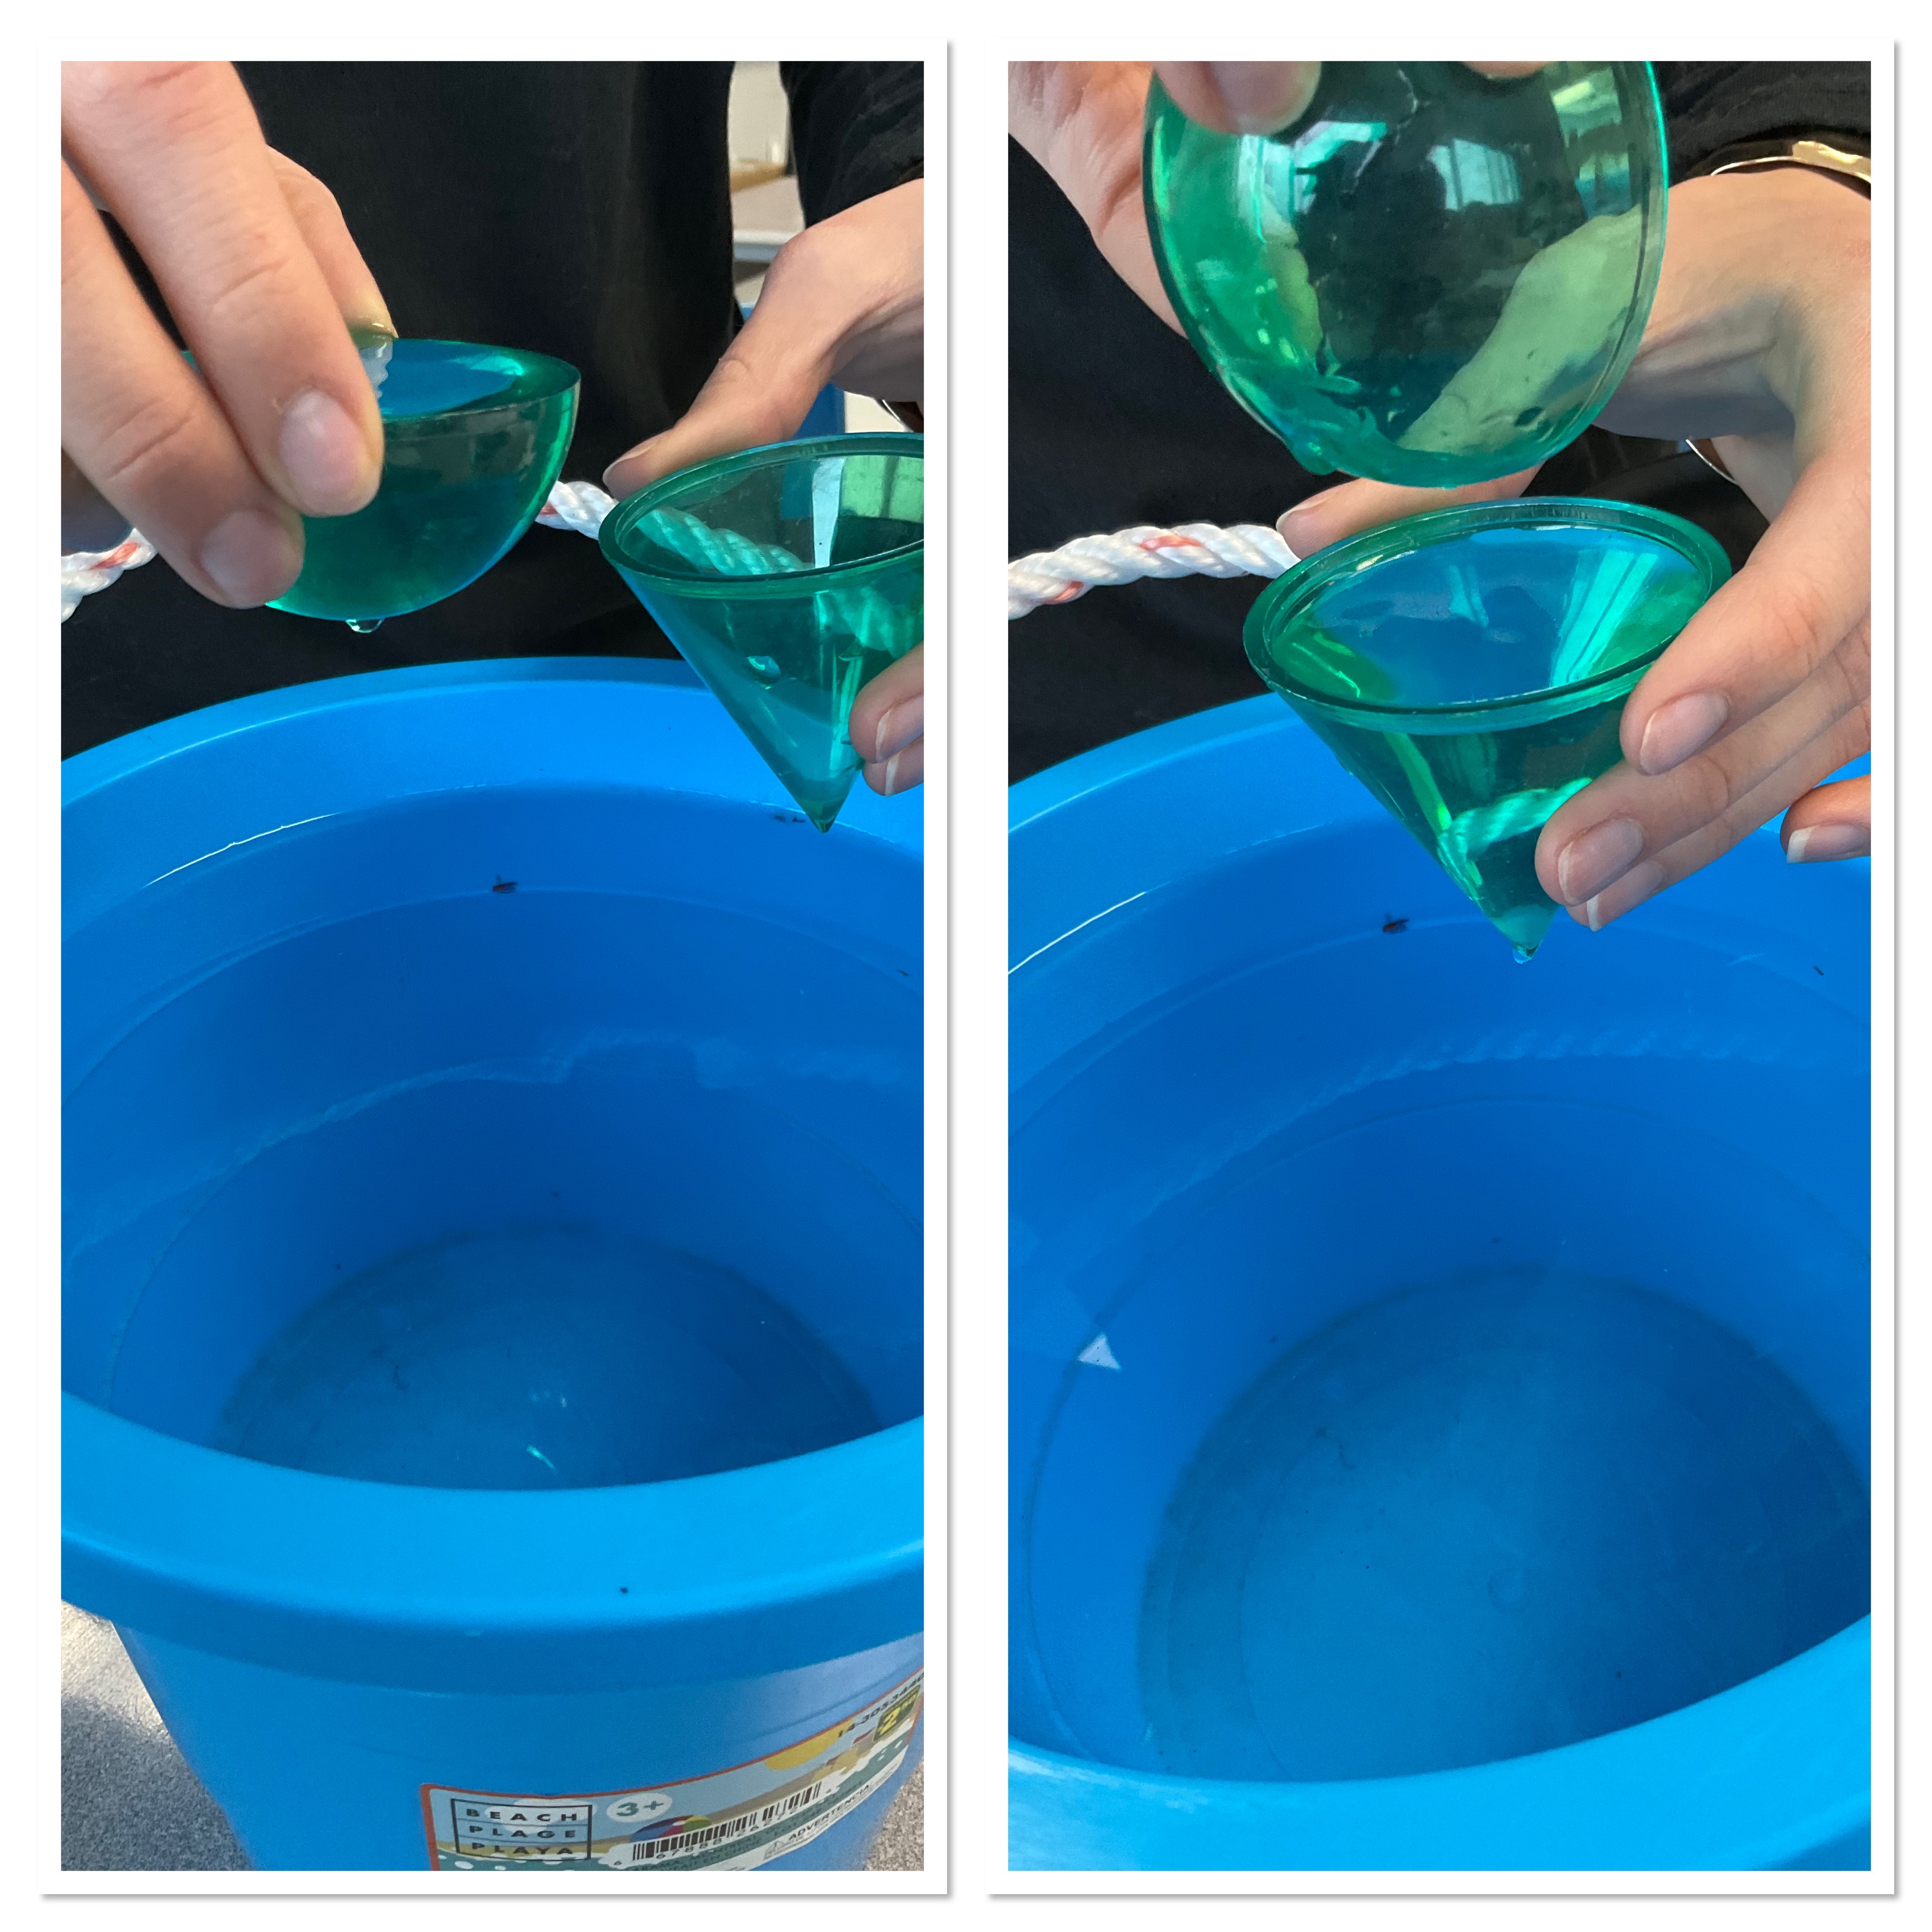
We saw that half a sphere has the same volume as a cone. We already know that a cone has the same volume as 1/3 of the cylinder, so a whole sphere (2 cones worth) is 2/3 of the cylinder.

We went through the derivation using some intense algebra and substitution. We needed to substitute thar h=2r, and then we could get the formula for volume of a sphere.
Surface area was next on the list. We used oranges to help us, since they can be peeled. The peel is the surface of the sphere. We drew circles with the same diameter as the orange, then we peeled the orange and fit the peels into the circles.
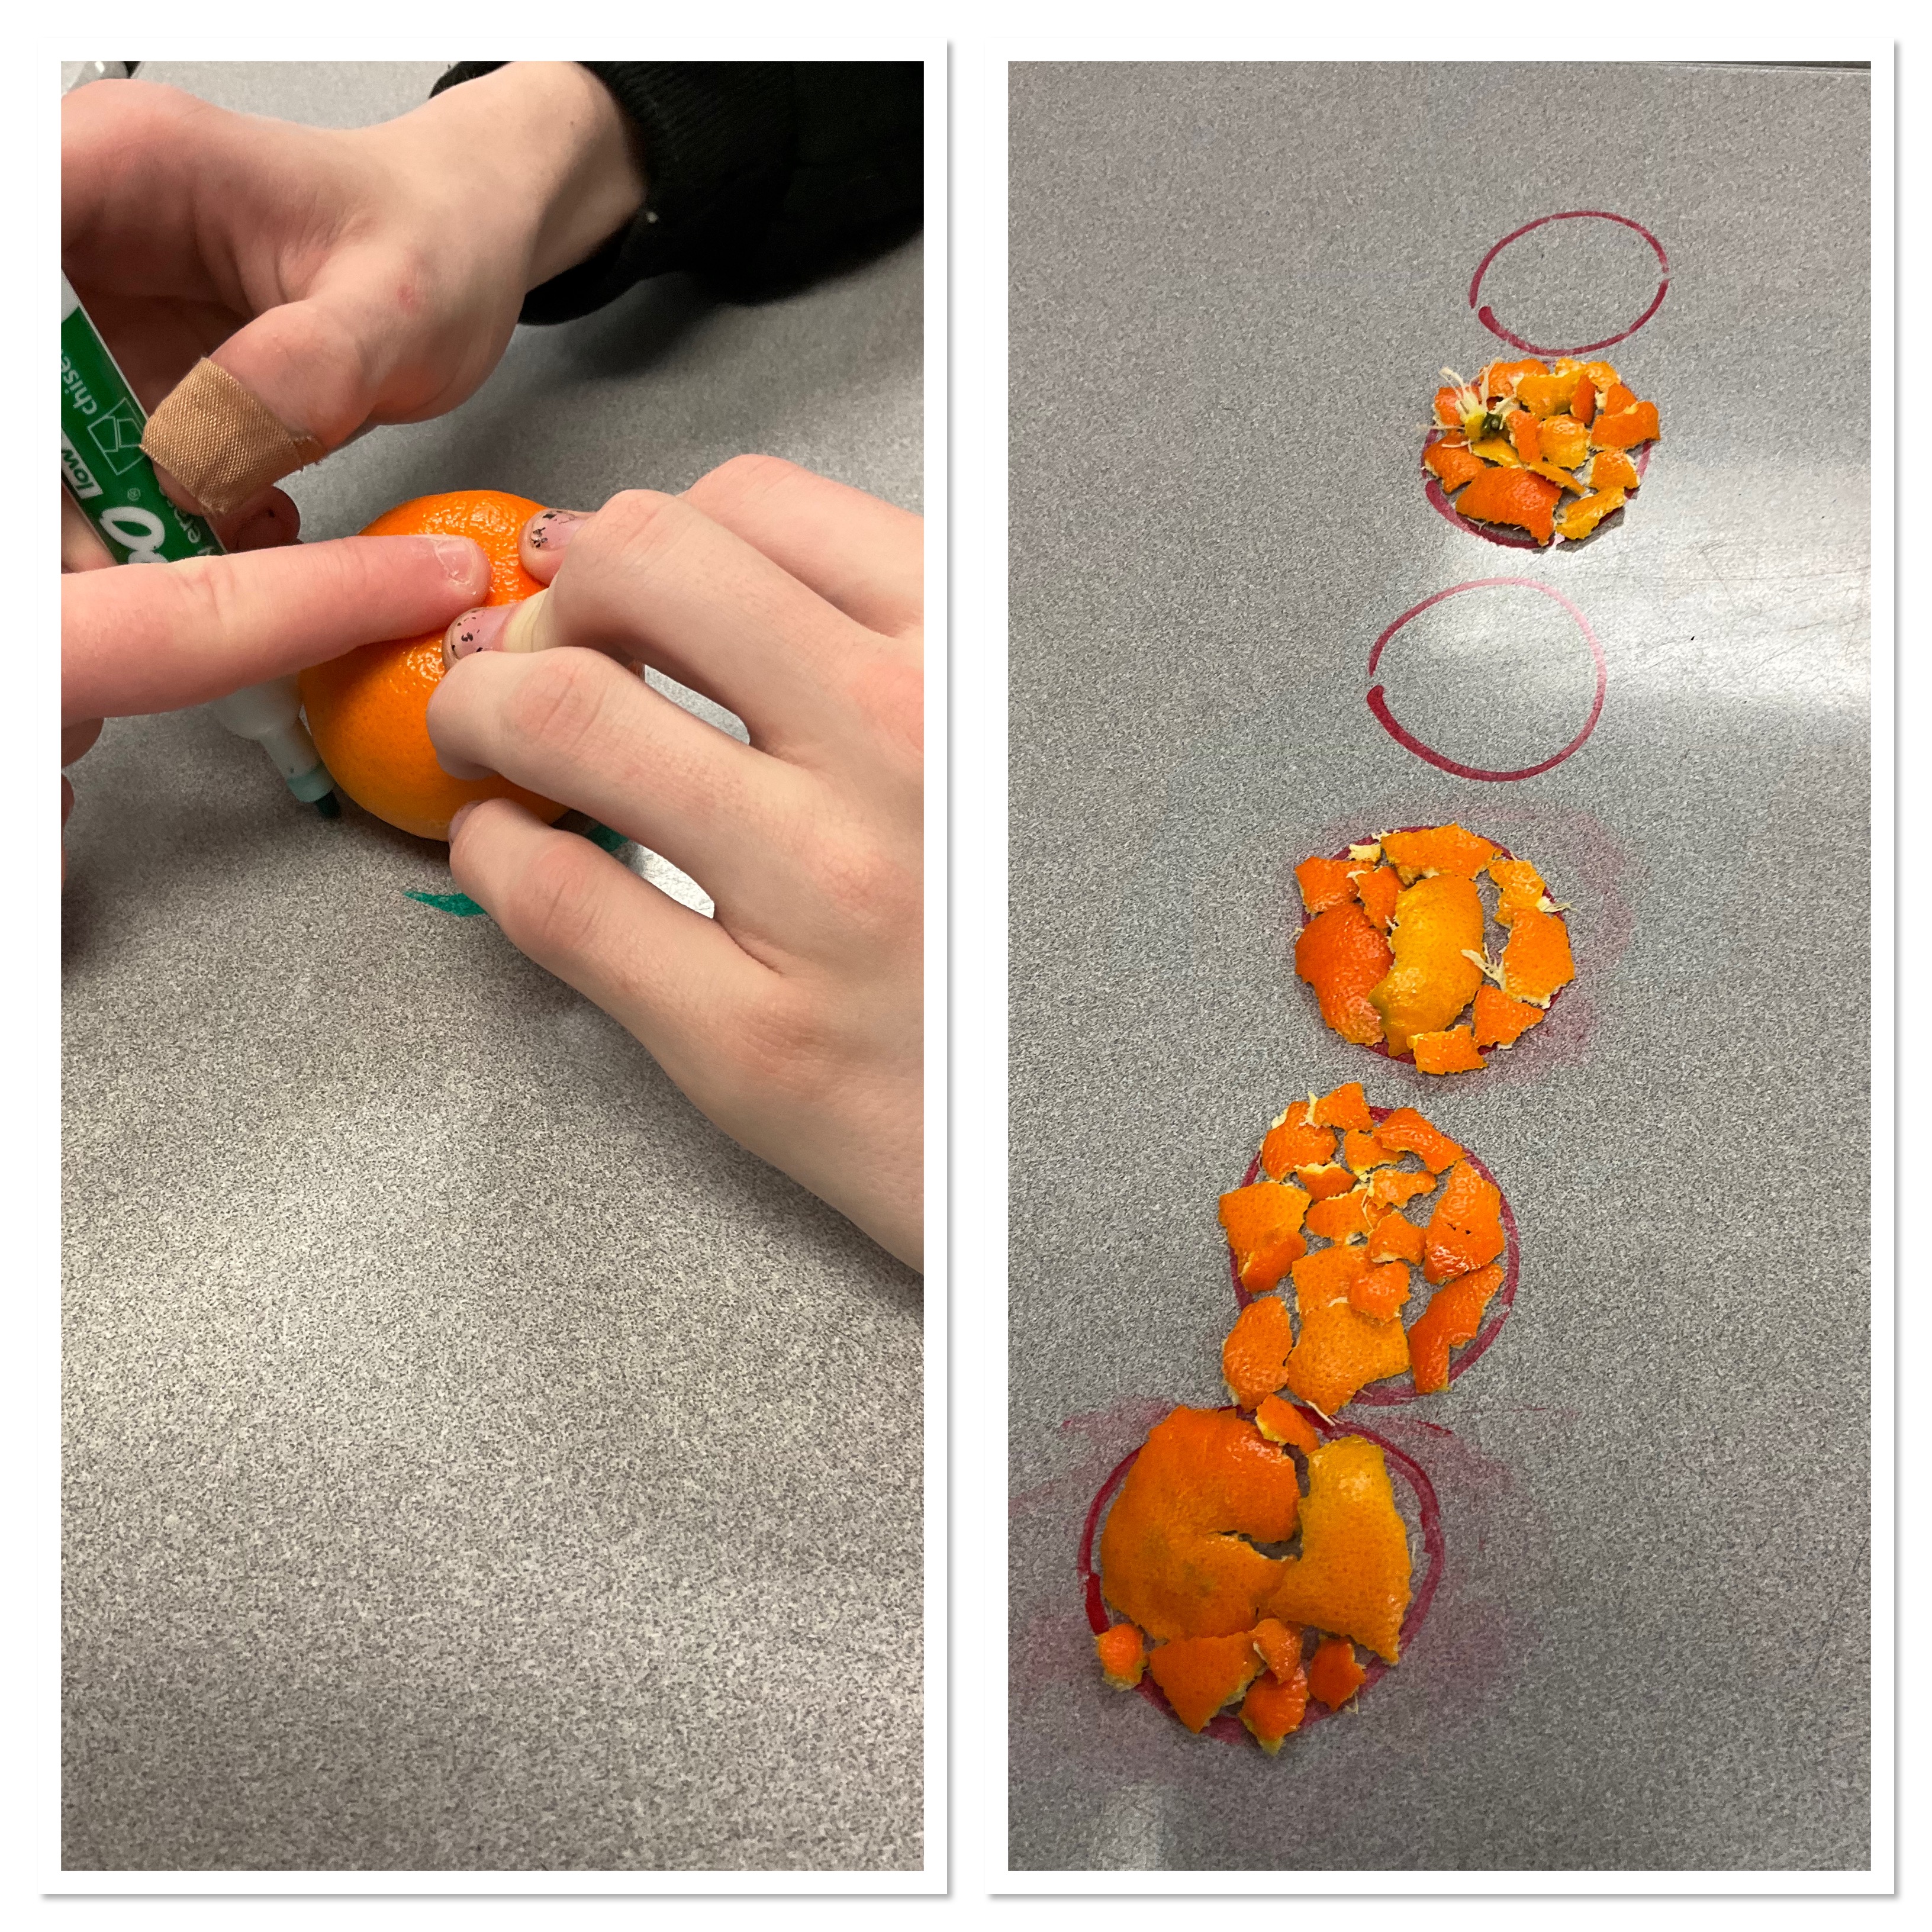
We can fill 4 circles perfectly with the peels. This corresponds to the formula of the sphere’s area.
This was our last new learning, and we’ll be preparing for our exams which take place next week.
