Solving in 3 Dimensions
In Grade 11 we are working on solving trigonometry problems in 3 dimensions. The biggest challenge can be understanding the situation and creating a drawing, or interpreting the drawing that’s given.
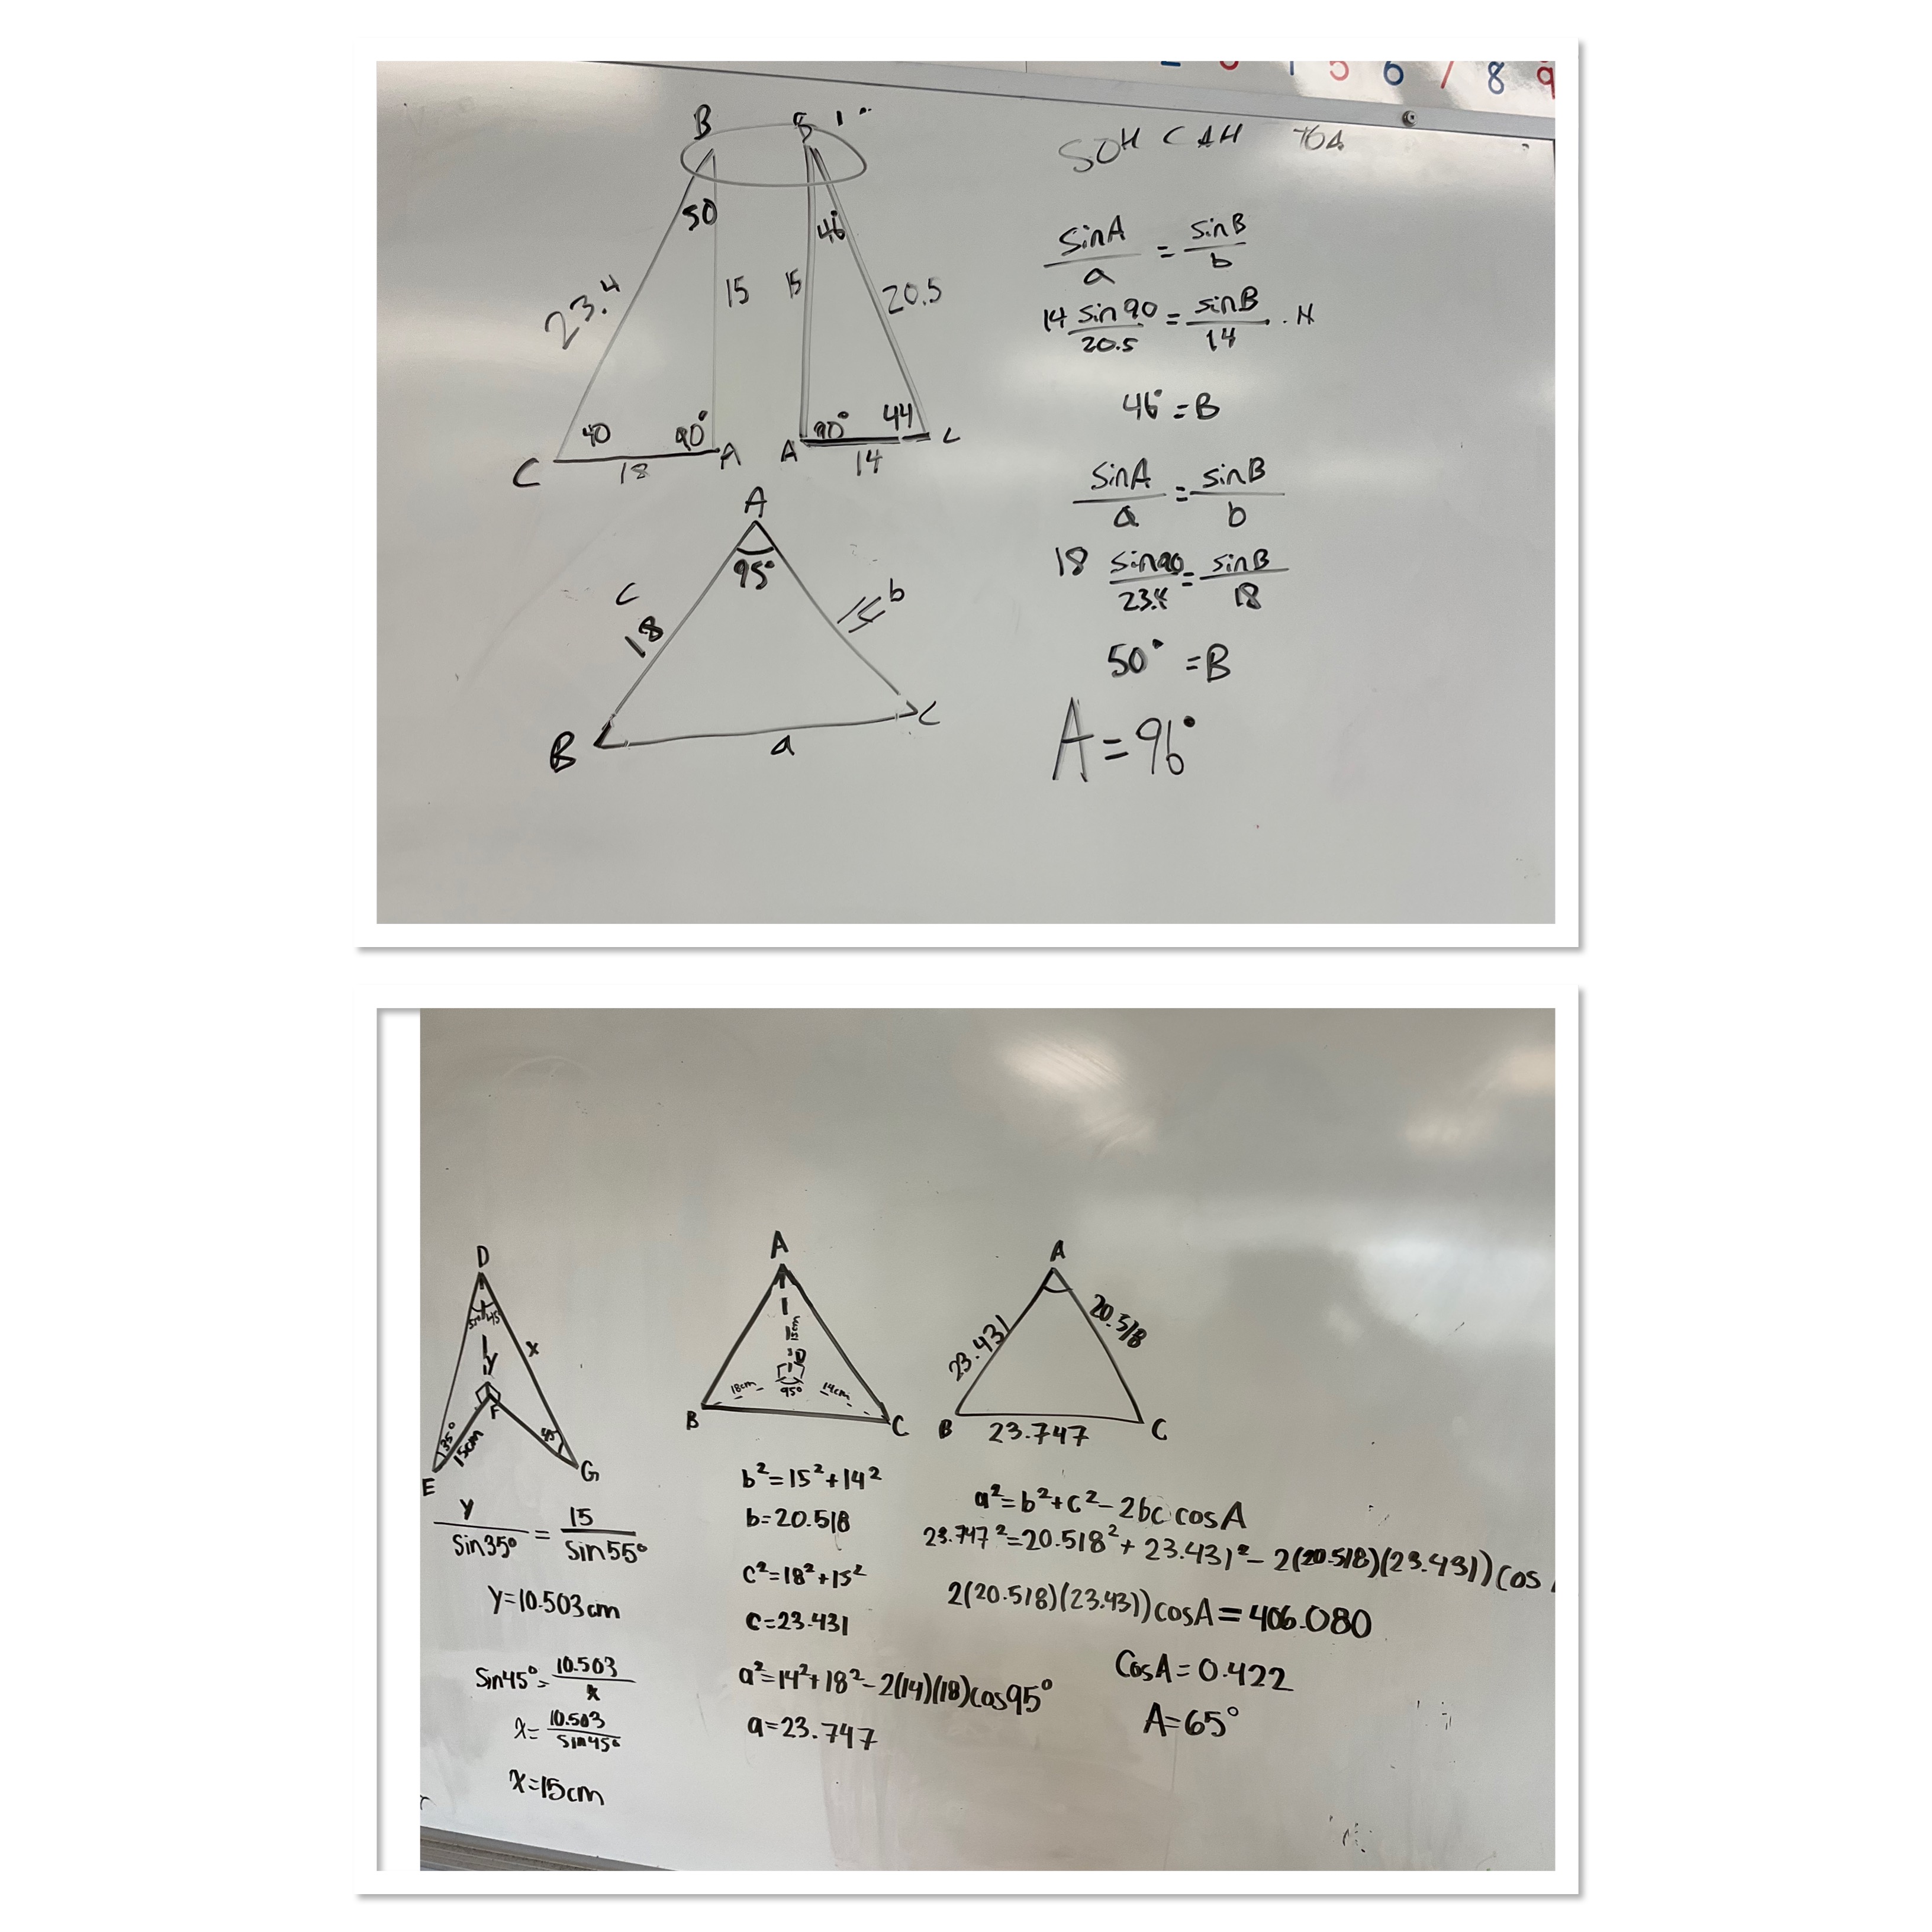
We’re working on calculating sides that are shared between triangles so that the information can be used to calculate the value of unknowns. We’re getting better at knowing when to do sine law and cosine law and when we can use primary trig ratios.
Sometimes it helps to break a 3 dimensional picture down into flat triangles that are separate, but we still need a way to relate sides that are the same from one drawing to the next.
Changing Dimensions
Grade 9s are working on calculating area and volume and perimeter, but then also seeing how these will change if dimensions are doubled or tripled or multiplied by other factors.
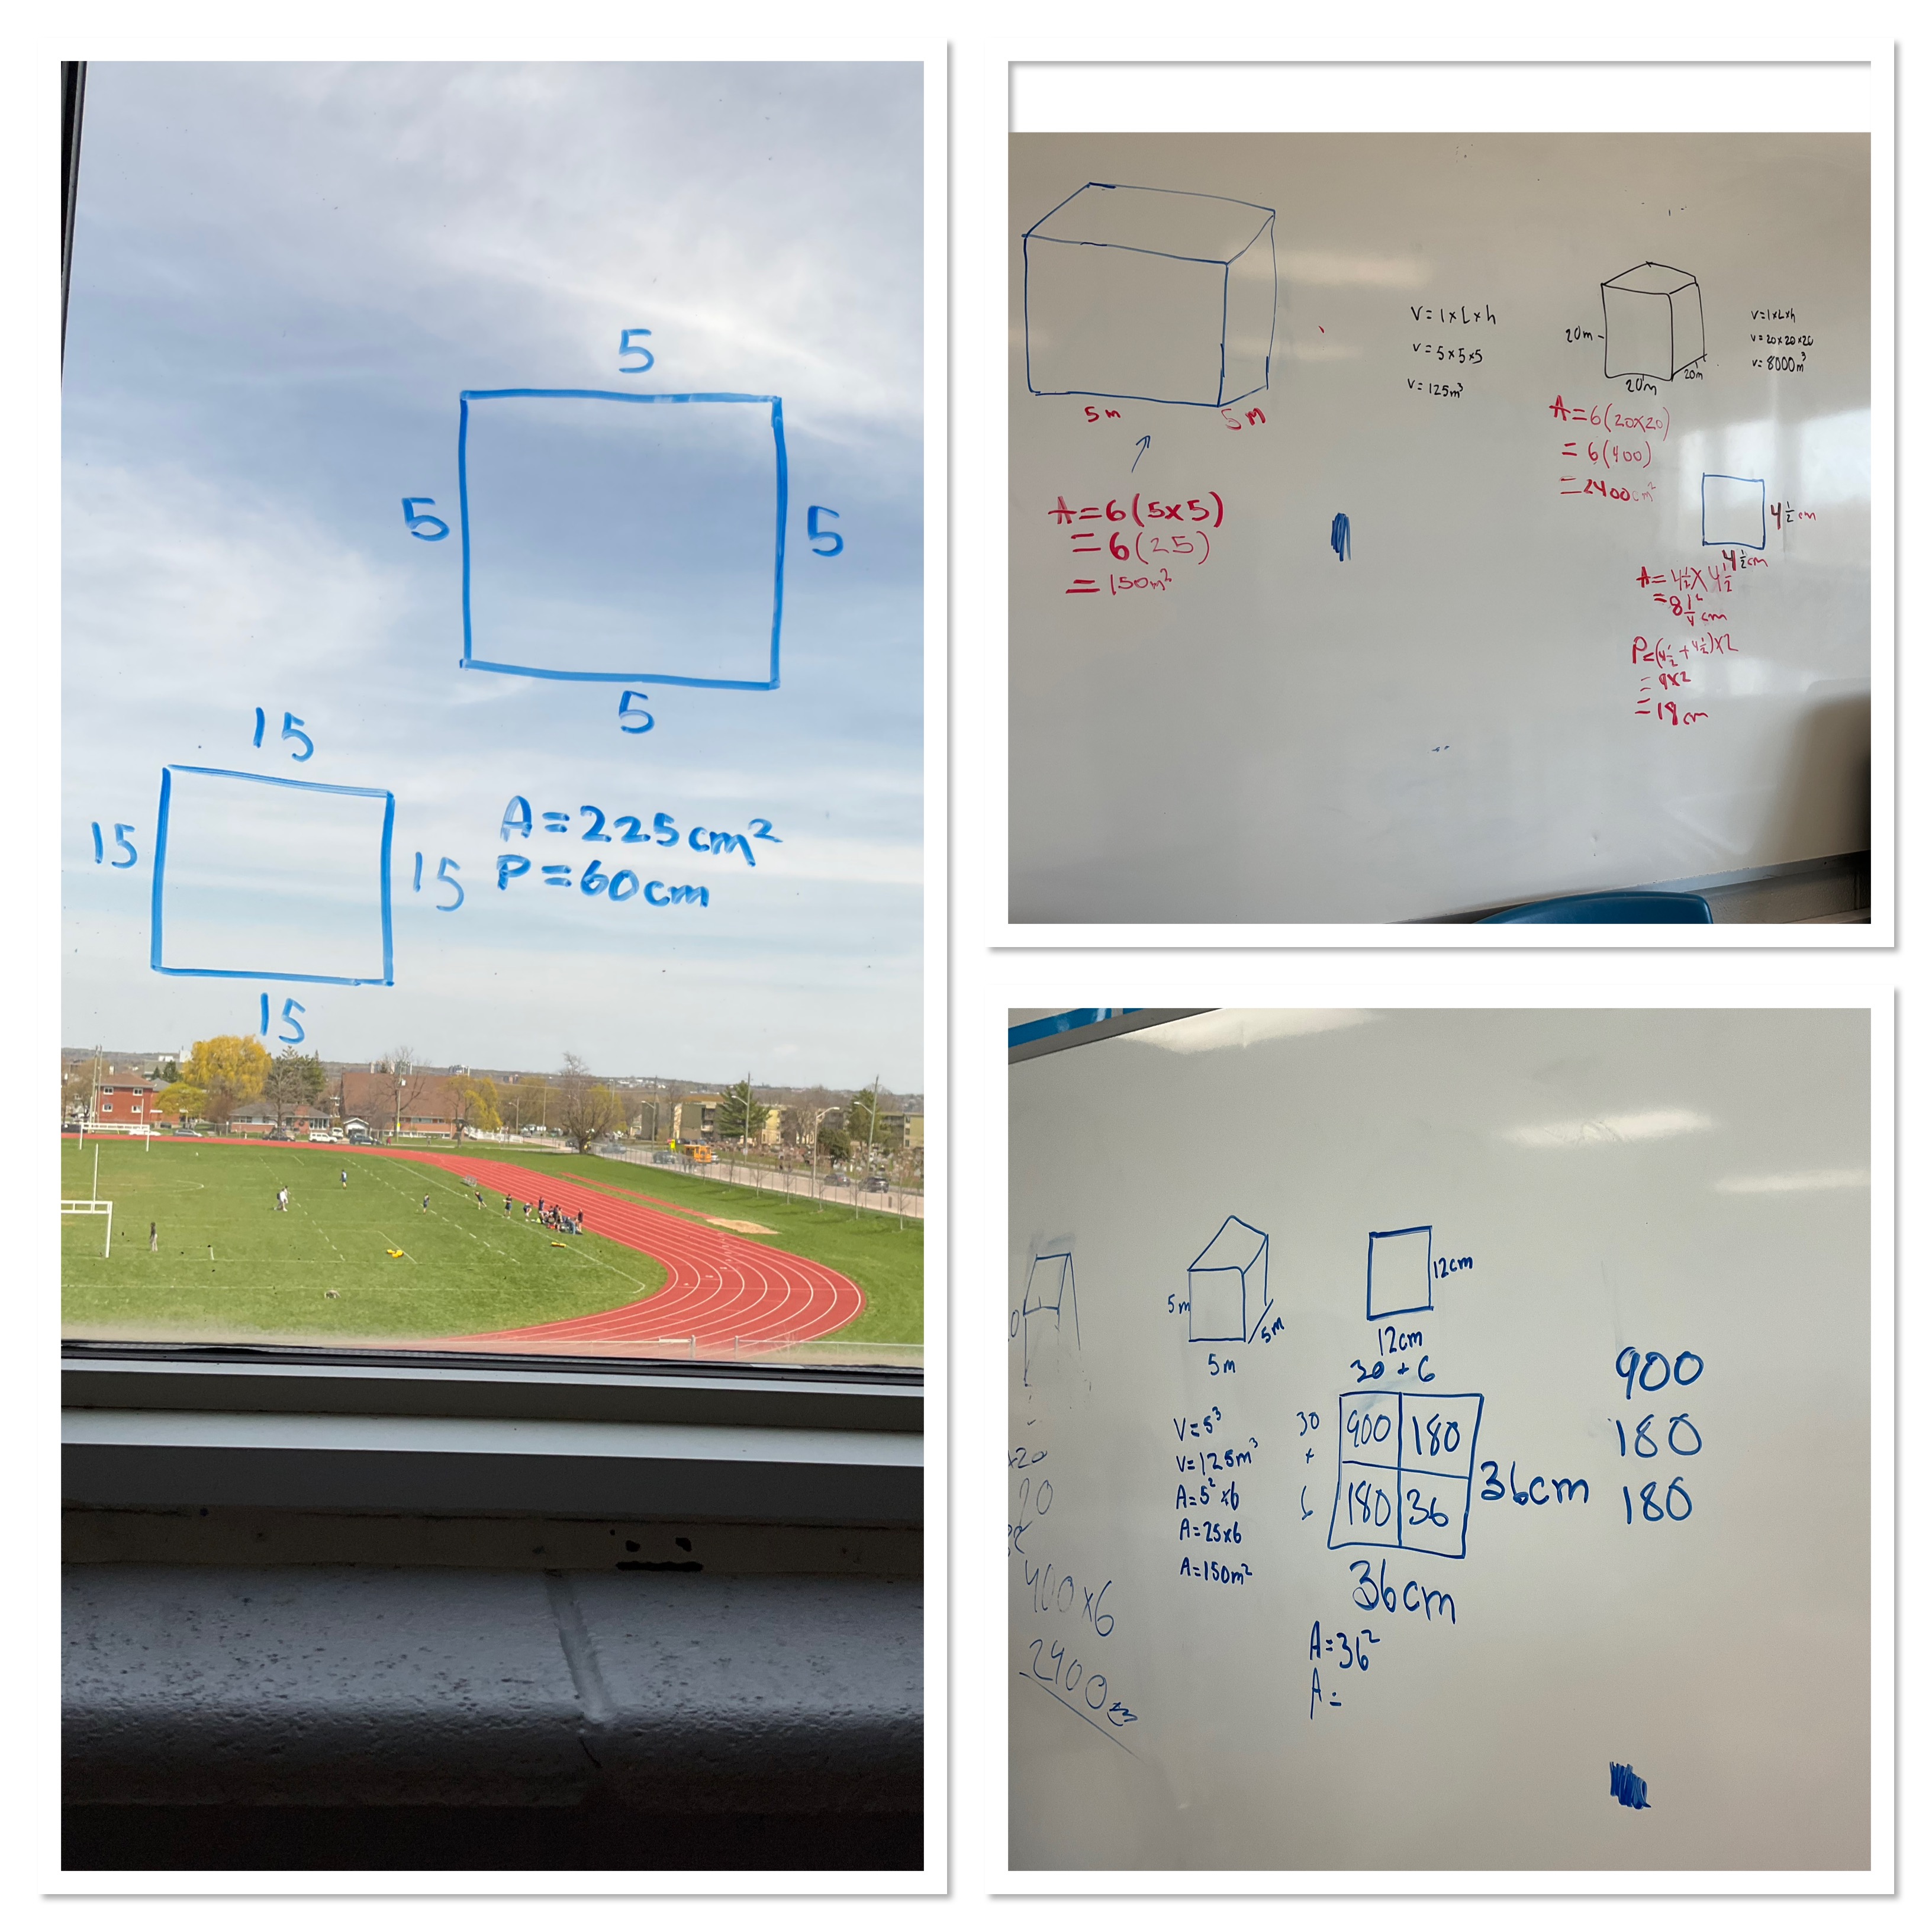
We’re expanding on what we learned with algebra and toothpicks when we built models of (x)^2 and (3x)^2, when we triple the side length the area is multiplied by 9.
We connect this to our volume calculations as well like converting 1 cubic yard into cubic feet. We know there are 3 feet in a yard, so 1 cubic yard is (3feet)^3 which is 27 cubic feet.
These ideas blend so many of our skills, it’s important to spend a bit of time connecting all the concepts and representations that we know.
OAME 2026
I was so pleased to be selected to present at this year’s provincial math conference in London Ontario this past week. I attended some excellent workshops, met good math friends, and learned a lot of new strategies and problems to bring back to my classes.
We had a workshop based on a task which we played with and modelled (or tried to model) and then the workshop main topic of consolidation was introduced.
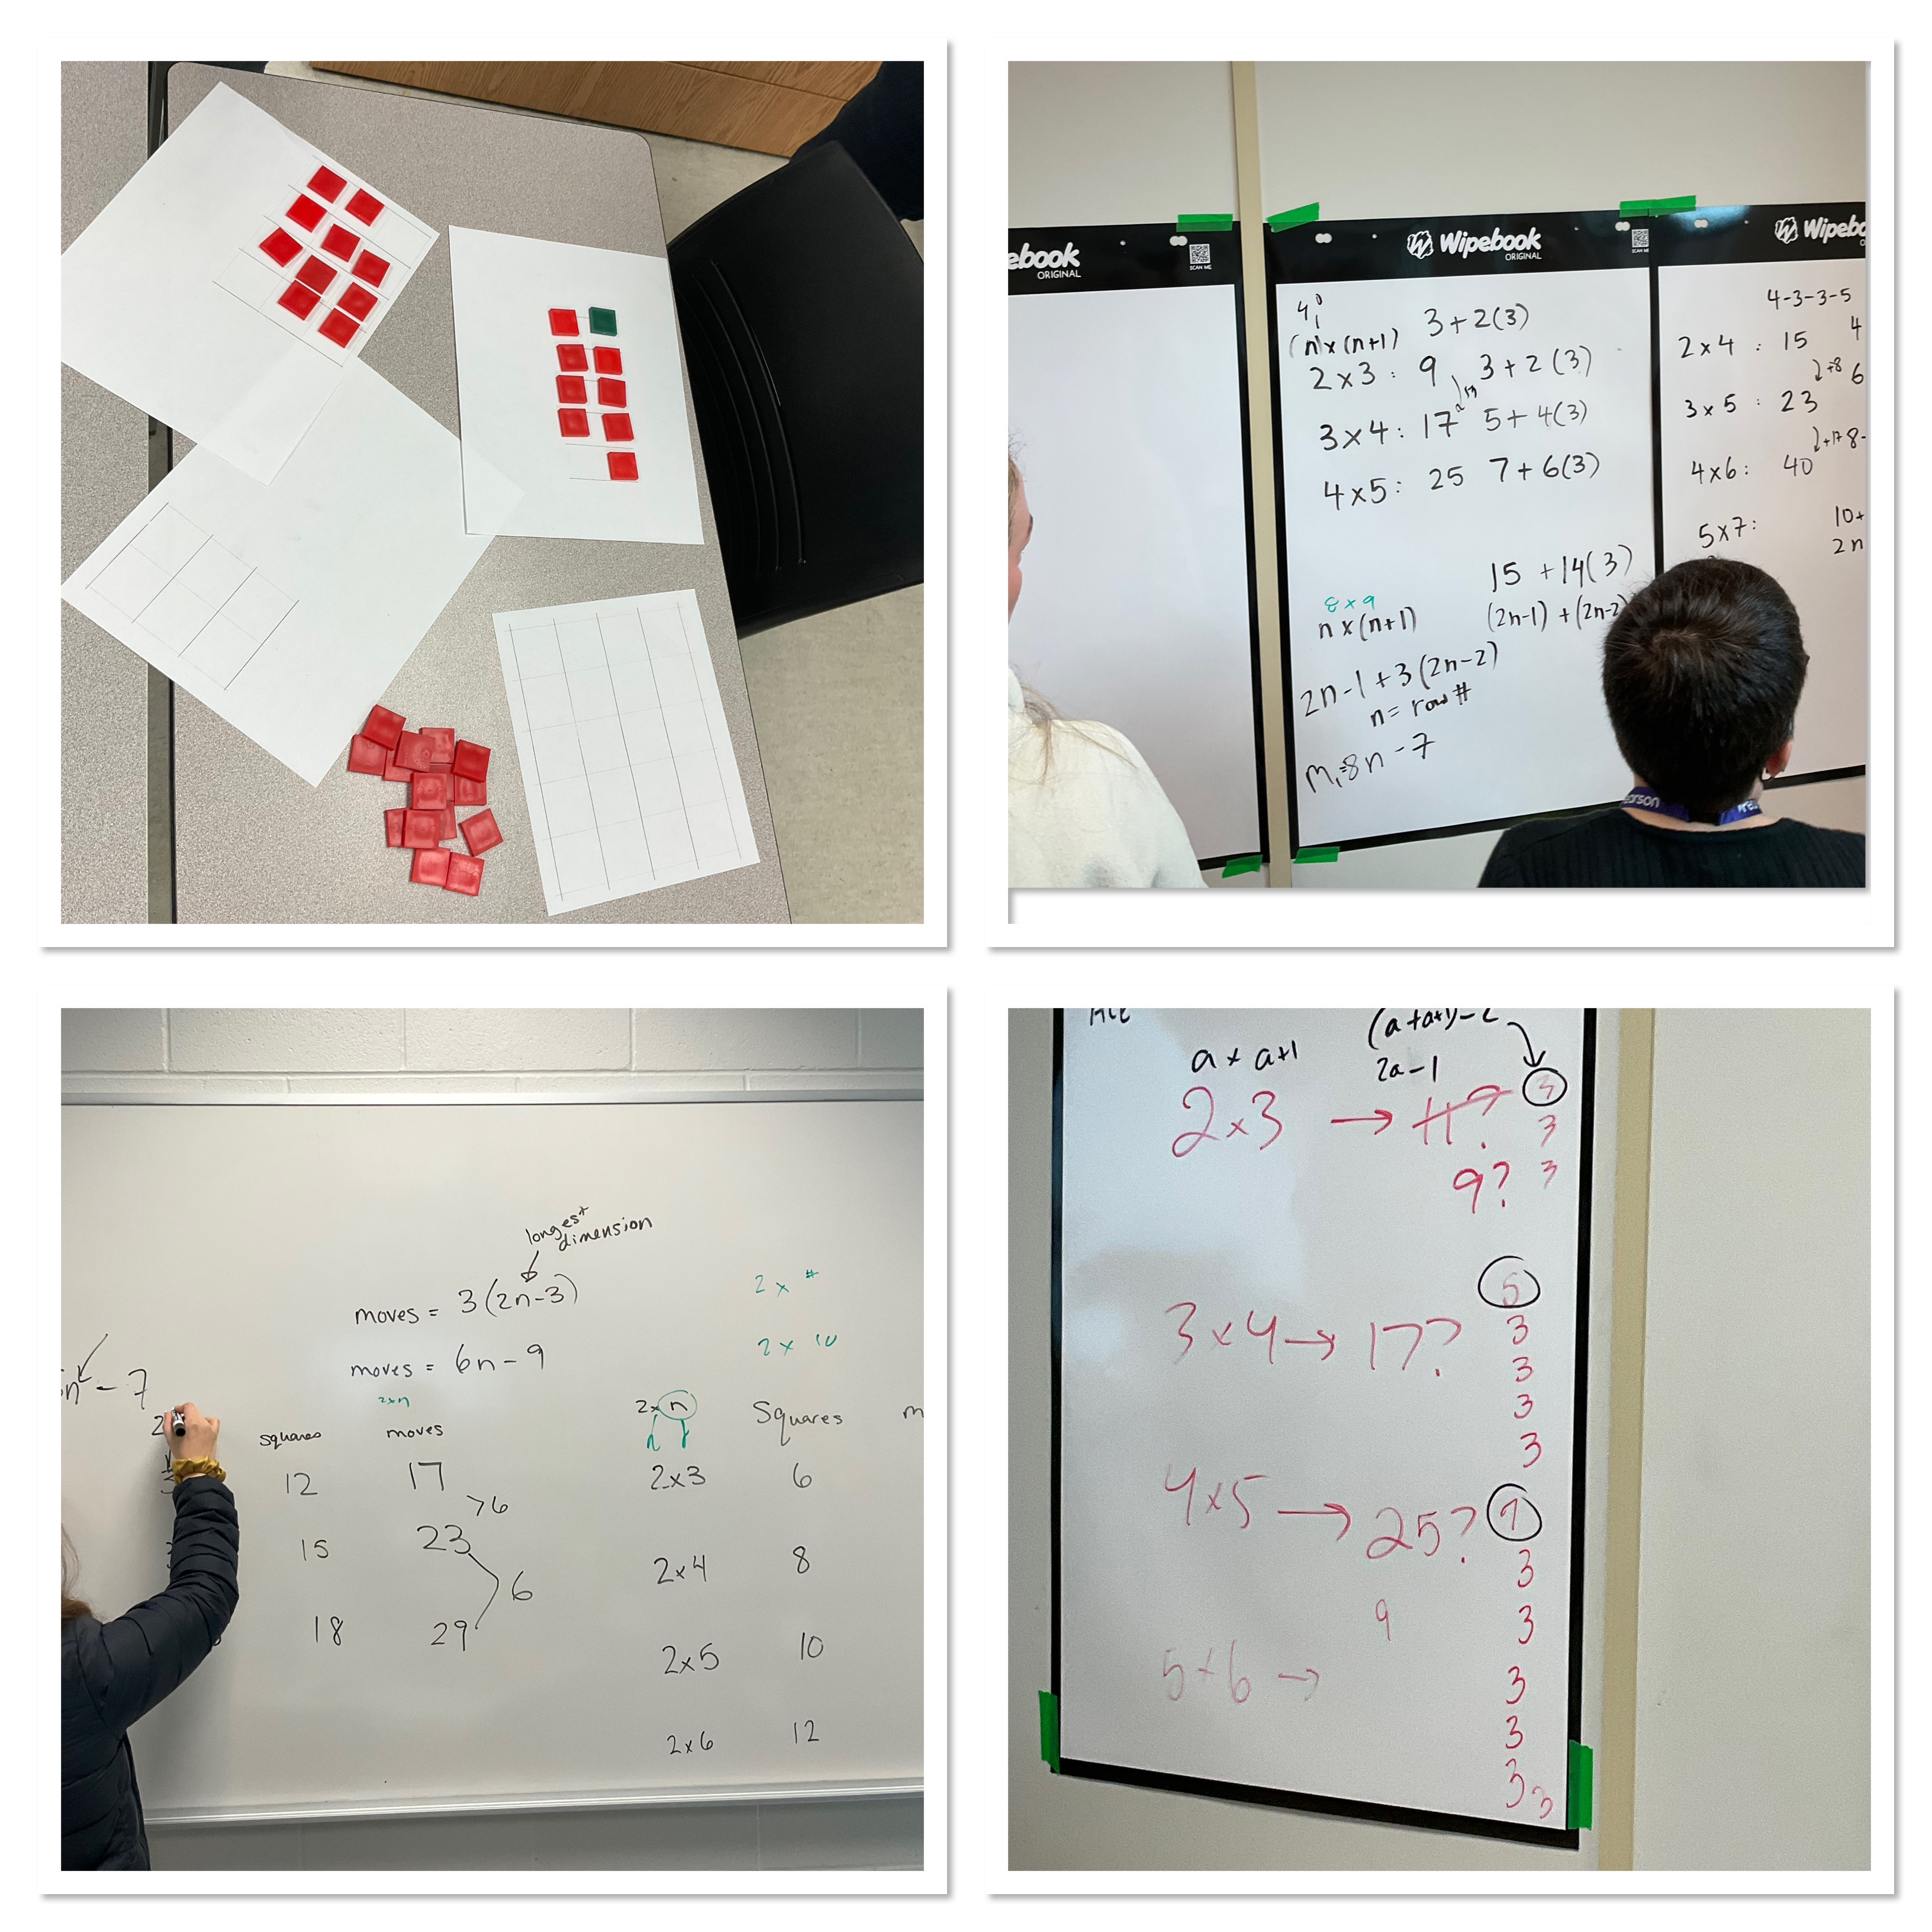
We were split into groups and tasked with organizing how we would consolidate the work if we were in a class. We talked about the approaches and communication that we would highlight, and in what order.
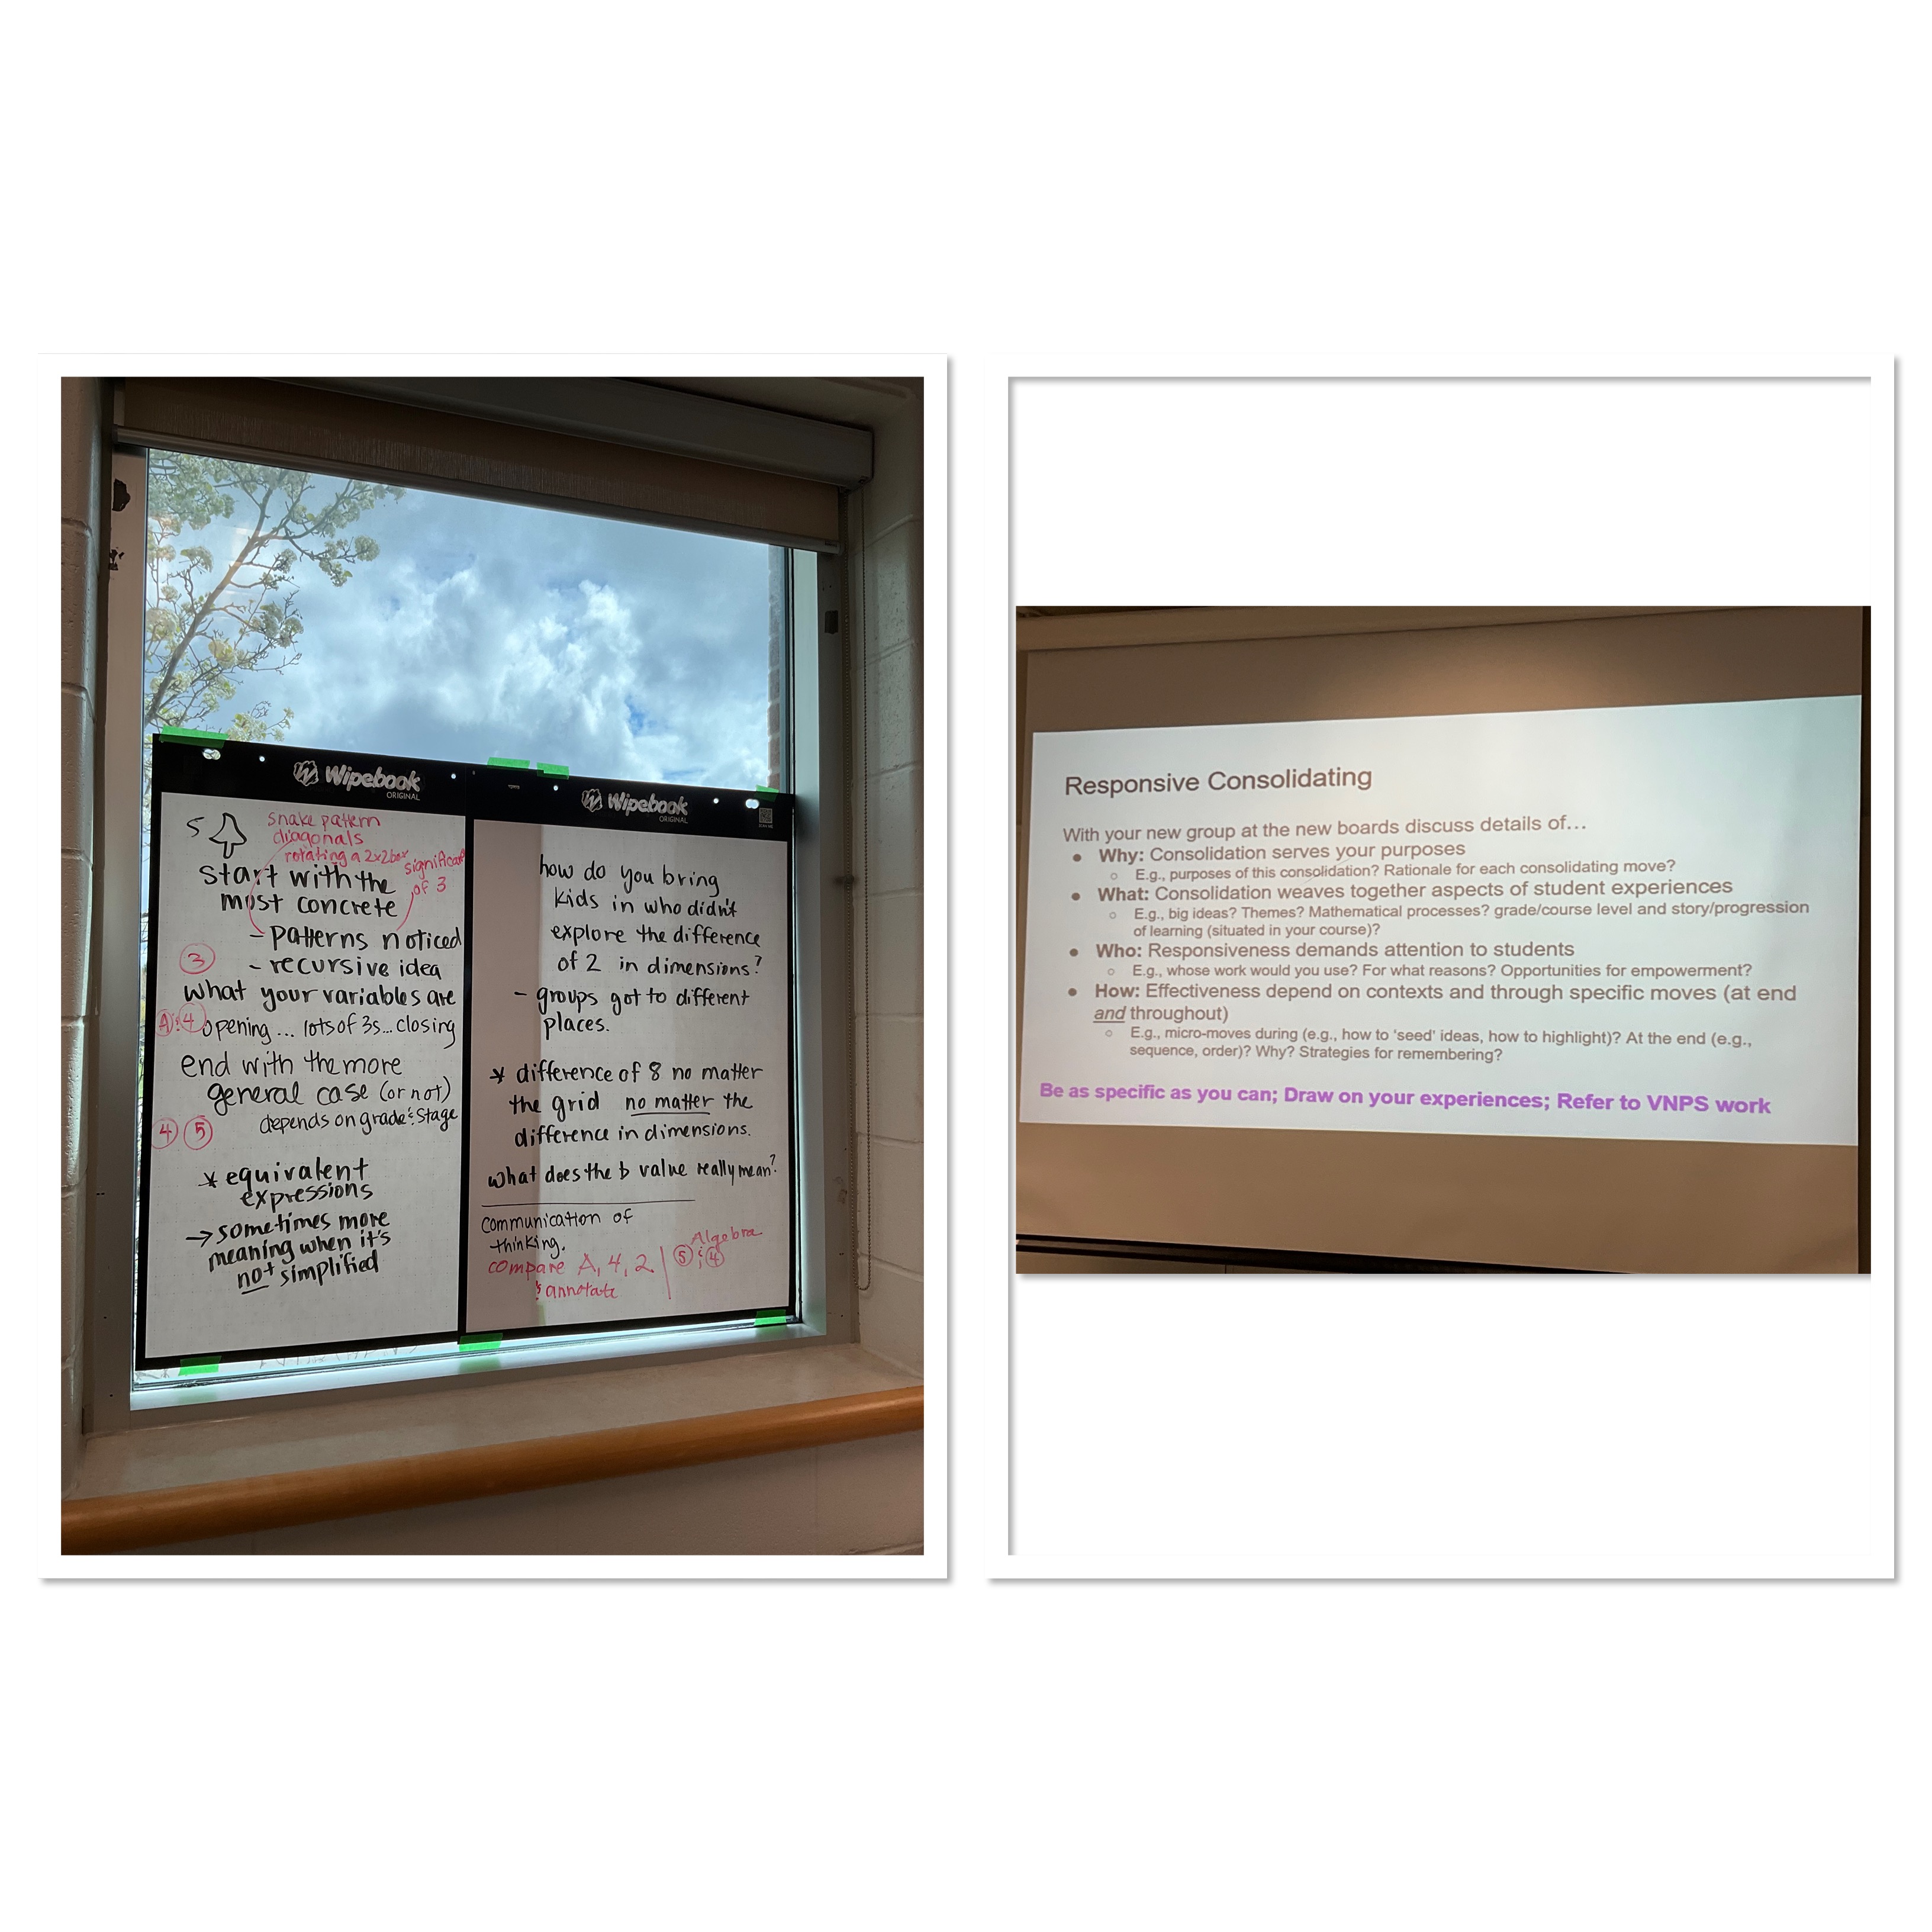
A big part of teaching through tasks is having good tasks that take some time and effort to work through, which can lead to a bit of a messy time consolidating, as not all groups will have had a similar journey through the tasks, and not all communication is clear and easy to follow. It is a good skill to work on: watching the groups, keeping an eye on all of the boards and having a good plan about how to debrief at the end in a way that validates the efforts of all, and the processes that were explored, and highlights the skills we are working on developing.
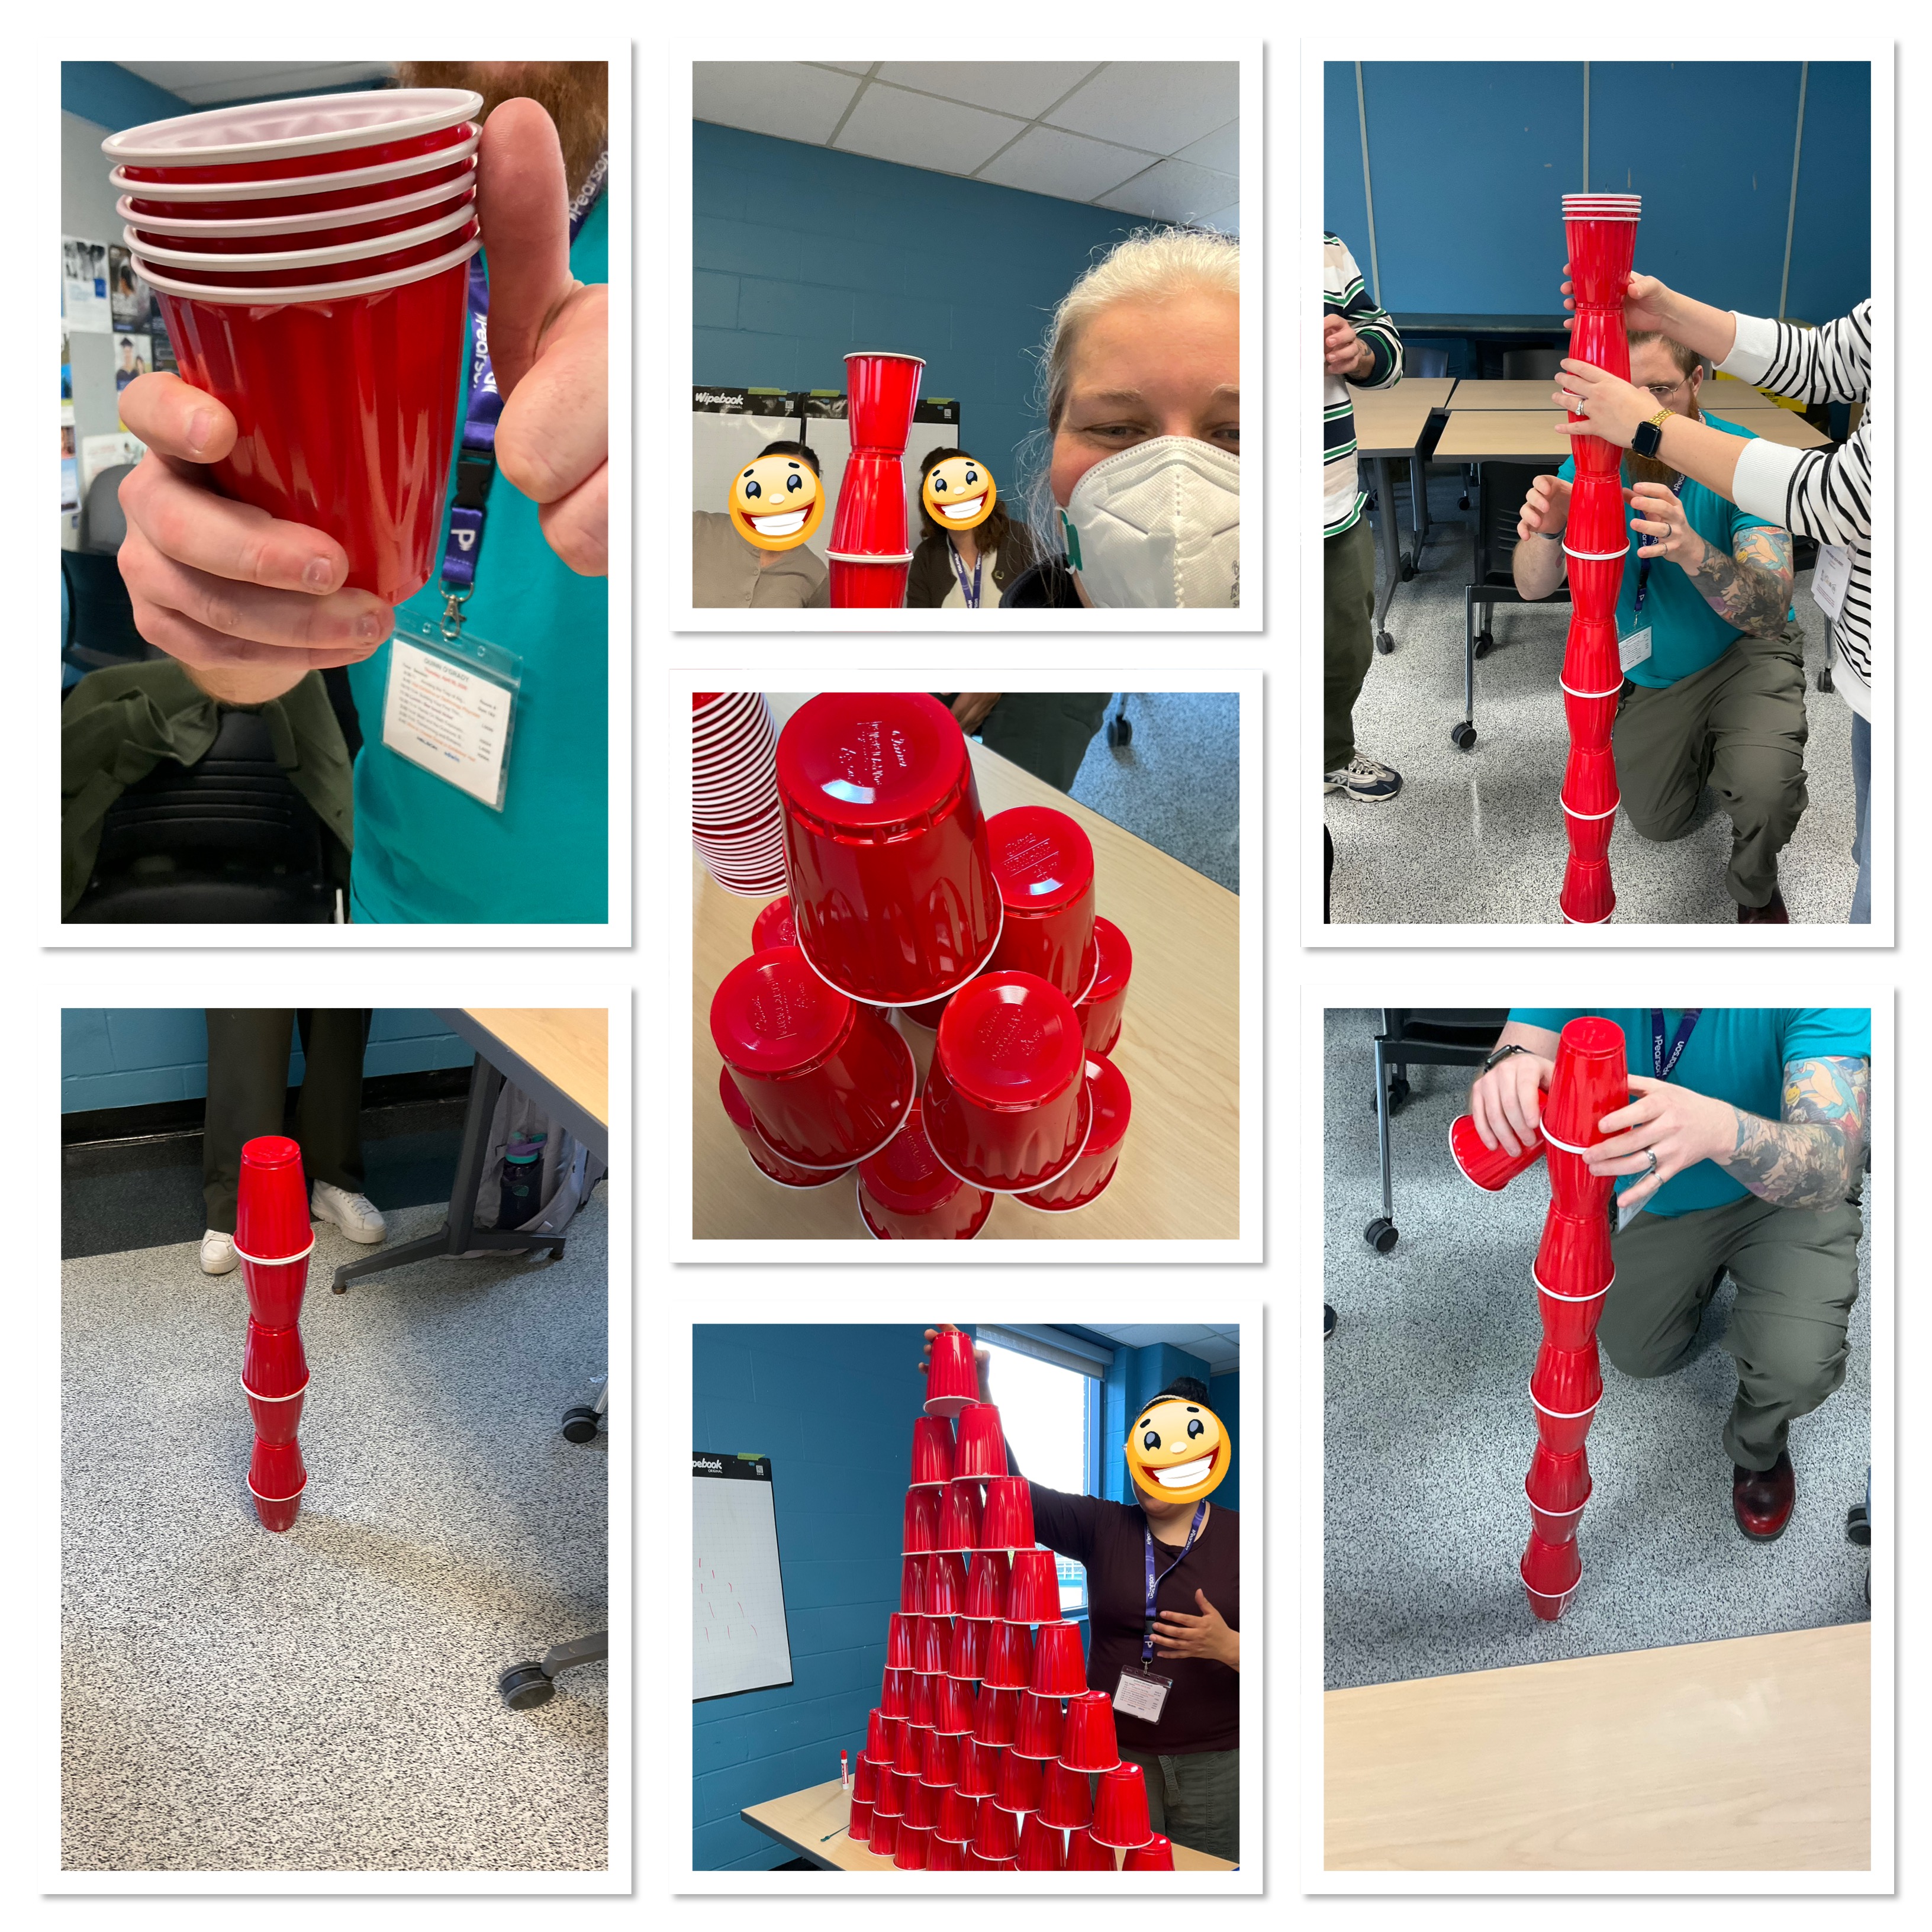
I led a workshop on cup stacking and the algebraic modelling that can be explored through these hands on activities. My slides are in the professional development section of this site.
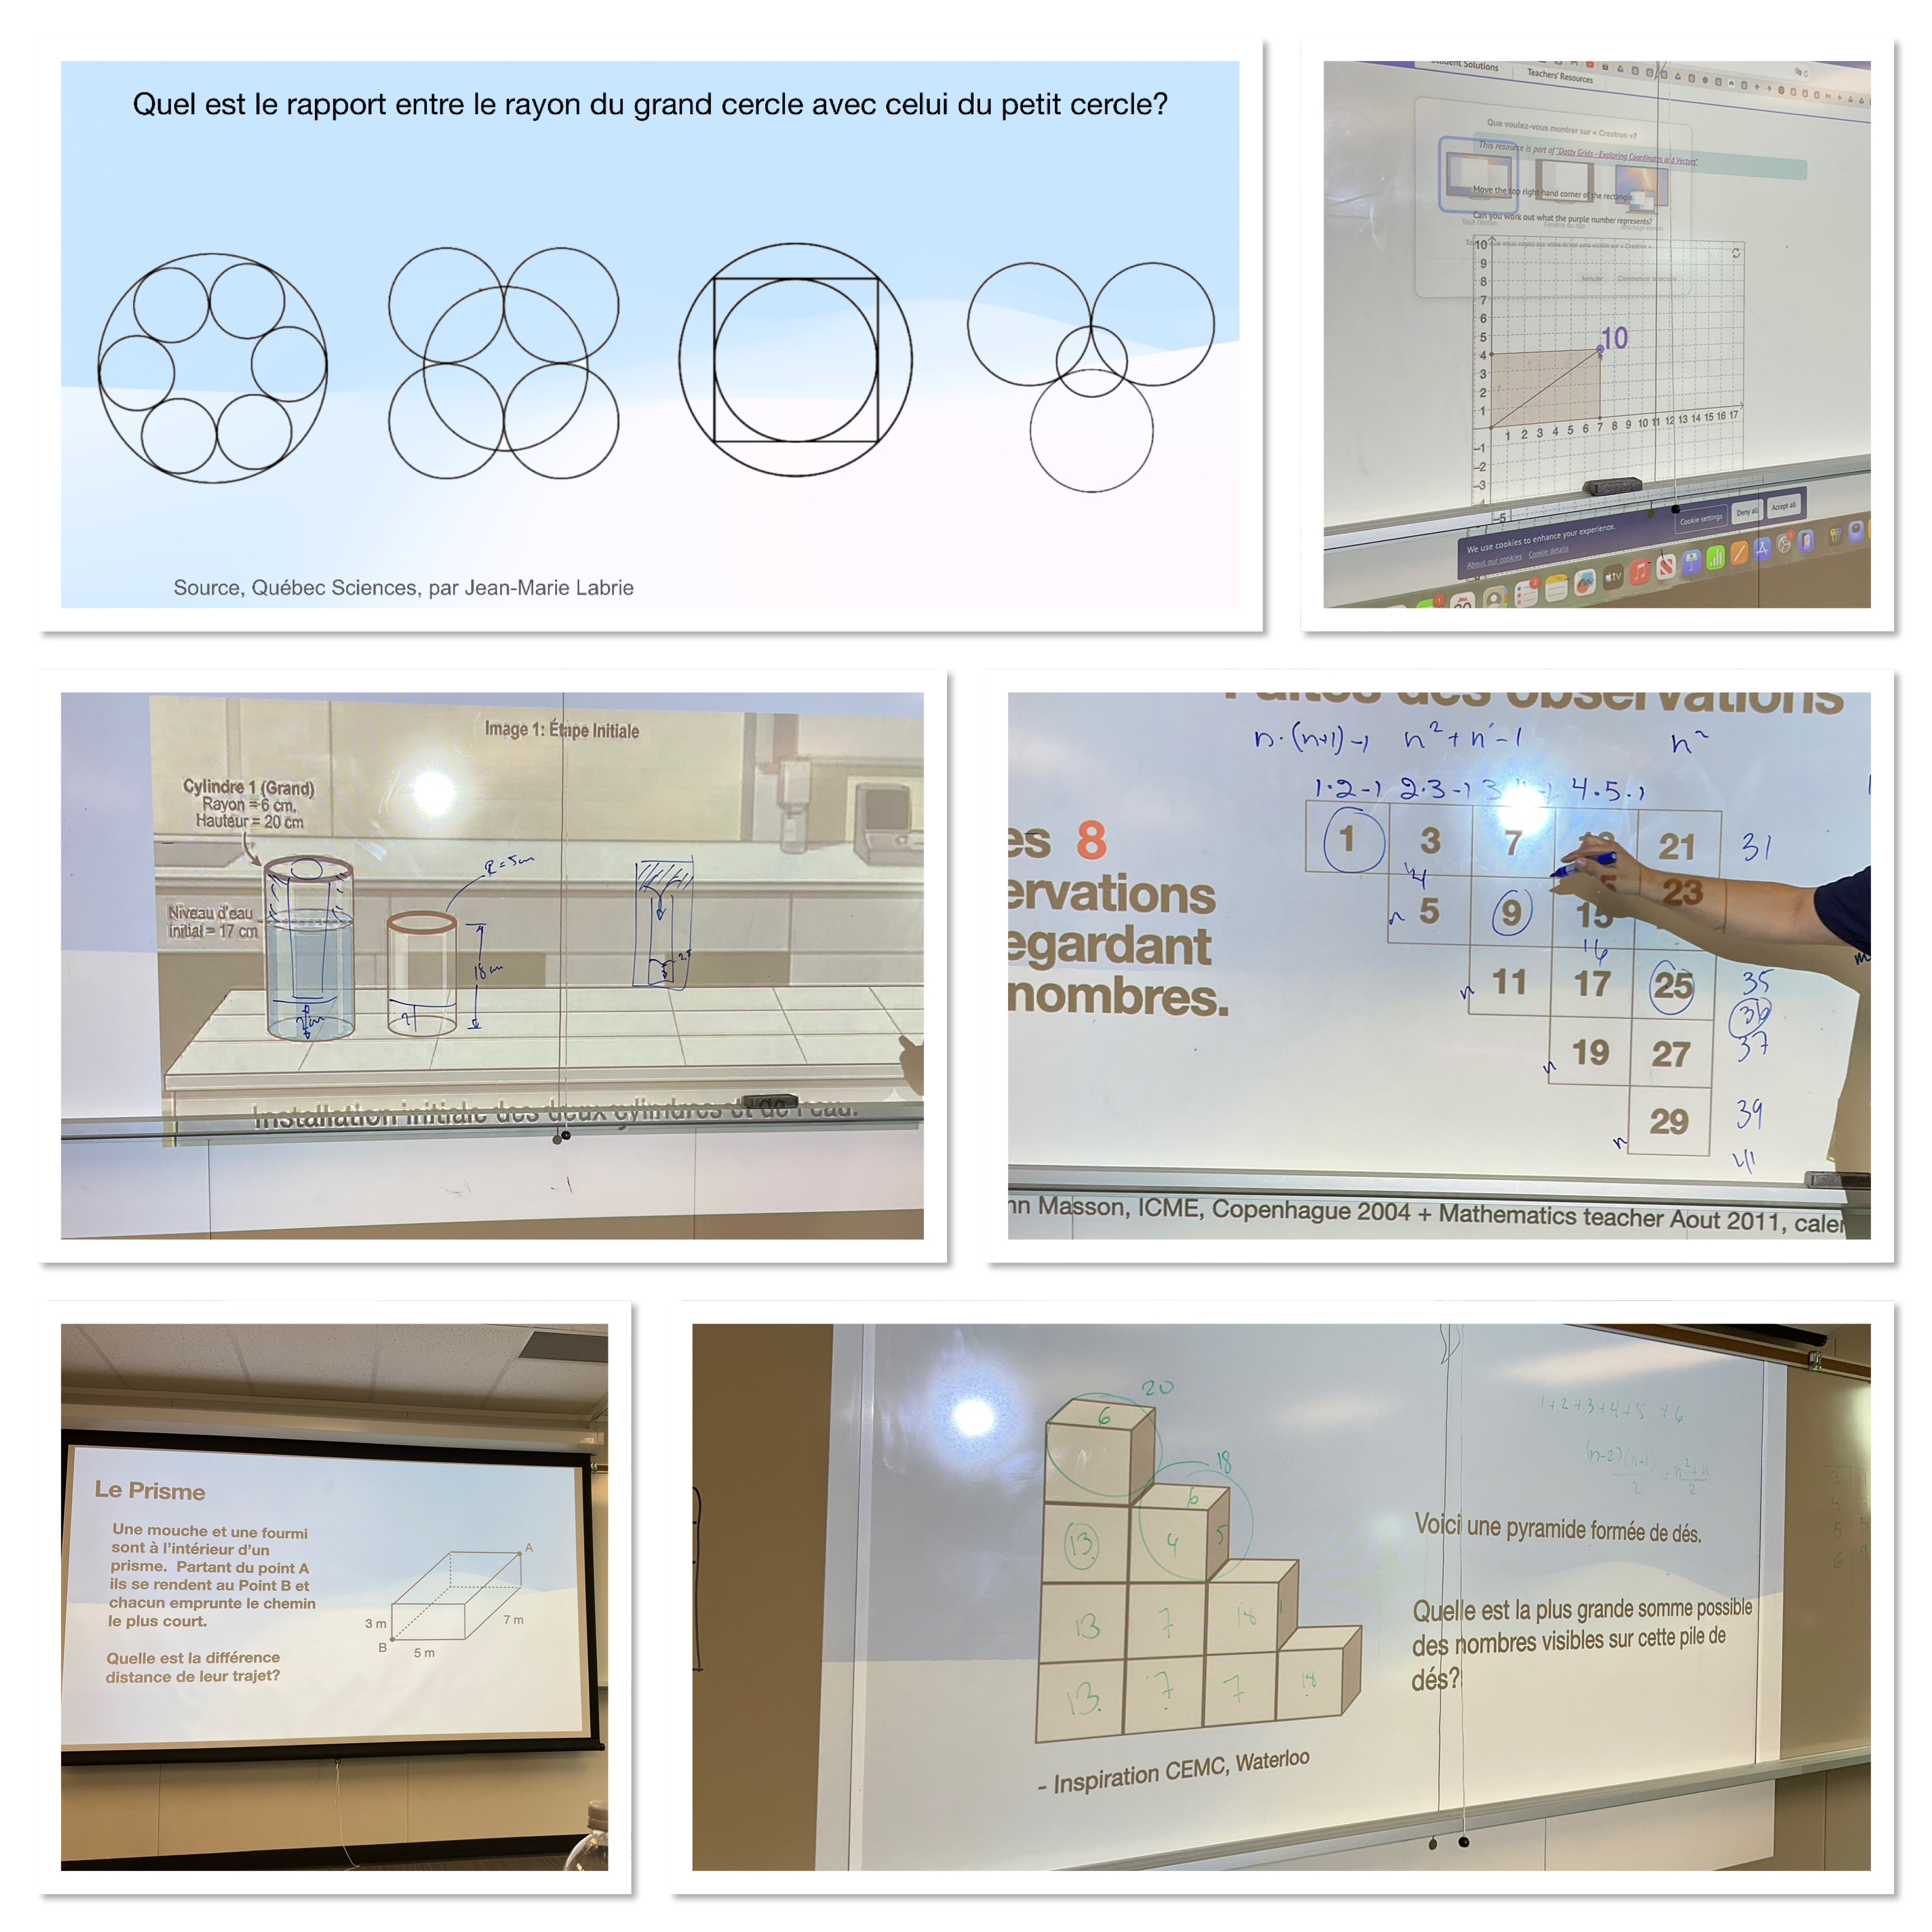
I went to several problem solving sessions, with a goal of getting problems that I can use with my classes and with our grown up math club. One session was in French, and it was so nice to get resources in French for my immersion classes. It was a nice small group so we all worked together to explore the problems.
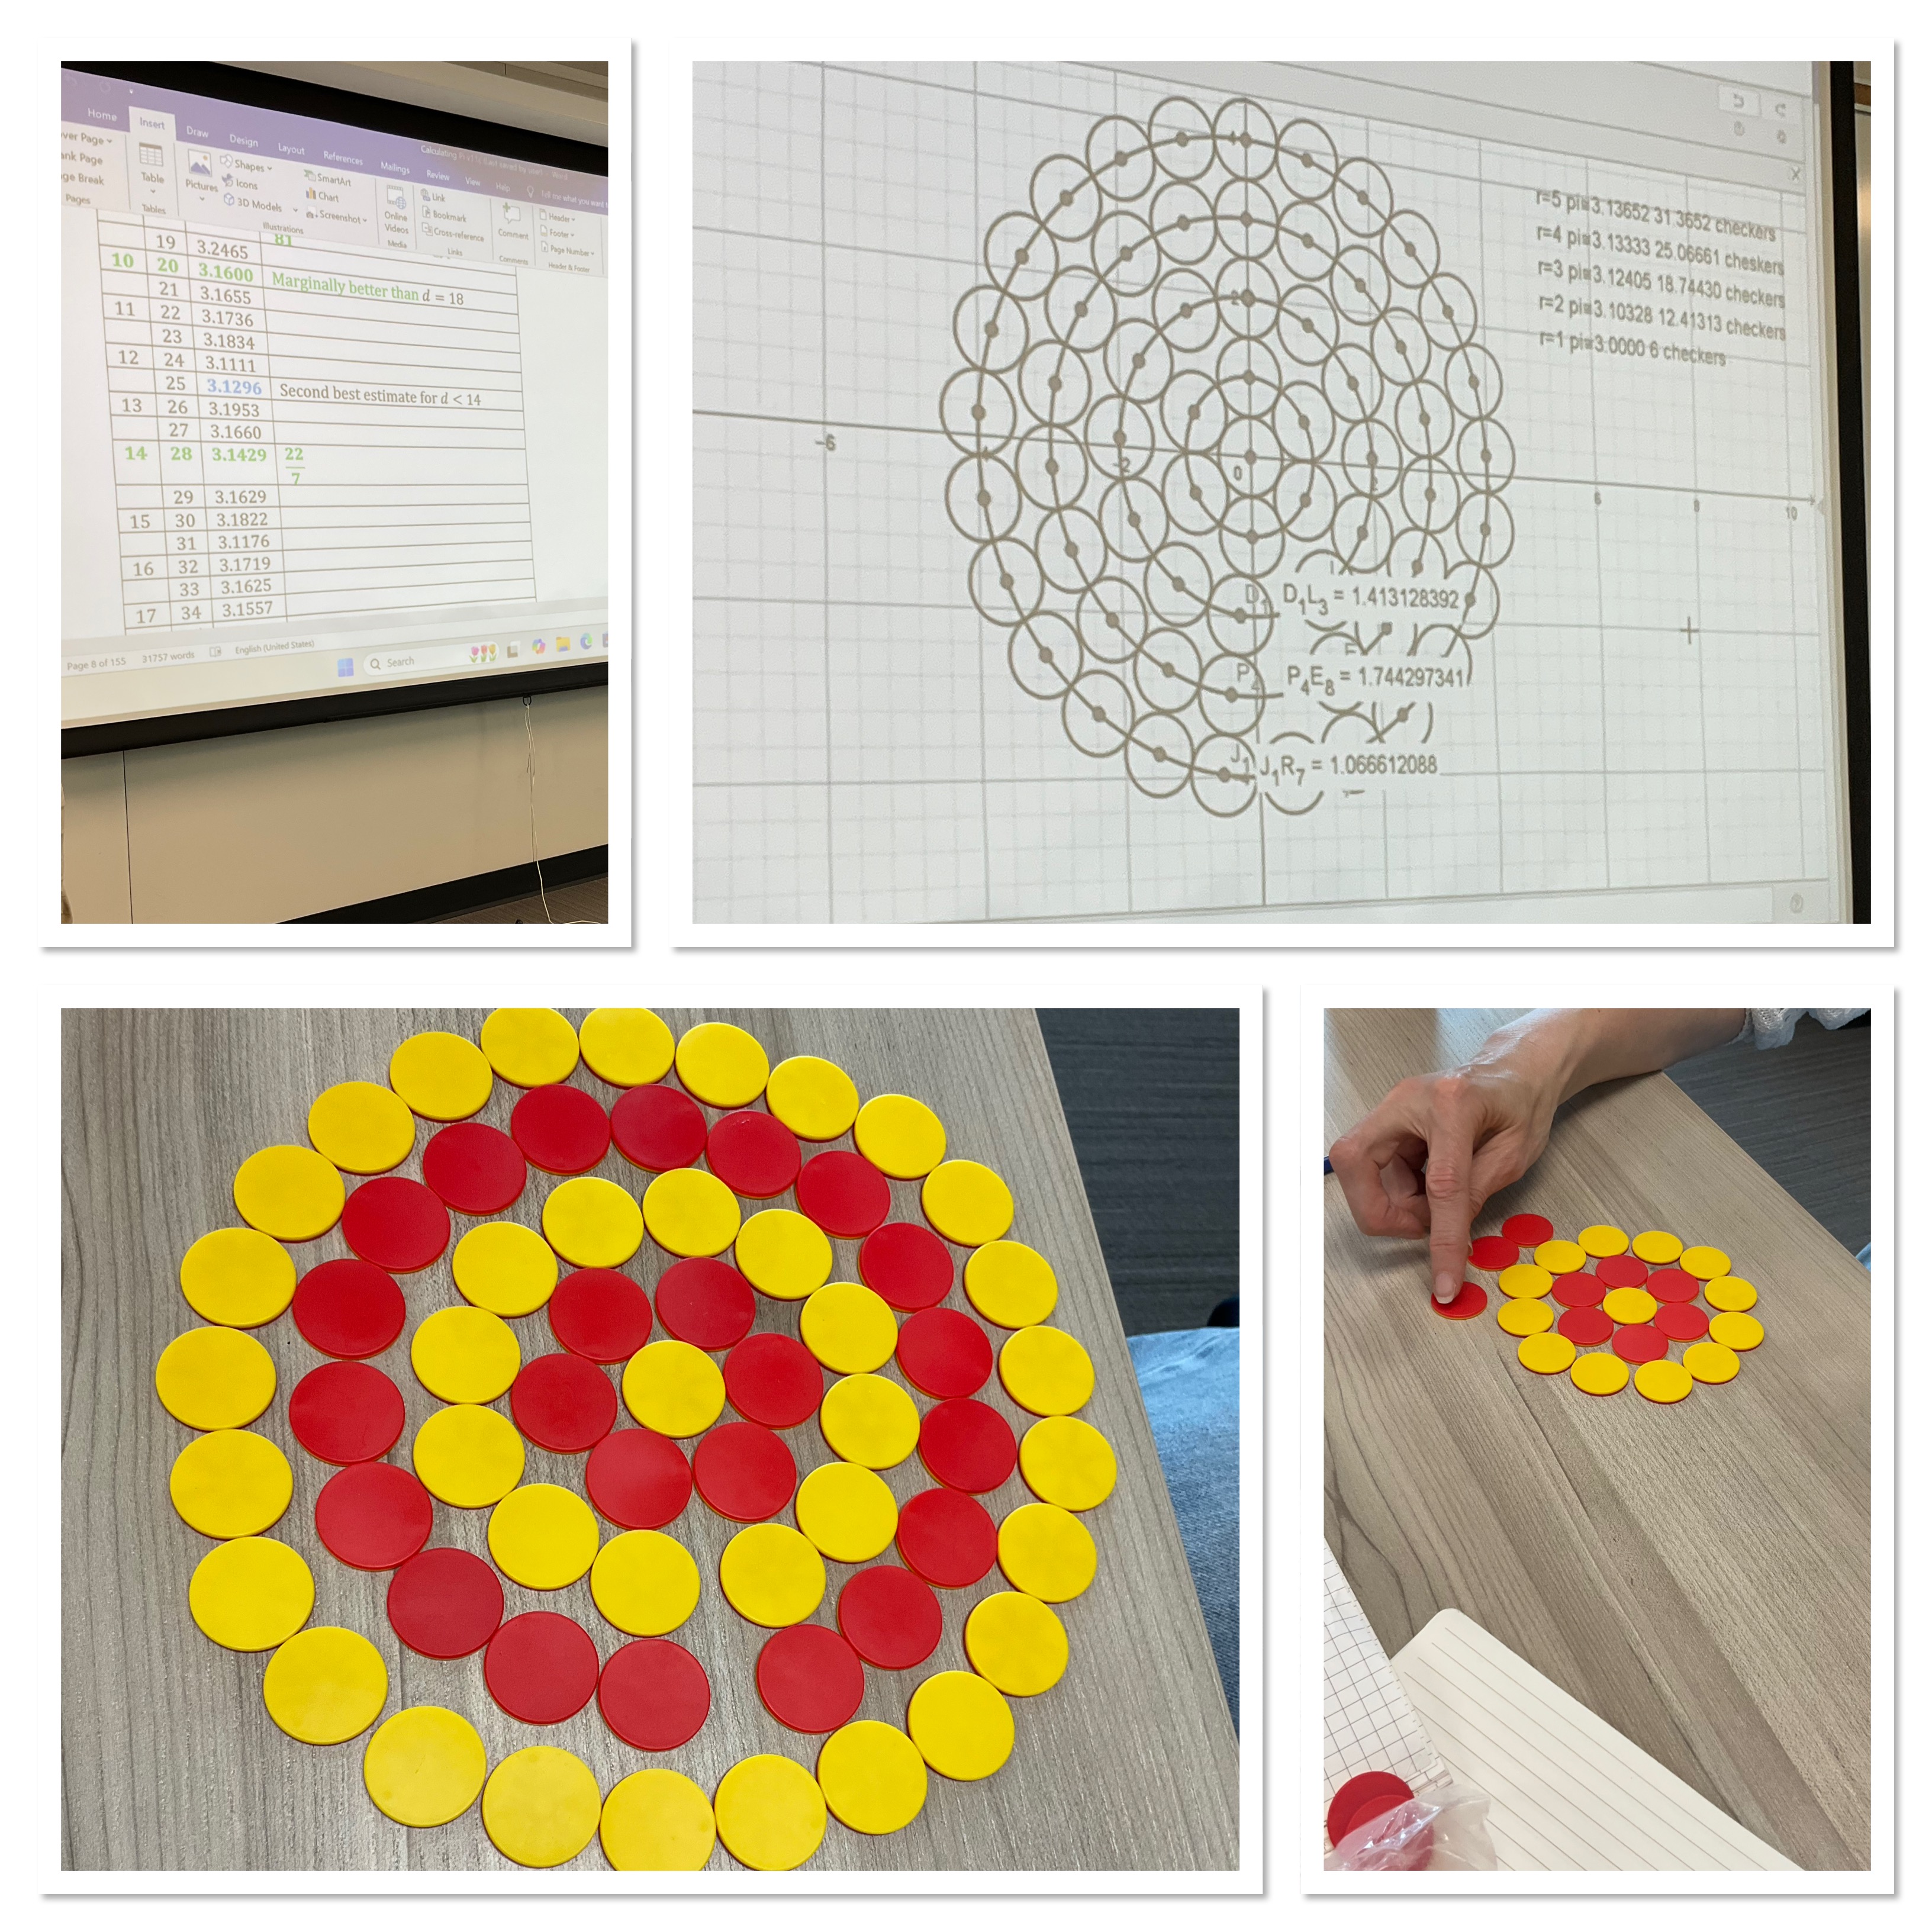
Another session I attended was all about the historical ways to calculate pi. It was all a bit over my head, as I’ve never thought about how someone might have done this way back before writing implements existed. One of the neat approaches was using rings of circles and ratios. Someone in the room had just bought some counters so we tried to build a model to help us understand.
I’m glad to have heard so many good keynote addresses, and attended such well organized workshop sessions. I’m looking forward to attending in Ottawa in 2028.
Gas Cost
I’m heading to OAME in London, and my grade 9s helped me determine how much I will spend on gas for the trip. We looked up on a map that it will be 440km from Kingston to London. Gas today costs $1.64/L and then we needed to find how much gas it takes to drive my car for a certain distance, the fuel efficiency. Looking up online we saw that my car has an efficiency of 7.5L/100km.
Groups used different strategies to do calculations, and it’s interesting to see how they approached the task.
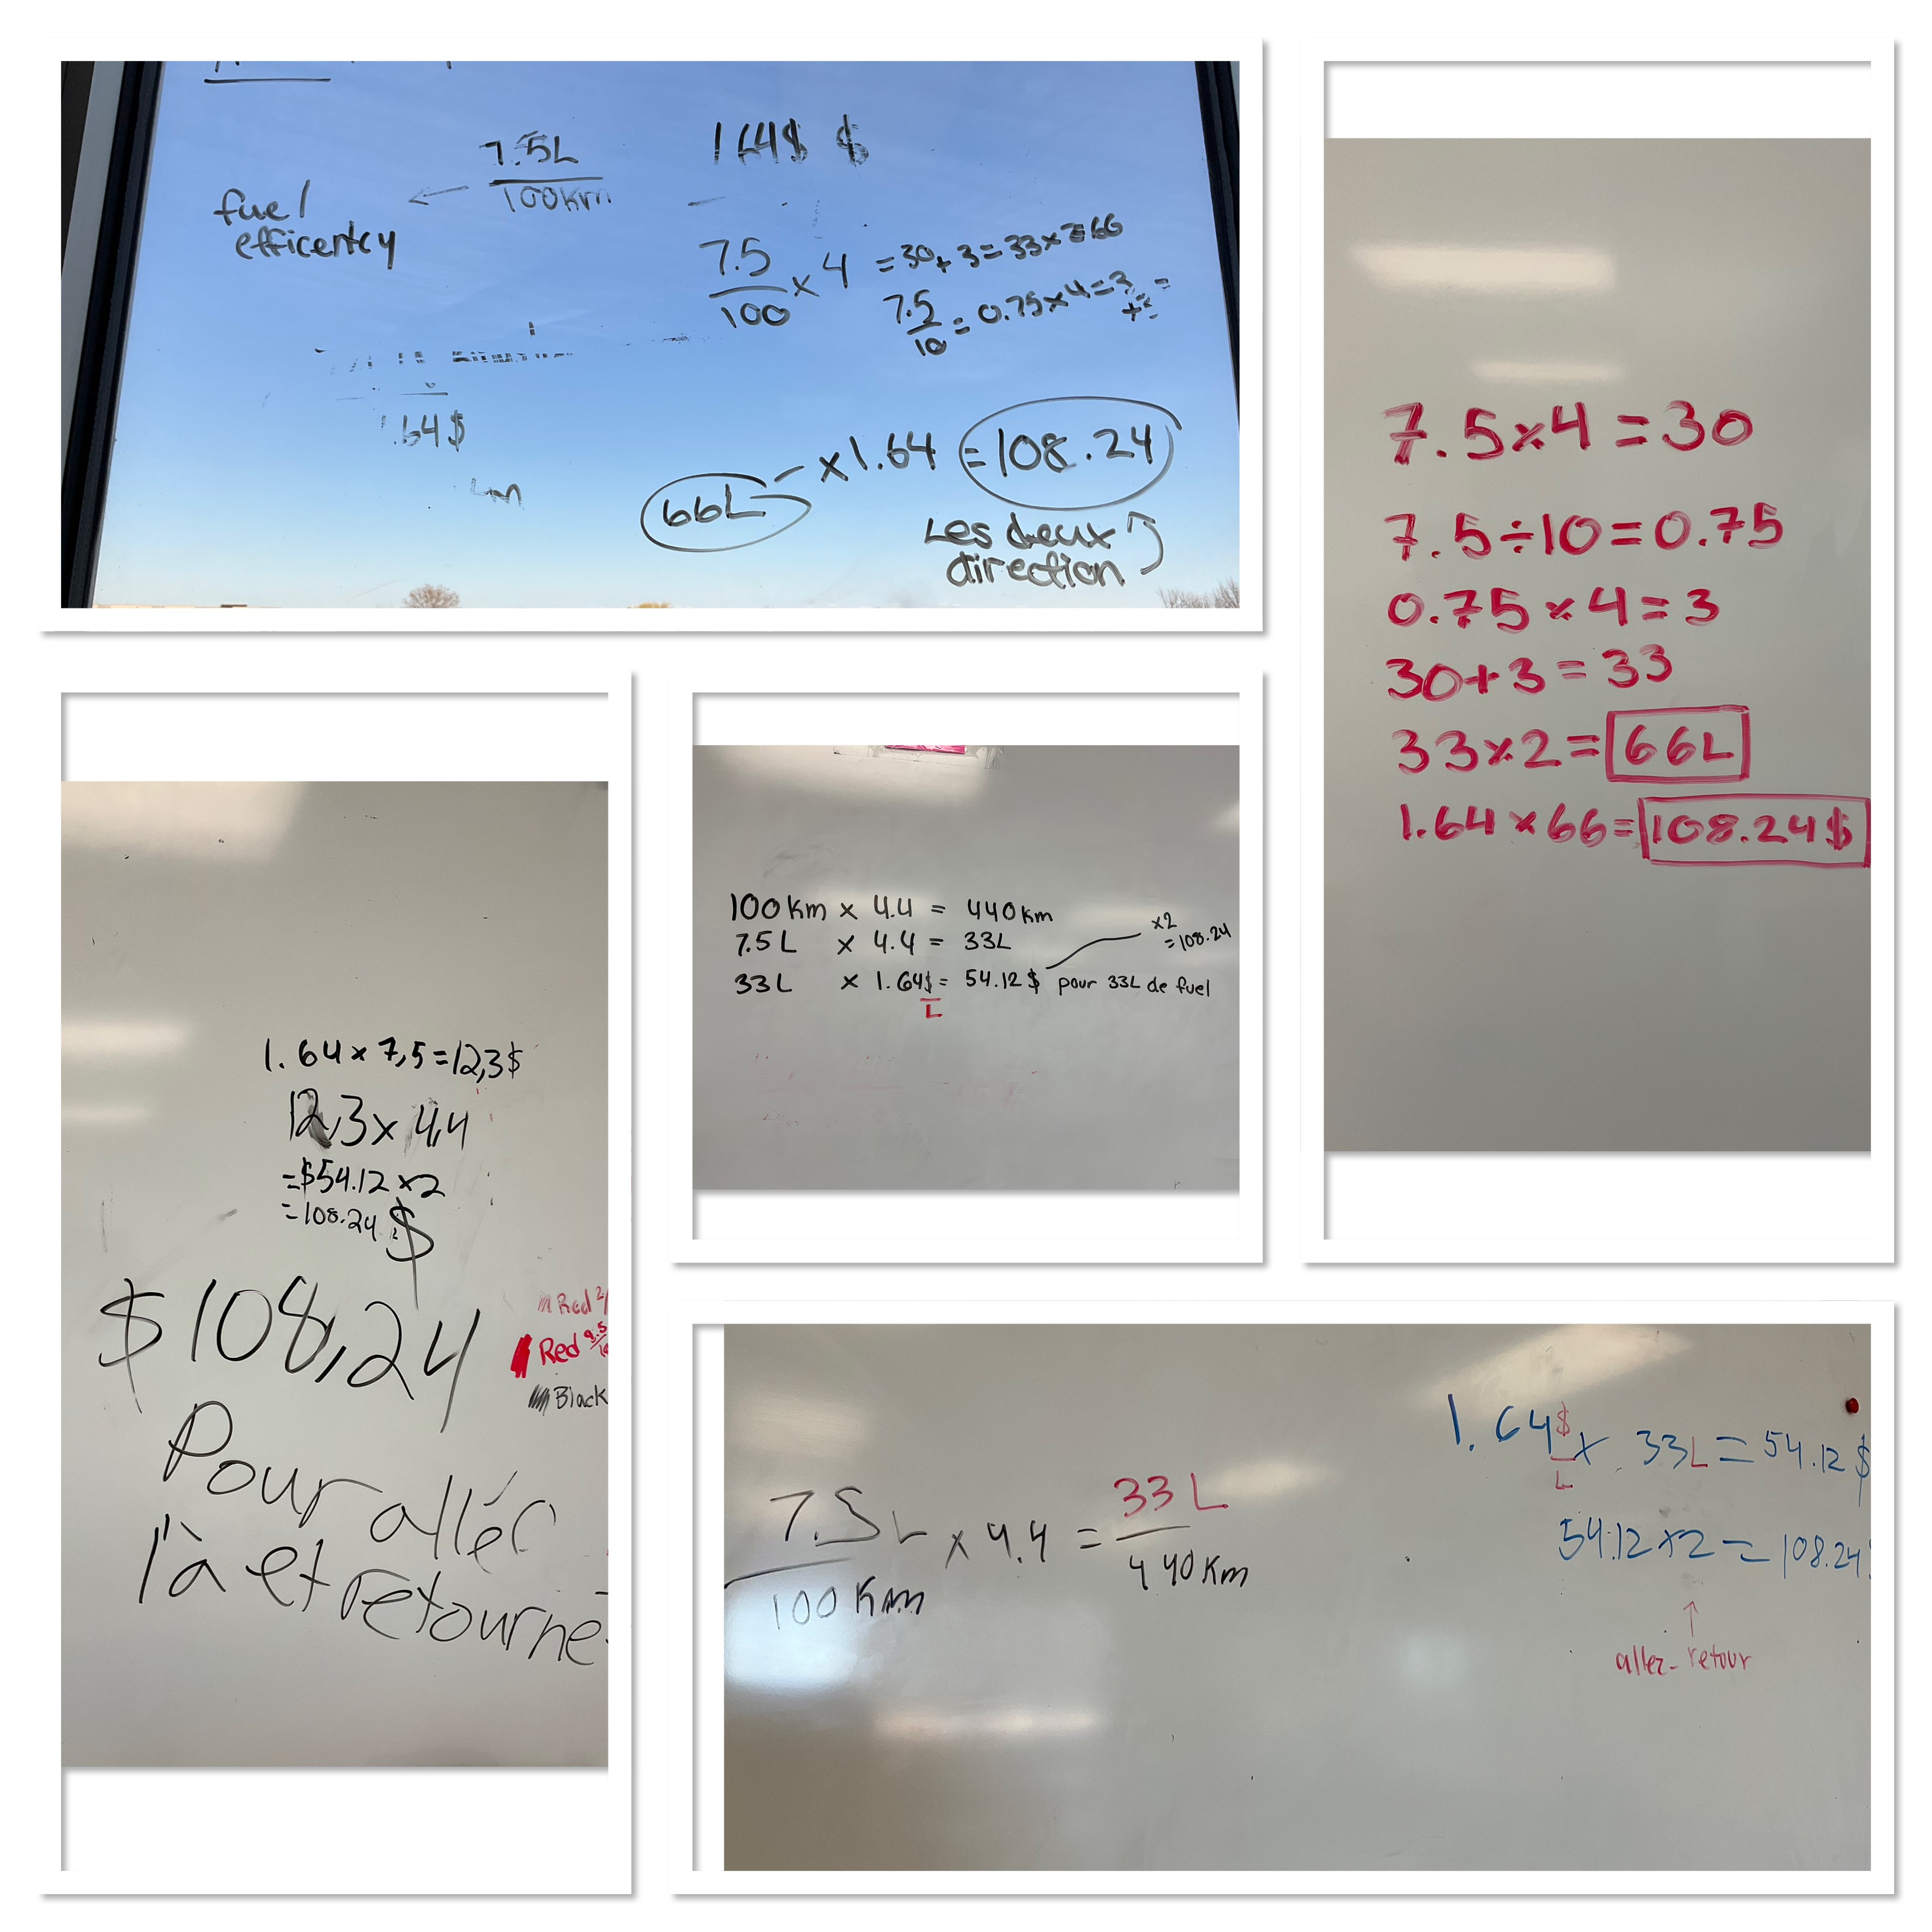
Some started by multiplying 7.5×4 which is 30, which makes sense because it’s 7.5L per 100km and there are 4 groups of 100km in 440km (the total distance). Next we need to multiply 7.5 by 0.4 since there’s a total of 4.4 groups of 100 km in 440km. To do this multiplication some groups divided 7.5 by 10 which is 0.75 to find out the value for 1 tenth and then multiplied by 4 to get the value for 4 tenths (which is 3). The final value for 7.5×4.4 is then 33. All of this can be done without a calculator. This tells us how many litres are needed for a one way trip. Since we’re going both ways we need twice that, so 66L. Next we multiply by the price per L.
Other groups started multiplying 1.64 by 7.5 which gives the price for the gas that will take you 100km. Then you multiply by 4.4 to get the price for 440km, then double it for the entire journey.
Some groups wrote it all down like fractions and proportions, and others wrote out their steps one at a time.
I’m glad to see a variety of strategies. Students are using methods that make sense to them, not just memorizing one way to solve a problem. I’m glad to help them develop a more deep connection and understanding of their numeracy skills.
Solving Ratios and Proportions
Grade 9s have been working on fraction skills lately. Today we worked on solving questions with ratios and proportions.
We used a few strategies: for some questions we looked at creating equivalent fractions by multiplying the numerator and denominator by the same values. If we multiply the denominator 5 by 6 to create 30, we need to multiply the numerator x by 6 to create 2. We can then solve for x.
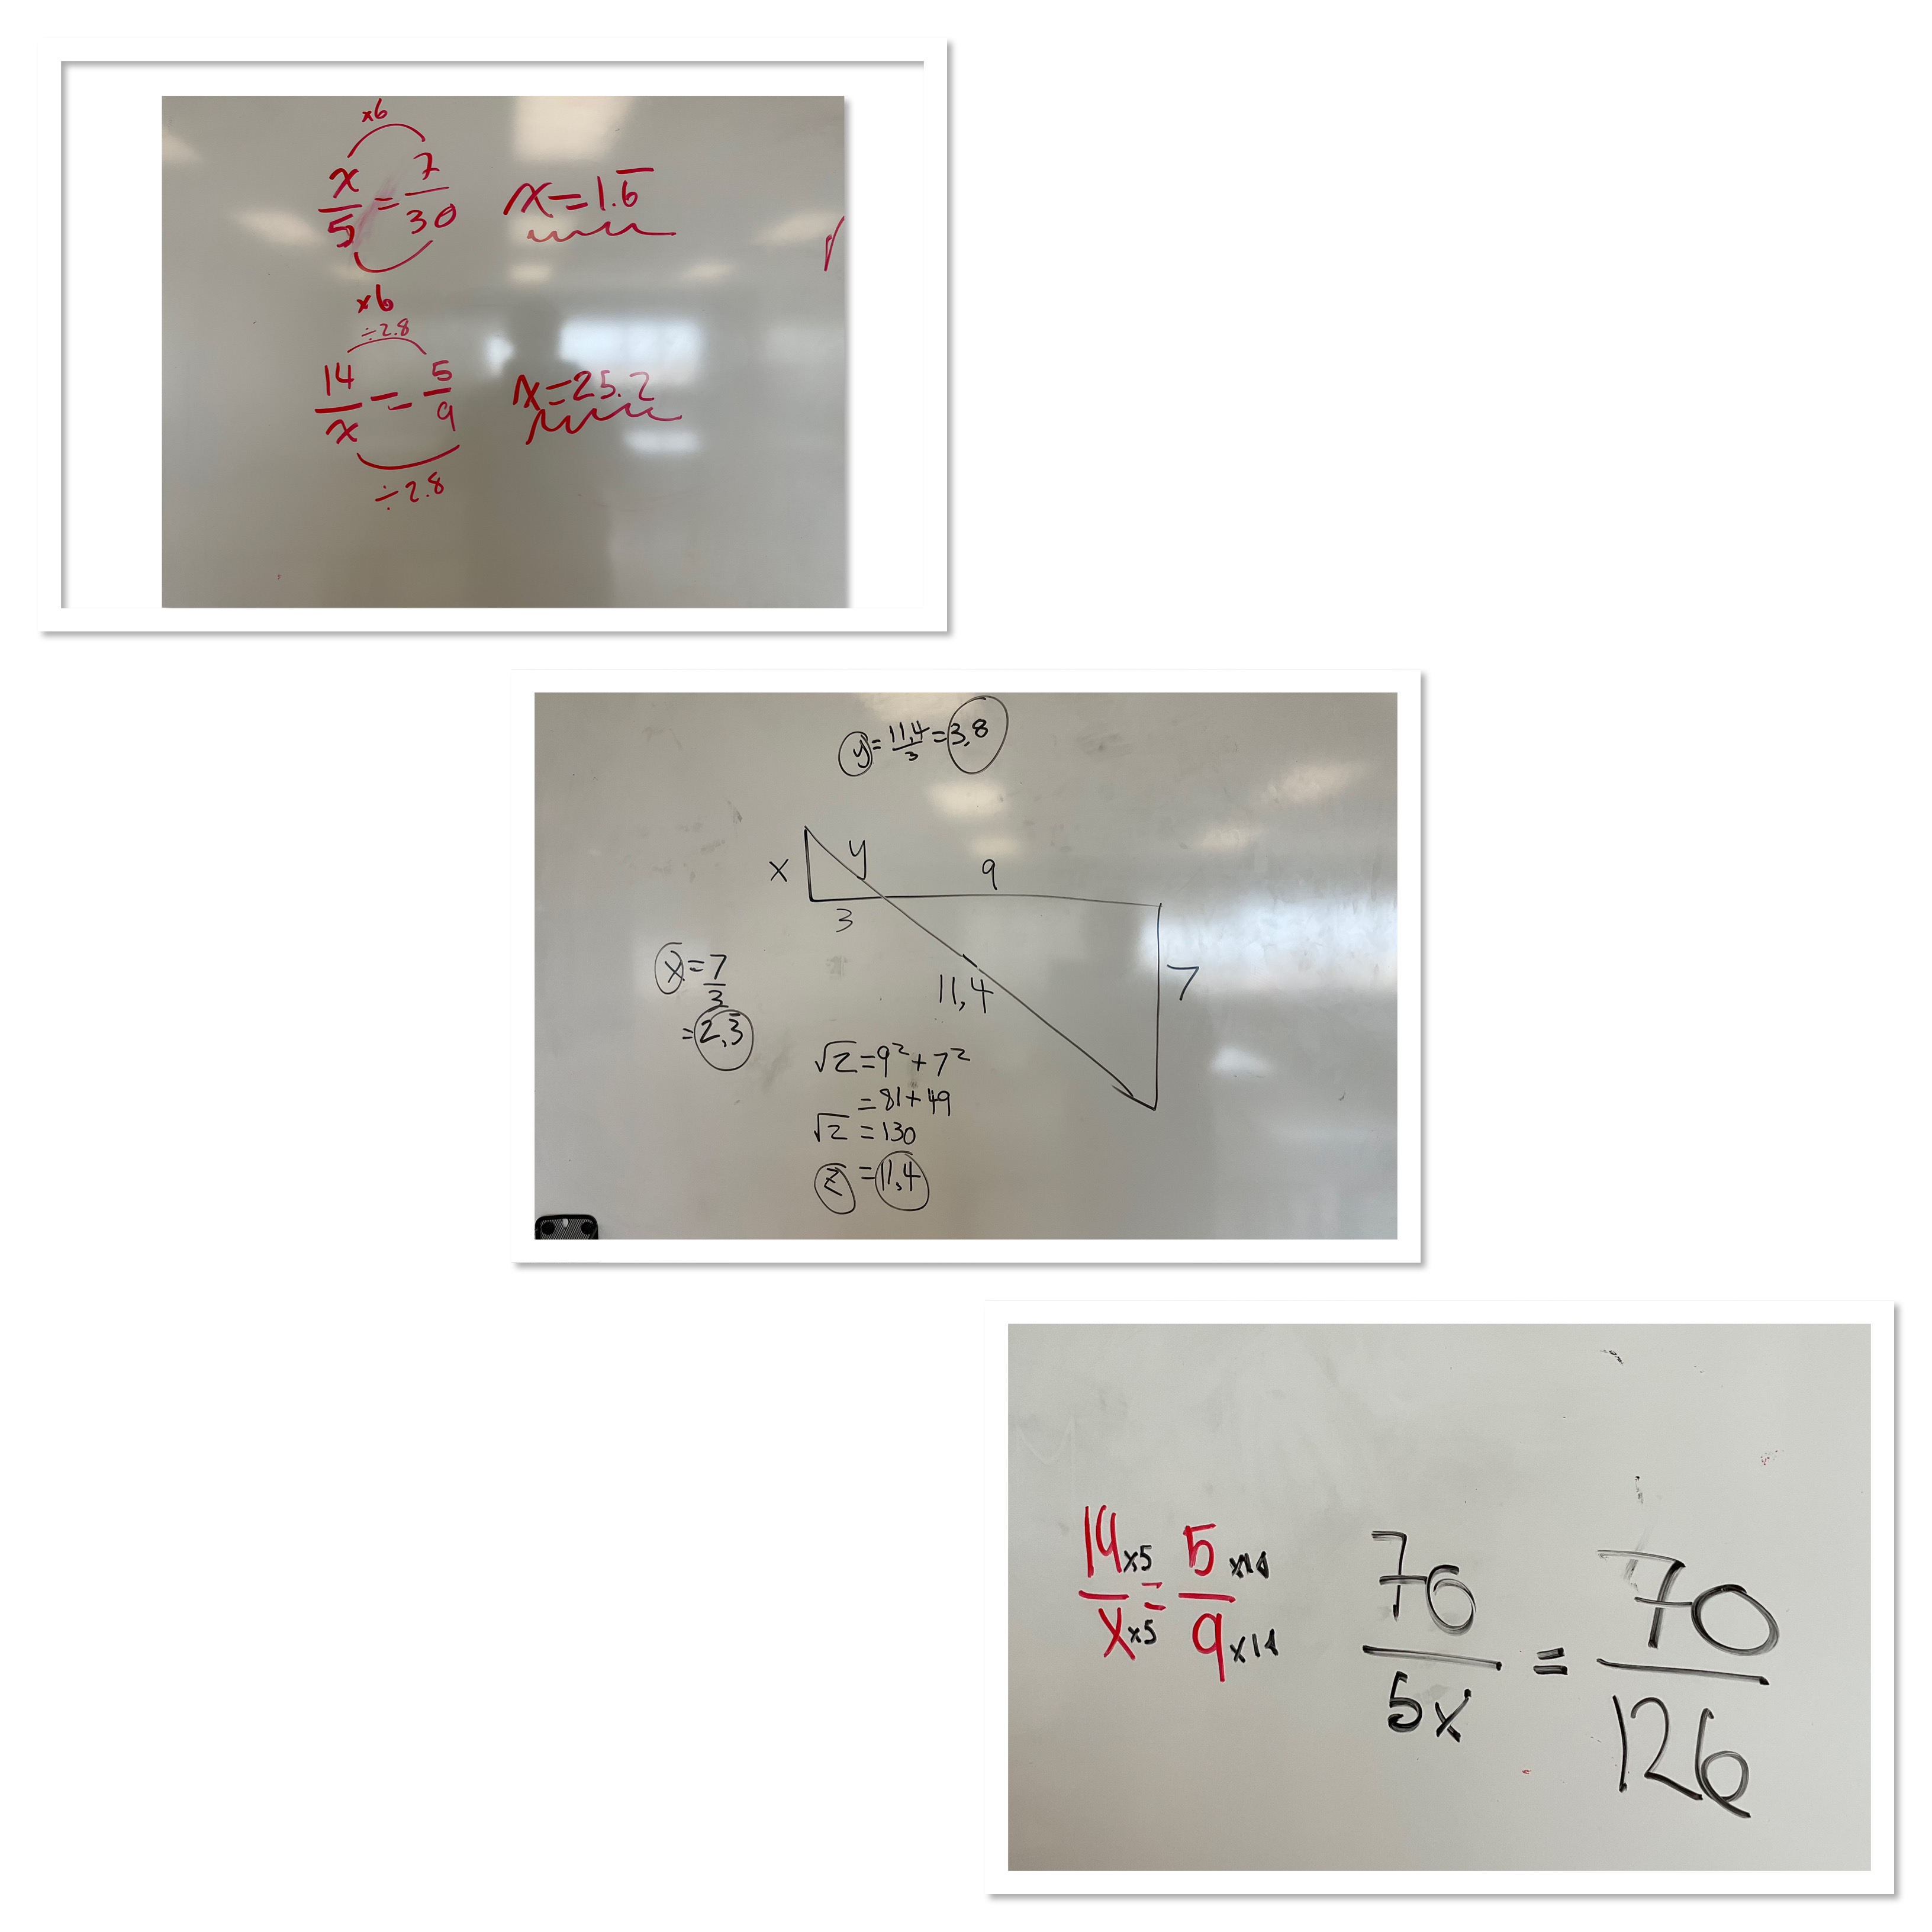
We also found a strategy of making common numerators, or common denominators. We know that if 2 fractions are equal, if we can make the numerators equal, then we know the denominators will be equal. In this example above, we make the numerators both 70. This leaves us with denominators of 5x and 126 which are both equal as well. We can then solve the equation 5x=126.
We also saw how this skill can help us solve proportions in similar triangles. It was a busy day with lots of solving and working together.
Special Triangles
Grade 11s constructed special triangles today. We started with a square with any length sides. We cut it on the diagonal to make an isosceles right triangle. We calculated the length of the hypotenuse, and the acute angles (both 45 degrees), then we wrote the simplified trigonometric ratios.
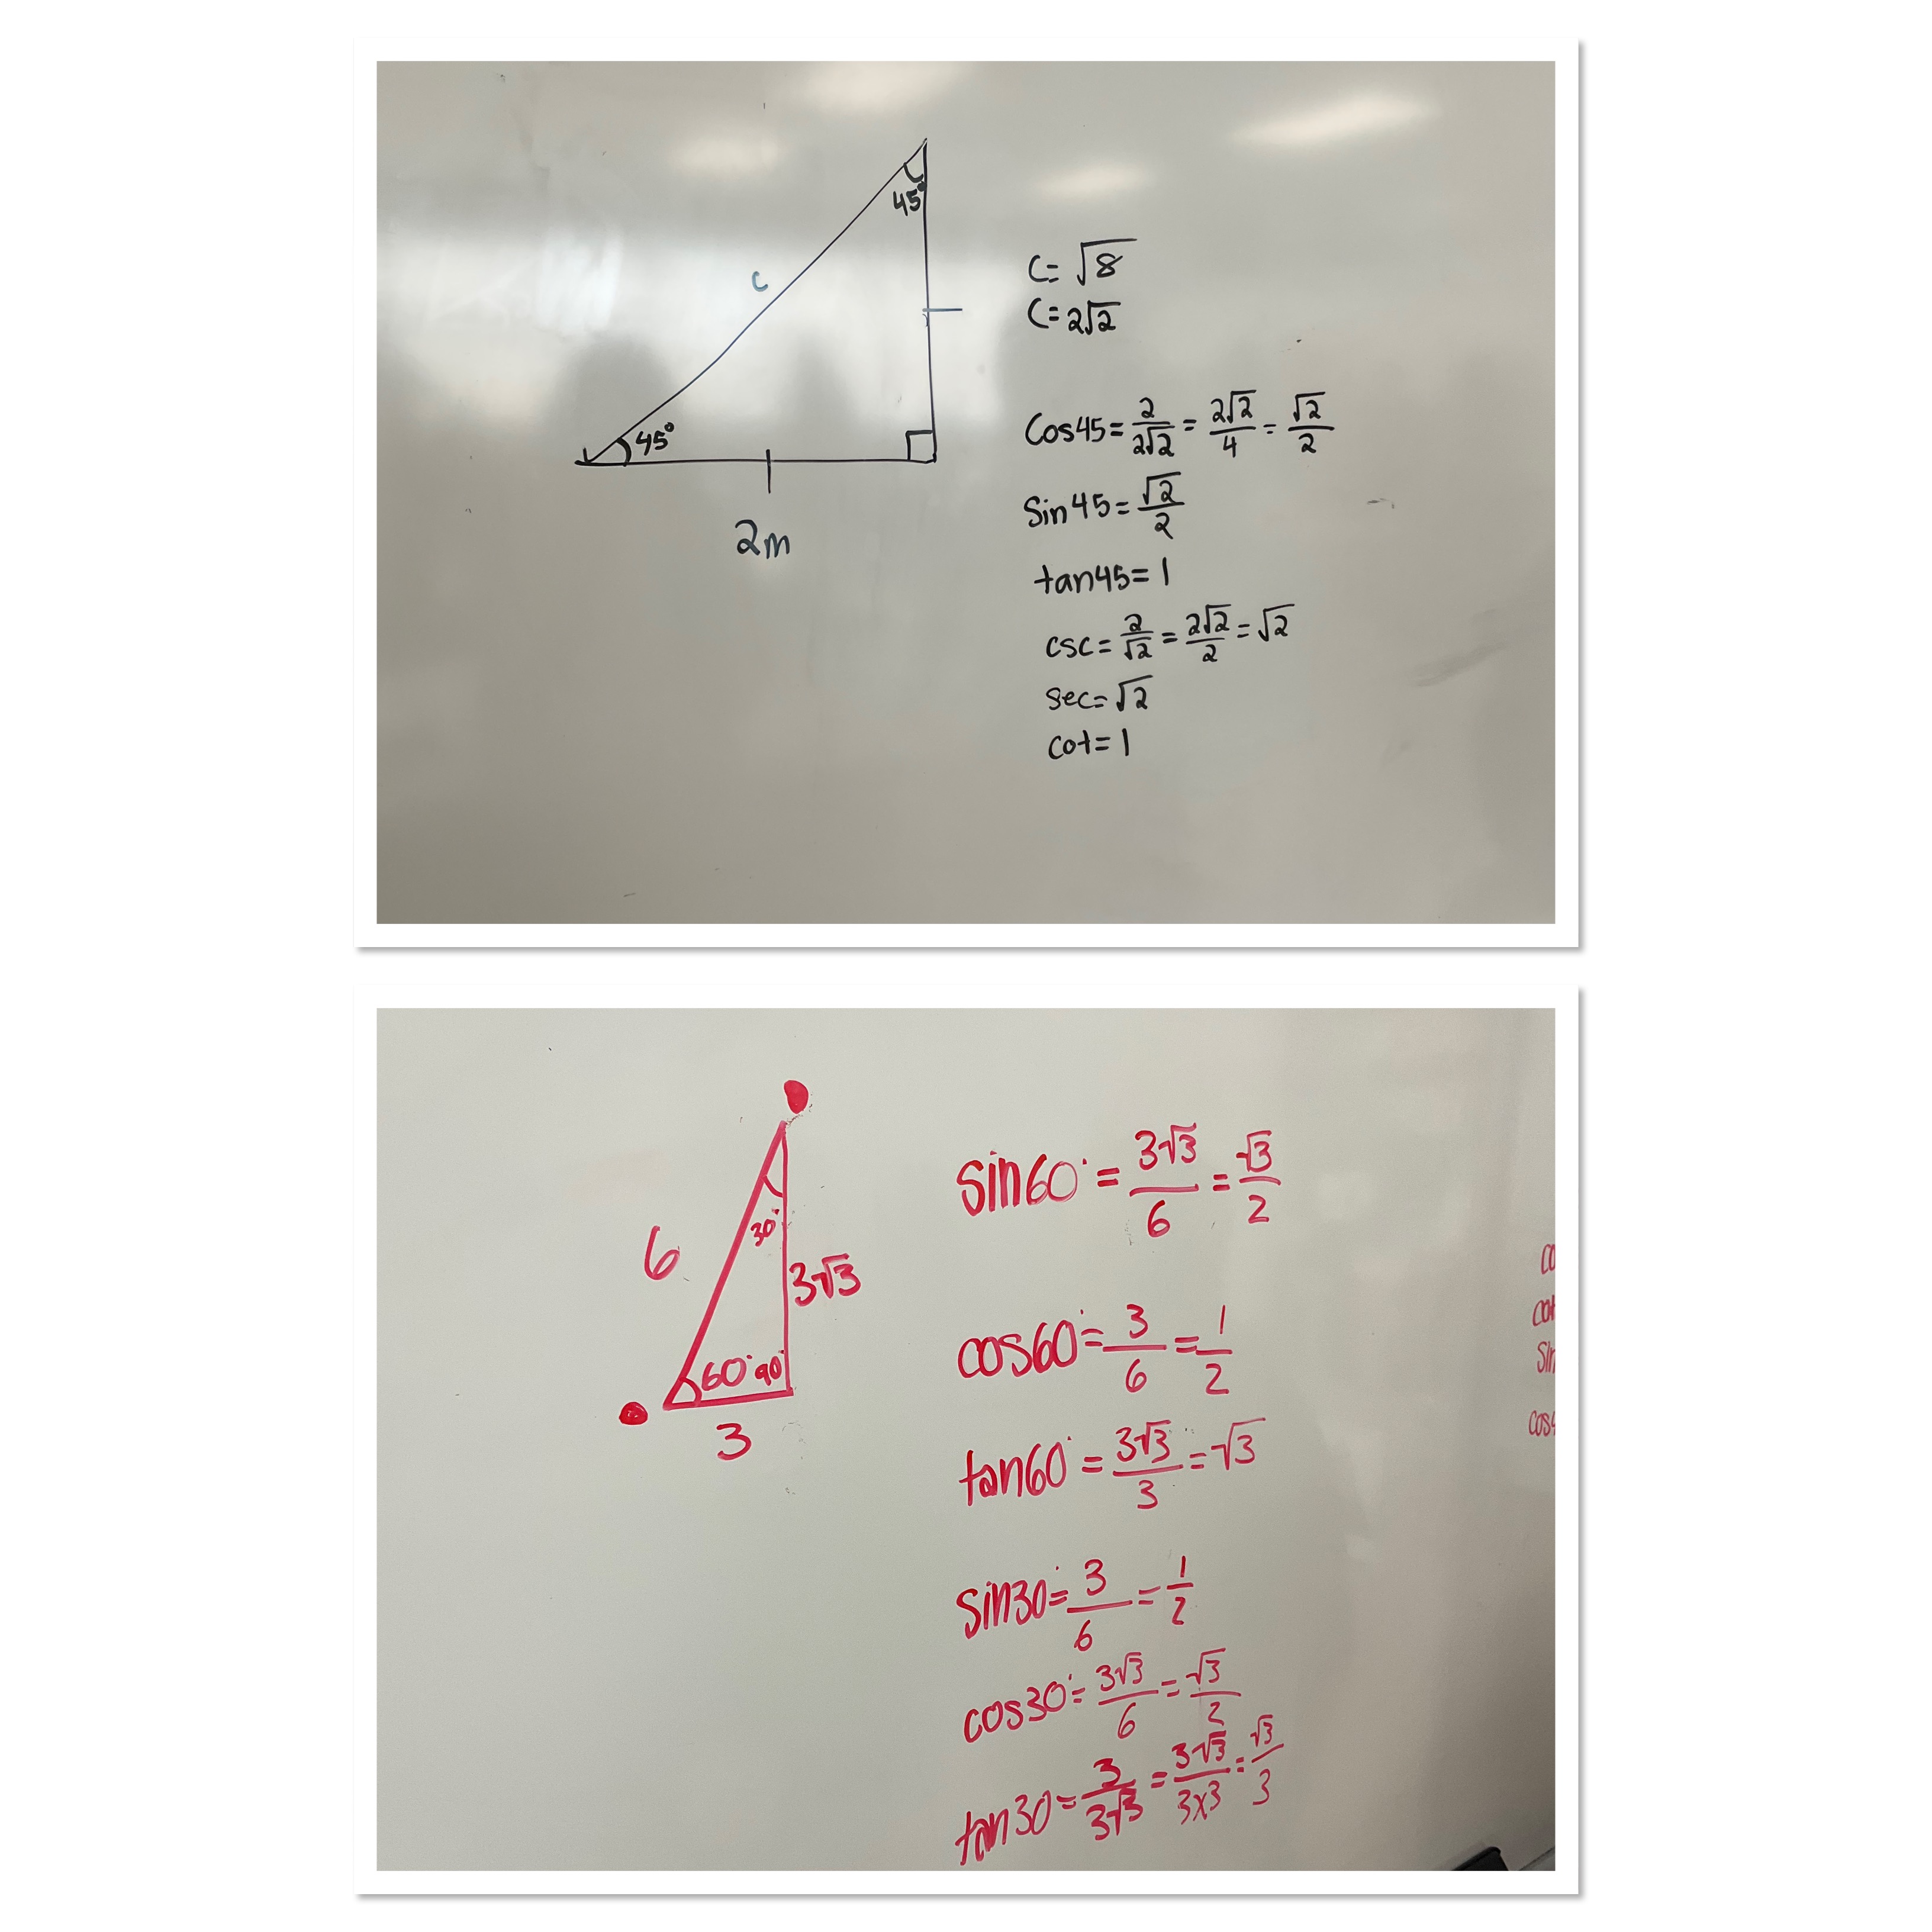
We did the same with an equilateral triangle, sliced in half to create a 30, 60, 90 triangle. We calculated the height of the triangle, and then wrote out all of the simplified trig ratios for each acute angle.
We have engraved these special triangles into our memory, bu even if we forget, hopefully the derivation of them will stick in our memory and we could do it again if we needed to.
Welcome to Trigonometry
Grade 11s are starting trigonometry, and we have spent some time learning reciprocal trig ratios, practicing how to solve for sides and angles.
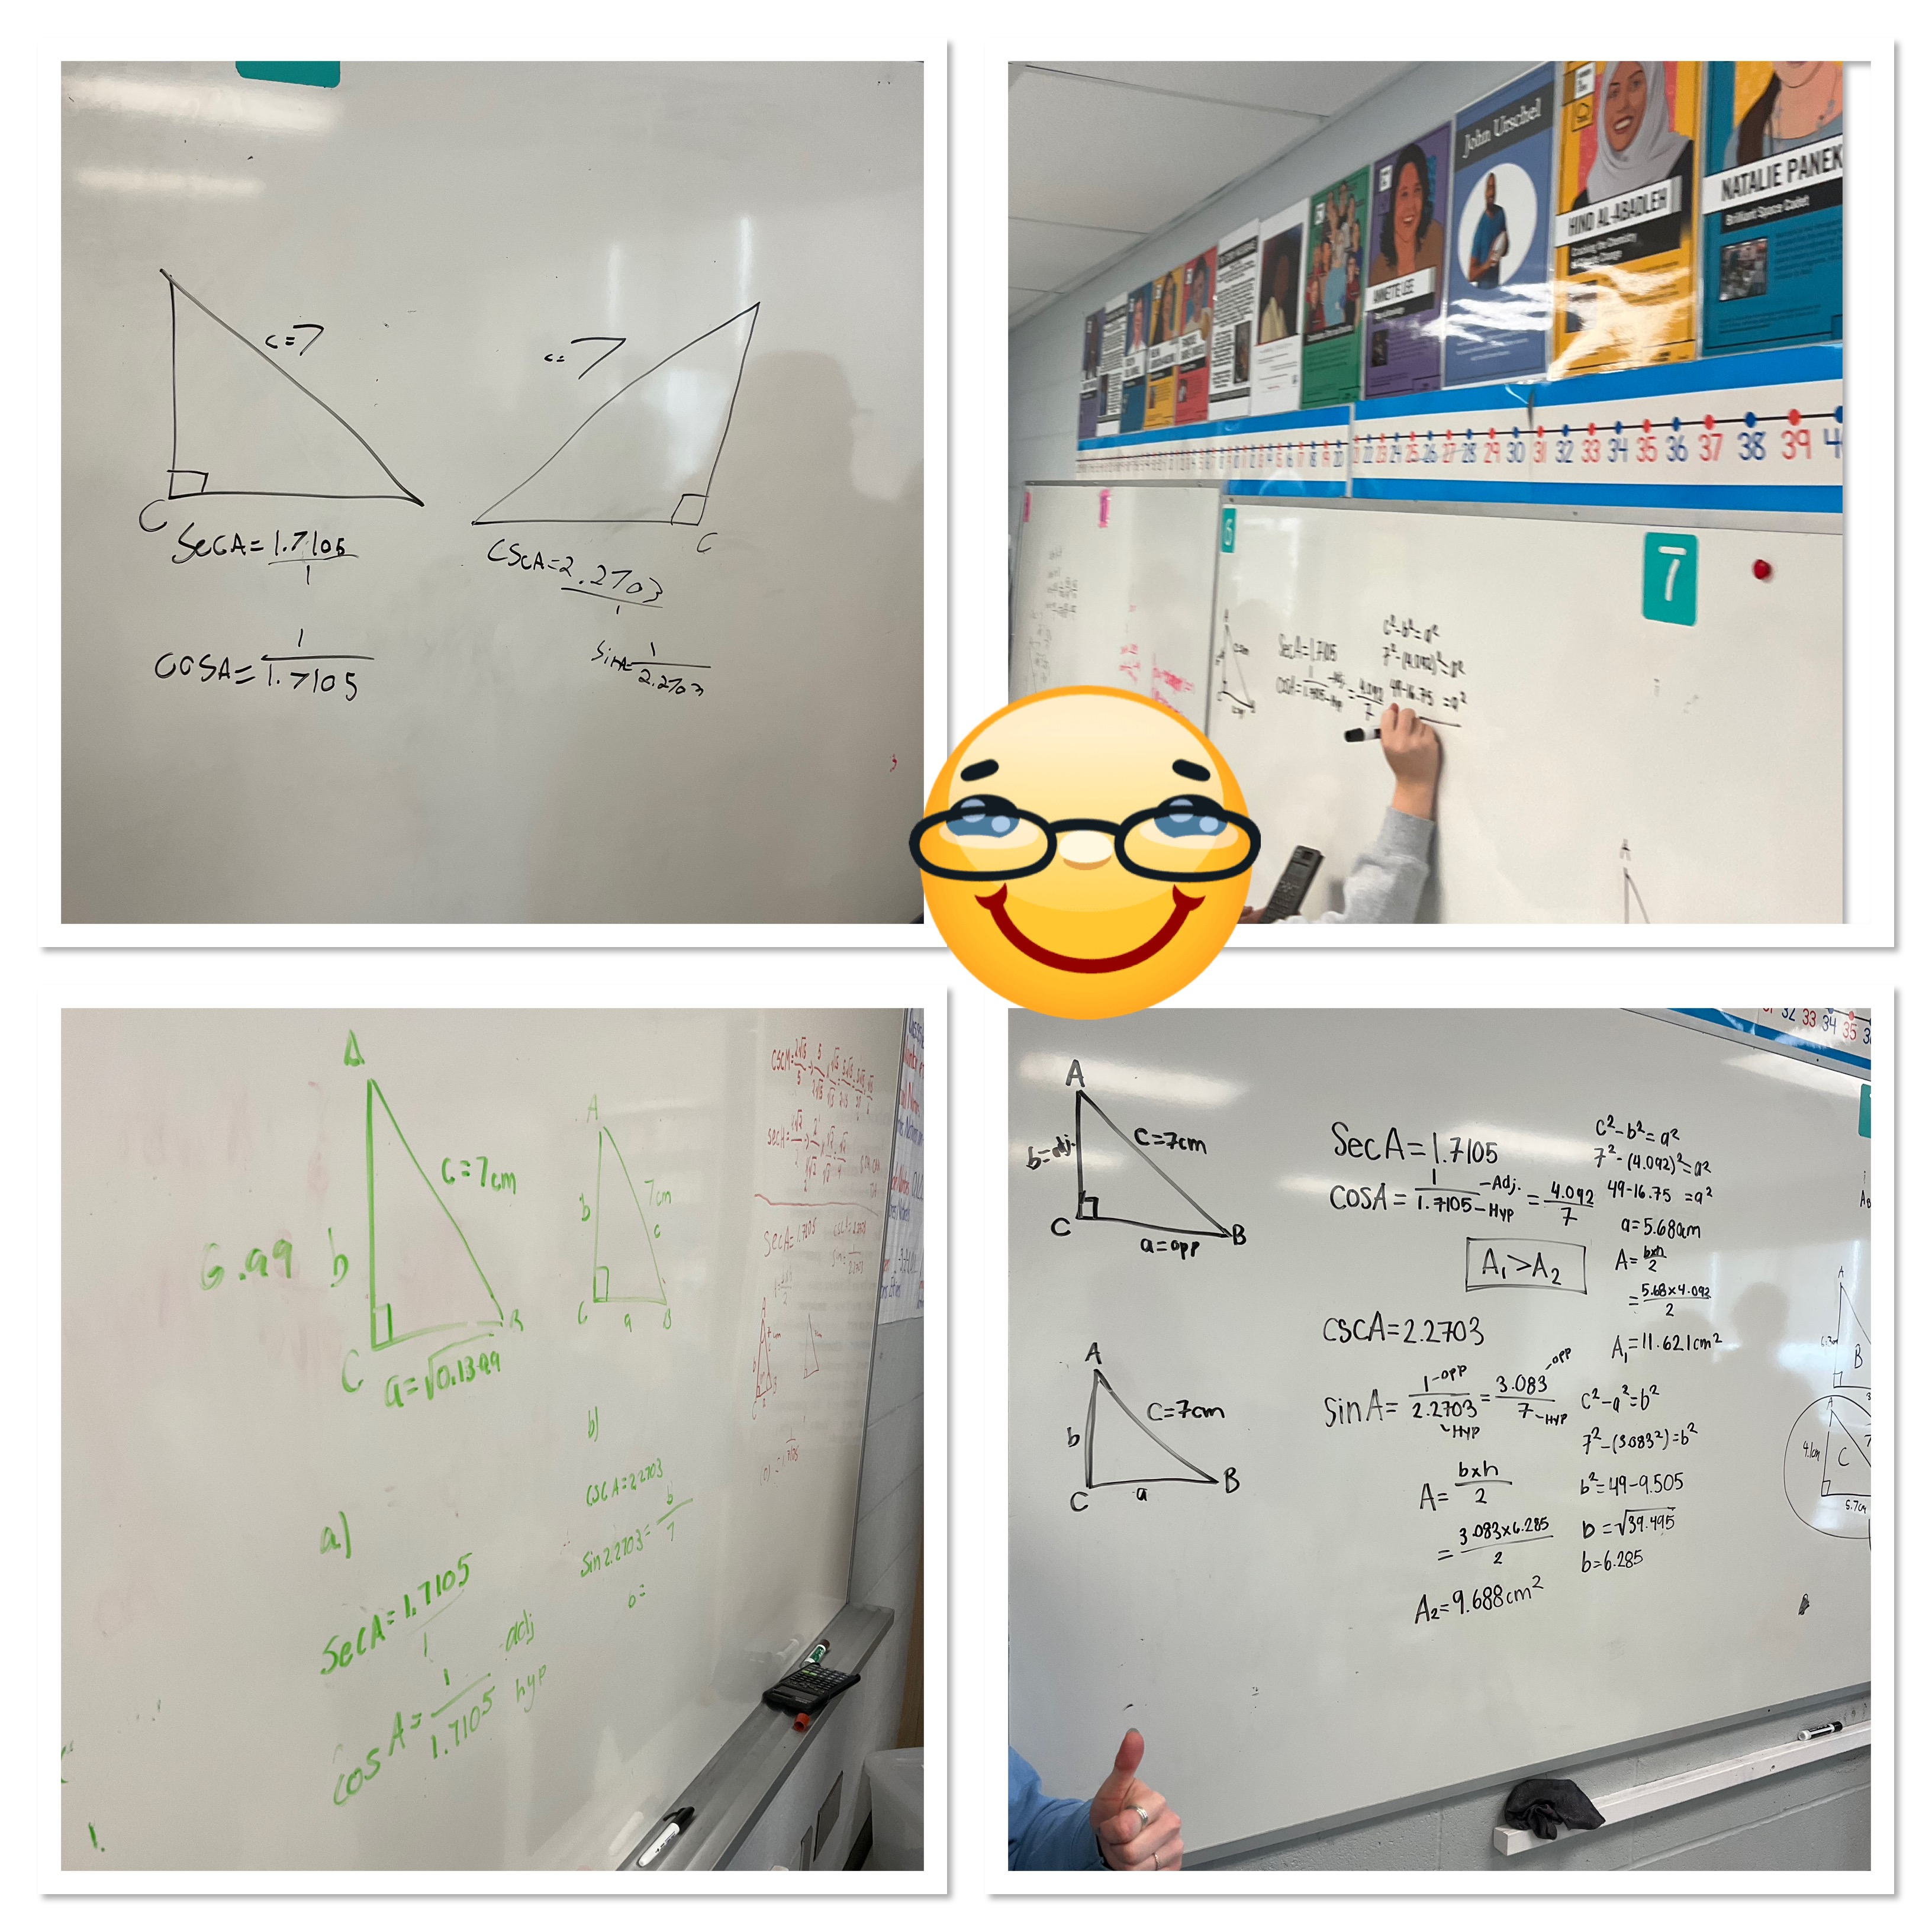
We’re using these skills to solve problems involving right triangles. It’s good to shake the dust off, and add to all that we learned in grade 10.
Visual Patterns
Today I was in a colleague’s grade 10 applied class to work with them on modelling linear and quadratic patterns.
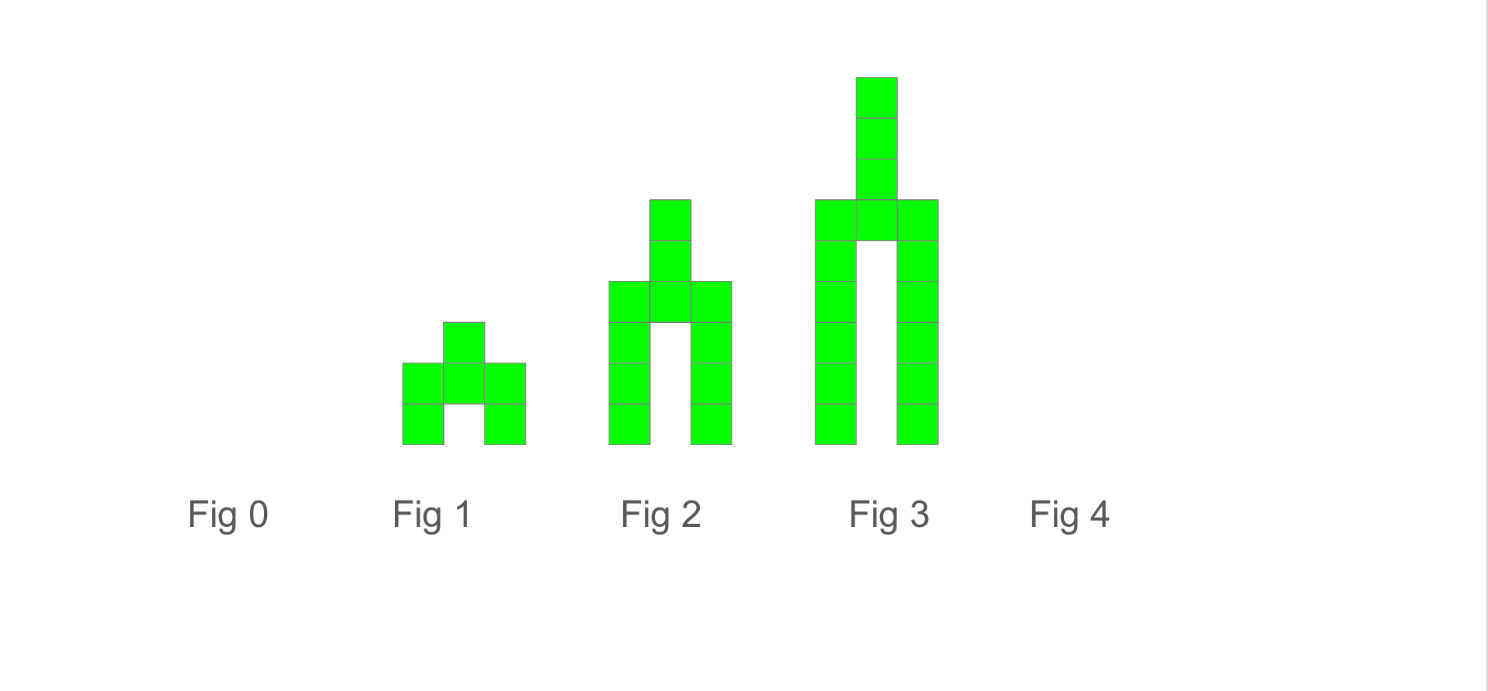
We remembered from grade 9 how to continue a pattern moving forward and backward. We made a table of values and a graph, and we looked at how to make equations. To get to an equation my new strategy is to have students think about figure 10. In the case of the trees, we can think of it 2 ways:
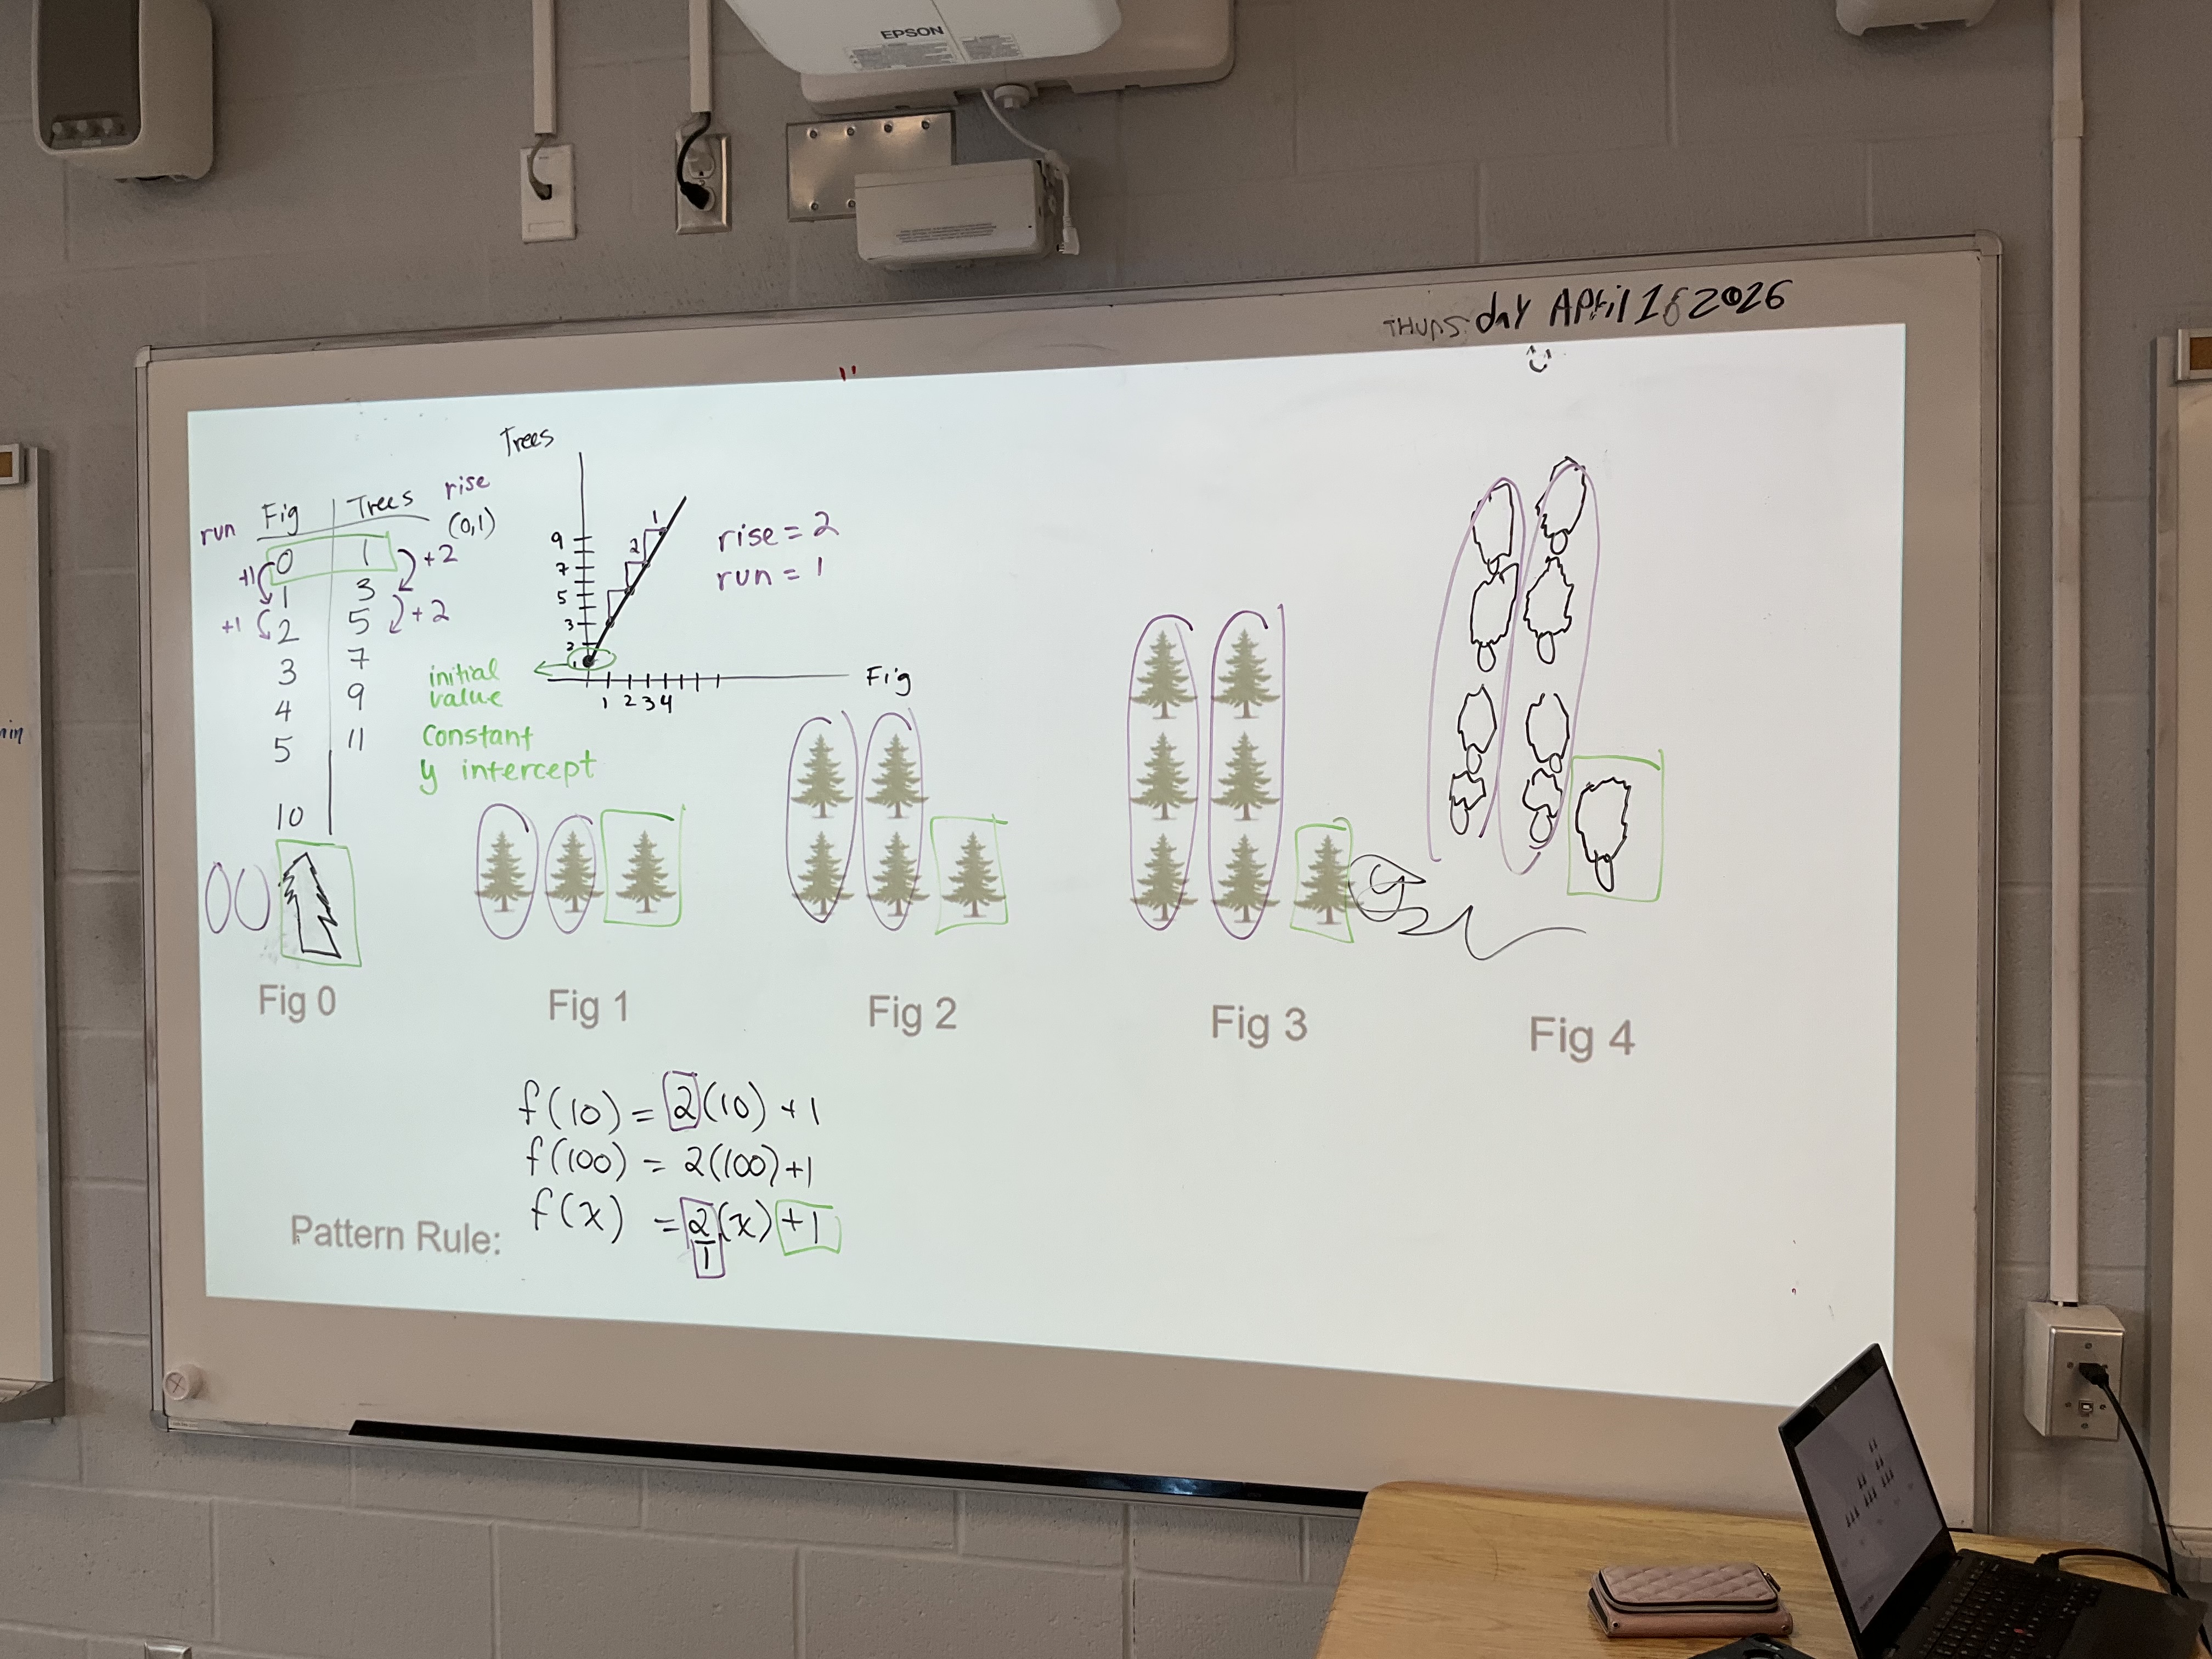
- Start with 1 tree (figure 0) and then add 2 10 times. f(10)=1+2(10)
- notice that in each figure, there are 2 columns of that value, and one extra solitary tree, so f(10)=2(10)+1
From there we can find figure x by swapping out the 10 for x. f(x)=2x+1. Introducing function notation works here, and I use it for grade 9s and 10s. The 10 applied class seemed ok with it too.
The next pattern we did in parters at the whiteboards.
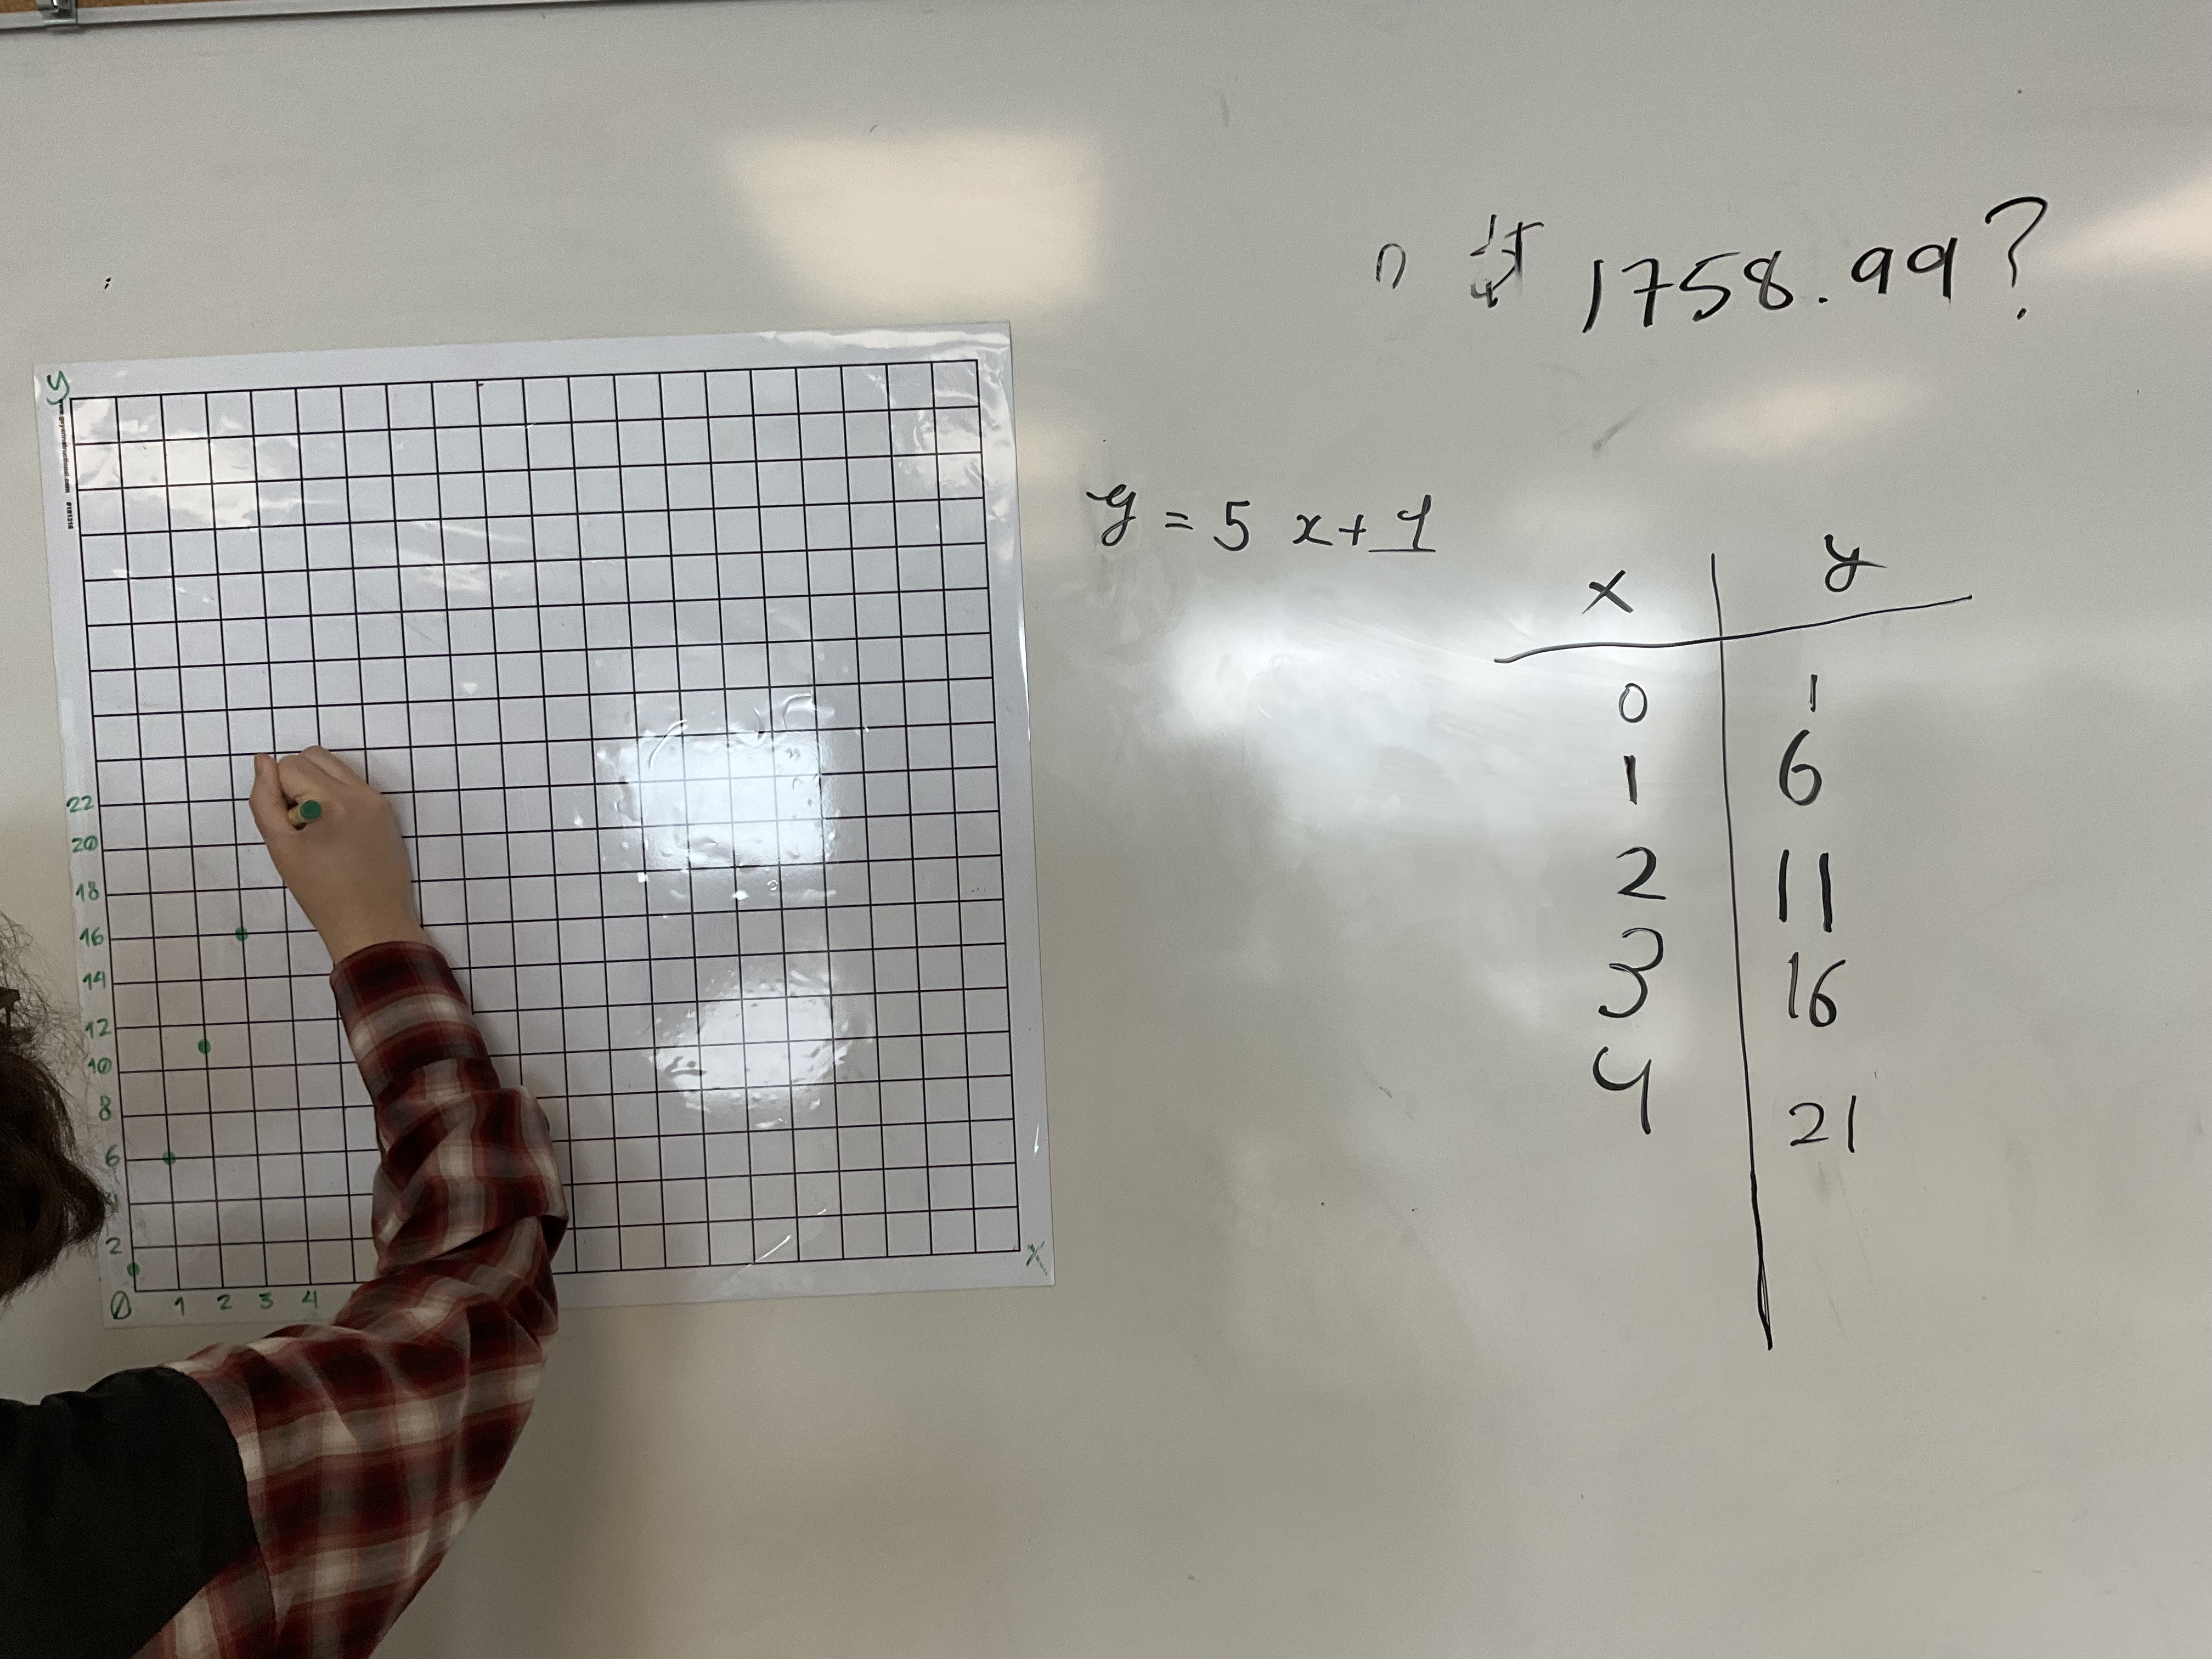
Finally we did some practice with quadratic patterns. We noticed they grew differently, not going up by the same each time, but that the “change” changed by the same amount each time. We named that the first and second difference, and saw how we can find squares of the figure number, and groups of the figure number, and the constant visible in these patterns.
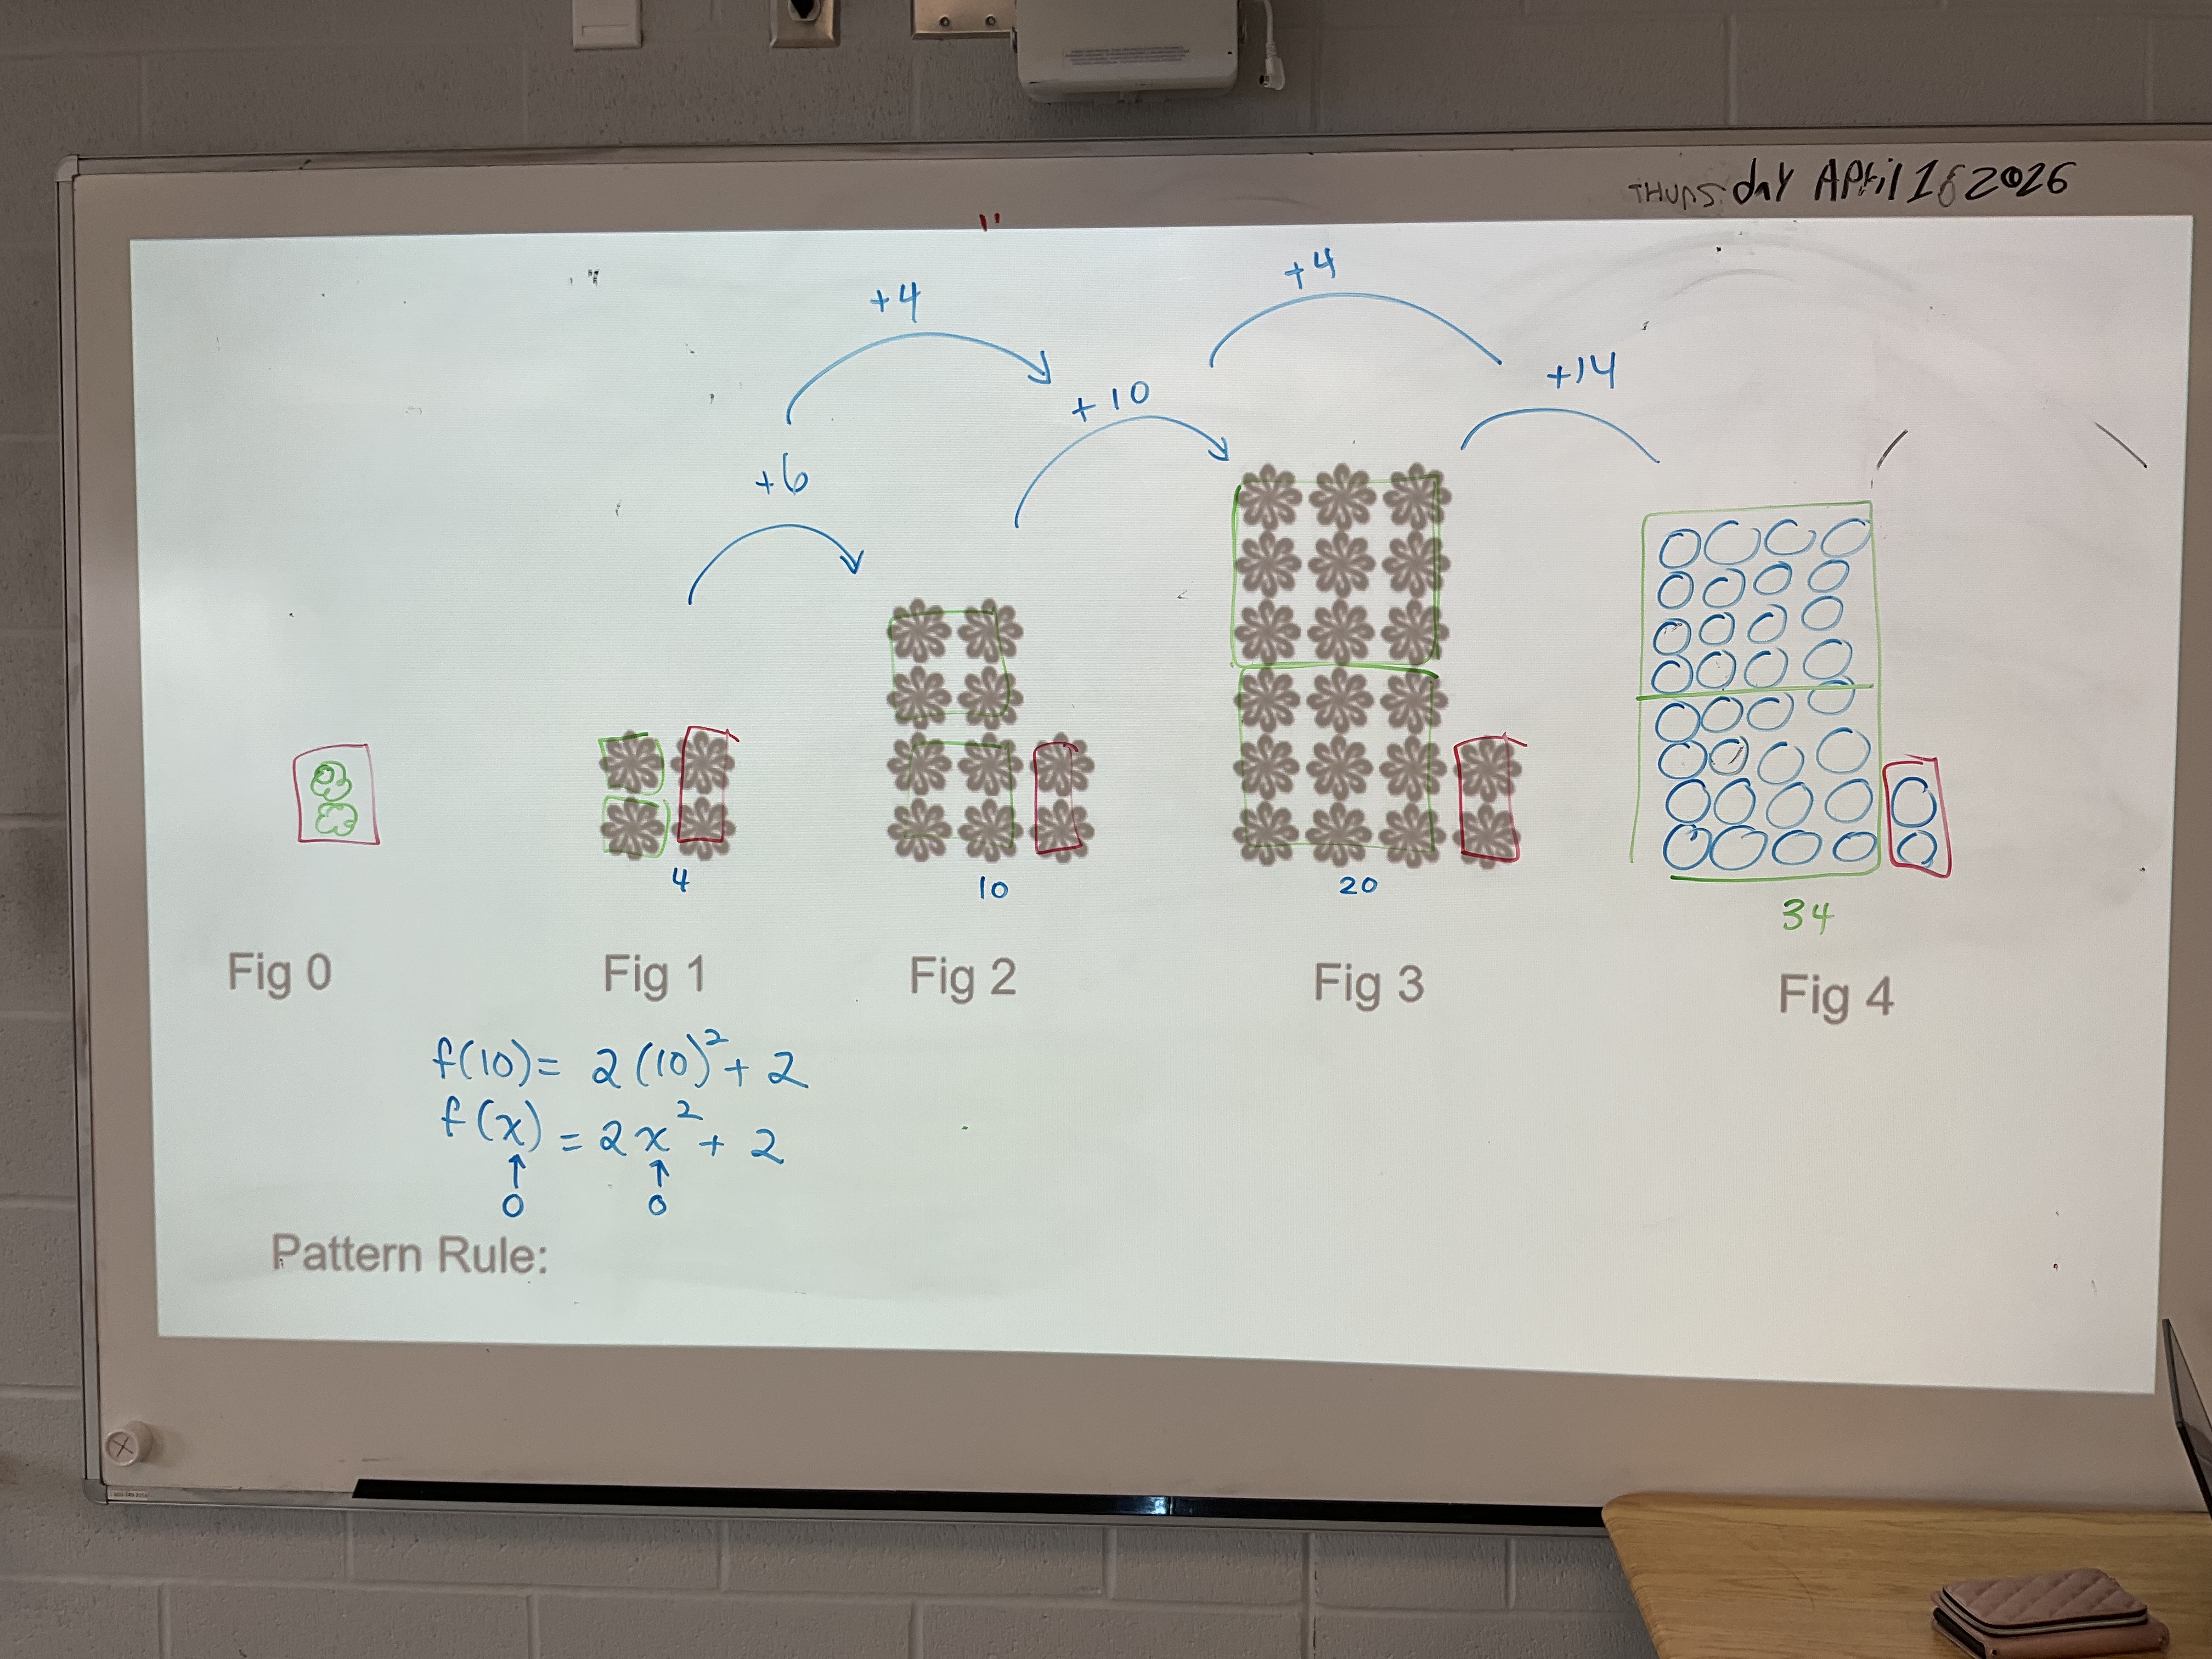
Again, we look at figure 10, there’d be 2 squares of 10 by 10, and then 2 left over as the constant. So the equation is f(10)=2(10)^2+2
and f(x)=2x^2+2
Students were starting to get the hang of it after a few examples.
For more examples go to visualpatterns.org
Cookie Towers
I was working with a colleague’s grade 9 class today, and the goal was to recall mean median mode and range, and to start looking at box and whisker plots.
I love to get kids hooked on data collection, and what’s more fun than a cookie tower competition?! We made rules of stacking one cookie on another, one at a time, using one hand only. Each group members took turns stacking towers until we had 12 data points in their charts.
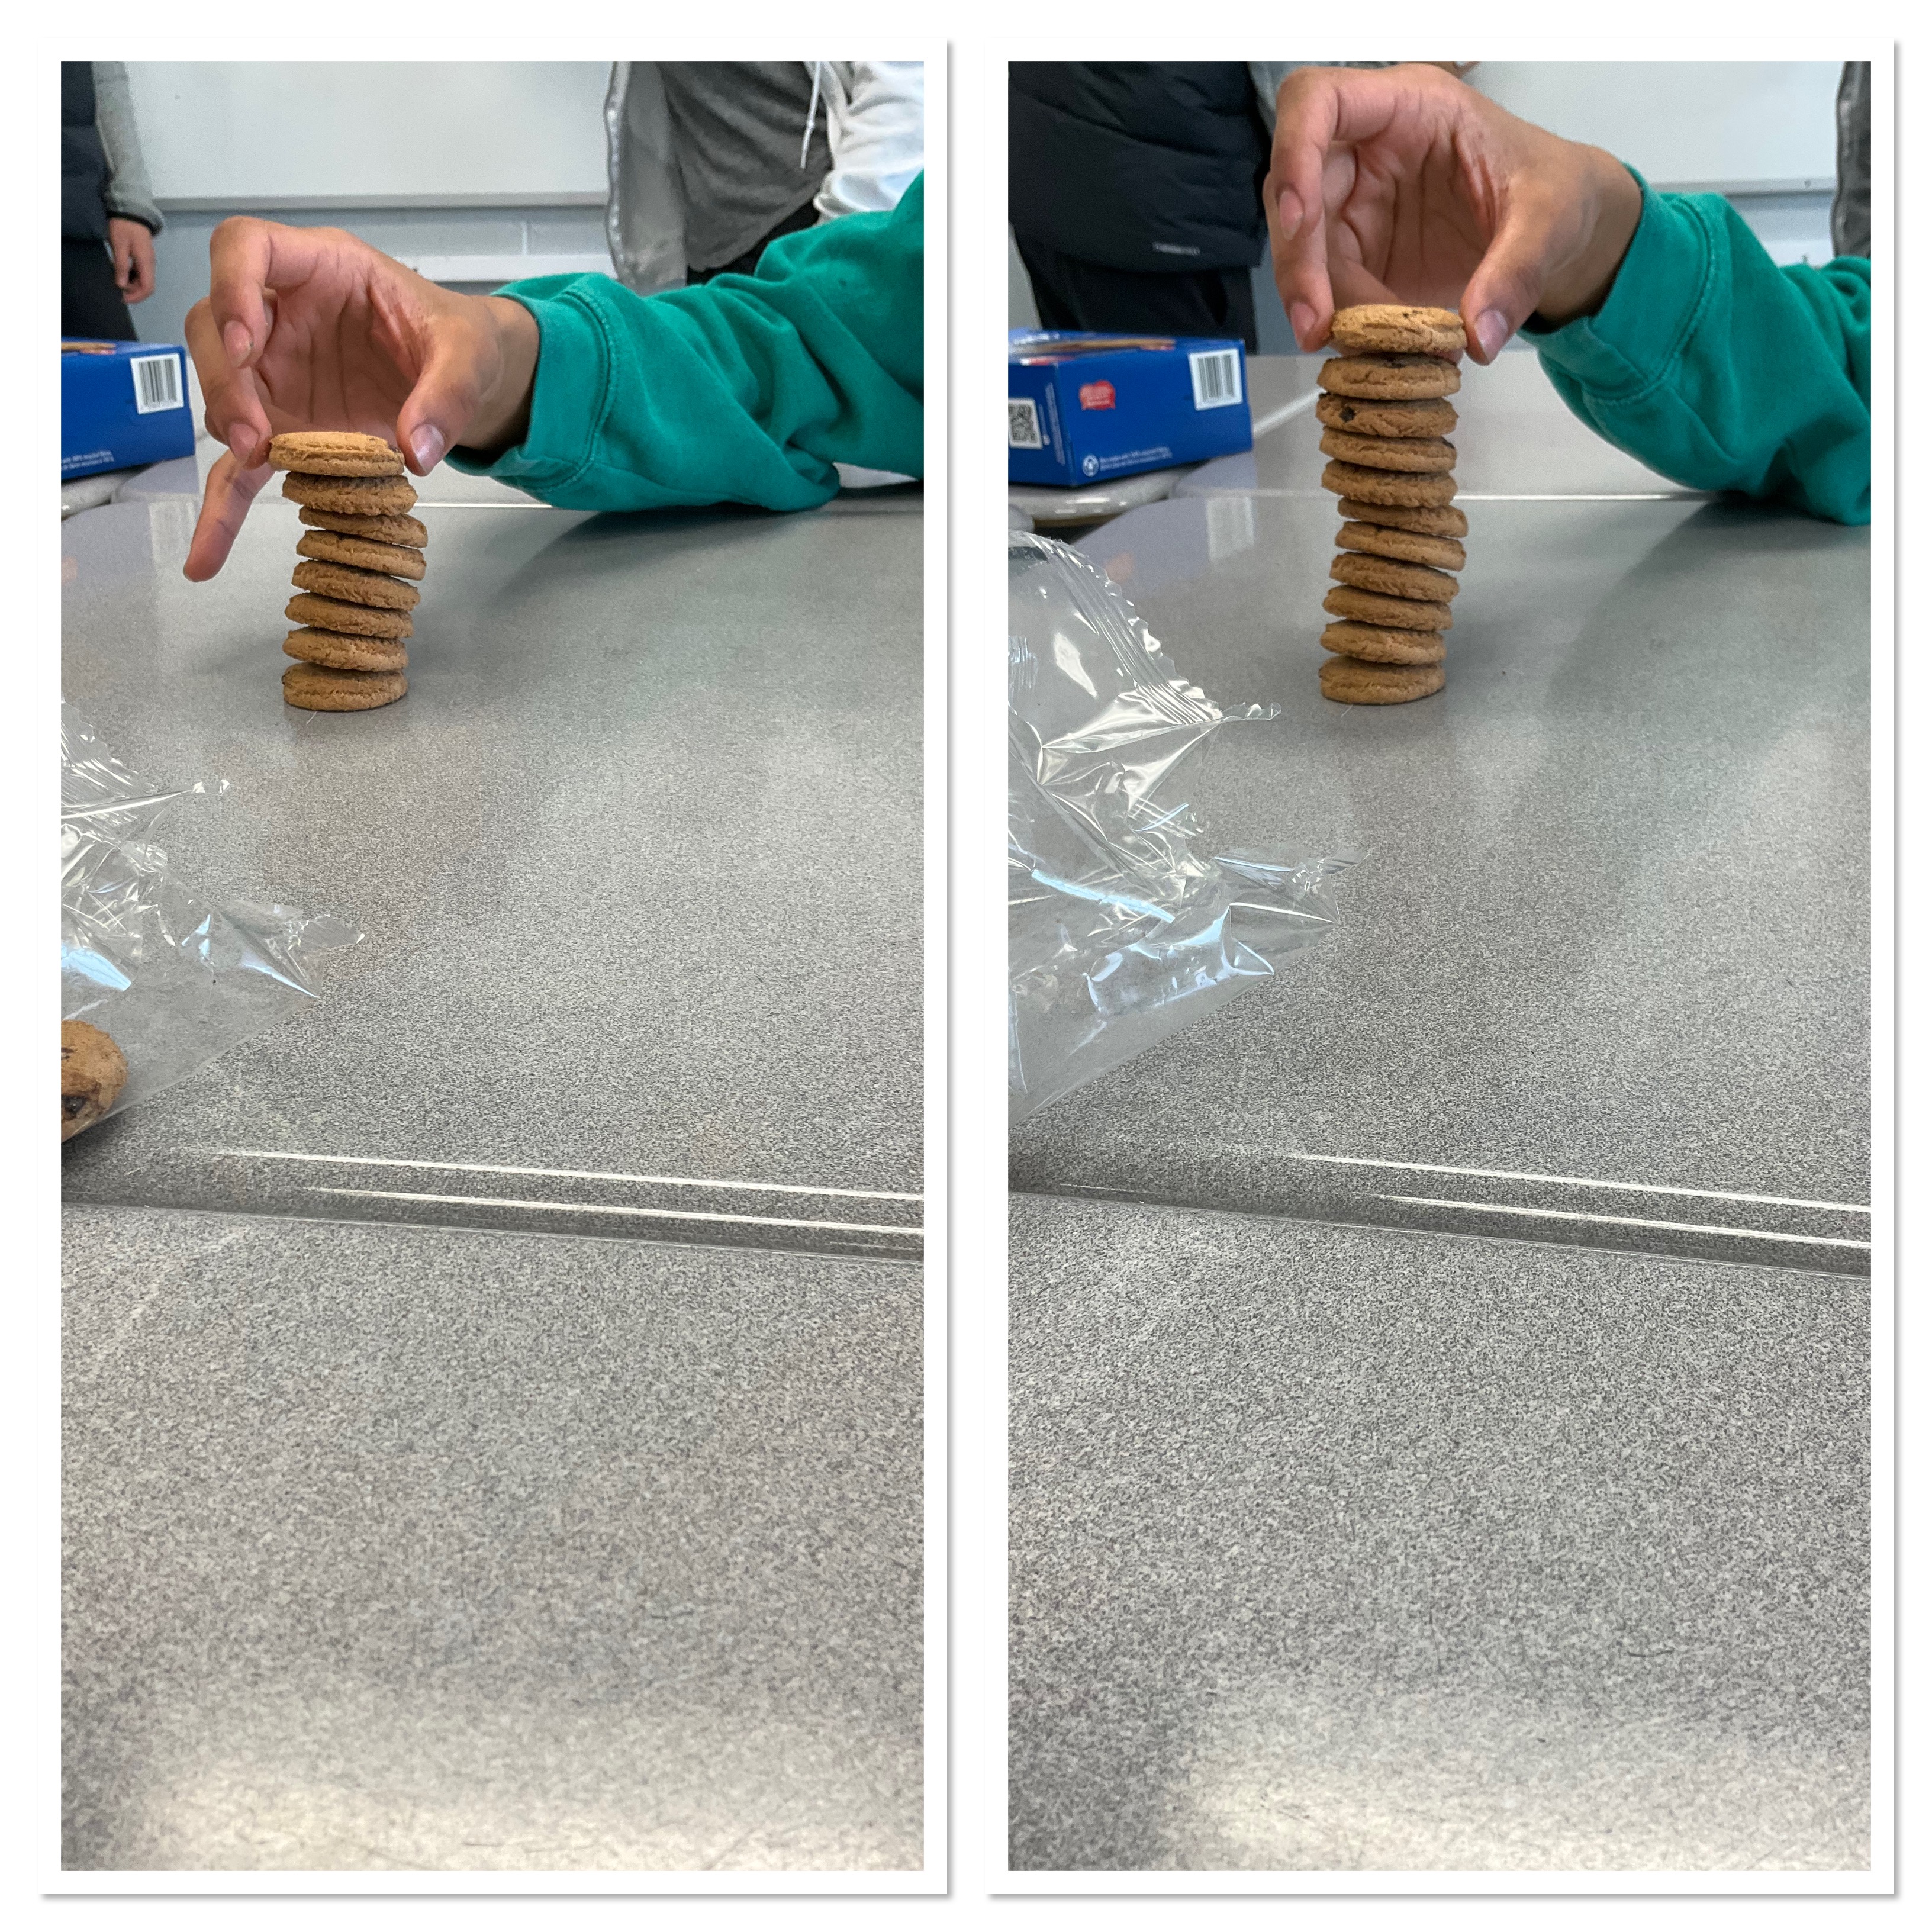
Groups were getting pretty keen, and a little competitive. Some started experimenting with how to stack the cookies, or even “sanding” down the cookies to make them flat.
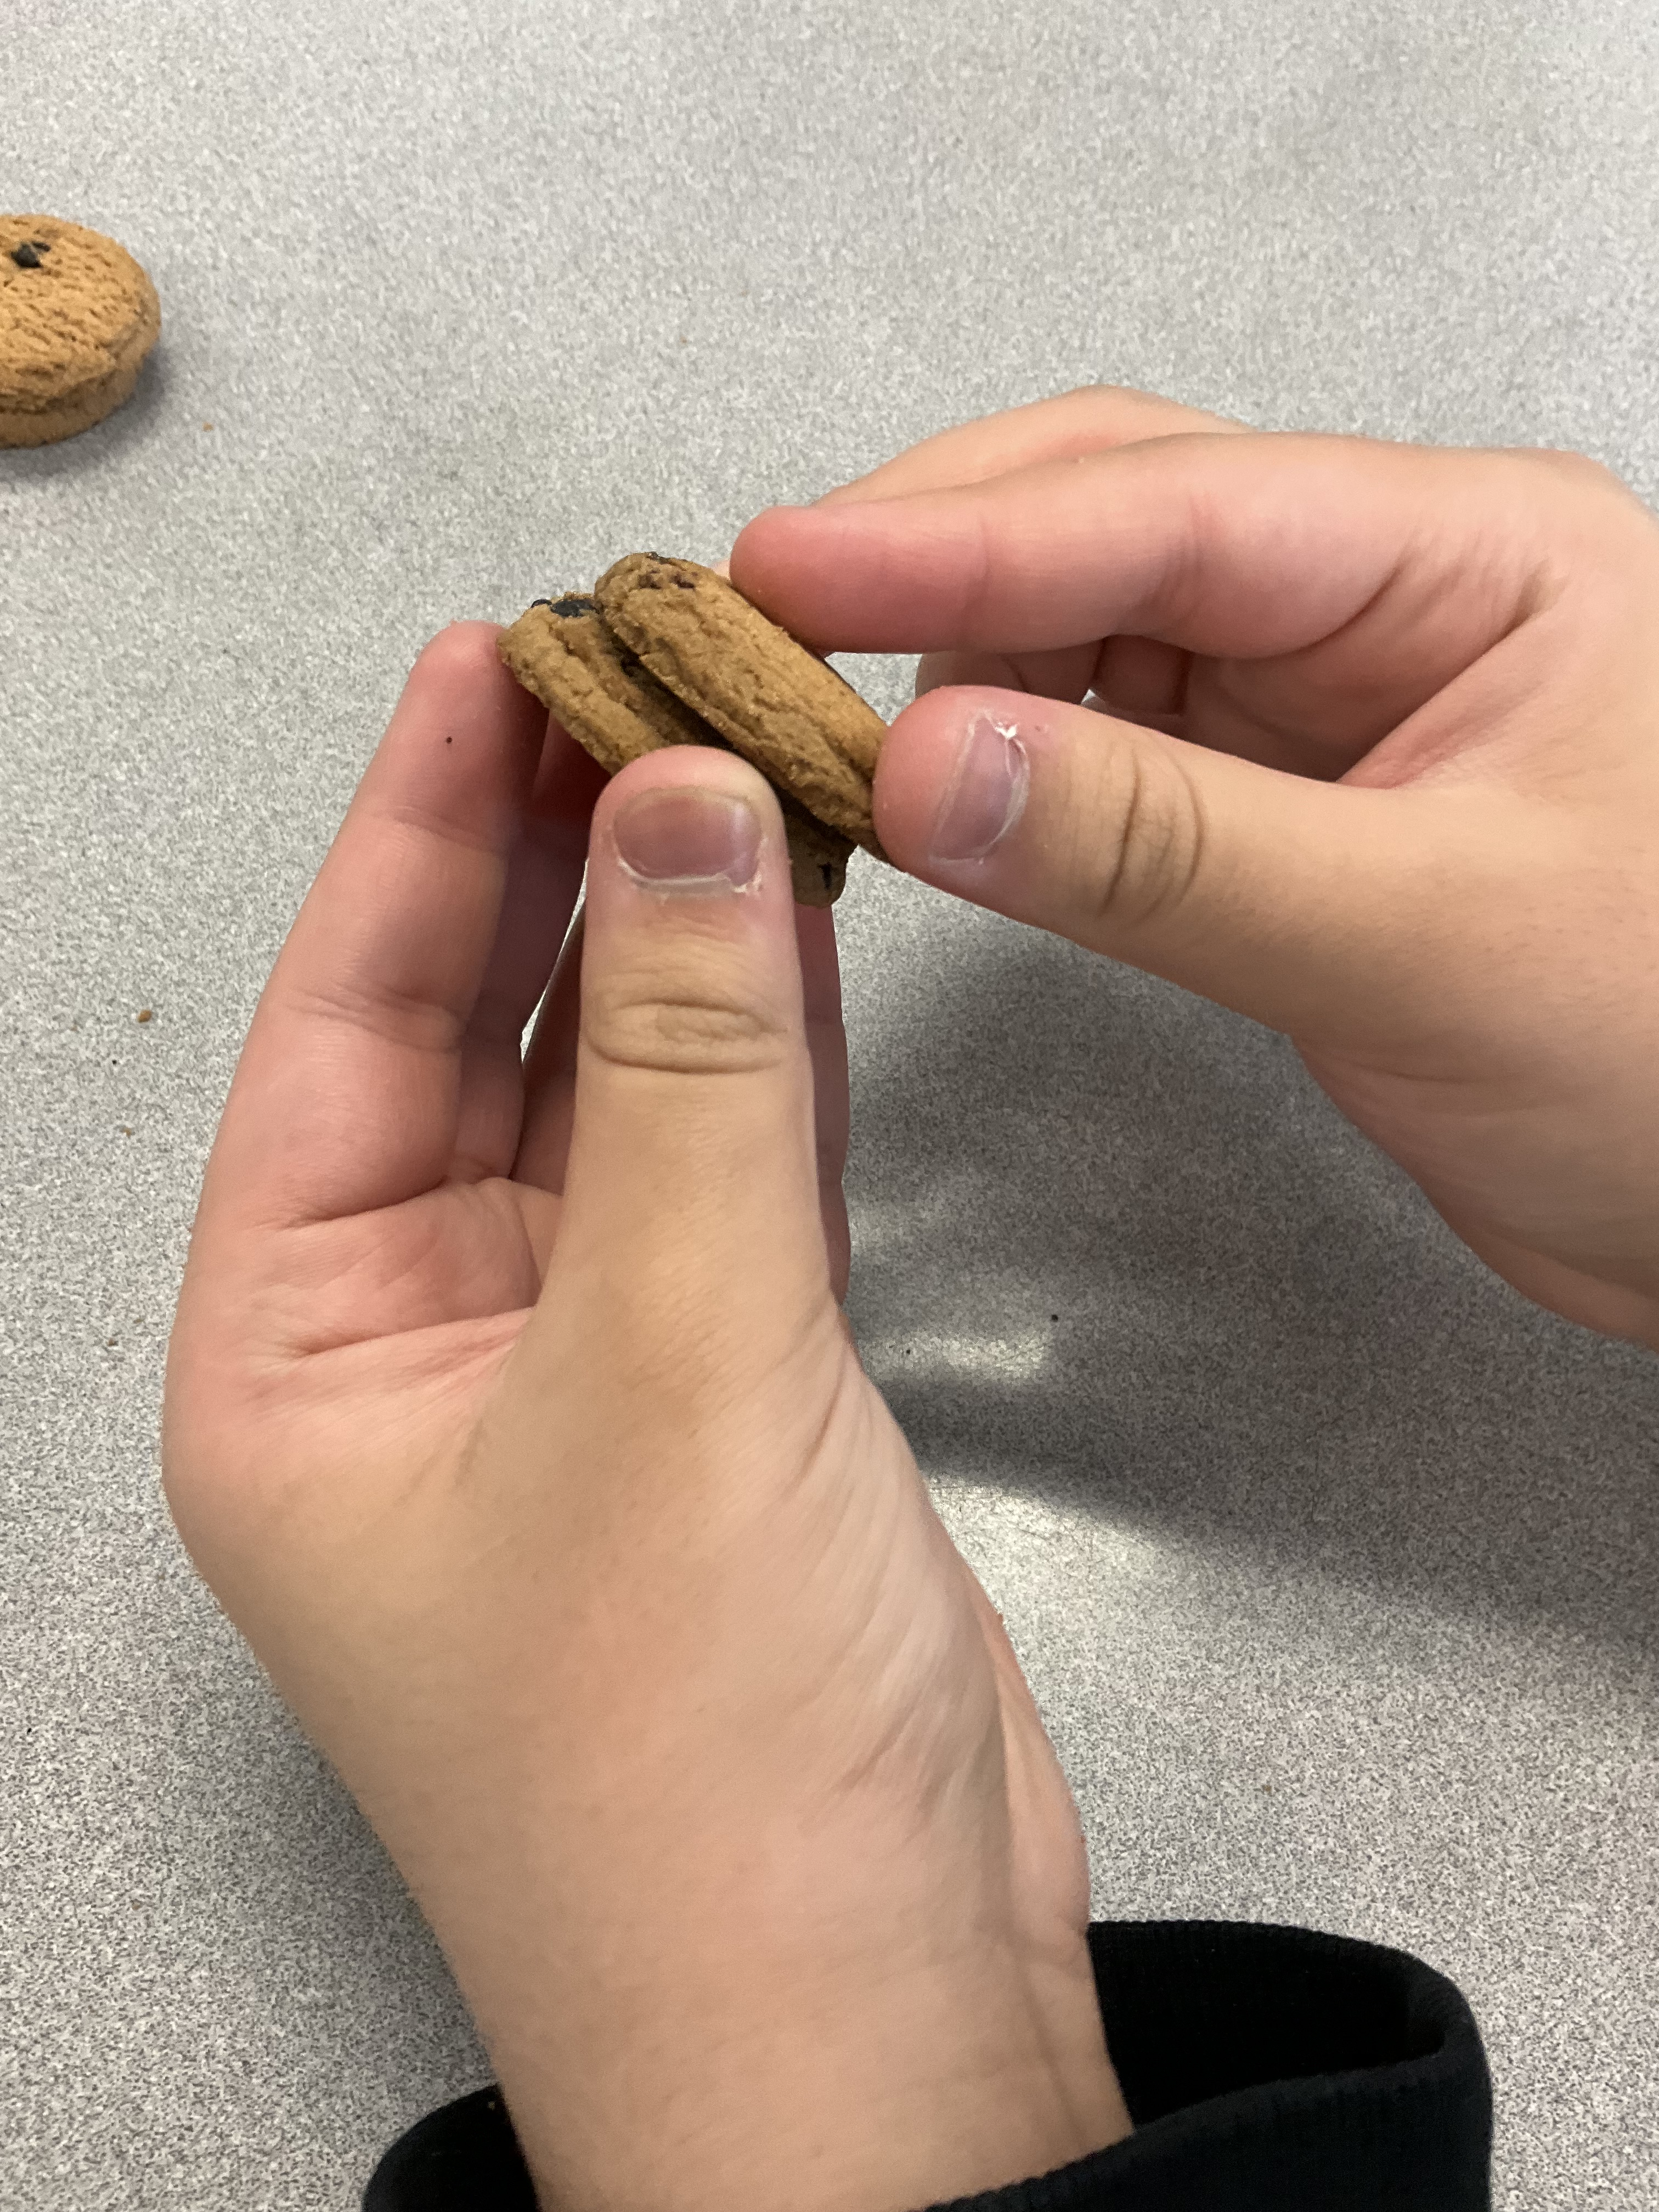
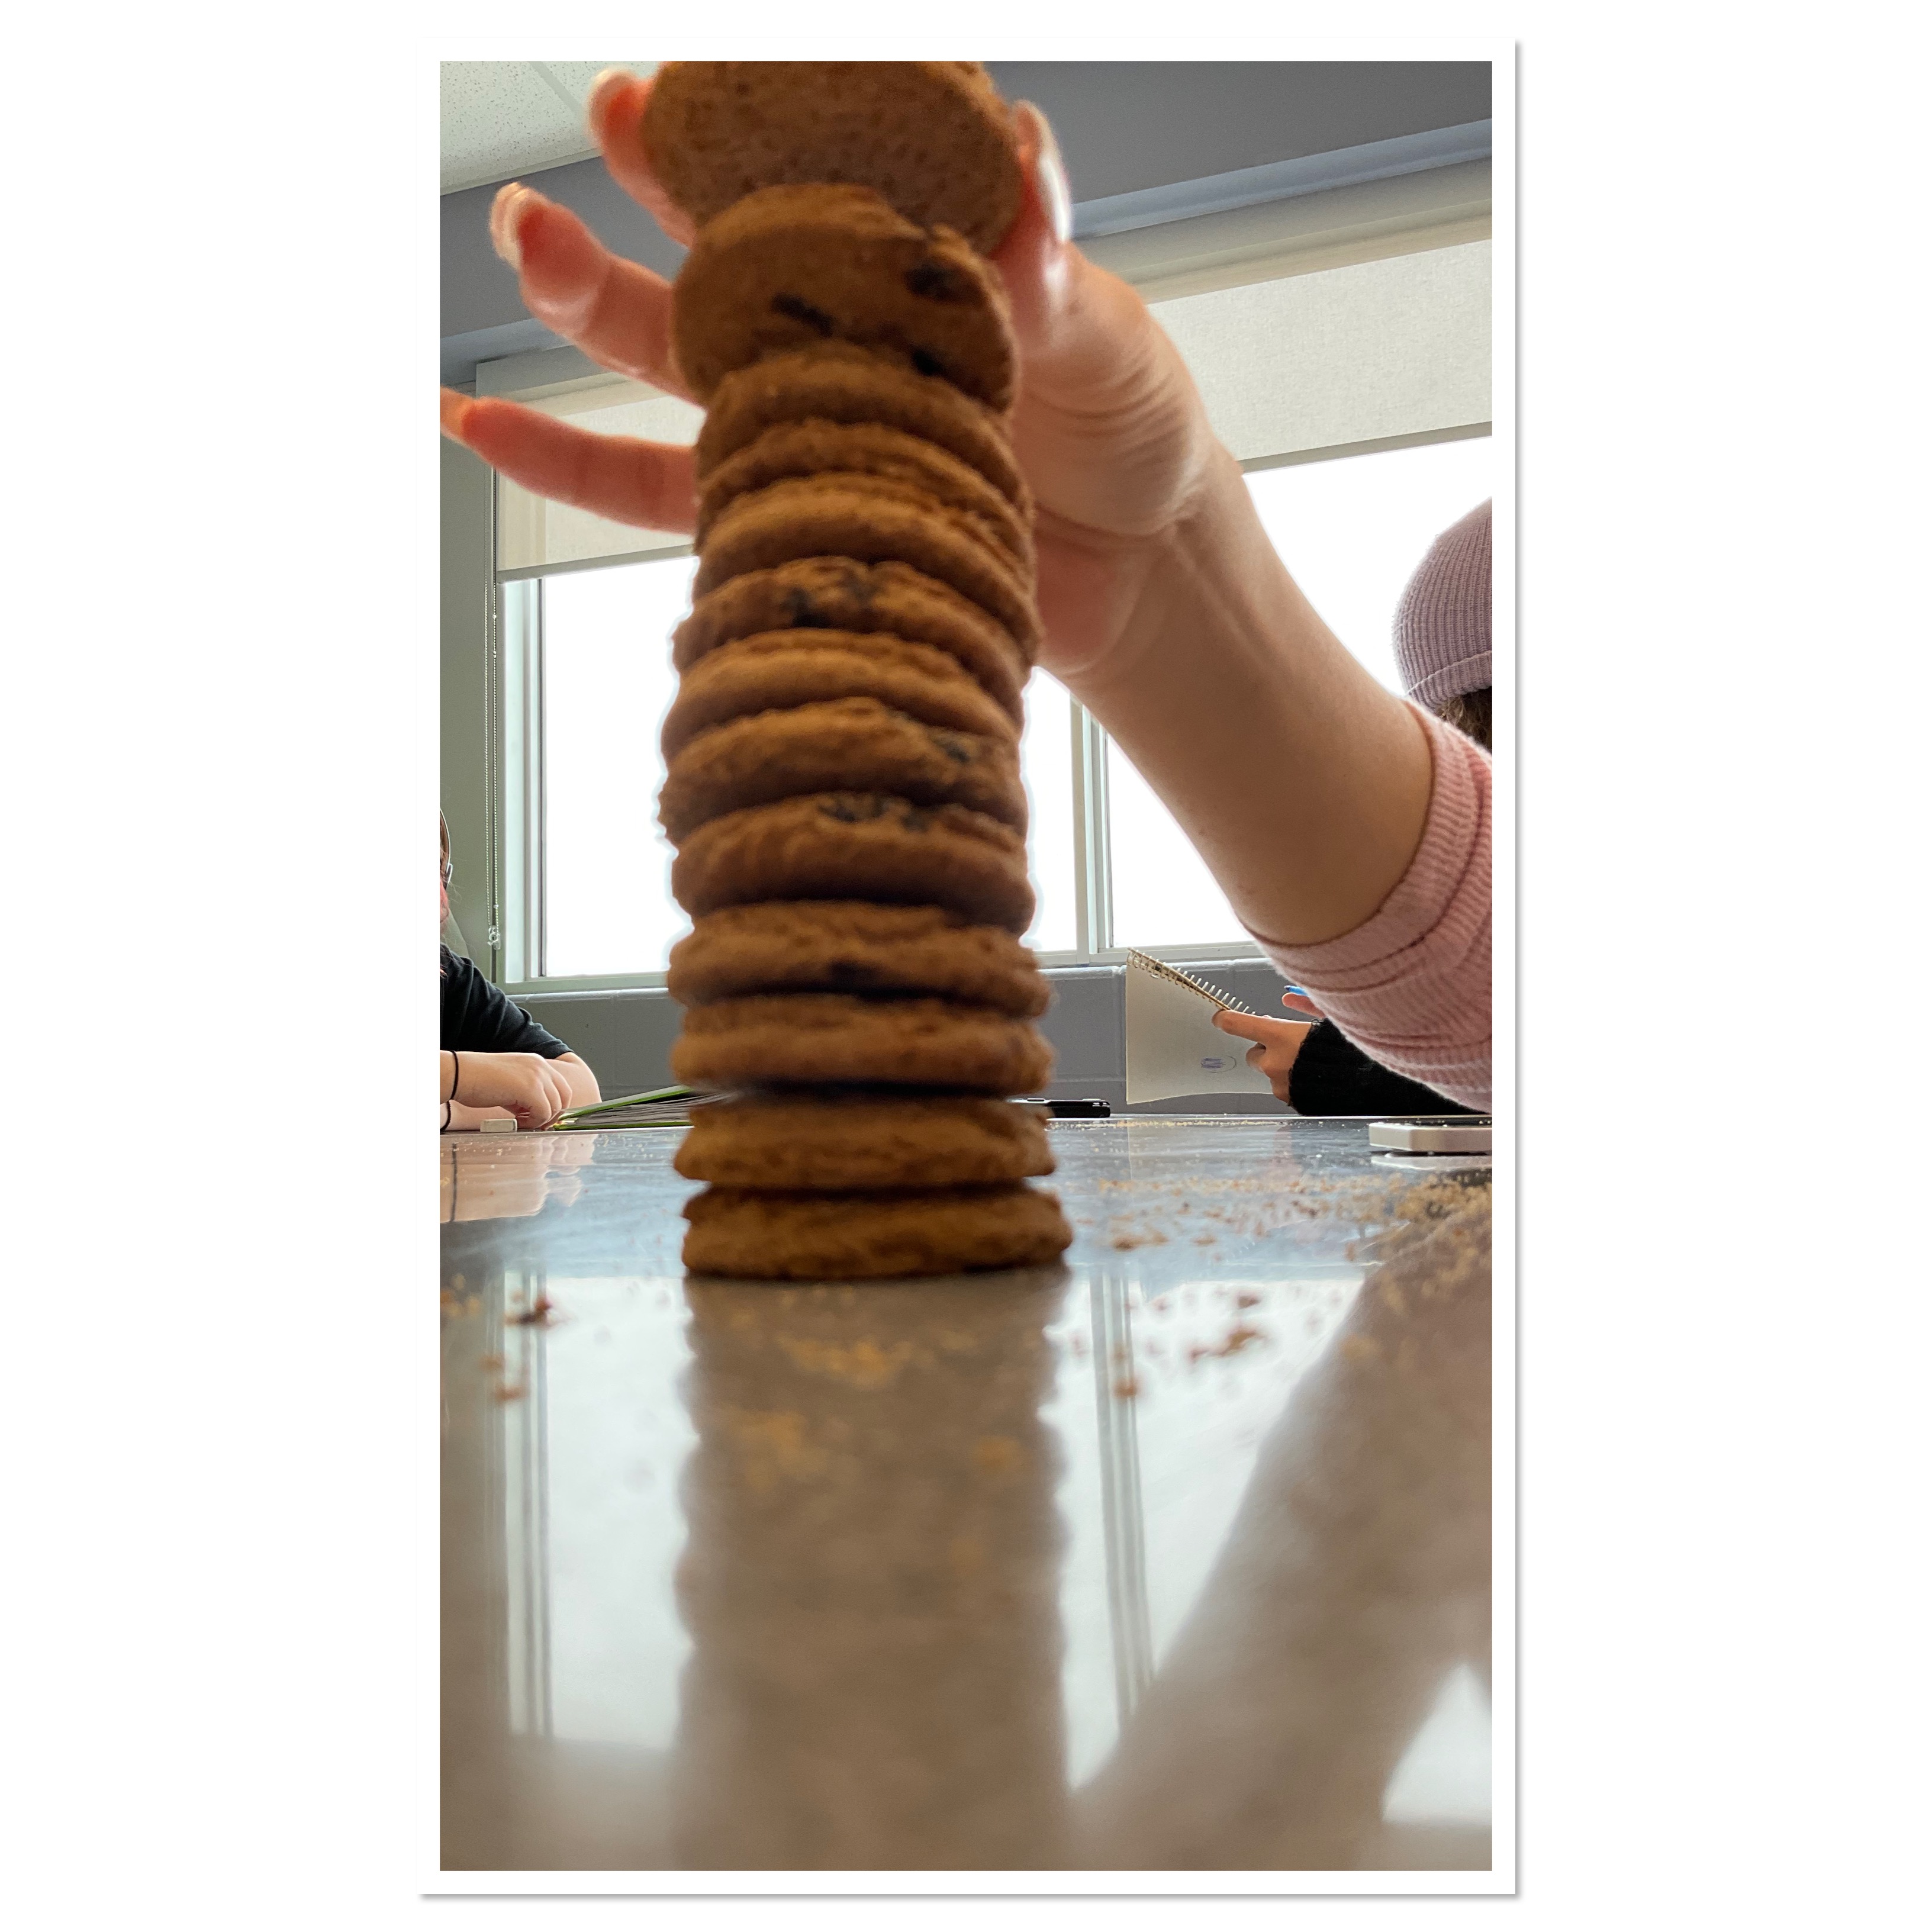
After some frustrations, some regrouping, practicing and strategizing, several students became very skilled!
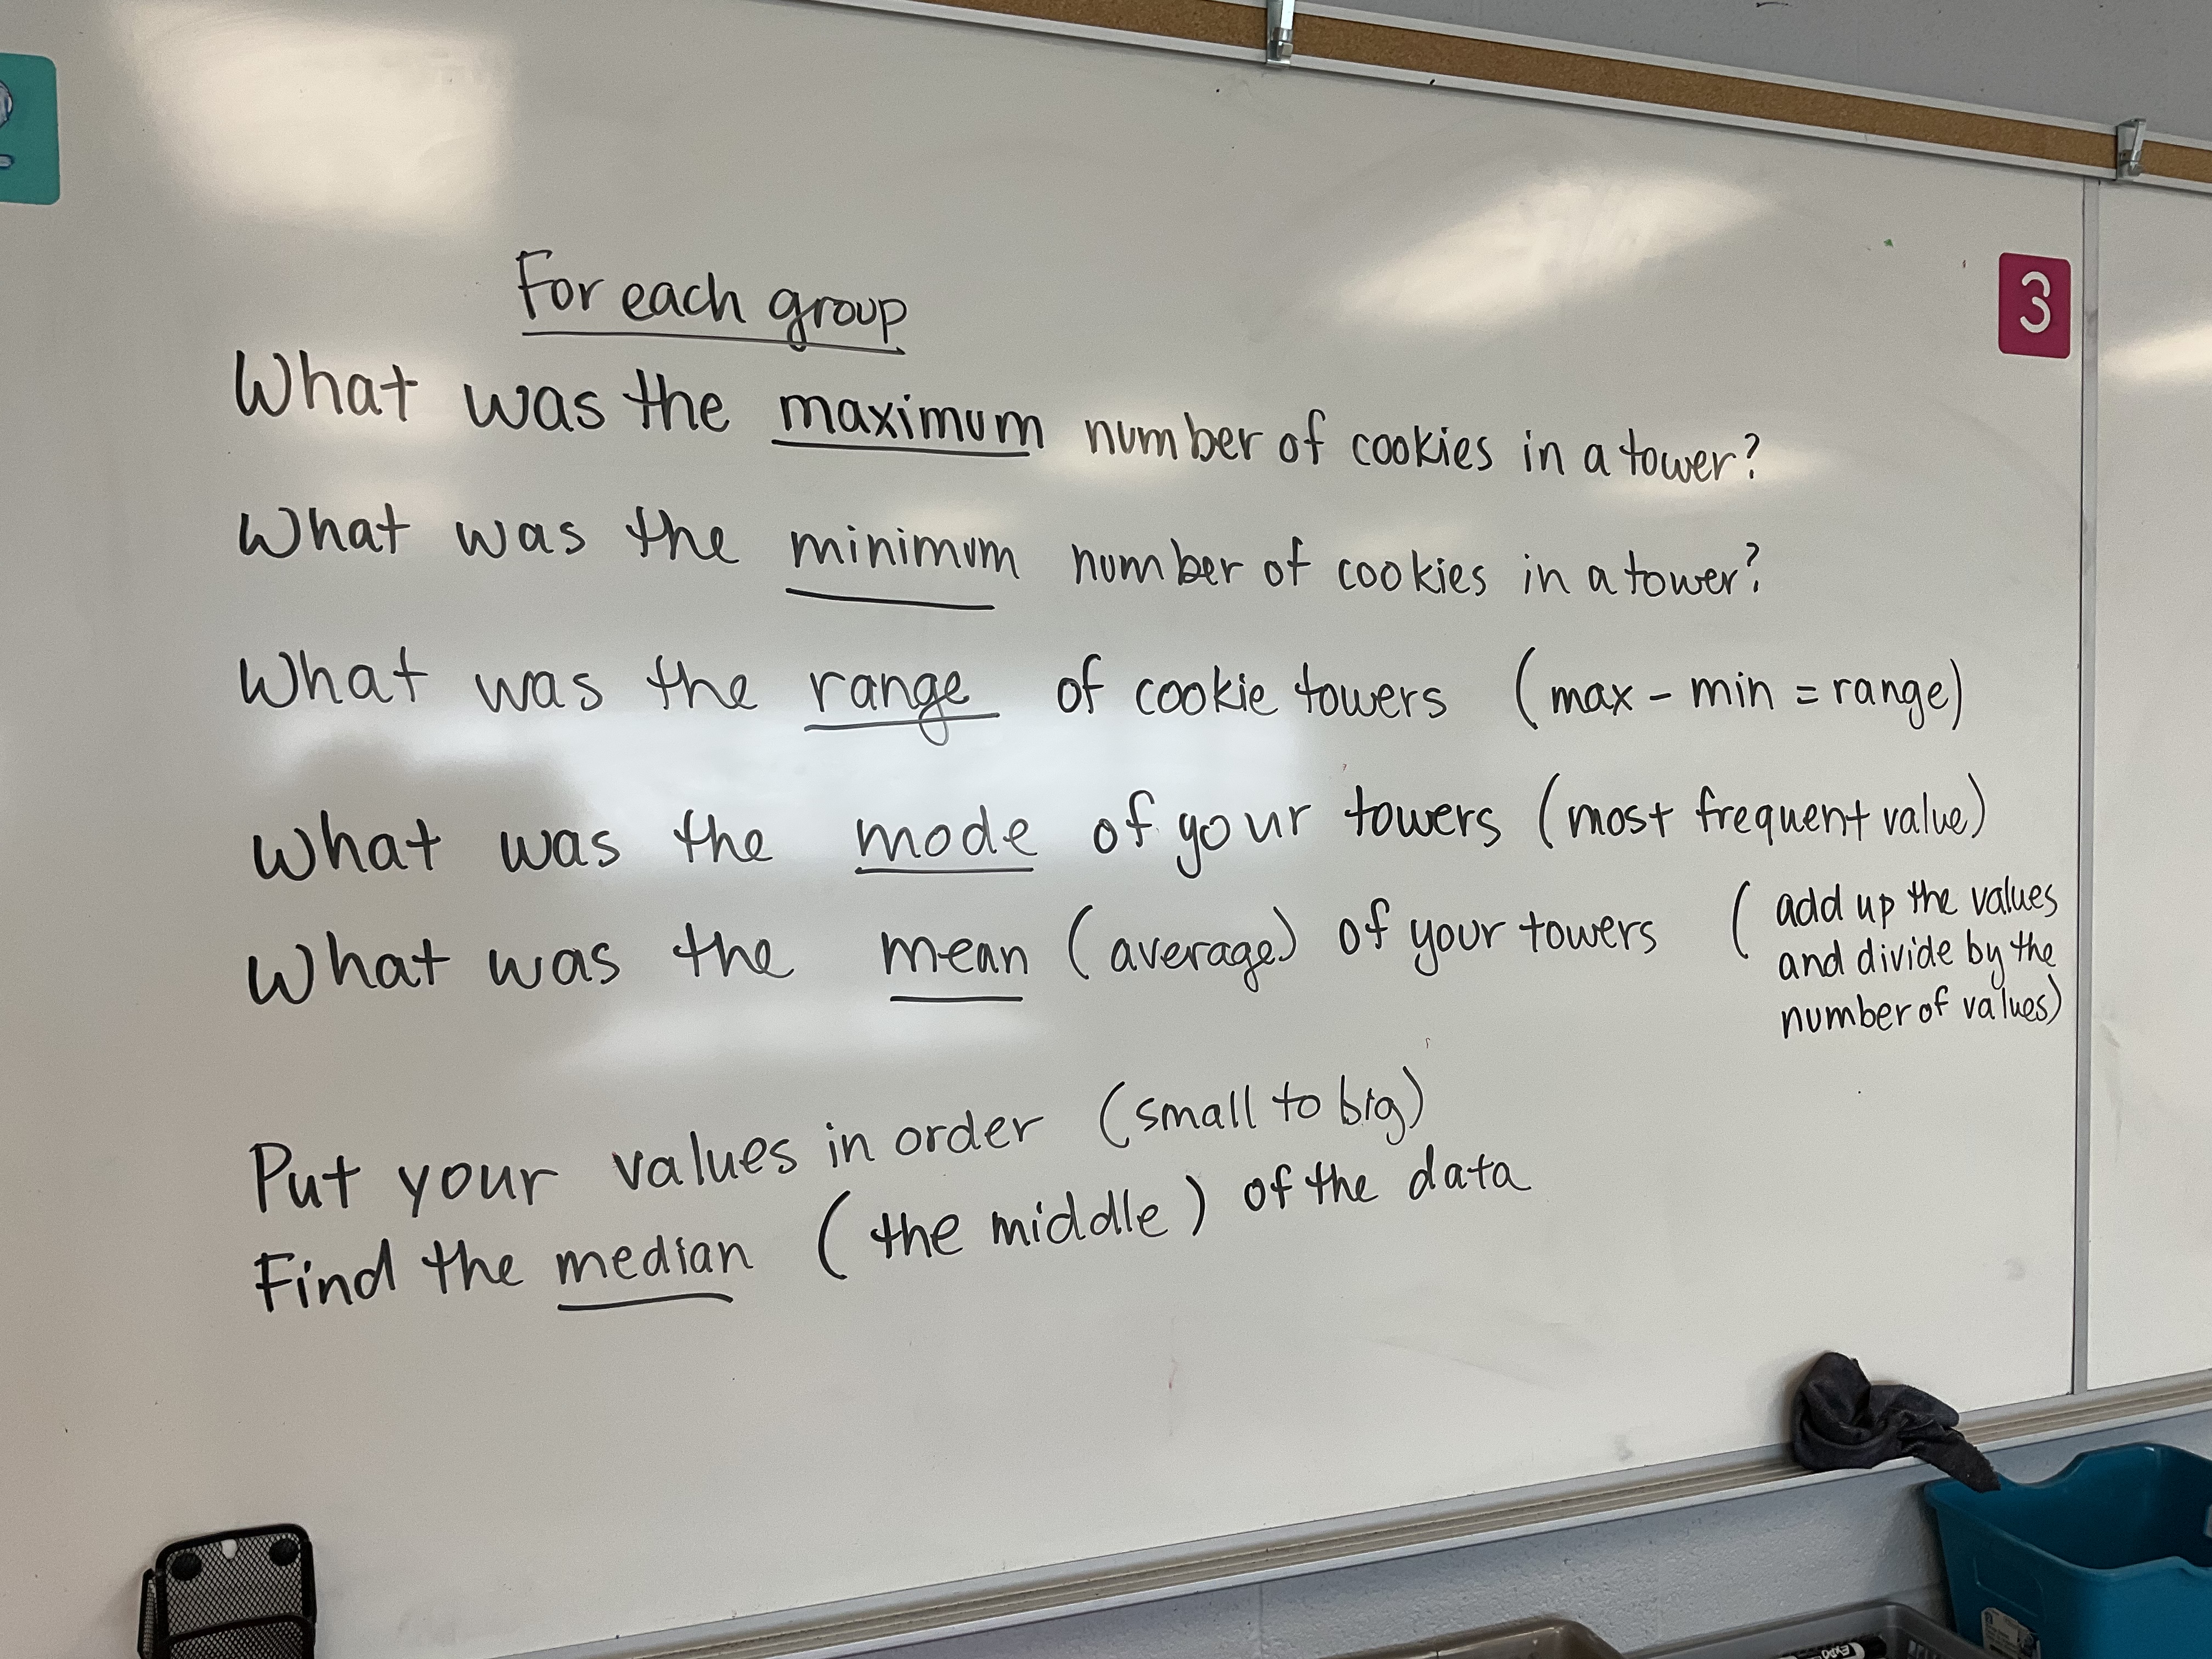
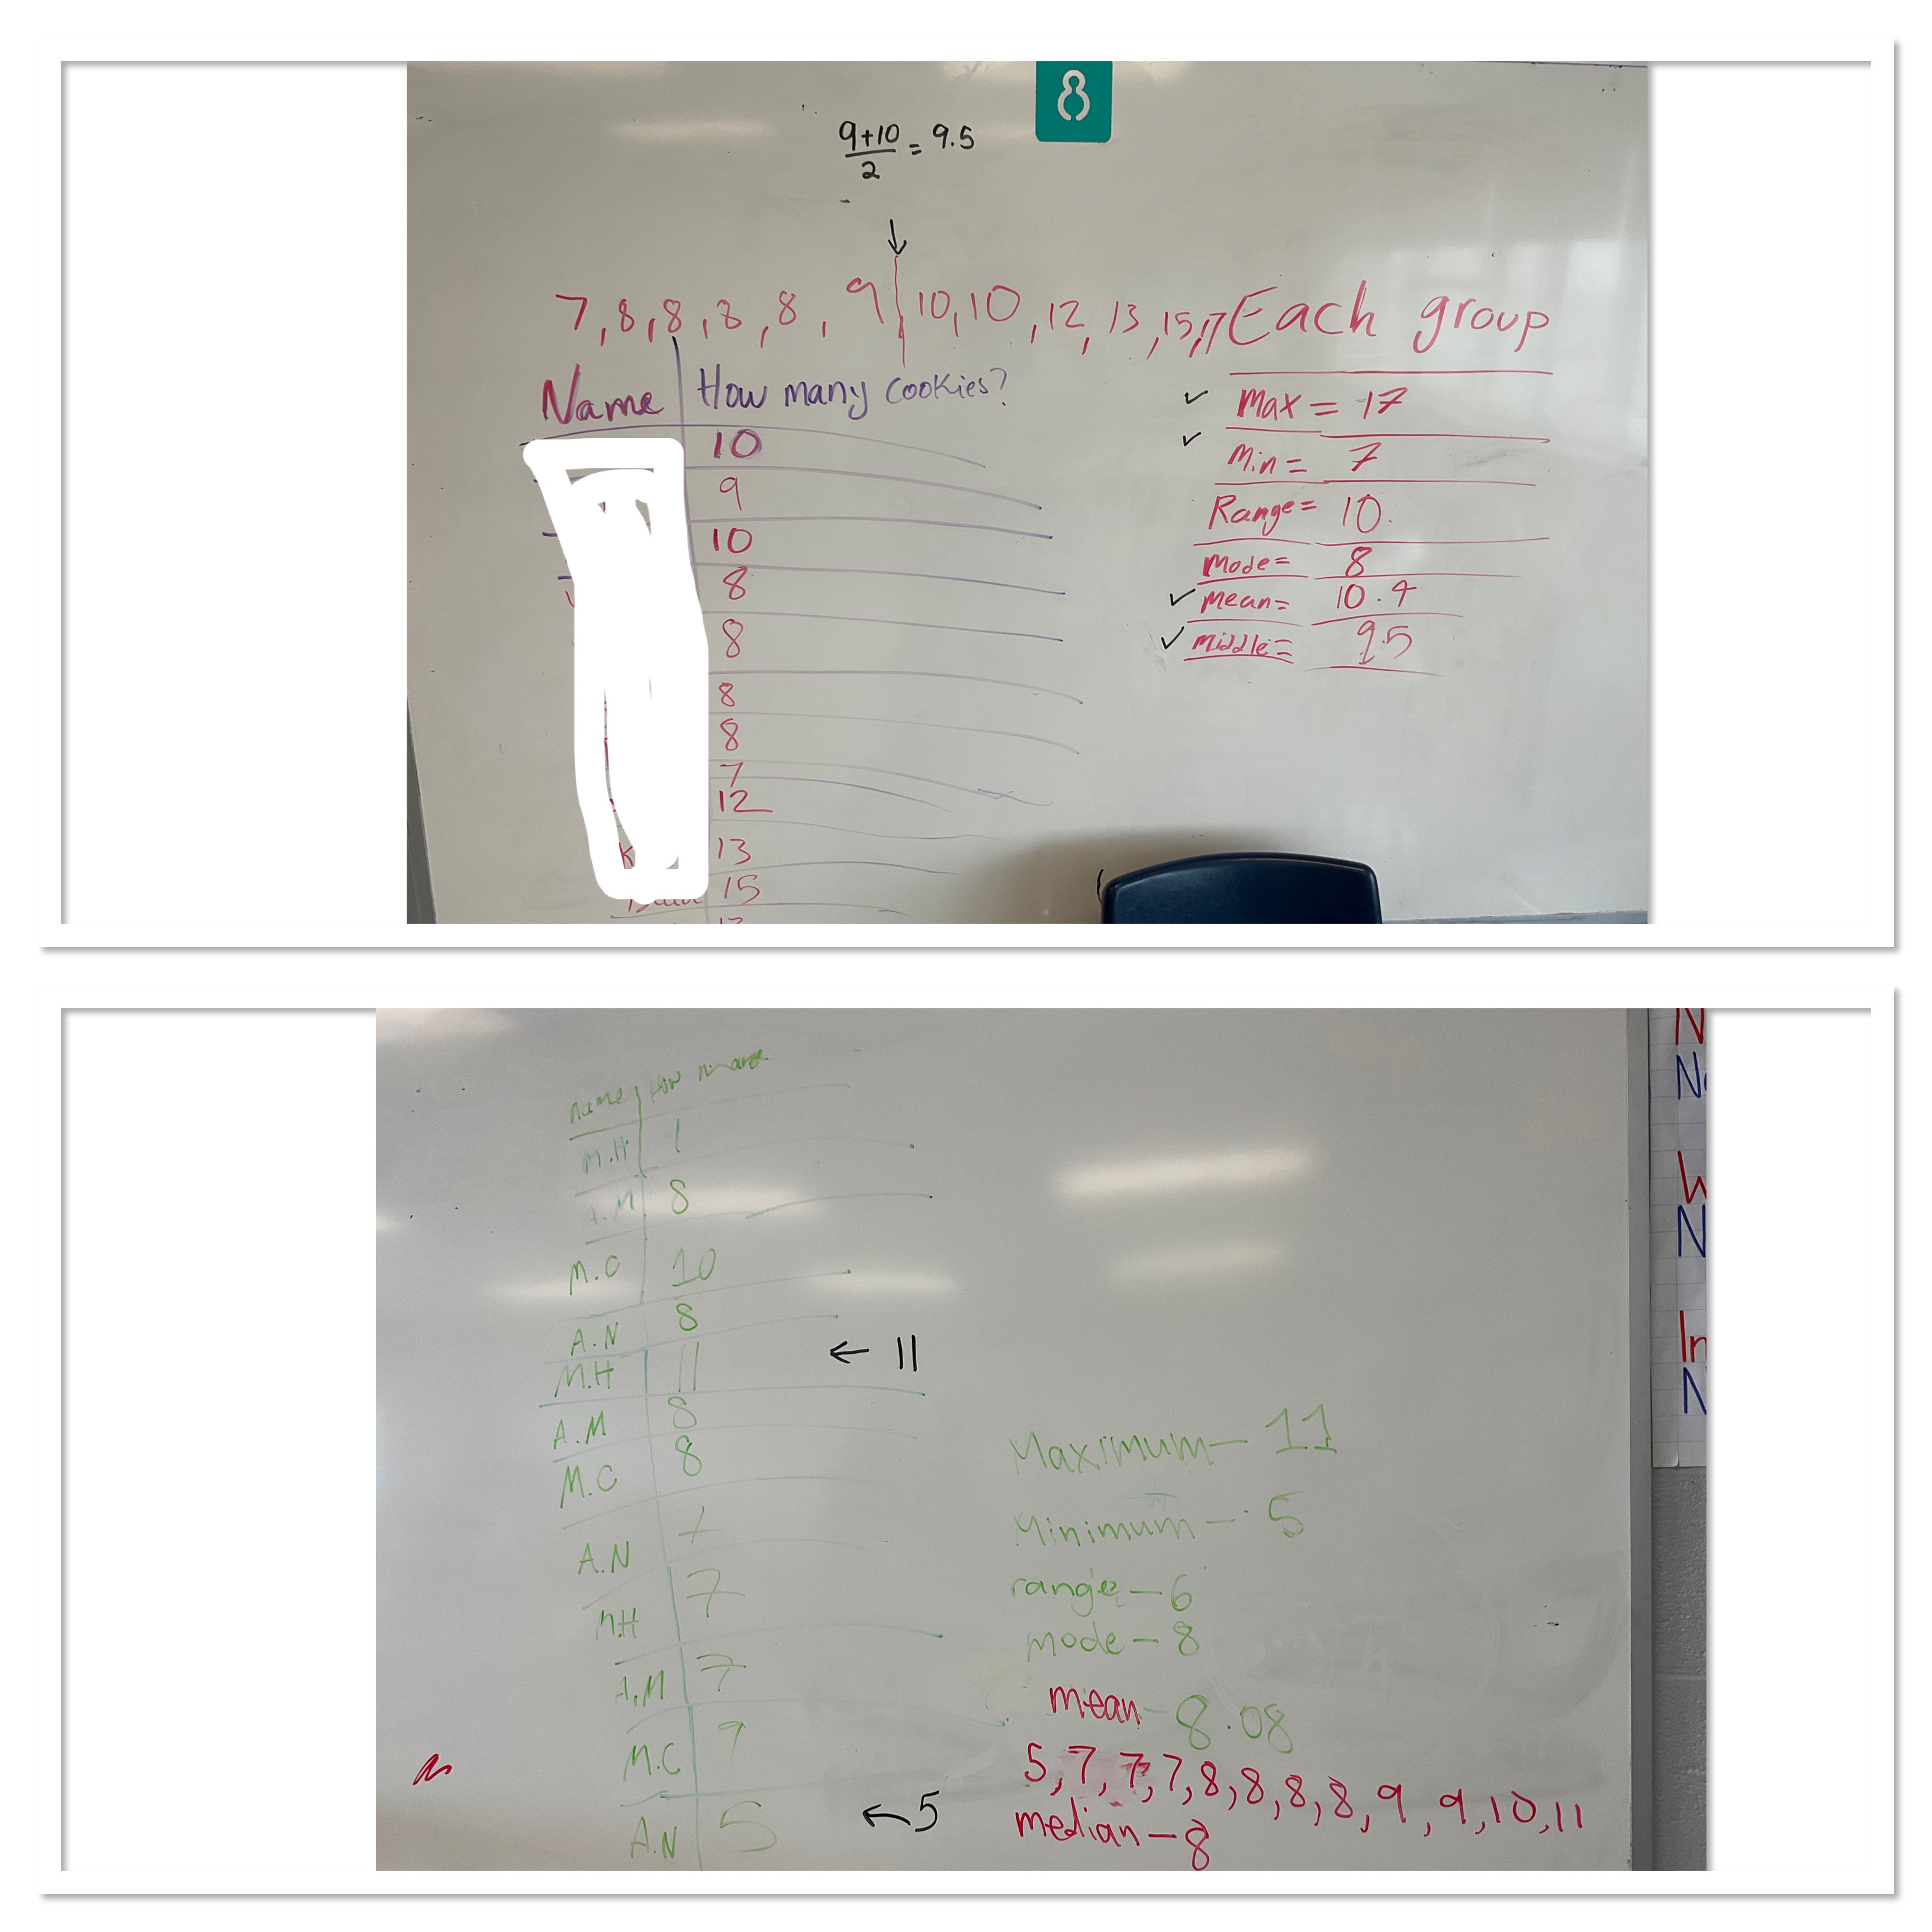
Groups had their data tables complete, then we had to decide who wins. Each group found their max, min, range, mode, mean, and median.
We were able to see which group had the highest average tower, and which group had the tallest short tower, and which group had the highest median tower, and which group has the highest repeated tower height. Some groups won on several criteria, and other groups won on other criteria.
The next step we took was to introduce the idea of a box and whisker plot. We had the data in order to calculate the median, so it was a quick process to calculate the quartiles (the middle of the bottom half, and the middle of the top half).
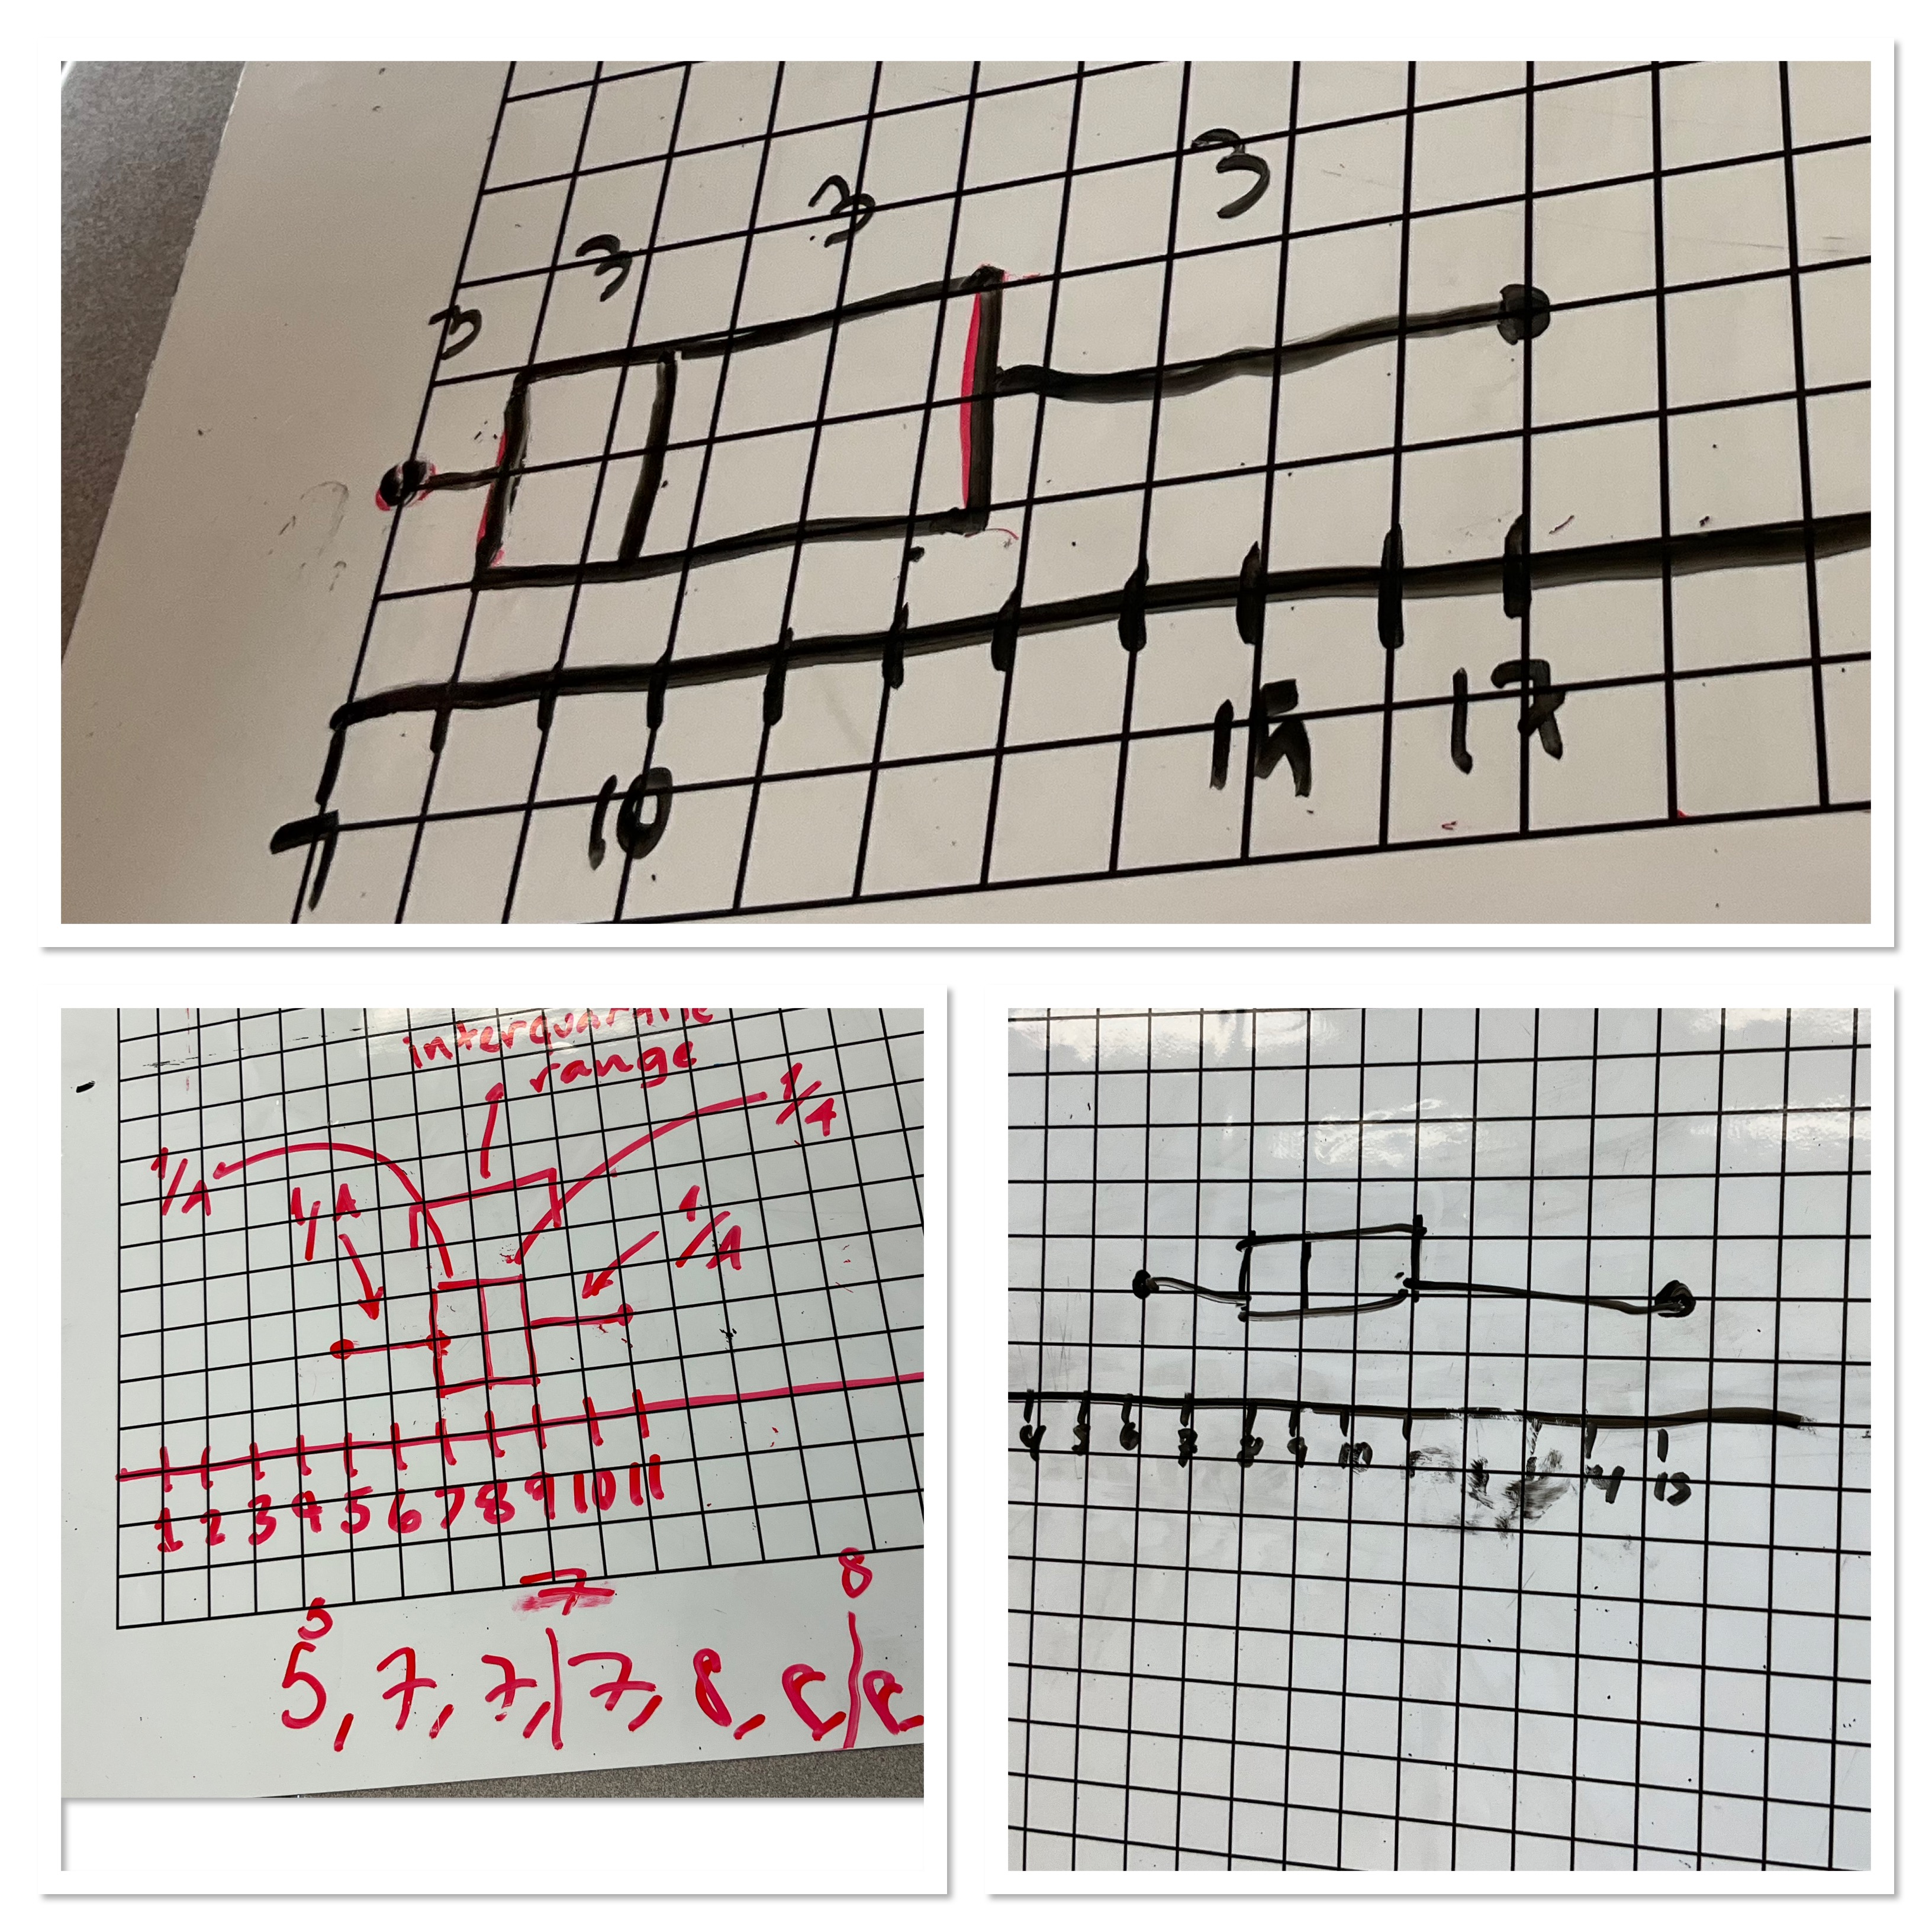
We noticed how easy it is to read the values from the diagrams. If we had 100 data points, searching a list for the maximum, minimum, and determining the median would be tedious. If we were looking at the box and whisker plot we could quickly determine the values at a glance. We can then compare data sets with ease. It was a fun class, and students worked very well together to collect and present their data, and calculations.
Fractions Decimals and Percents
Today grade 9s looked at how to compare fractions, decimals and percents. After a brief introduction and brainstorming session about what we remembered from earlier years, each group got a stack of cards with fractions, decimals and percents on them. Groups were tasked to put them in order.
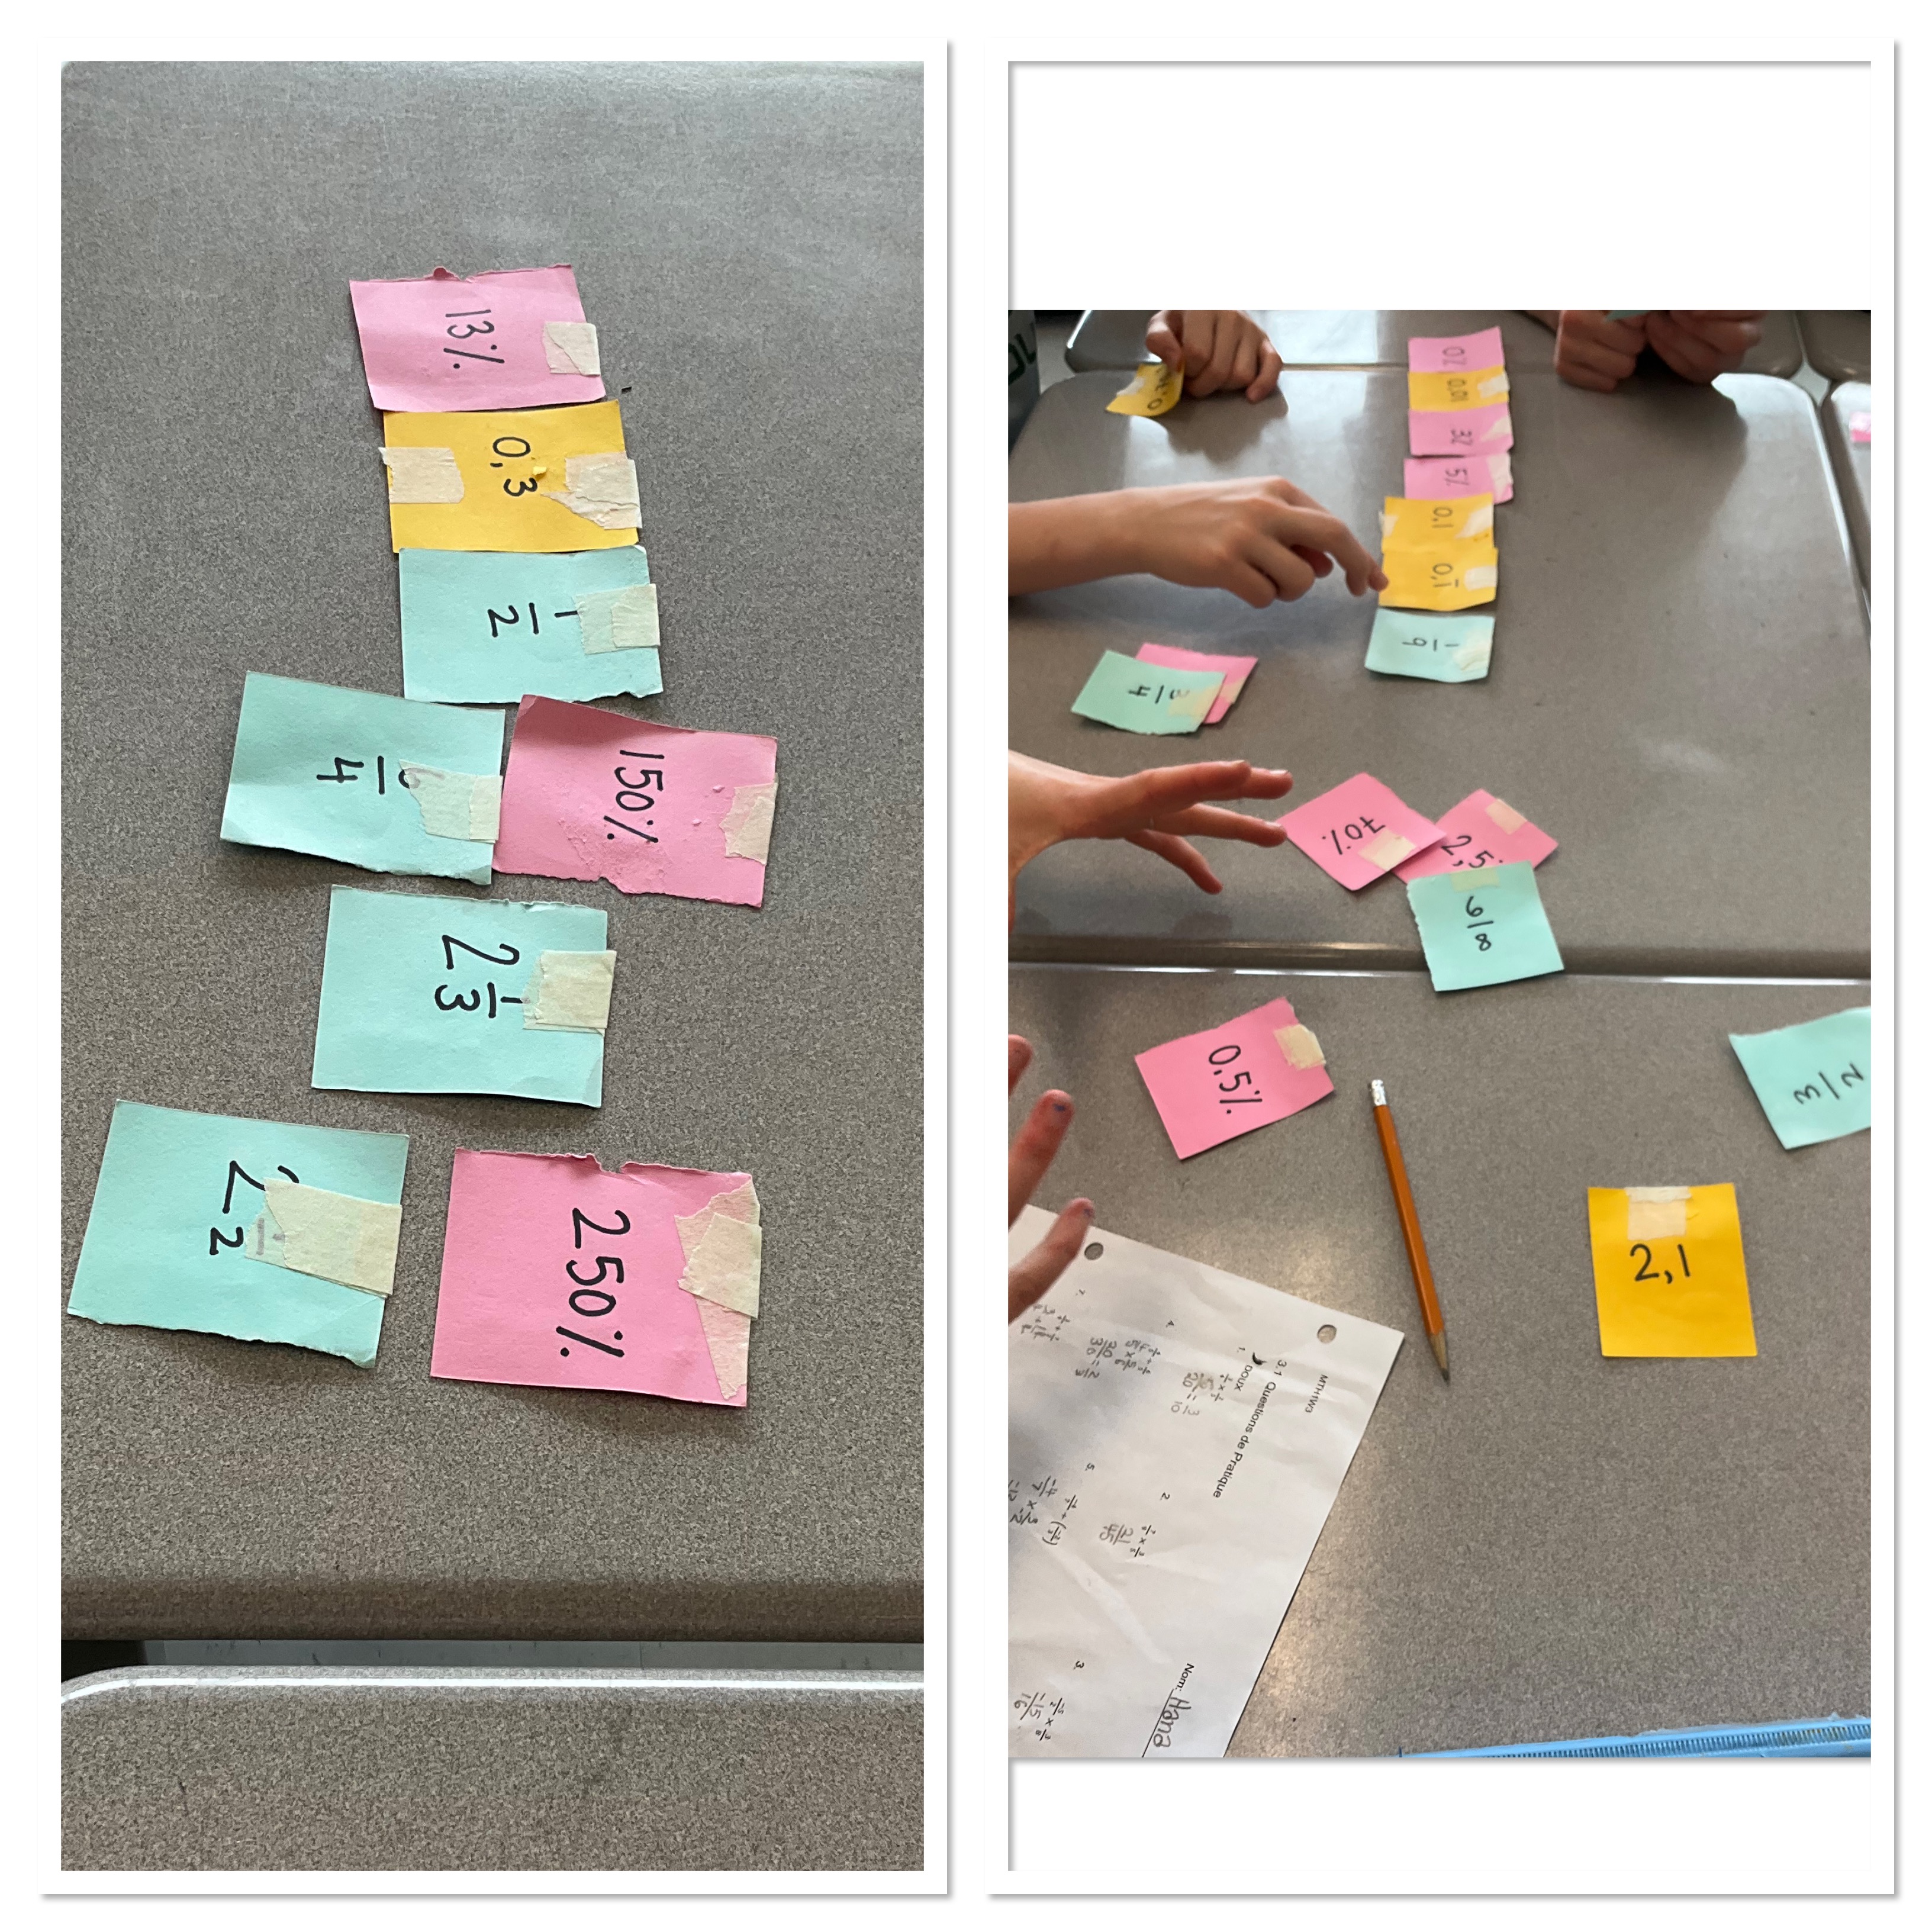
There were good conversations at each table about equivalencies, and how to make comparisons. Some groups looked at numerator and denominator sizes, and others made everything into decimals and compared.
All groups next had the mission of sorting all of the cards from all of the groups into one big number line. To start this, one member from each group brought their group’s smallest value to one end of our whiteboard and decided amongst themselves which was the smallest smallest value. Another member of each group brought their largest value to the other end of our whiteboard and decided amongst themselves which was the largest largest value. From there we started to put all of the cards in order.
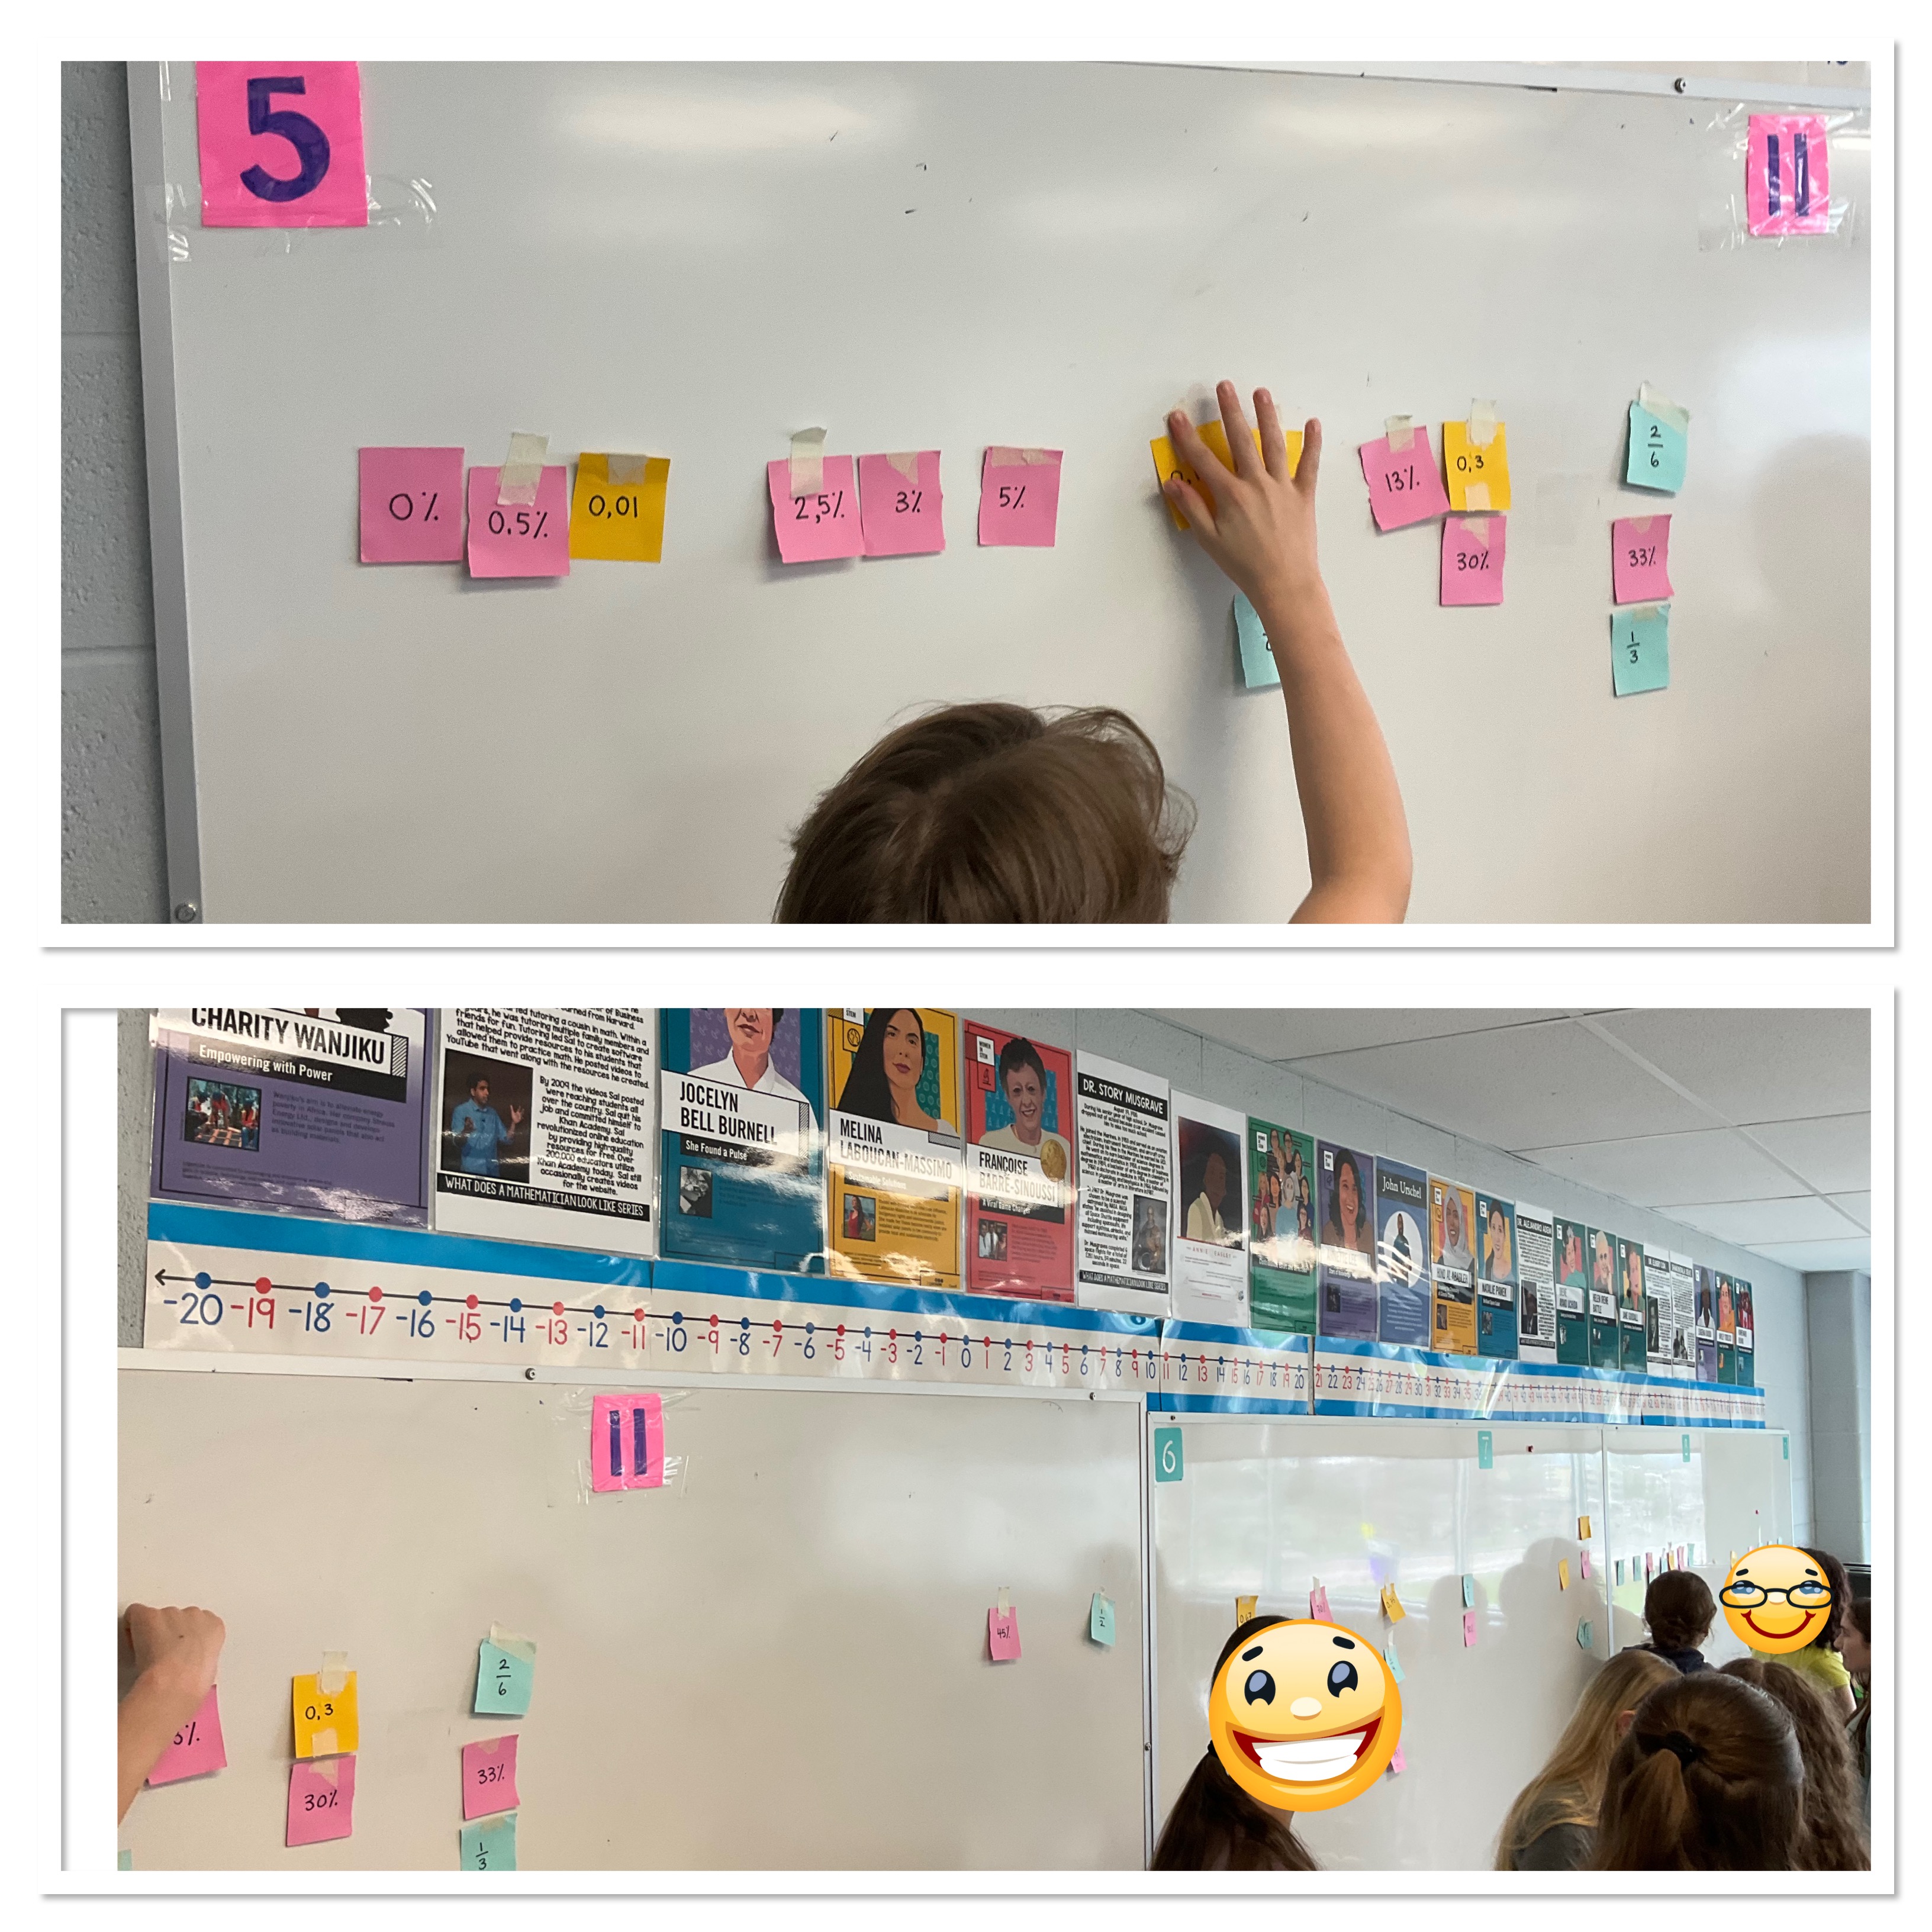
We had some excellent conversations and some leaders emerged to place the benchmark values of 1/2, 1, 1.5, 2, 2.5 in place, then order the others within the sections.
Unfortunately today was super humid, and the tape was not cooperating, so cards were falling off the wall as we worked, and as I was consolidating.
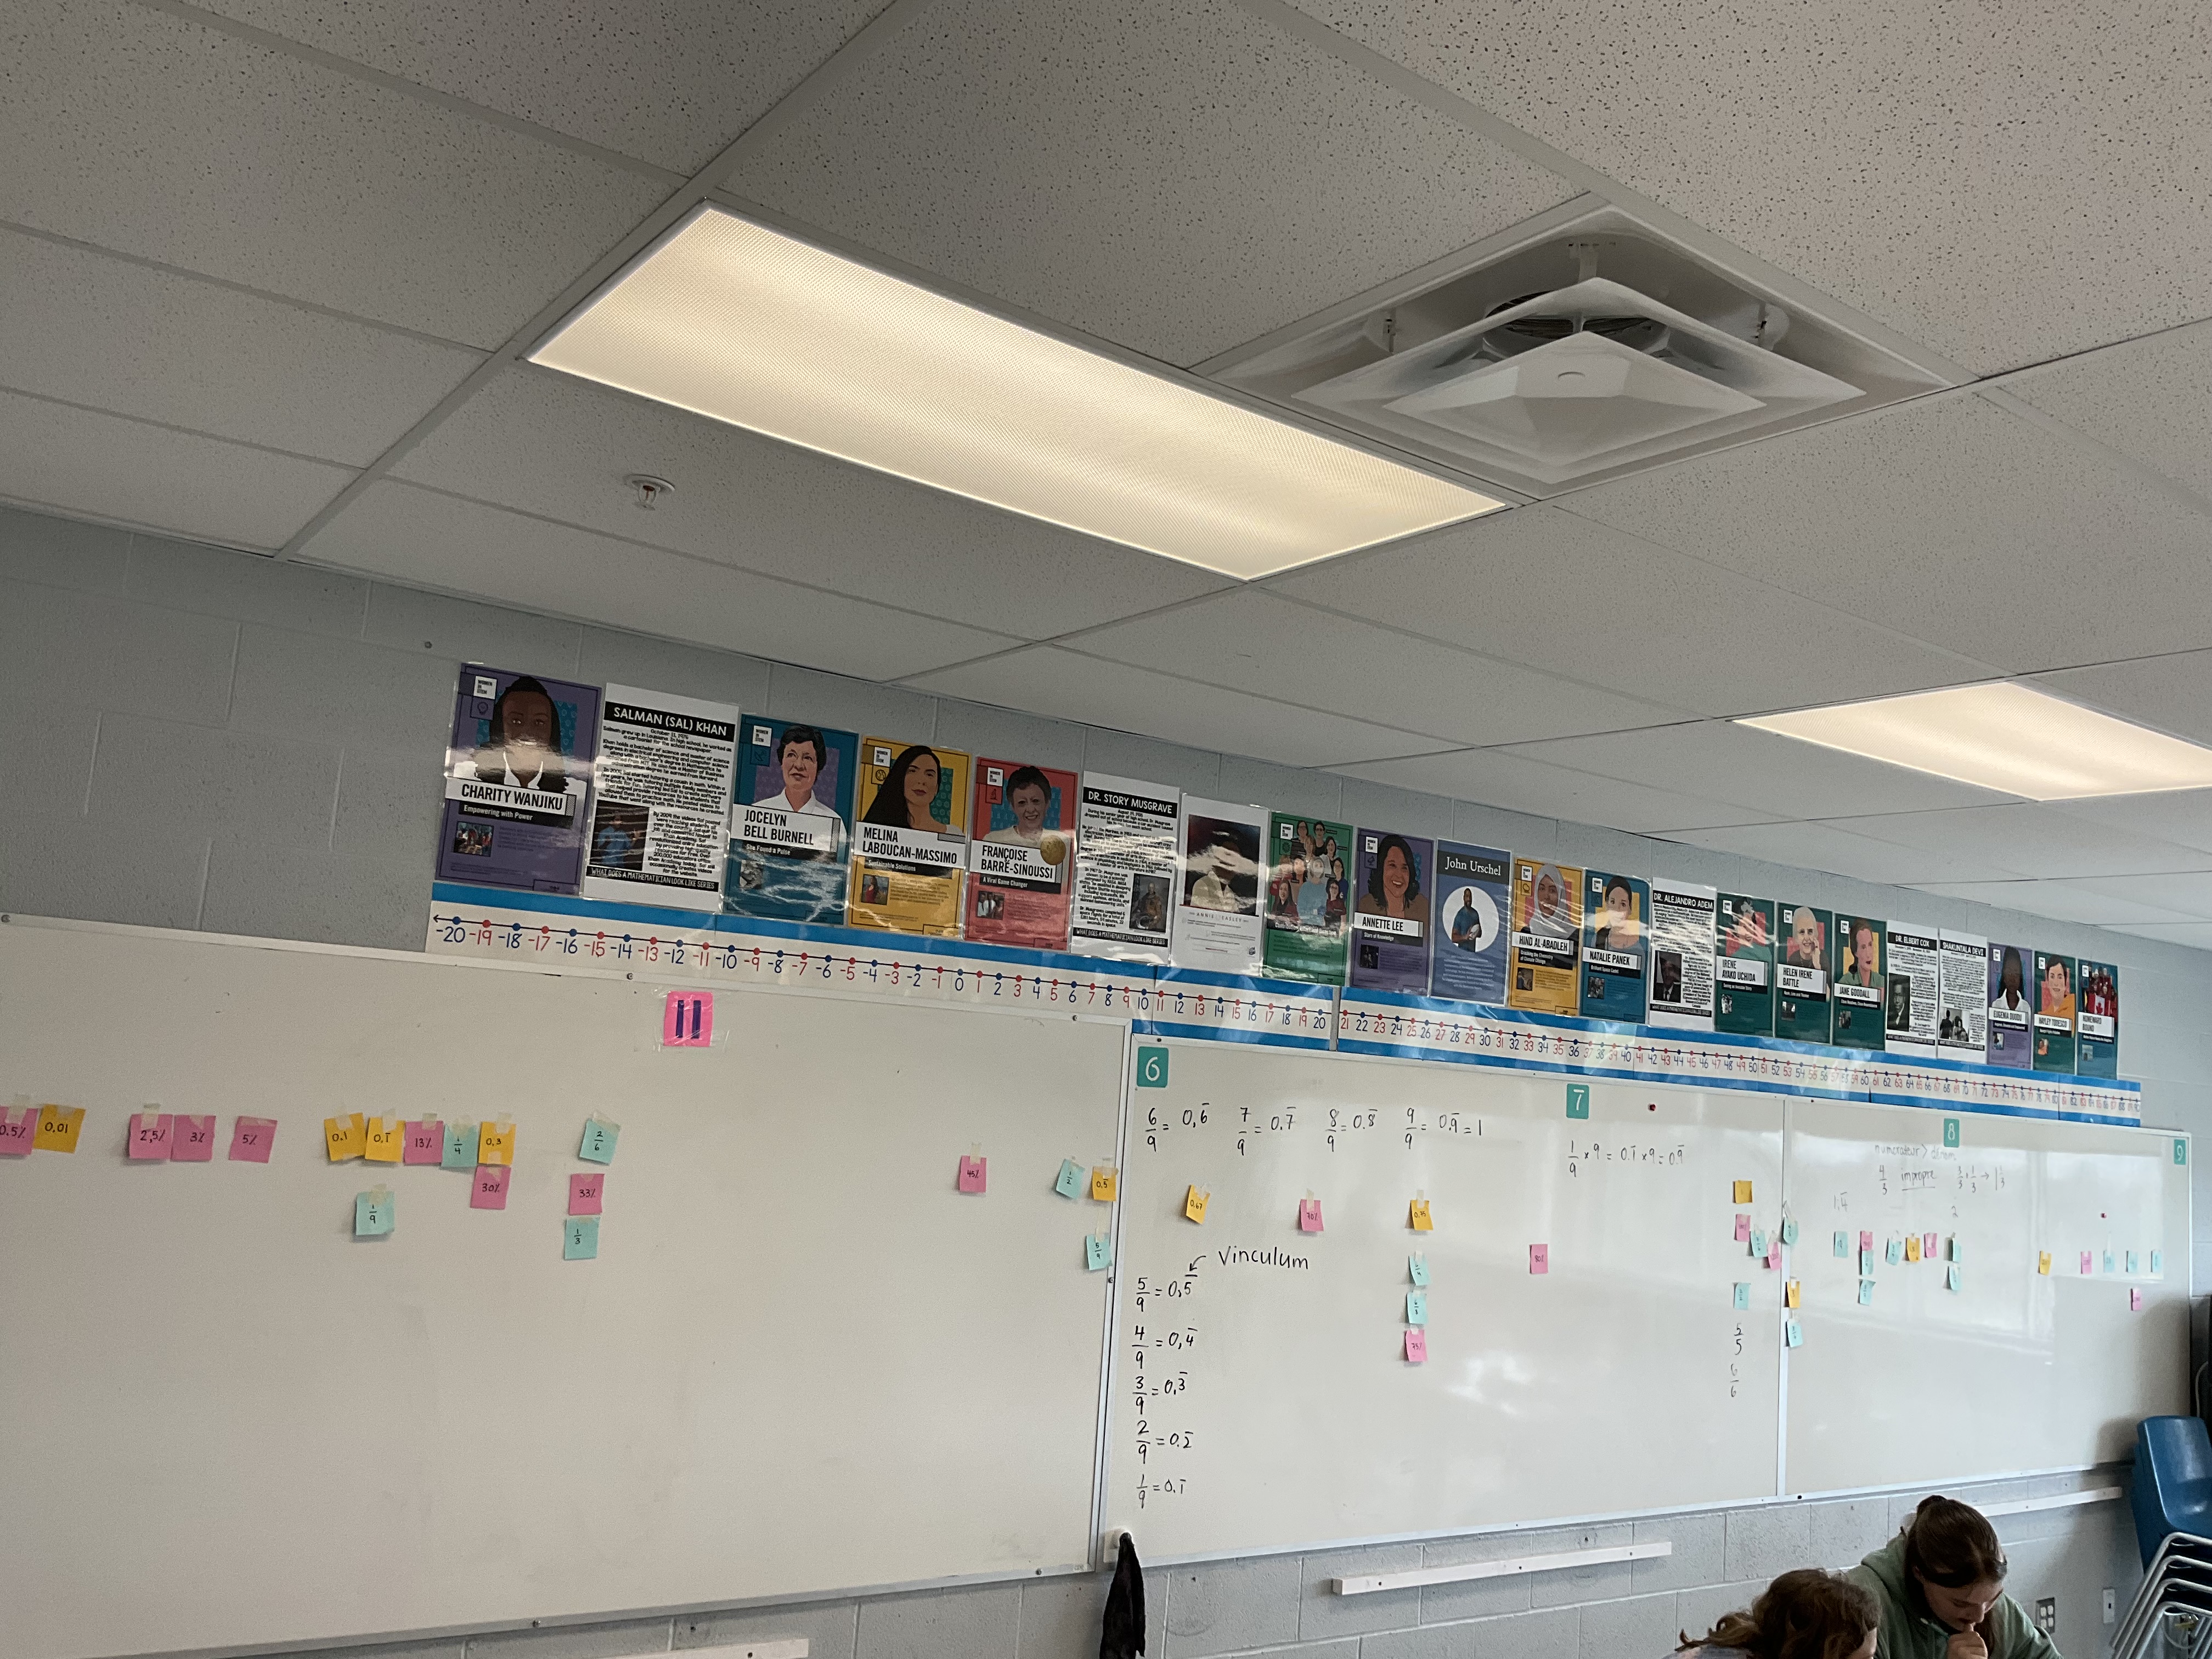
We learned about how to determine the decimal value for ninths, e.g. 4/9=0.4444 repeating. We also saw how 0.9999 repeating equals exactly 1, because it is 9/9 which is 1. A bit mindblowing.
we saw how some fractions are improper, the numerator is higher than the denominator. We looked at how to write them as mixed numbers as well, and we saw how various representations can have the same value, e.g. 8/4, 2, 6/3, 200%
It was a great way to end a short week. P.A. Day tomorrow 🙂

