Algetiles
We are starting to talk about integers and variables, and algetiles are a great tool to use to help the concepts become less abstract.
We call the little red squares 1, and the little blue squares -1. We looked at how a red square and a blue square together would cancel each other out to make zero.
When we start talking about variables, the long rectangles represent a positive and negative x. Before long we were adding binomials: here is (2x+4)+(-3x+1).
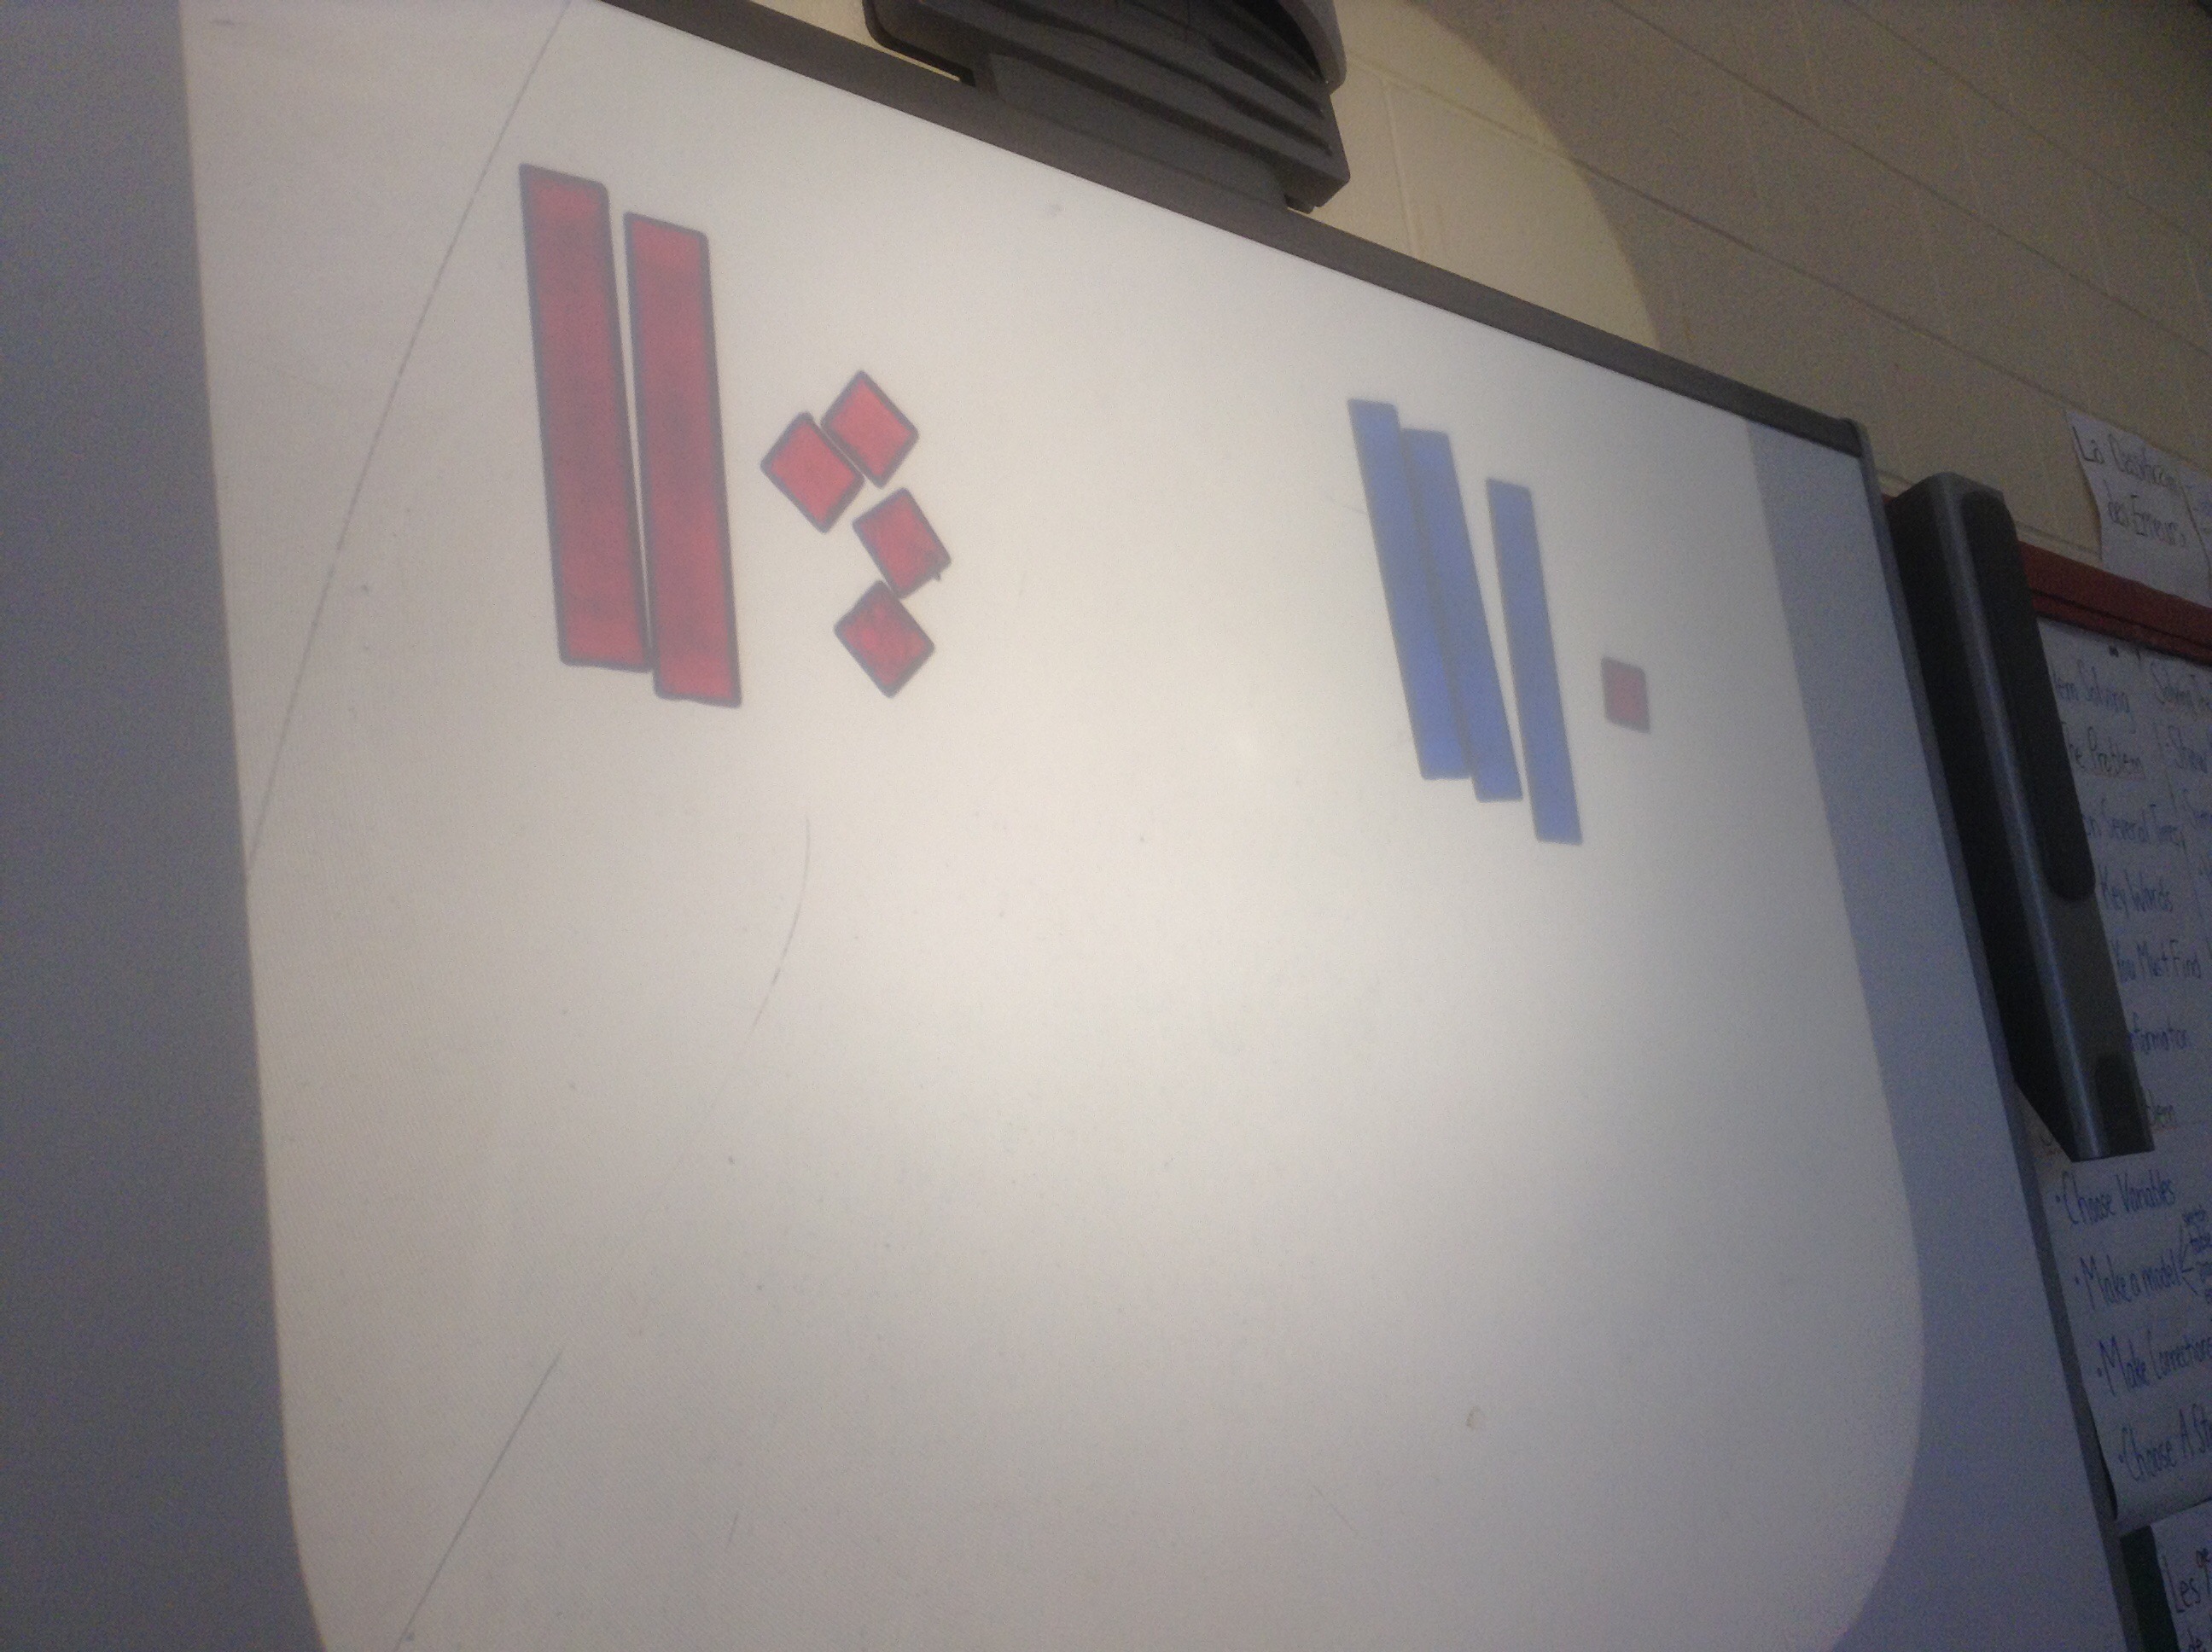
We can simplify the expression and cancel out some of the terms by matching up pairs of zeros.
We will be using algetiles a lot over the next 2 years.
Twin day!

Geometry Practice and Proofs
We’re working on reading questions clearly, and deciding which quadrilateral meets the description given.

Side length, perpendicular/parallel sides, diagonals that are the same length, or that are perpendicular, or that cut each other in half are all possible clues.
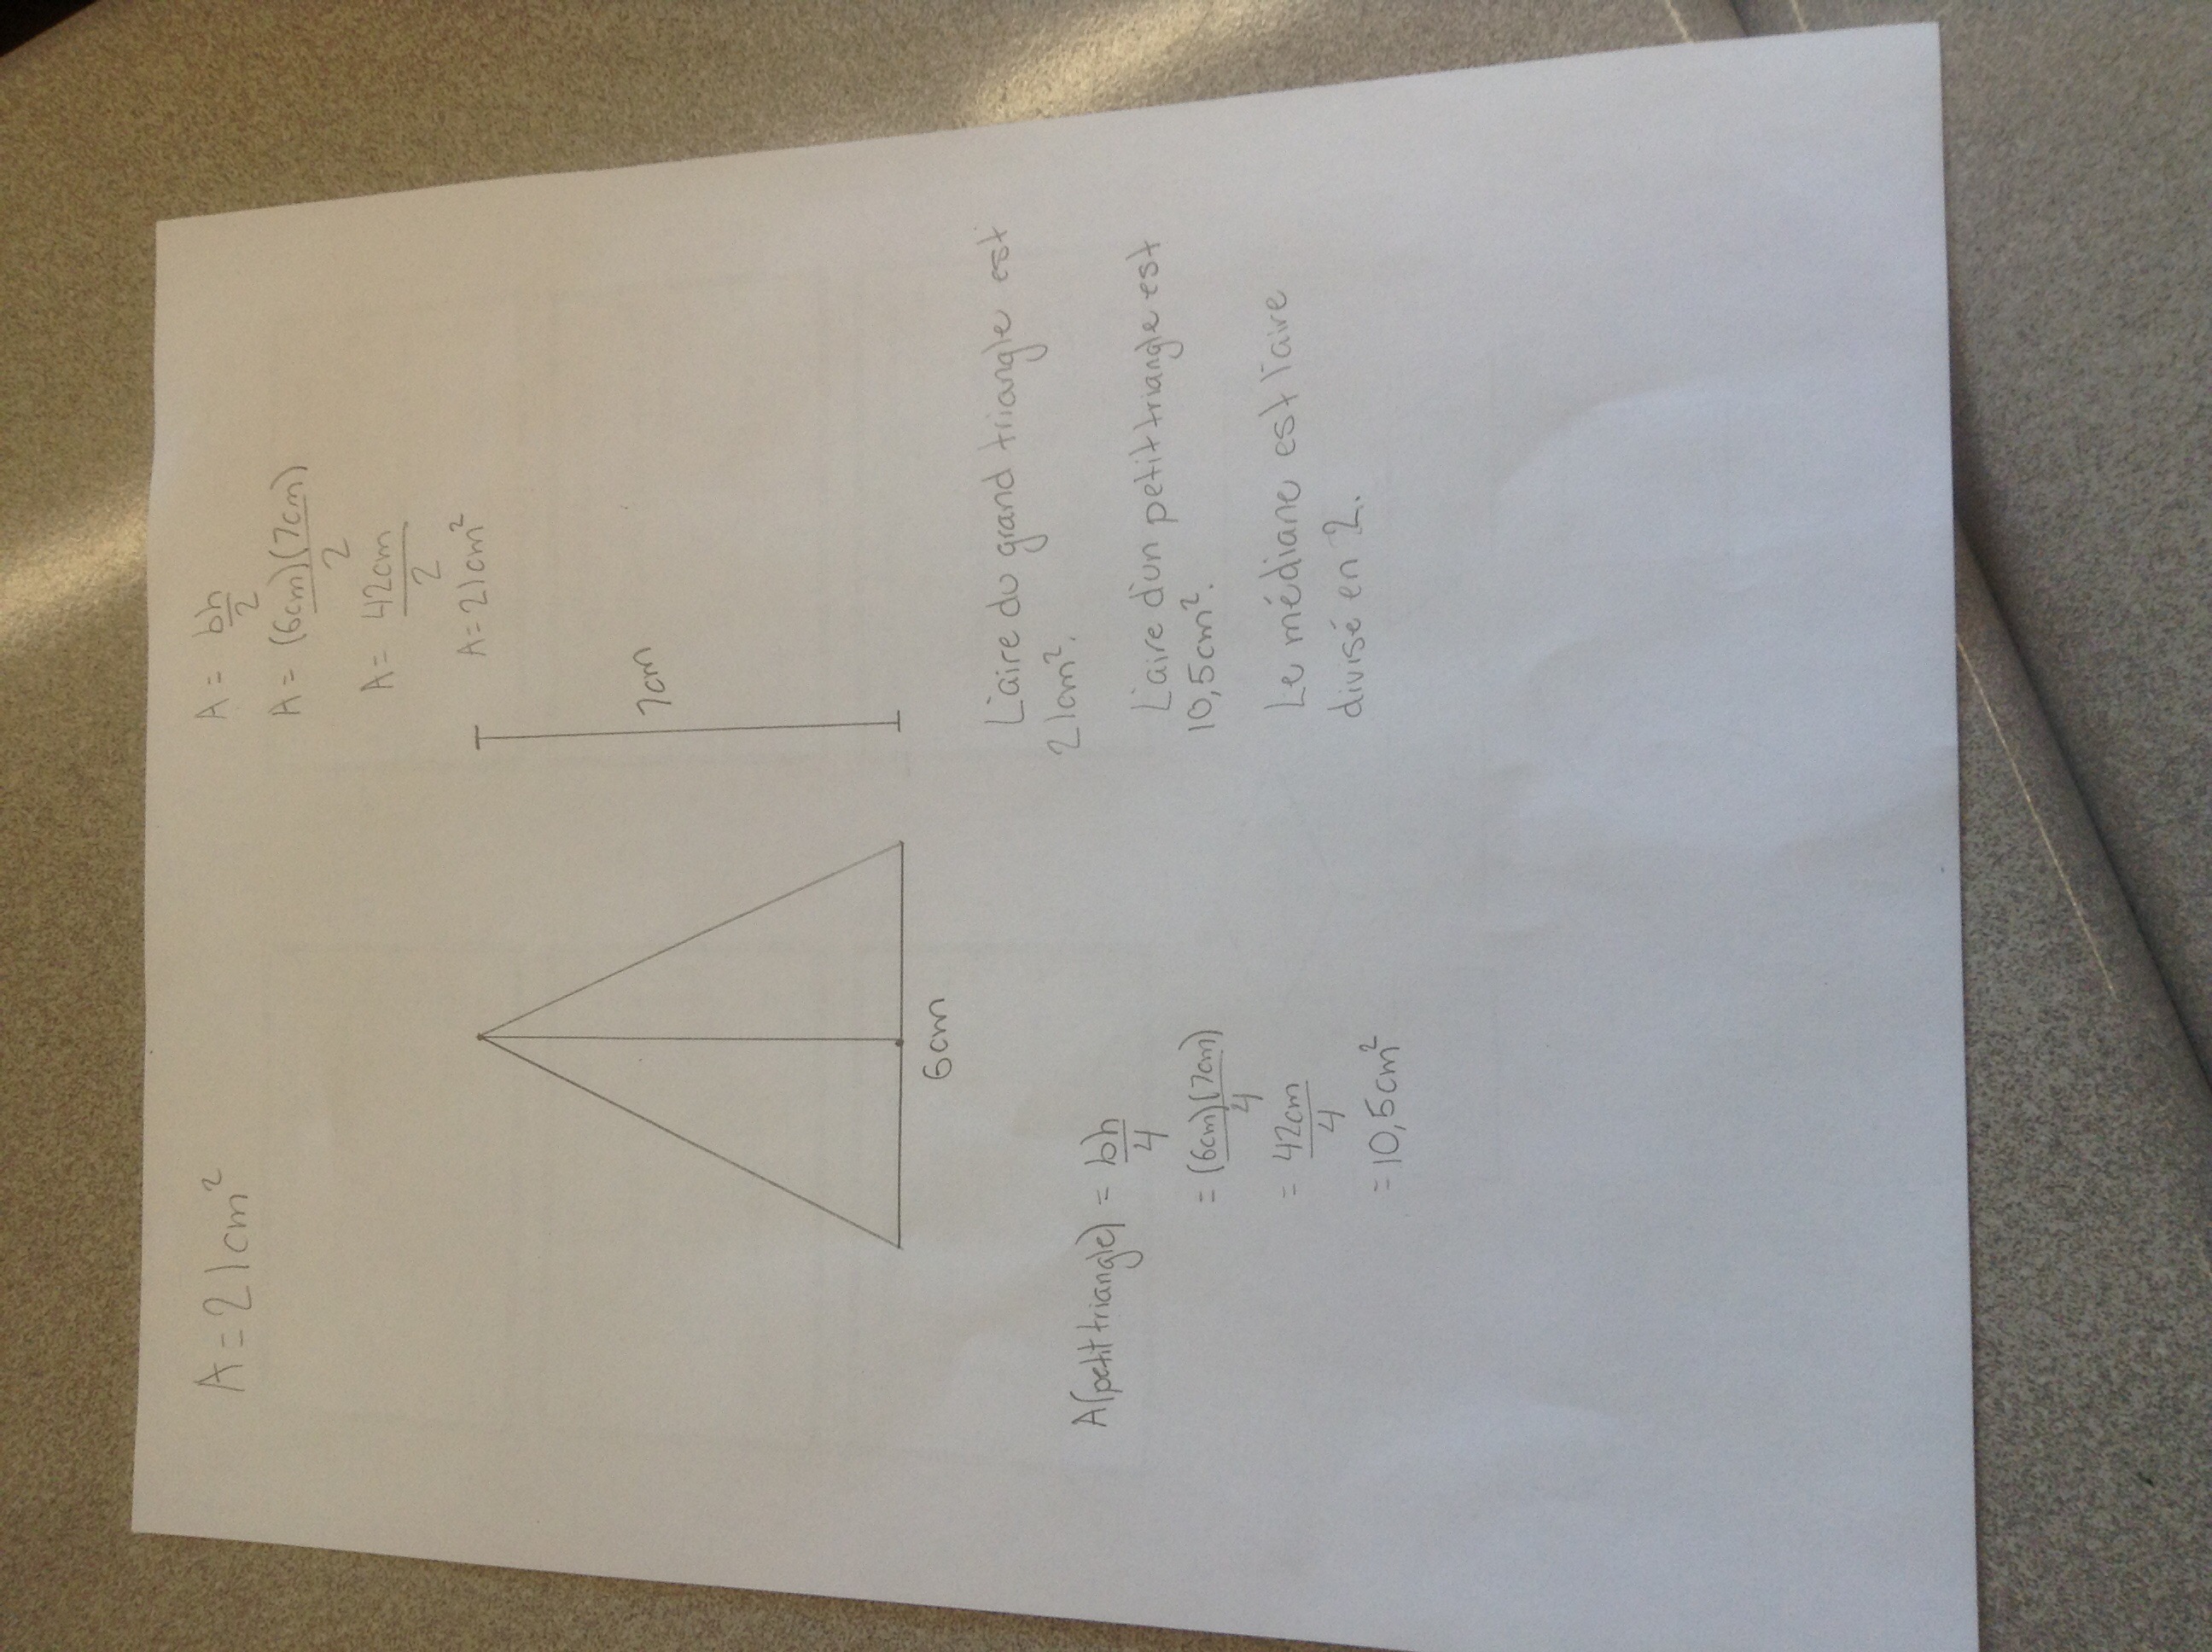
We also proved to ourselves that the median of a triangle divides the area in half.
Visual patterns
We looked at several patterns today.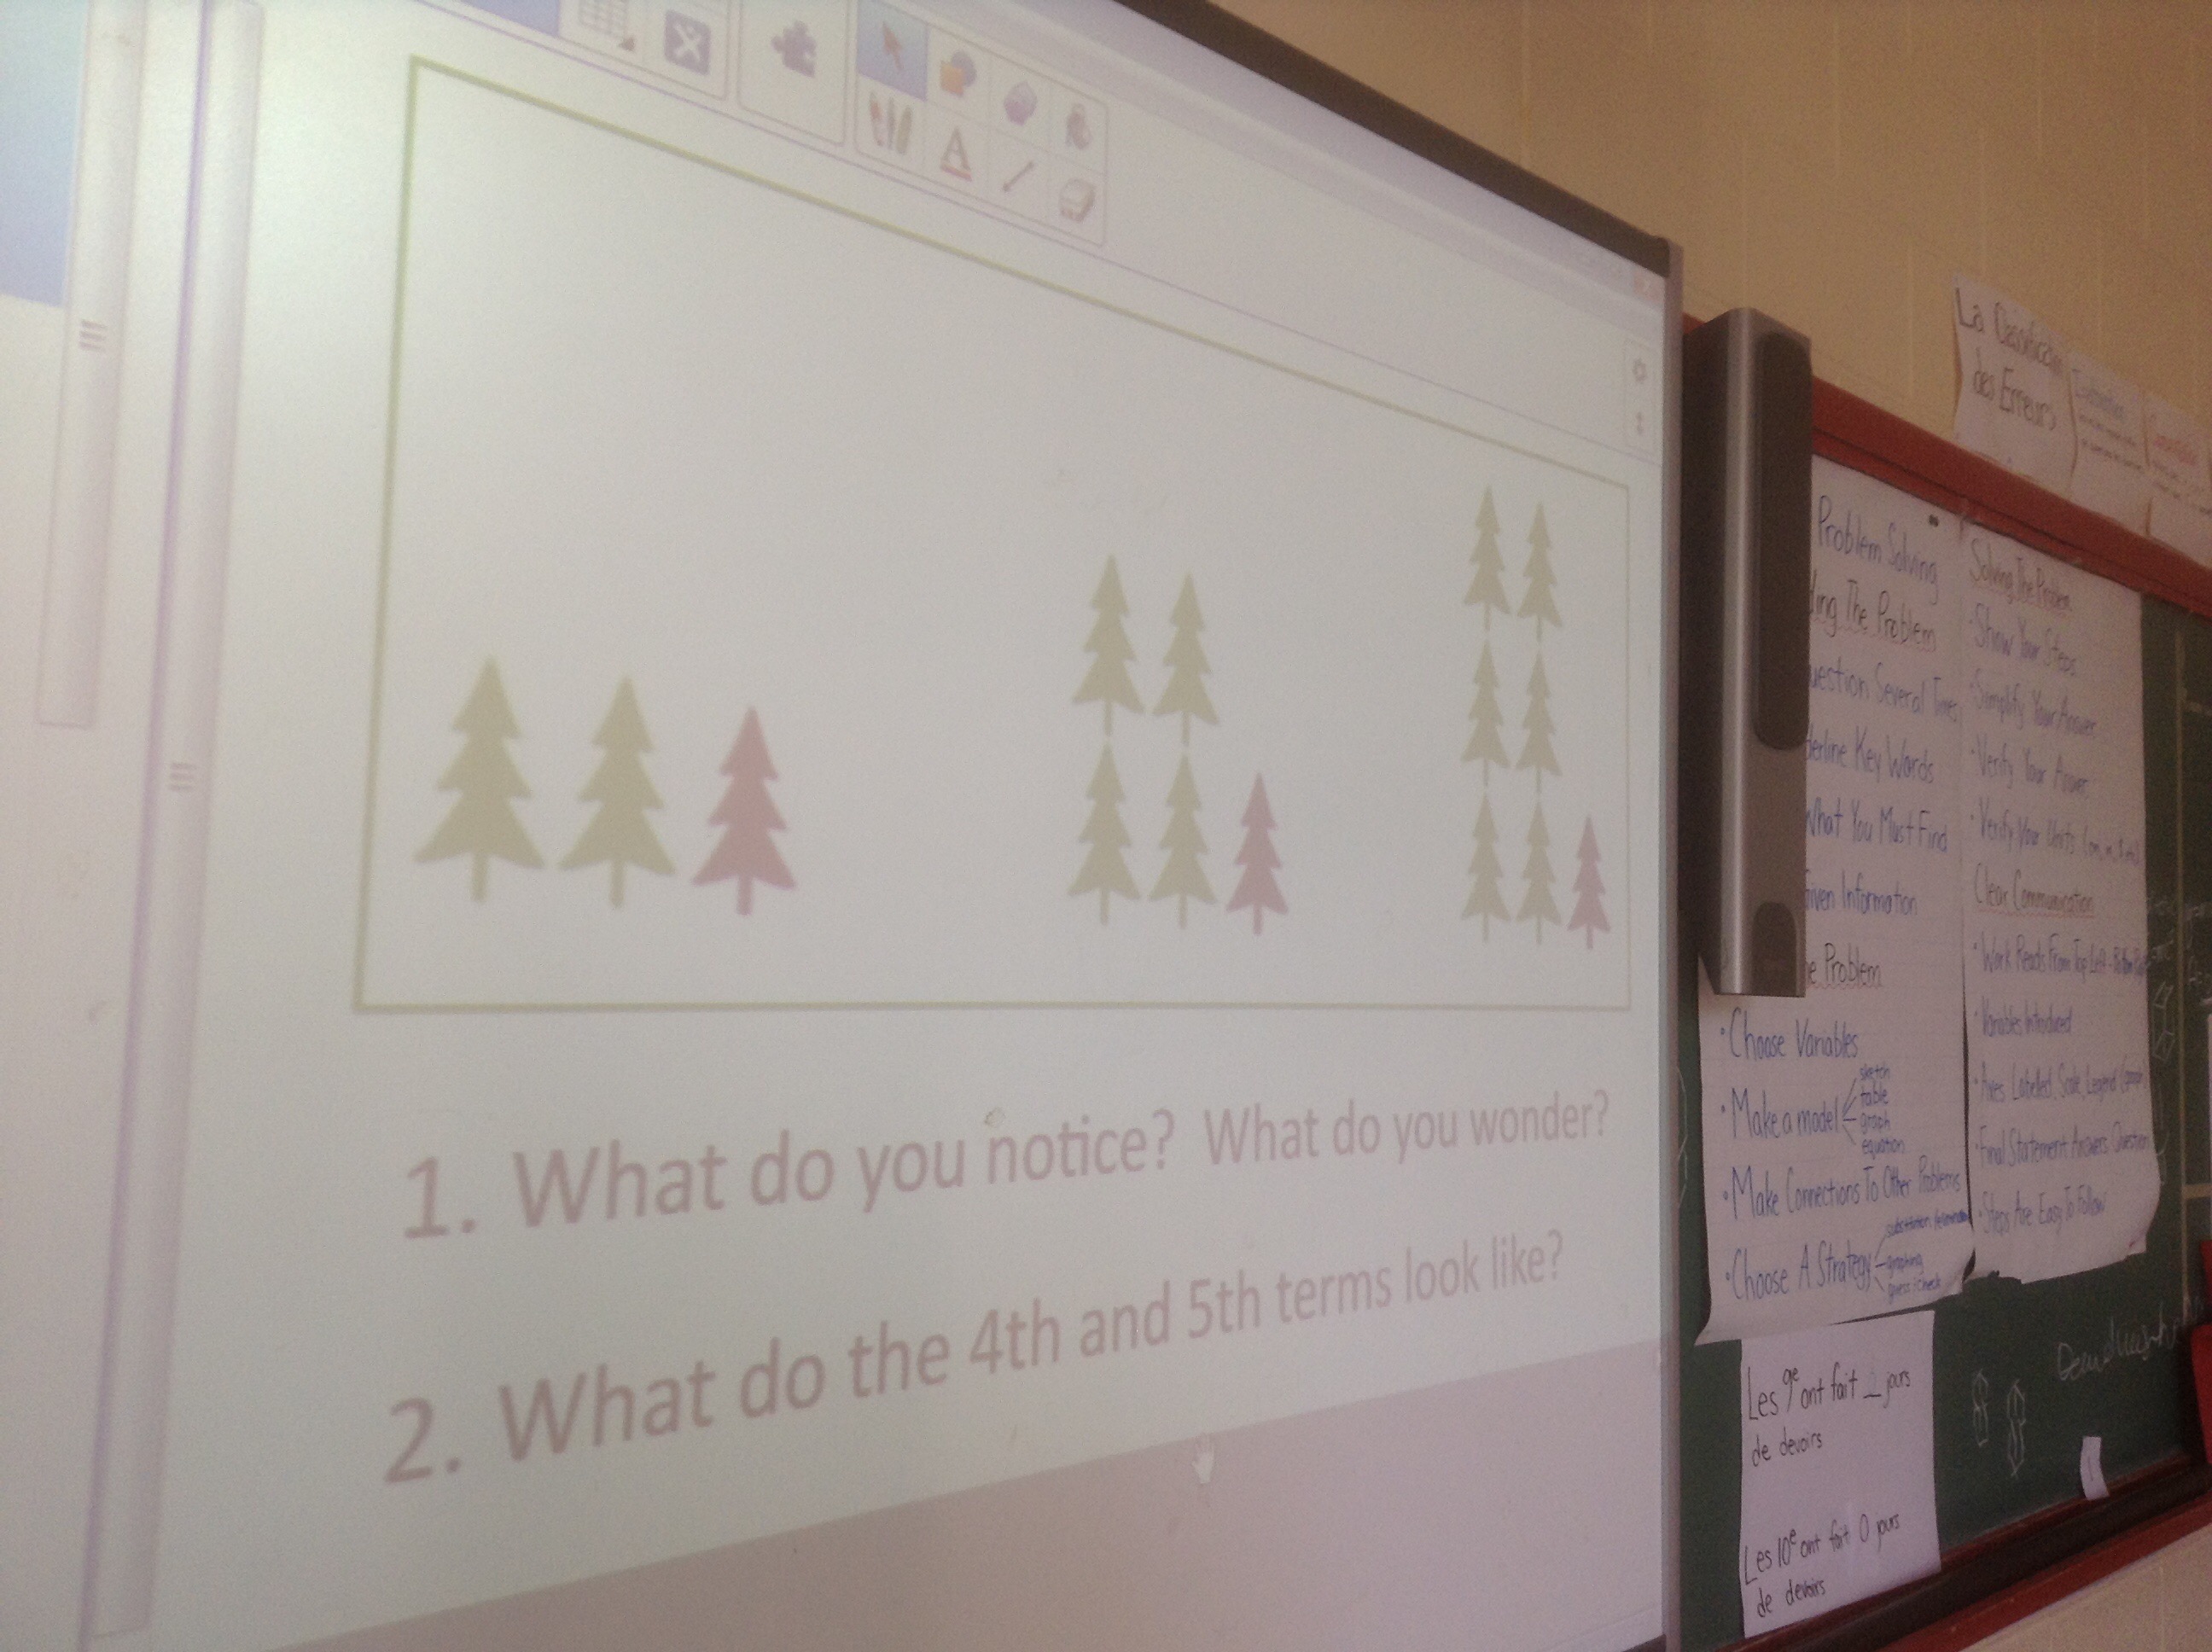
We represented what the next terms would be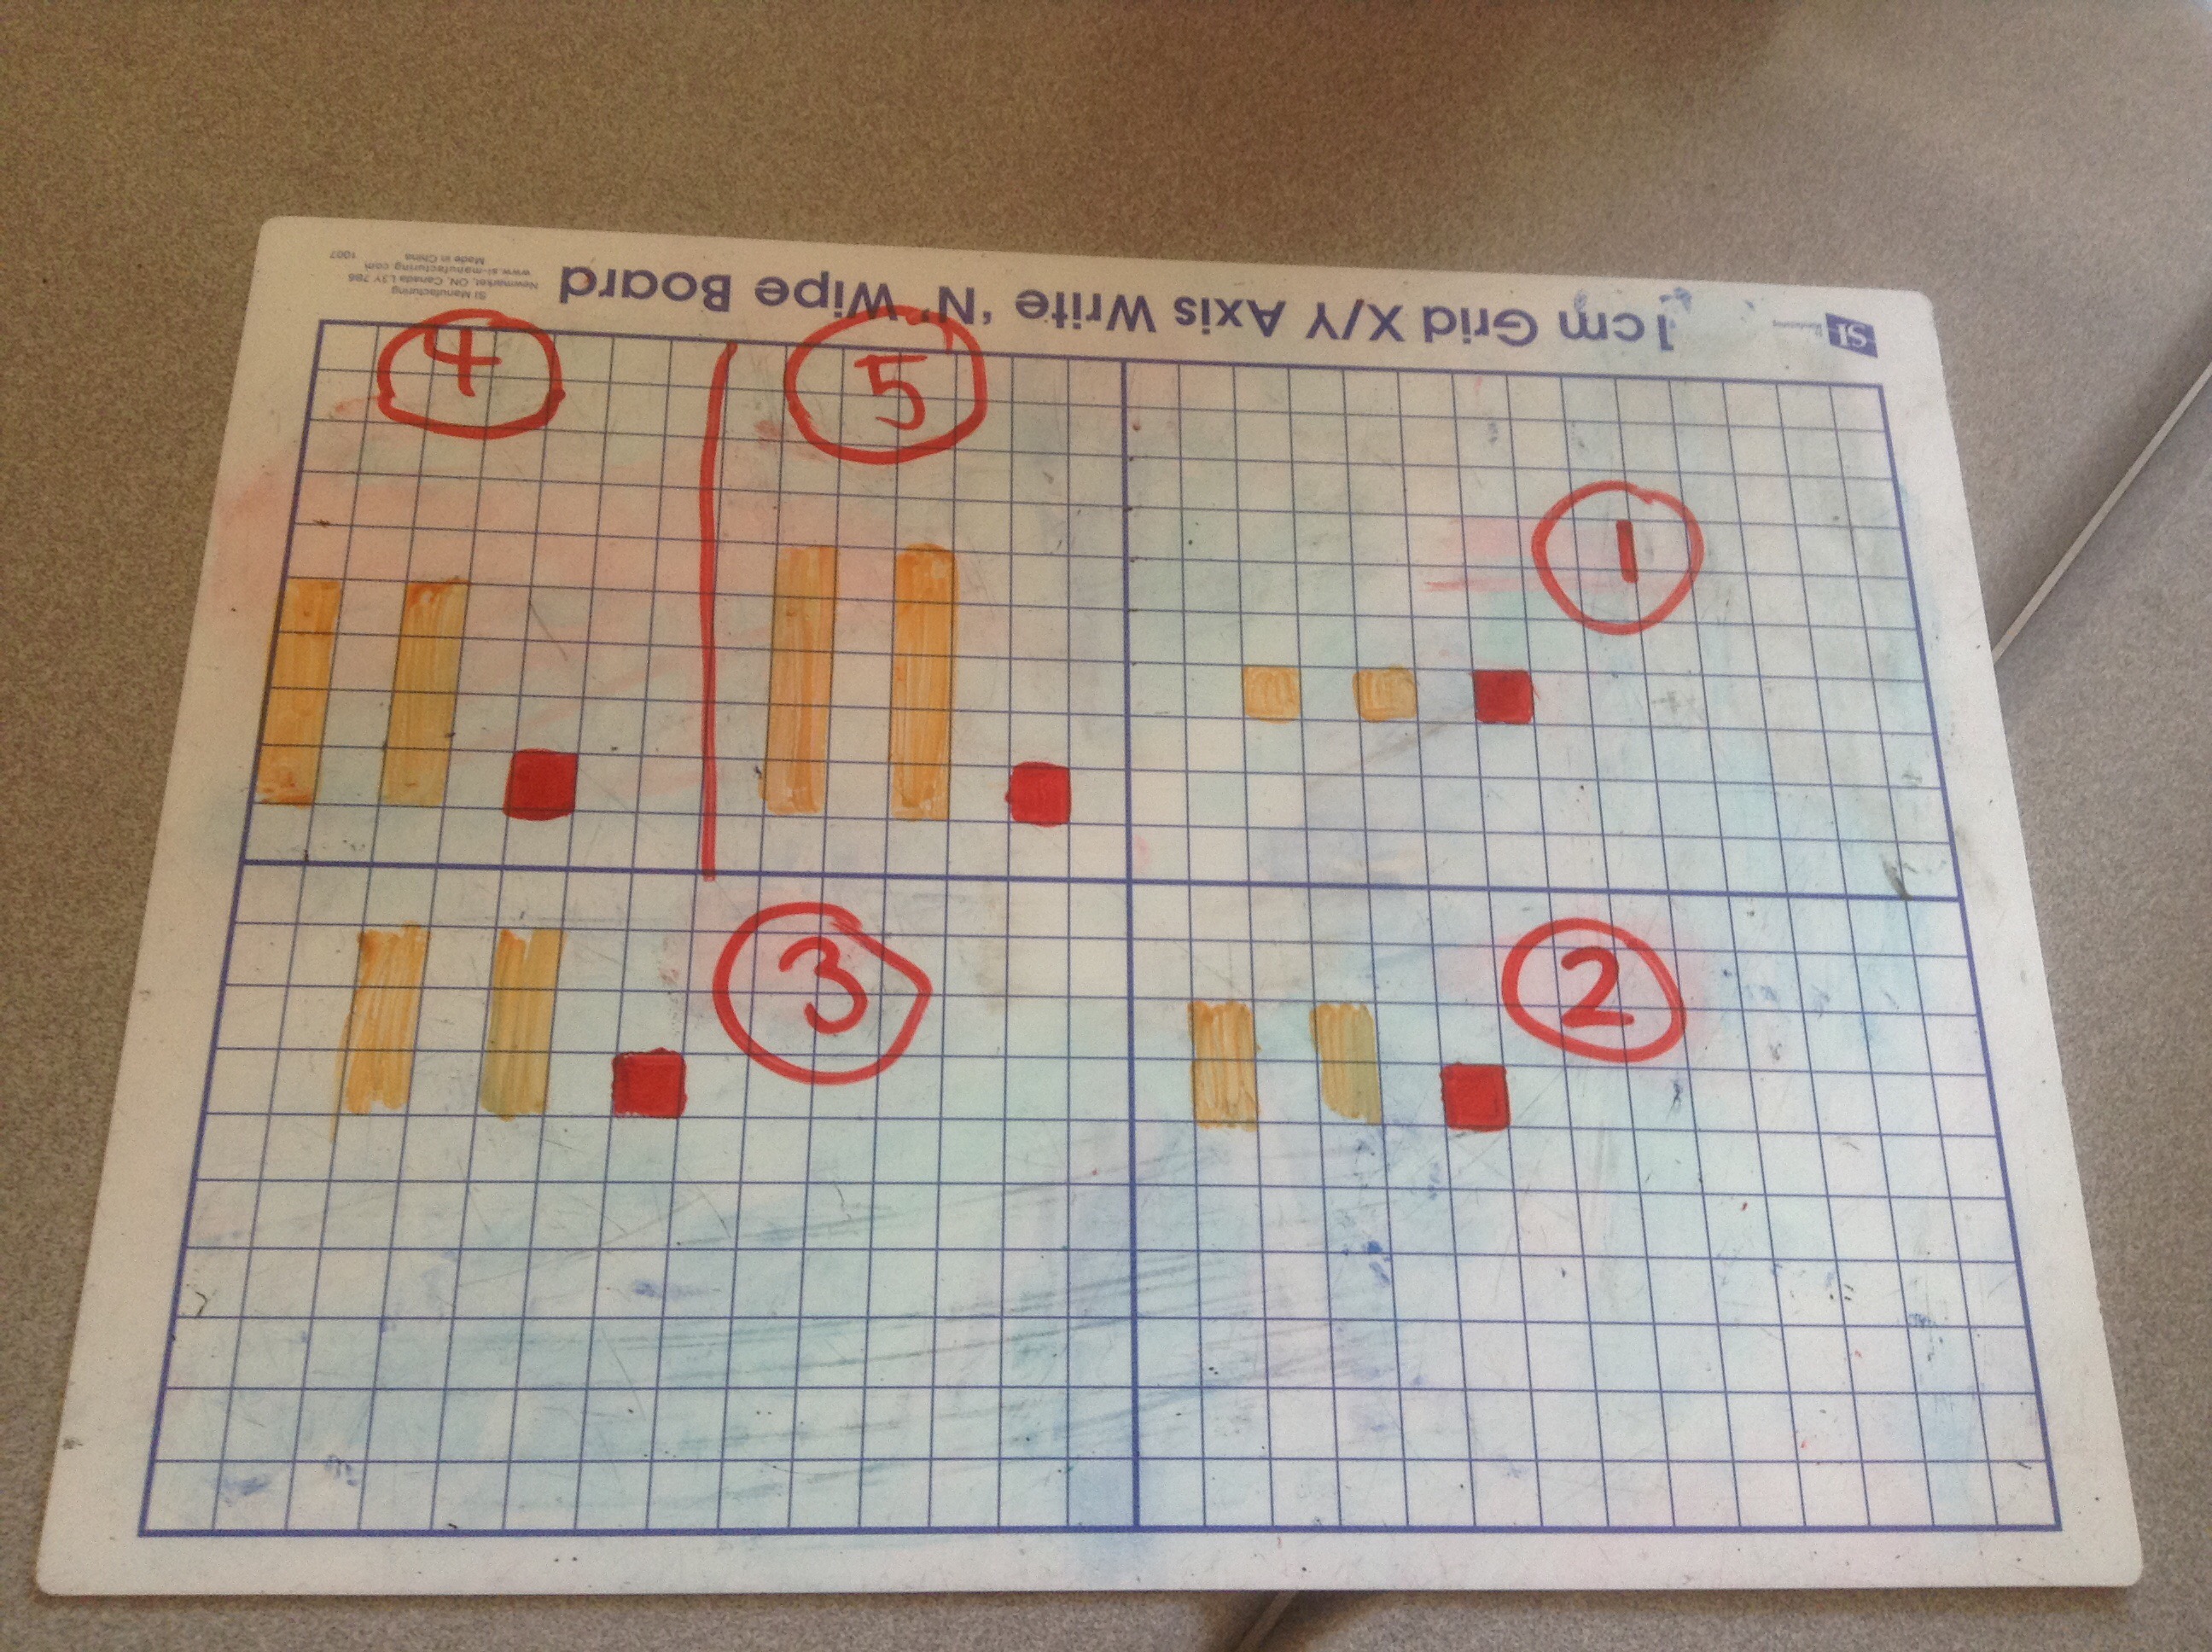

It’s interesting all the different strategies we have for finding the 10th term. Some people saw this one as an x thats getting bigger by 4 each time. Others noticed that there is one block past the middle for the first term, and two blocks past the middle for the second term, so we could draw the tenth term as 10 blocks out from the middle in 4 directions.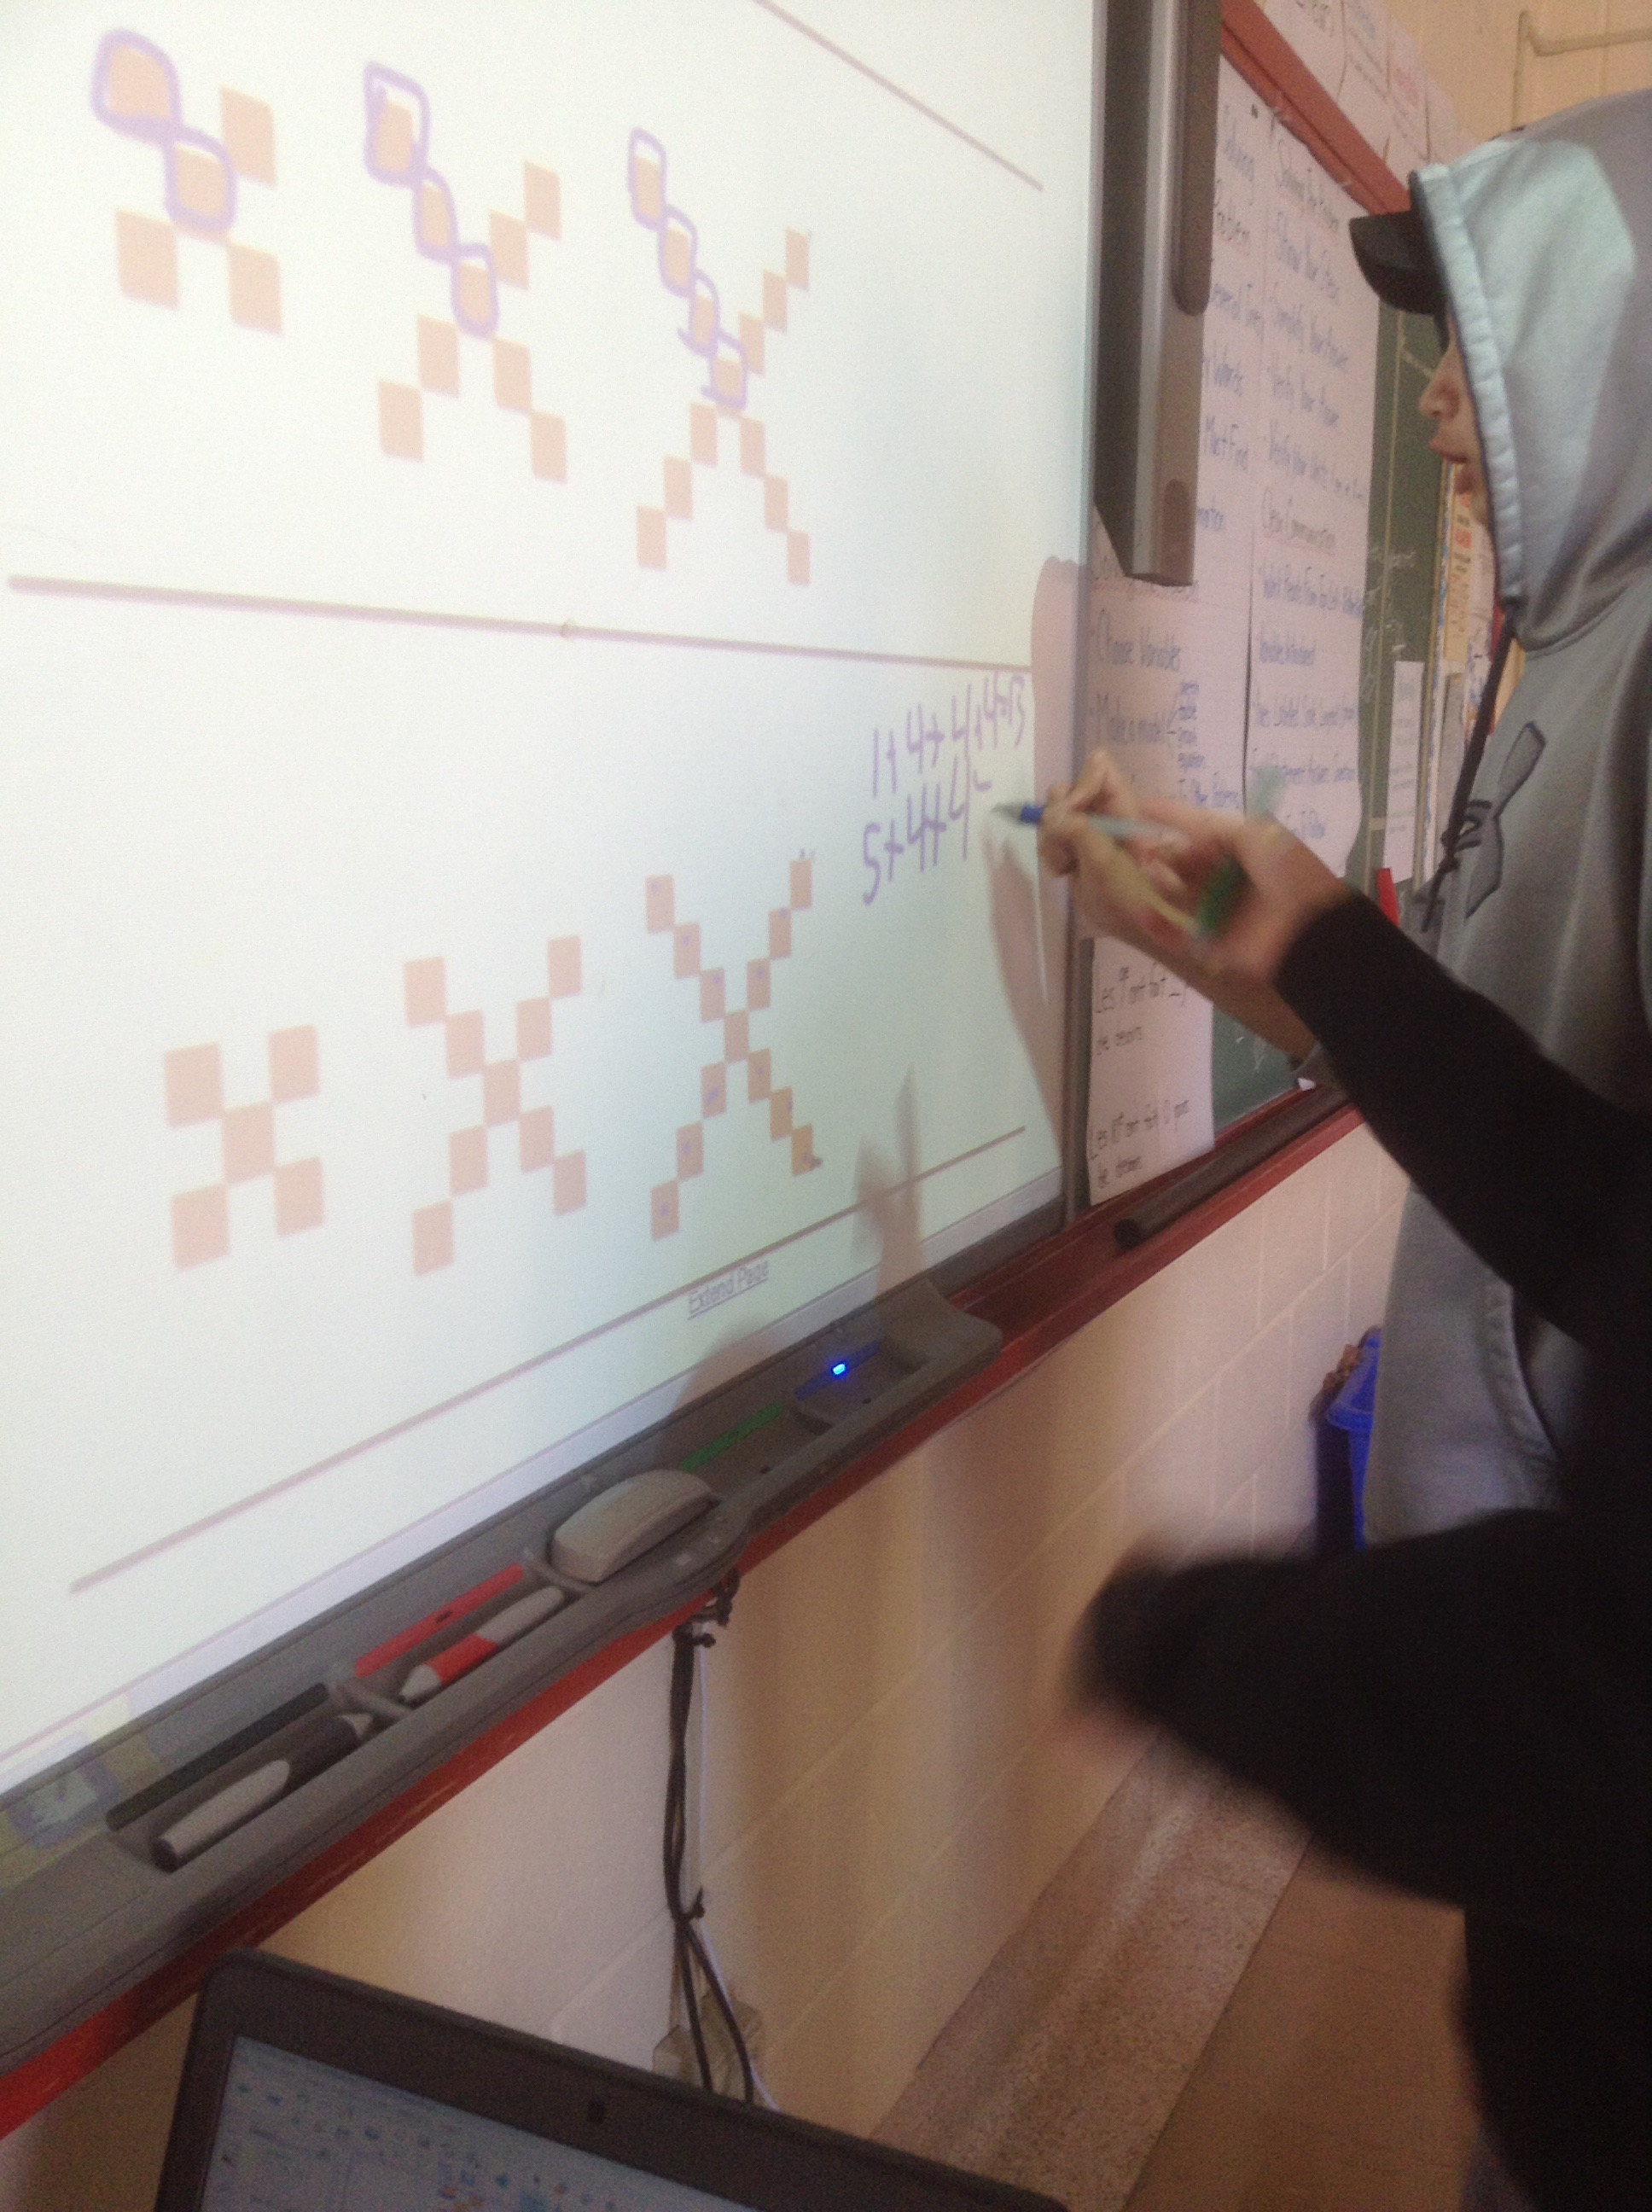
Working backwards to find the zero term was something new for us.
We are looking at weather the growth is linear or non linear for these patterns.
Geometry
We cut out random quadrilaterals, found the midpoint of each side, joined them up, and looked at the quadrilaterals inside.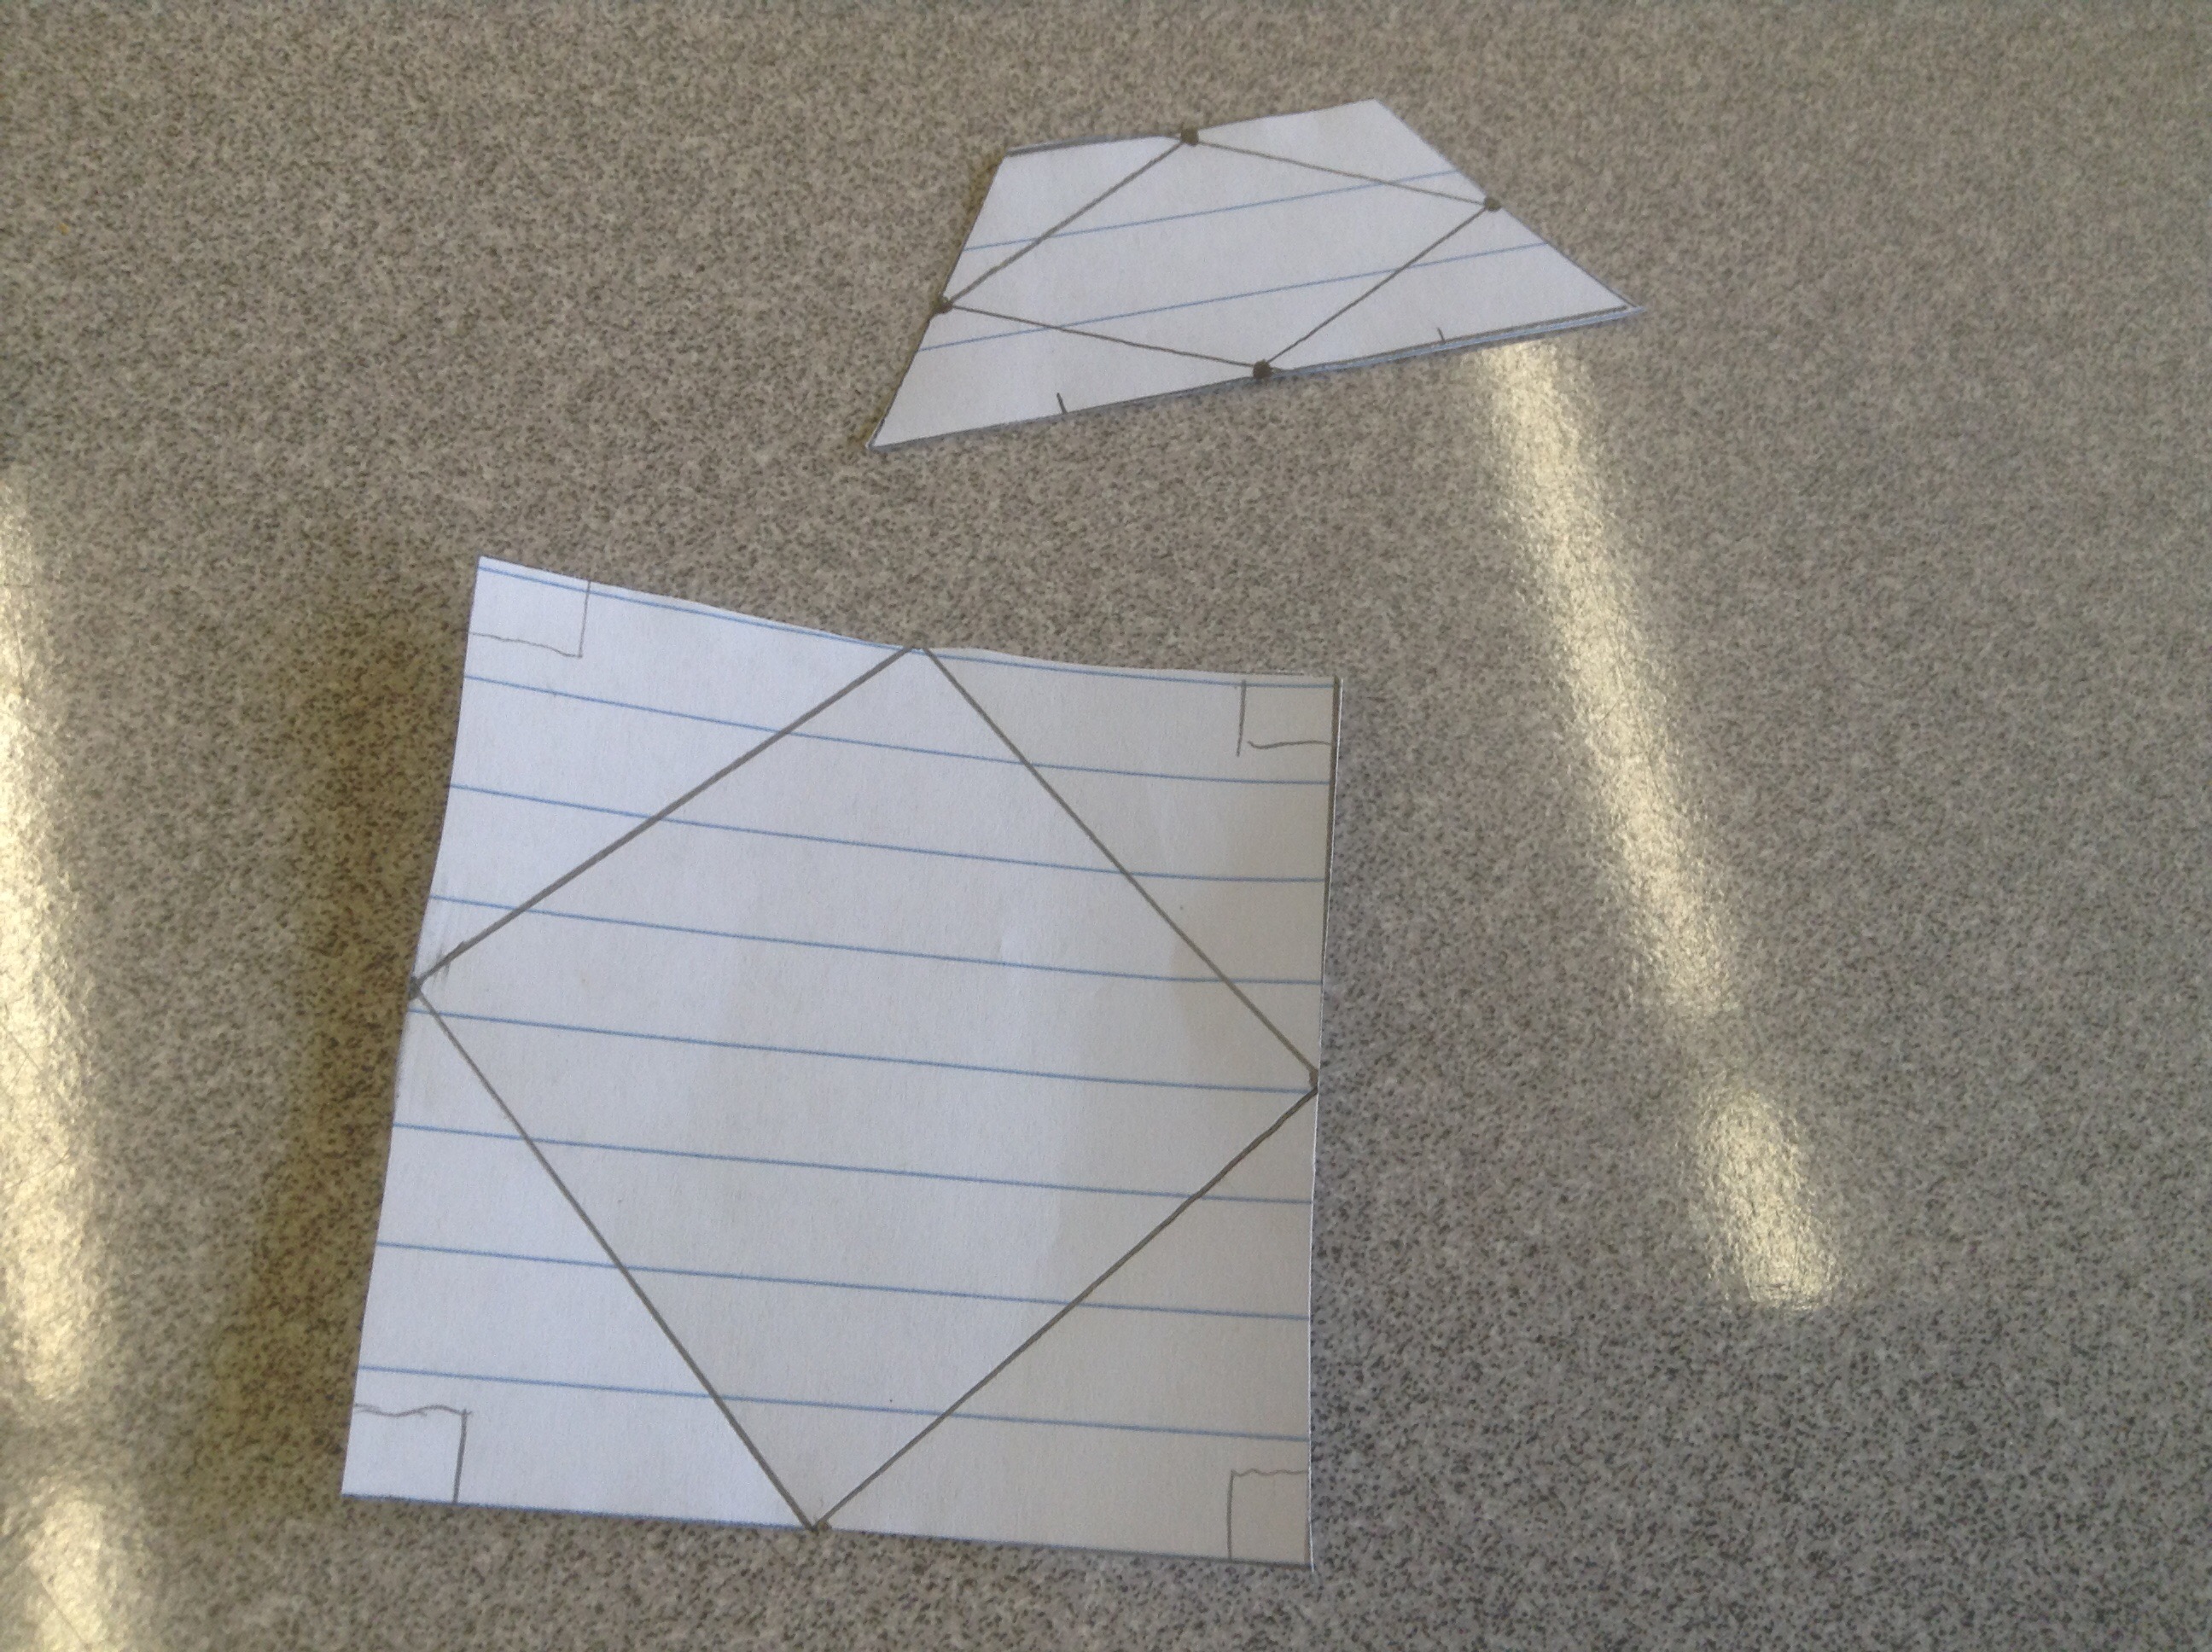
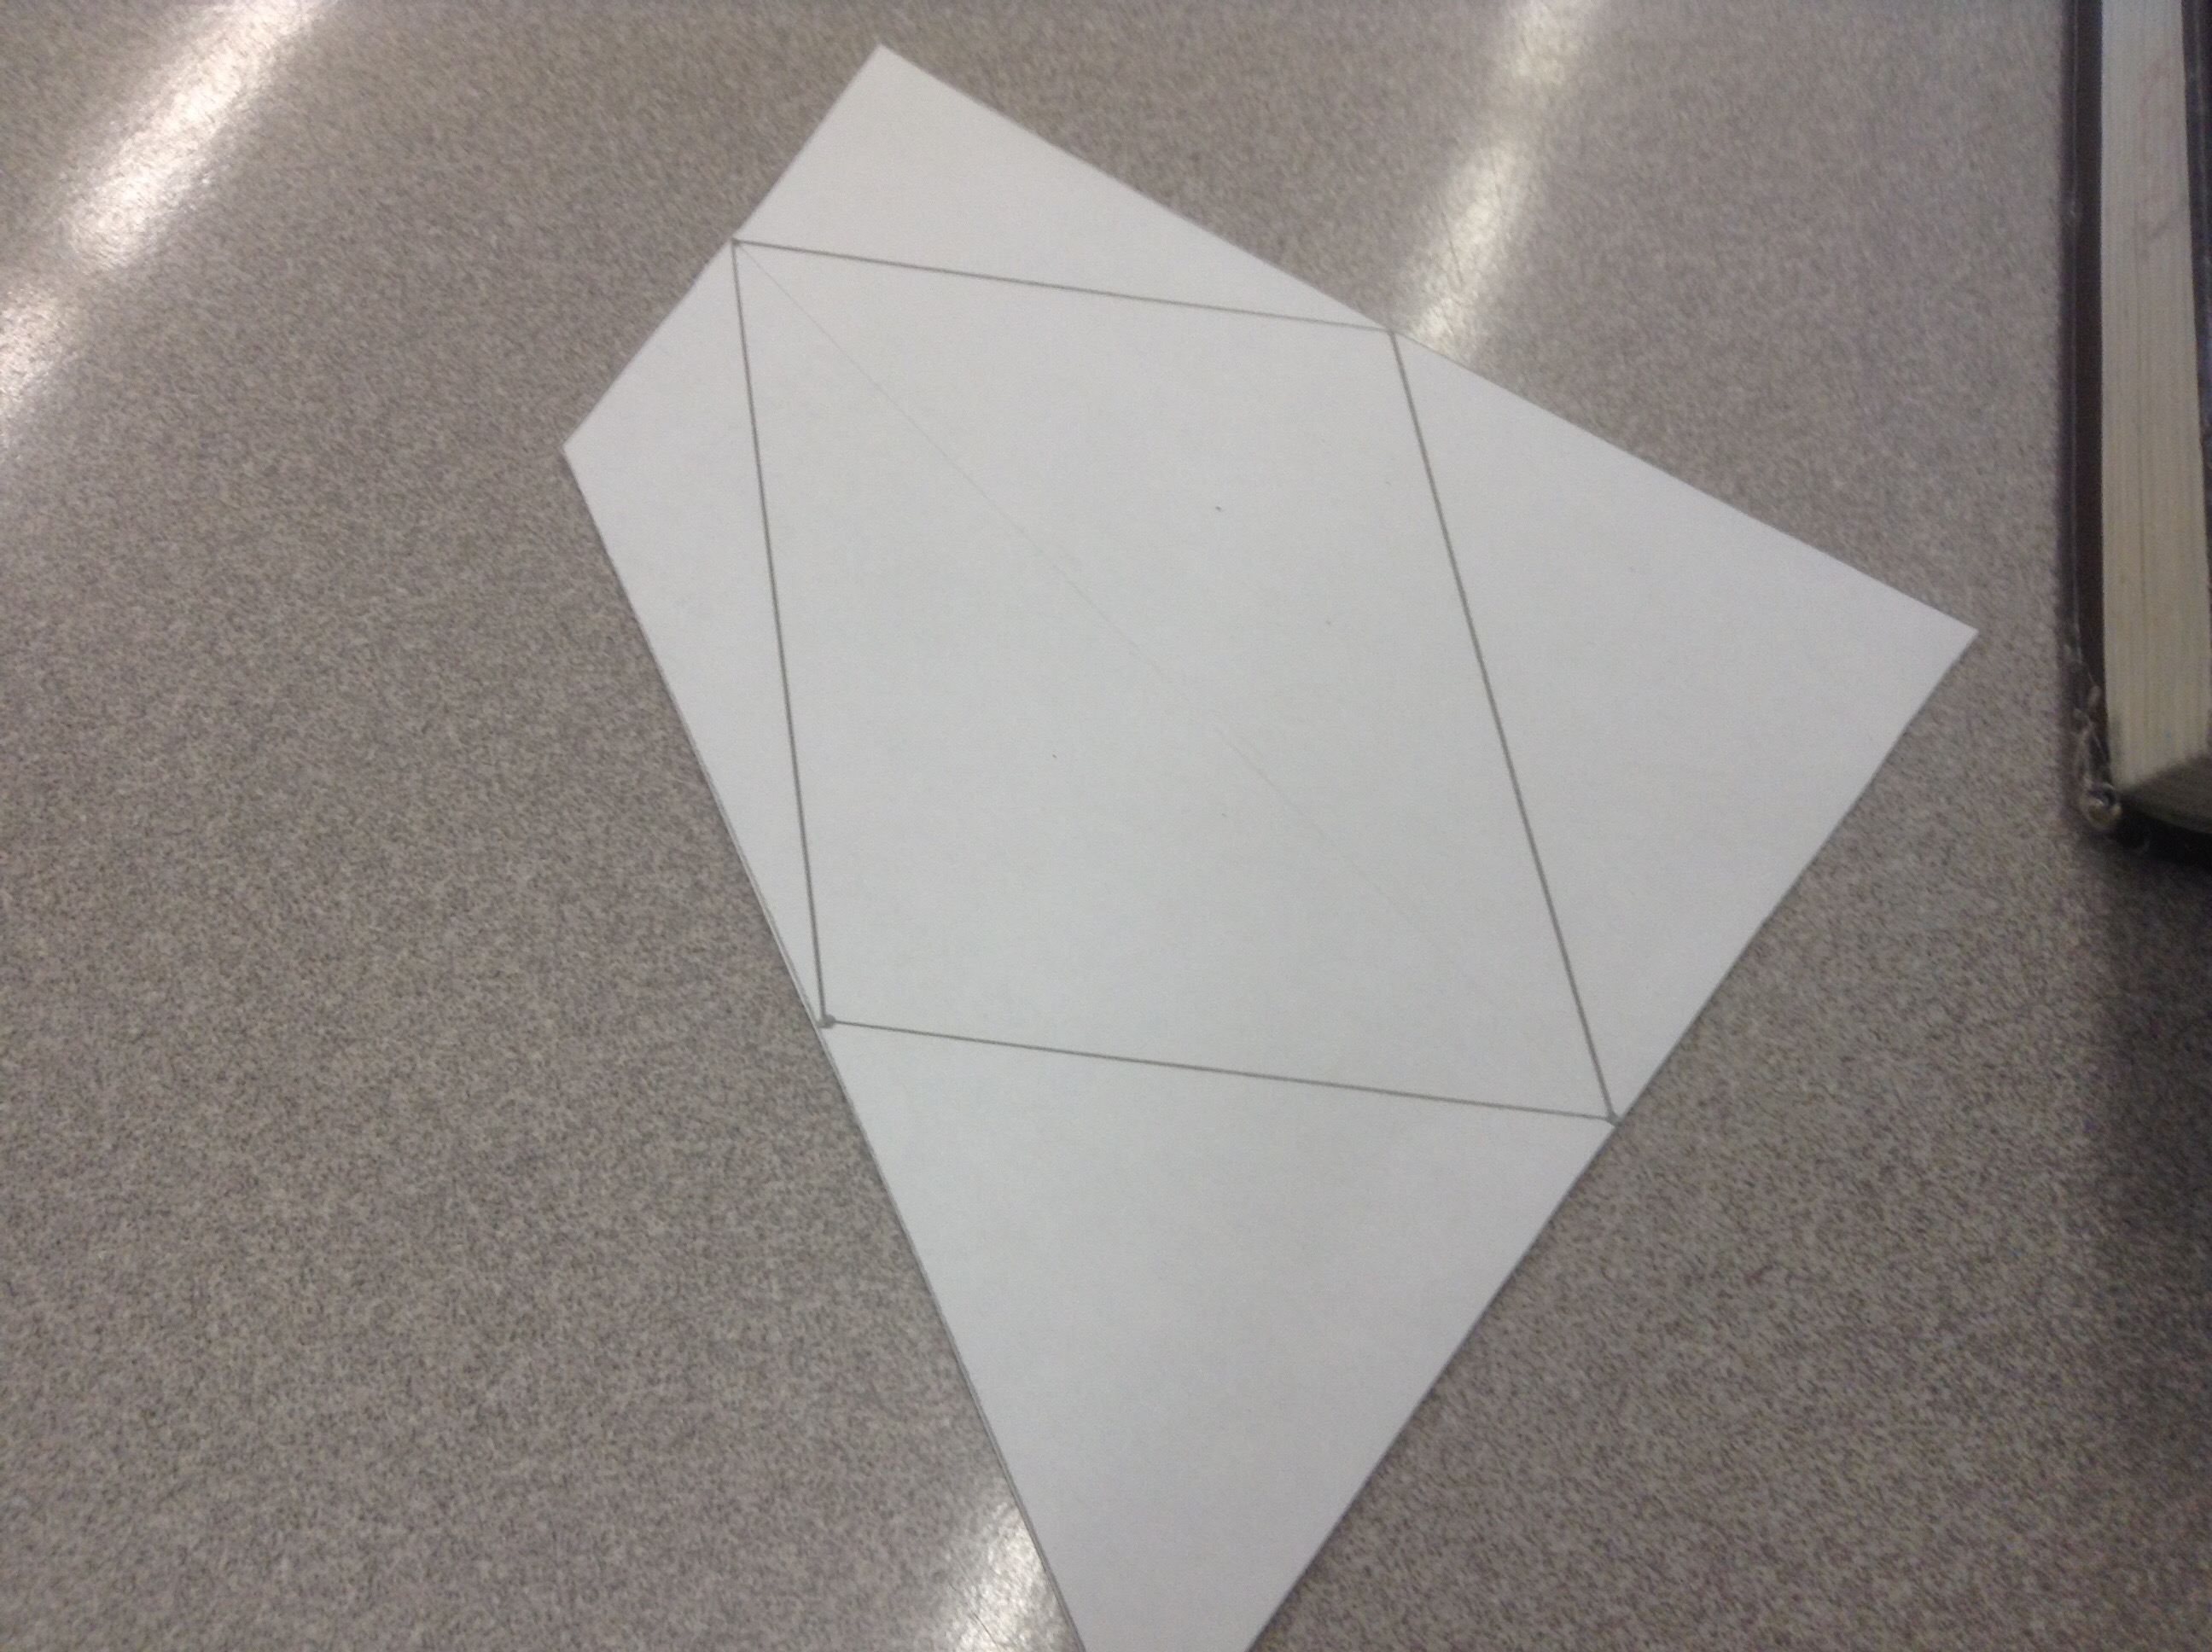
Each interior quadrilateral was a parallelogram!
Next we joined midpoints of triangle sides.
The segment drawn is parallel to the 3rd side, and half its length. The little triangle is 1/4 the area of the big one.
Beans!
Today marks the 30th day of our bean experiment. We took a look at their growth and compared it to our predictions and some were not. We noticed that the beans are starting to bud.
This poor bean grew only 1 cm in the last 20 days!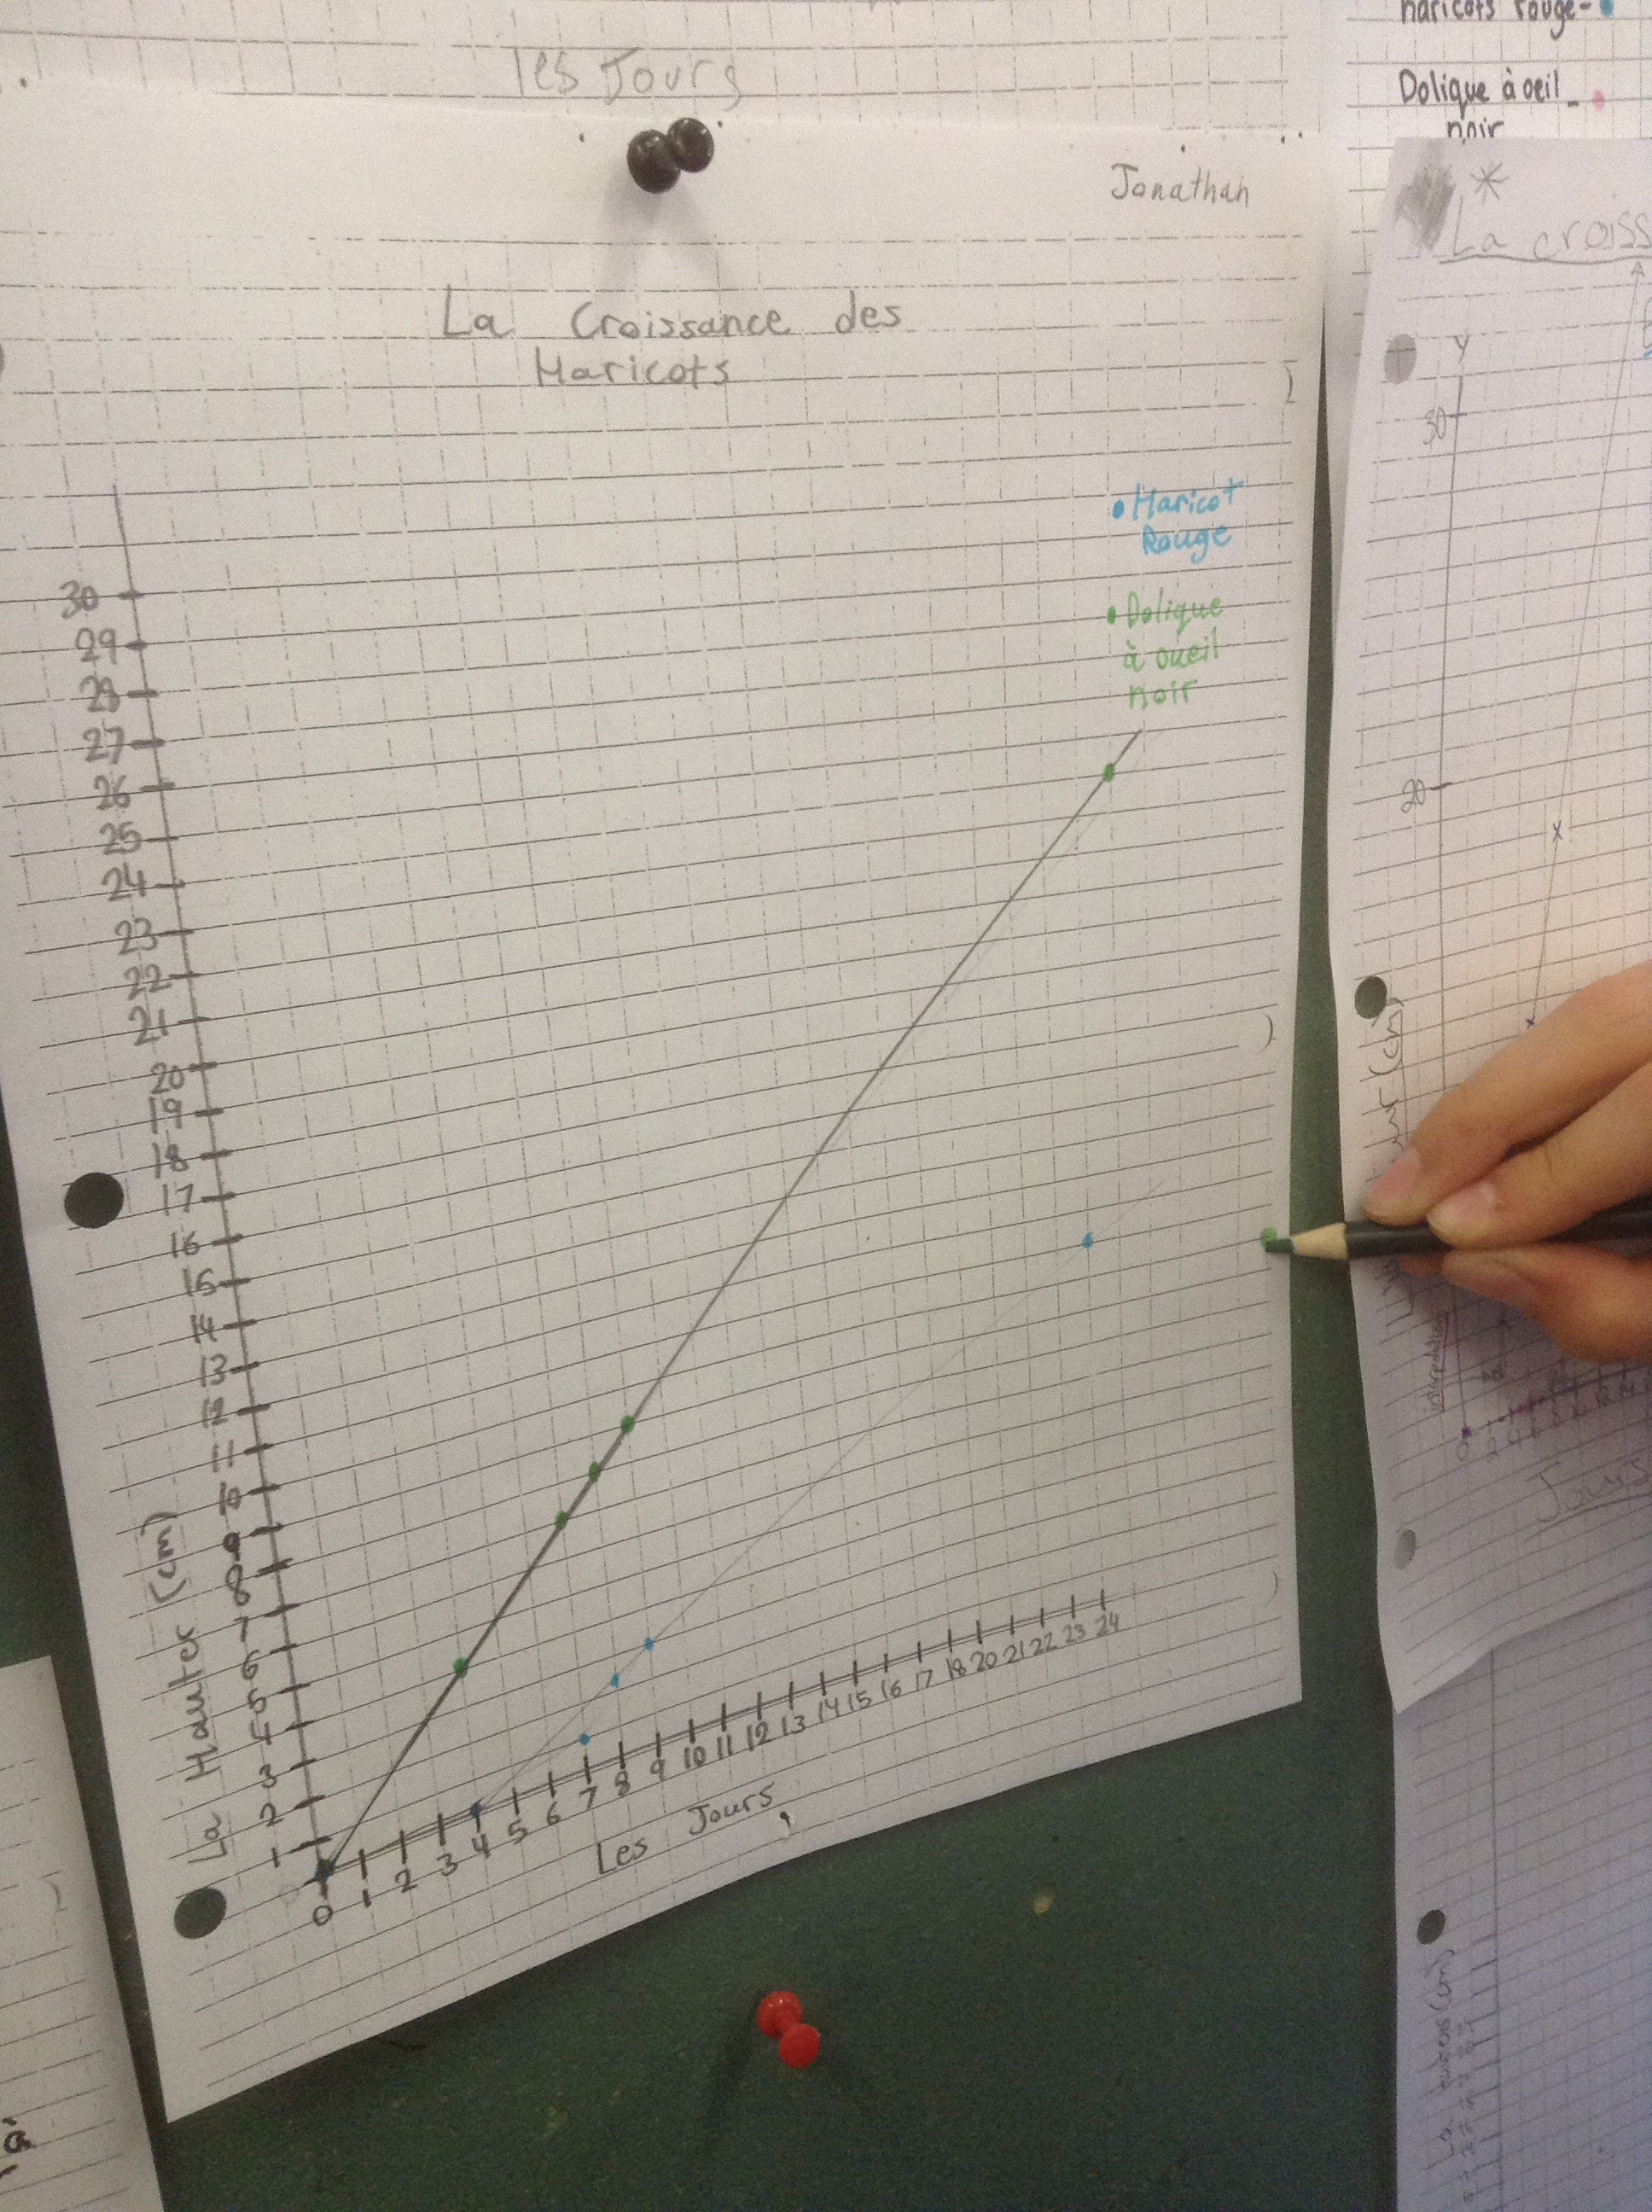
This one is closer to the projected heiht.
We will keep measuring to see what happens next.
Exterior Angles
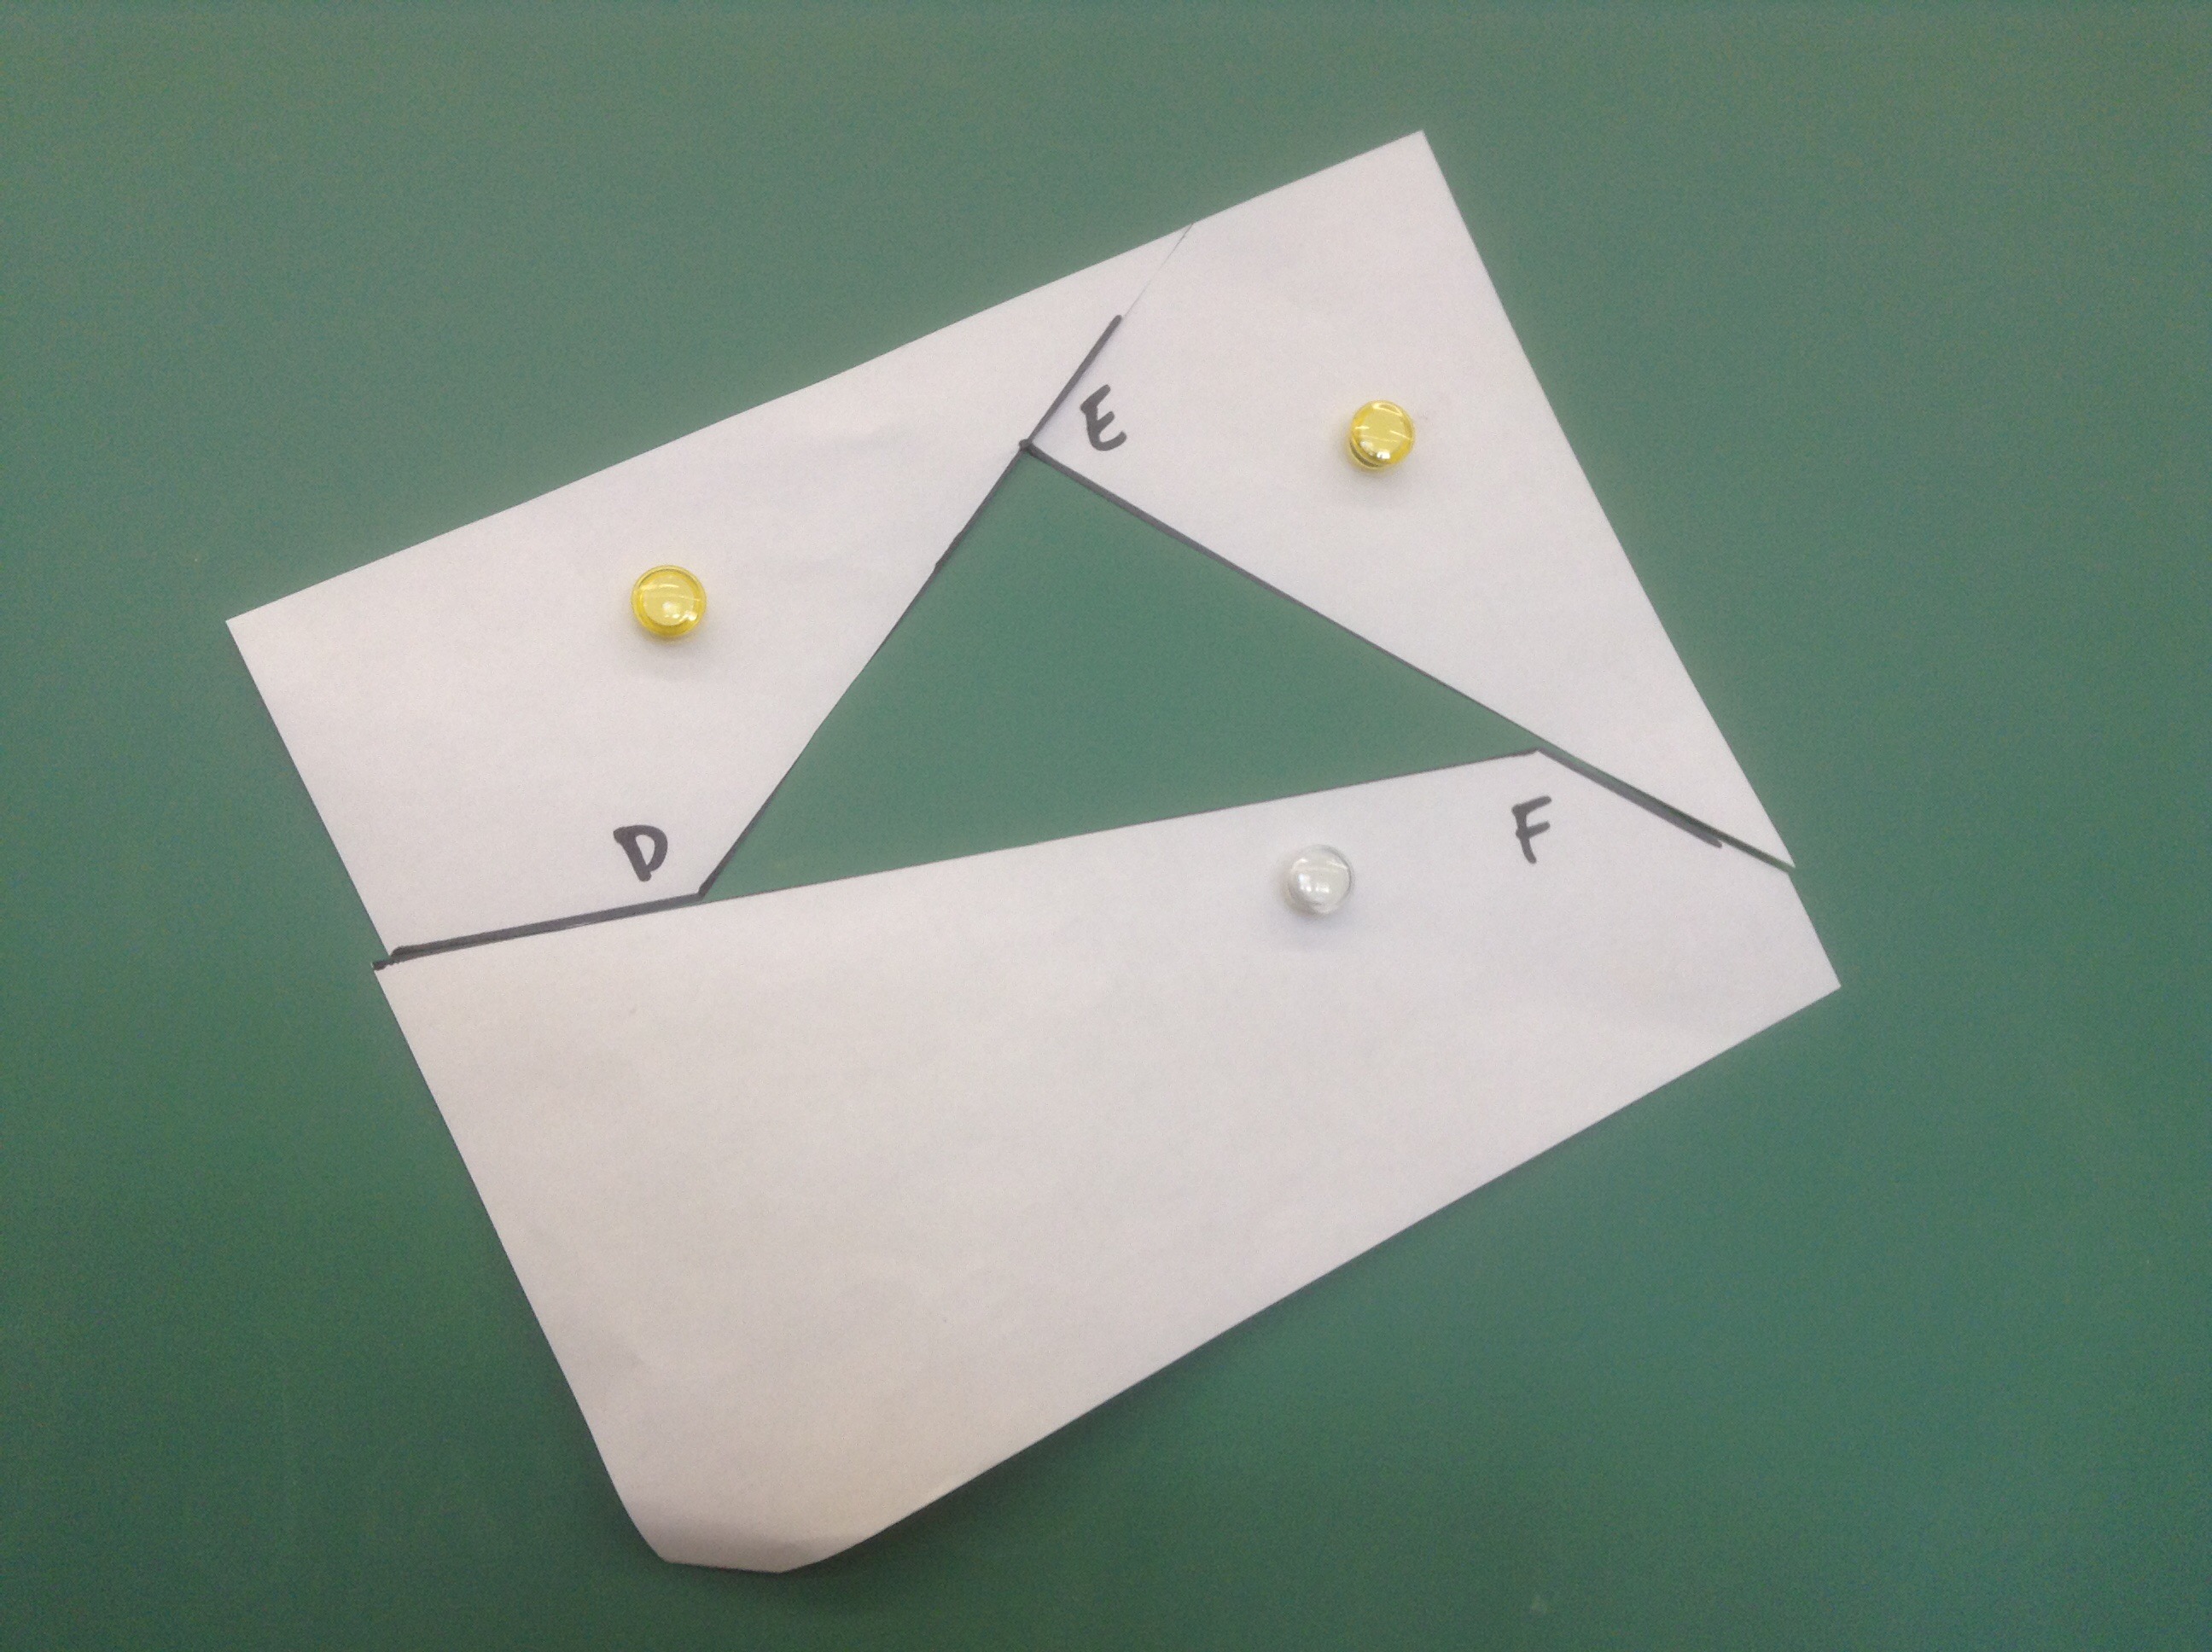 We see the external angles when we extend each side in one direction. These angles have a special relationship. They are supplementary to their internal angle (sum to 180), but they also always sum to 360 degrees.
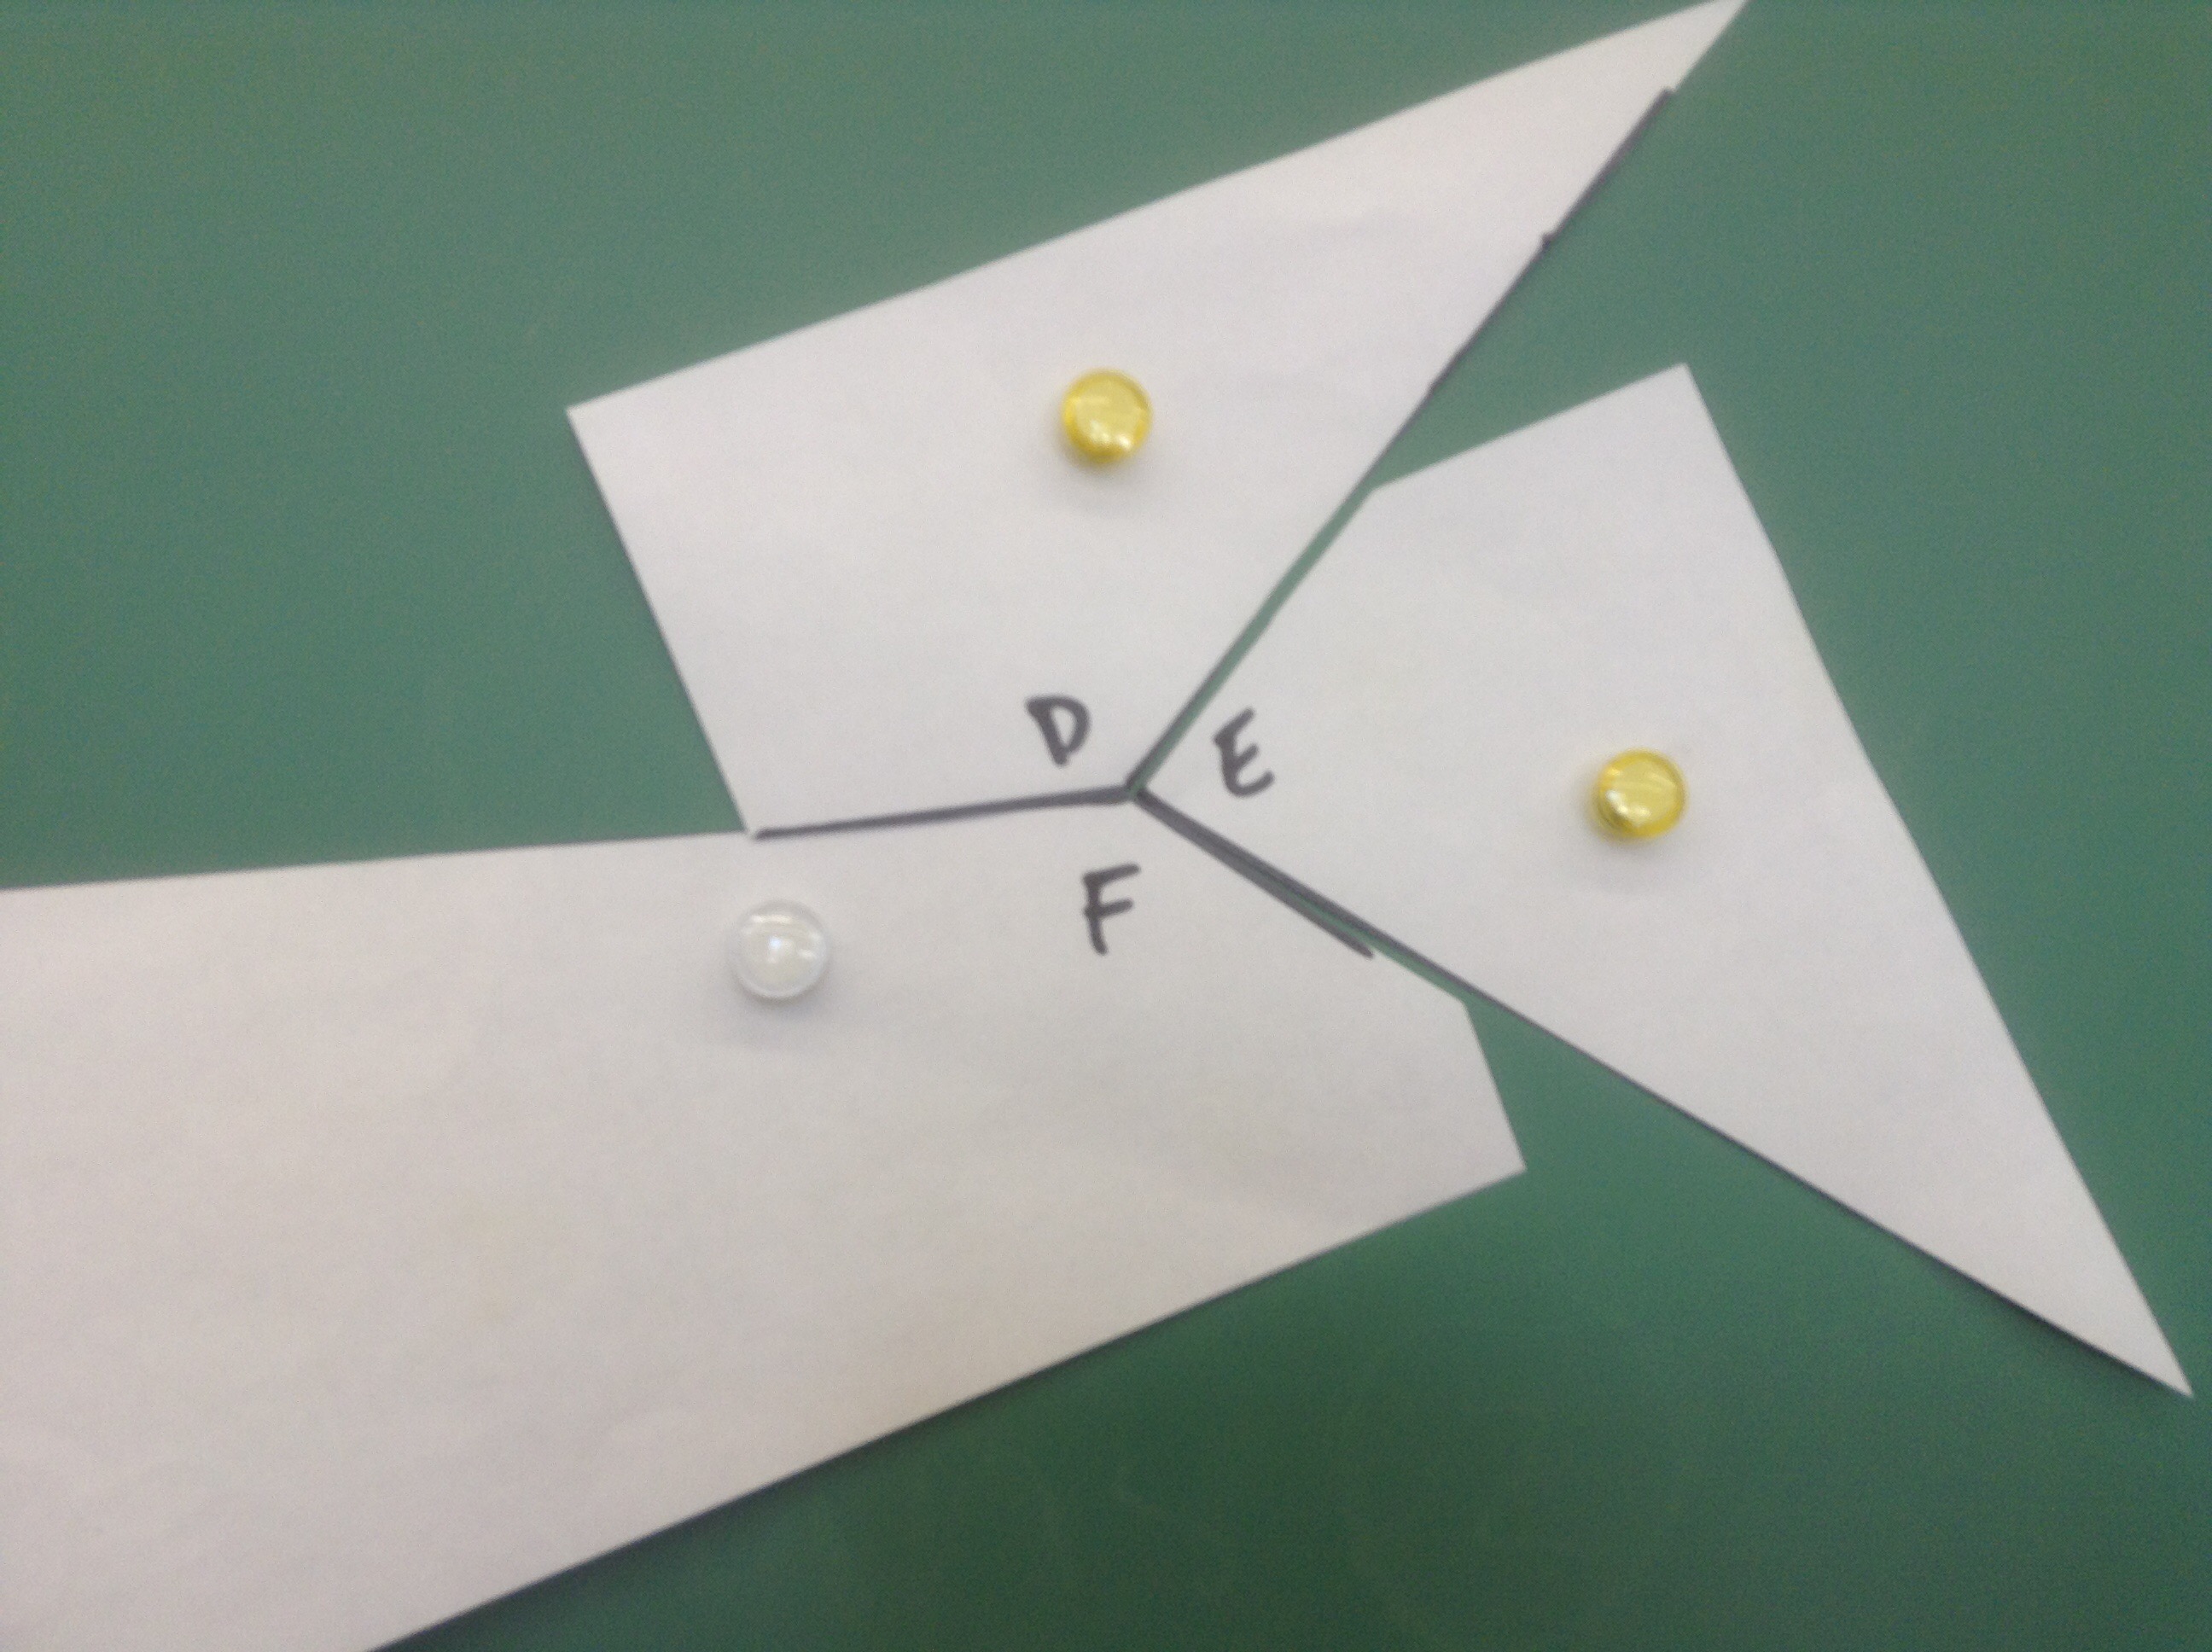
We see that the angles come together and meet perfectly.
Good Problem Solving
Here are our success criteria for effective problem solving. We will be using them a lot this term!
Hexagons on the wall
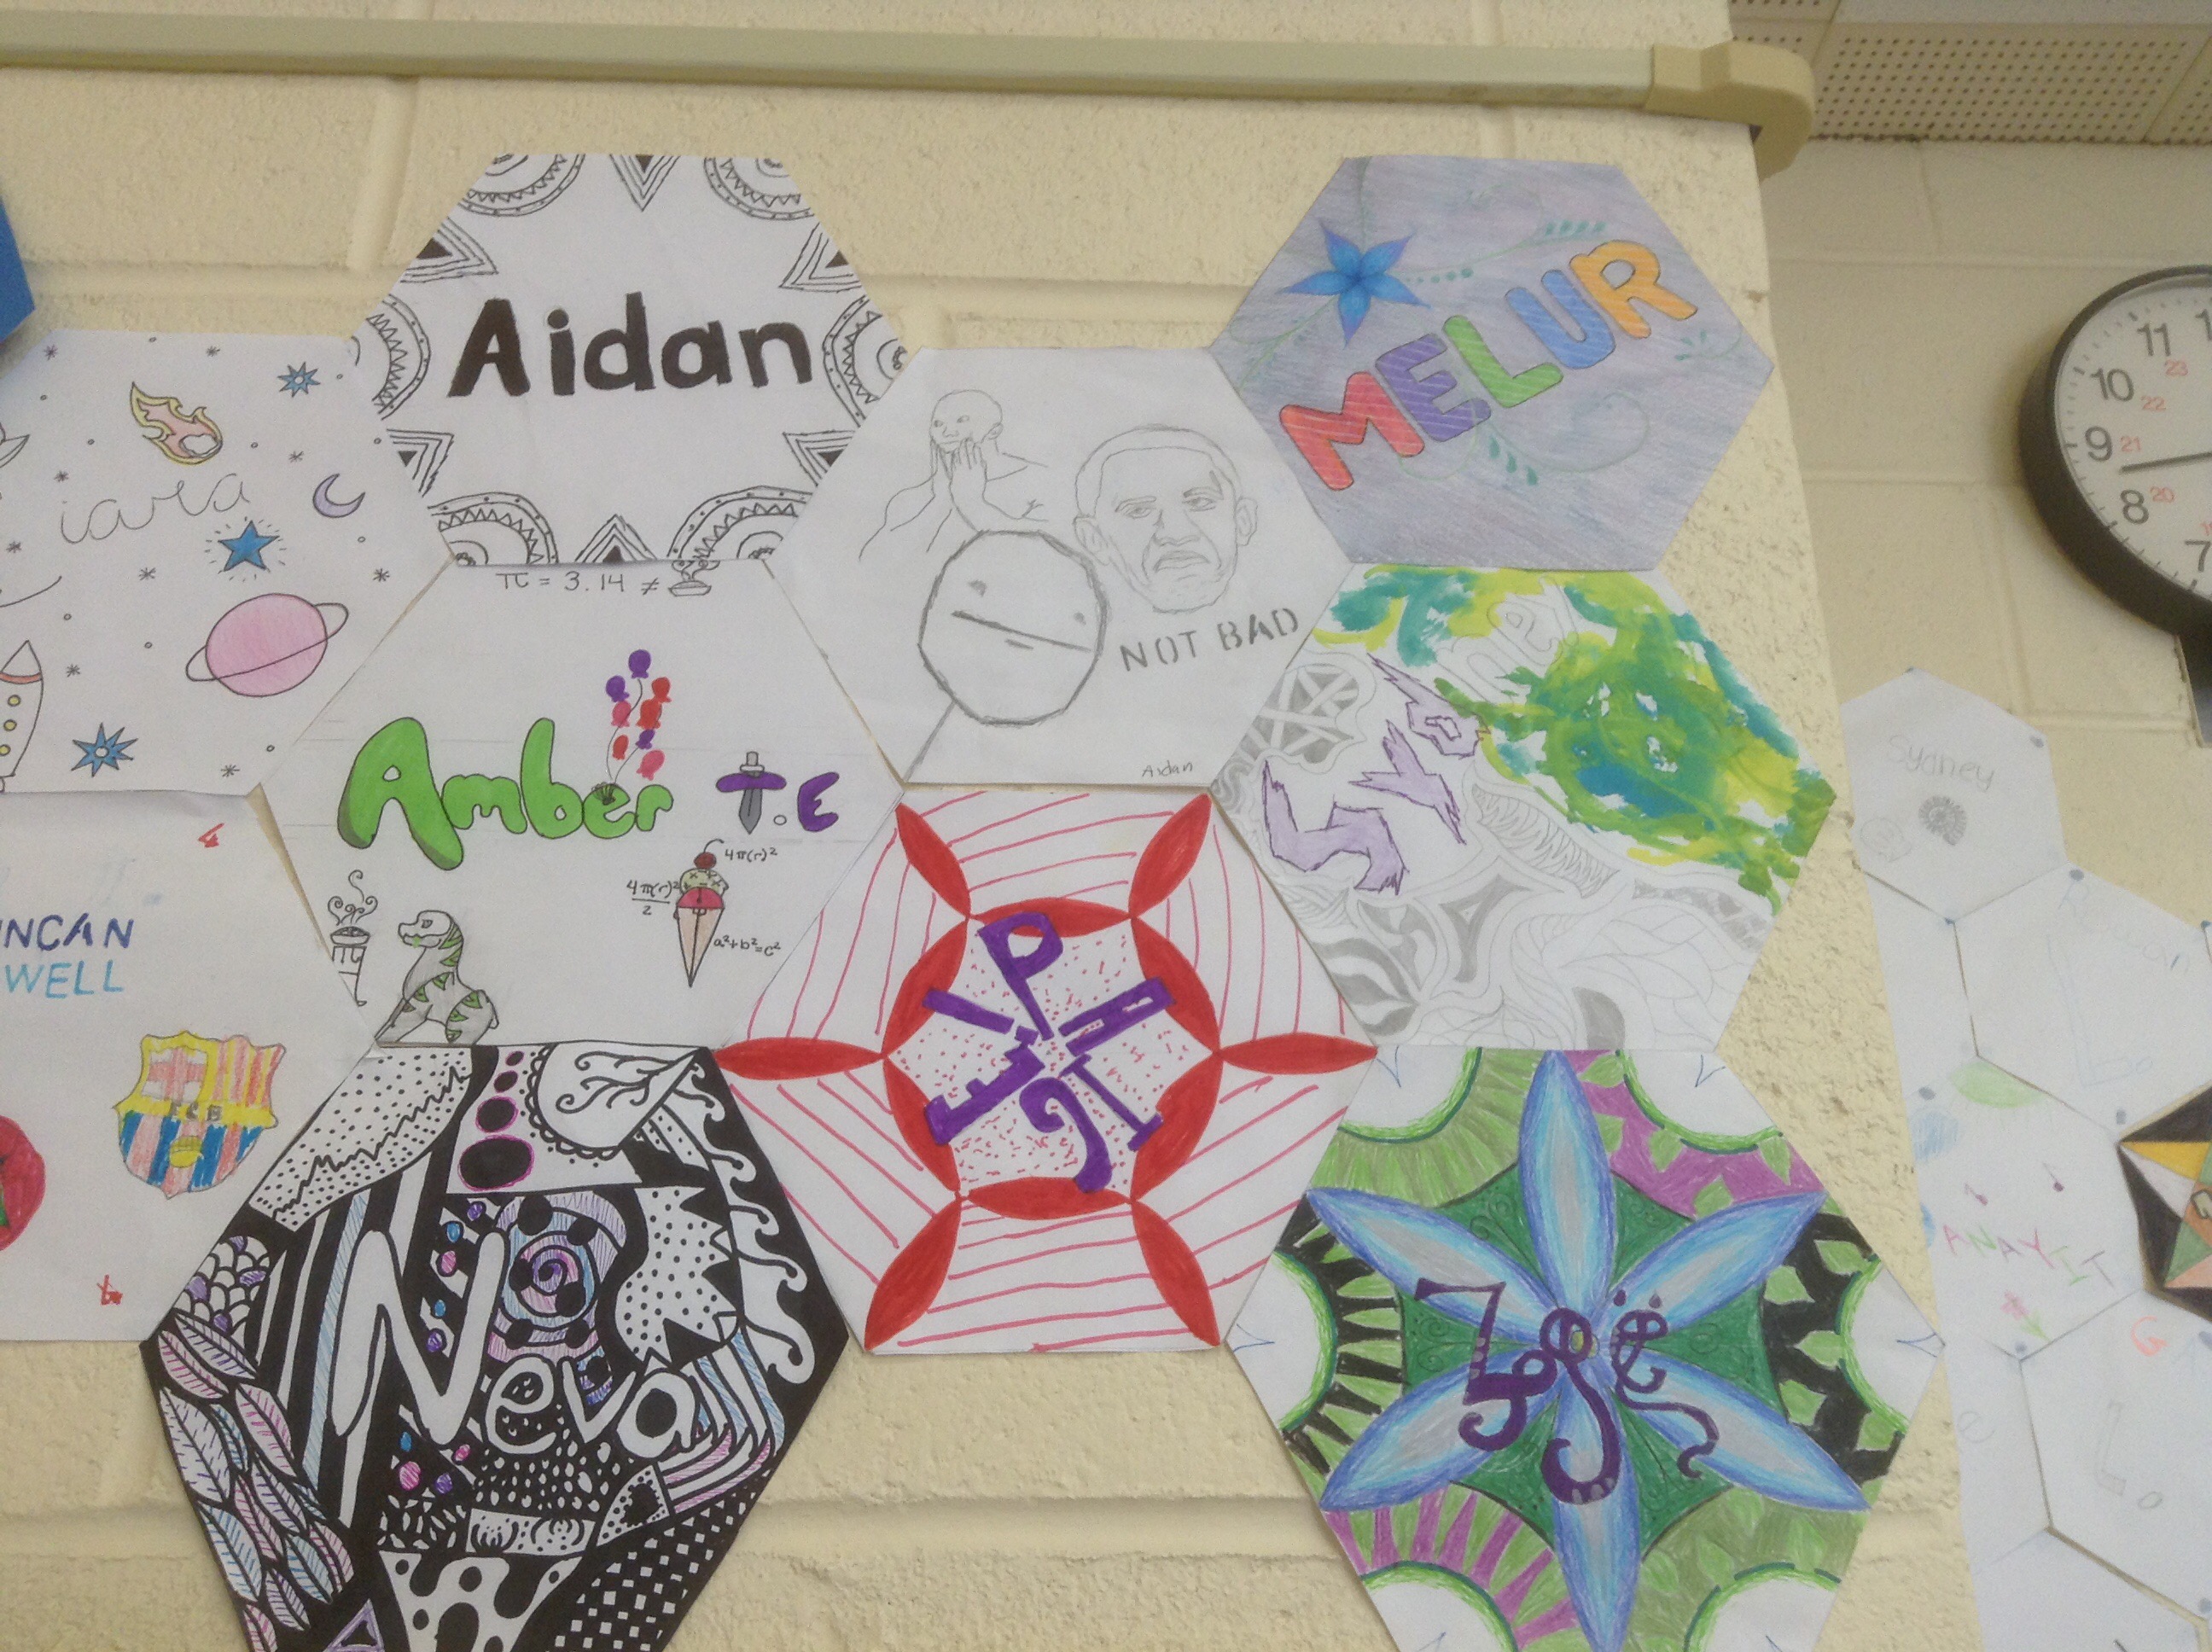 We are making our classroom really vibrant with all the new hexagons on the wall.
What’s the pattern?
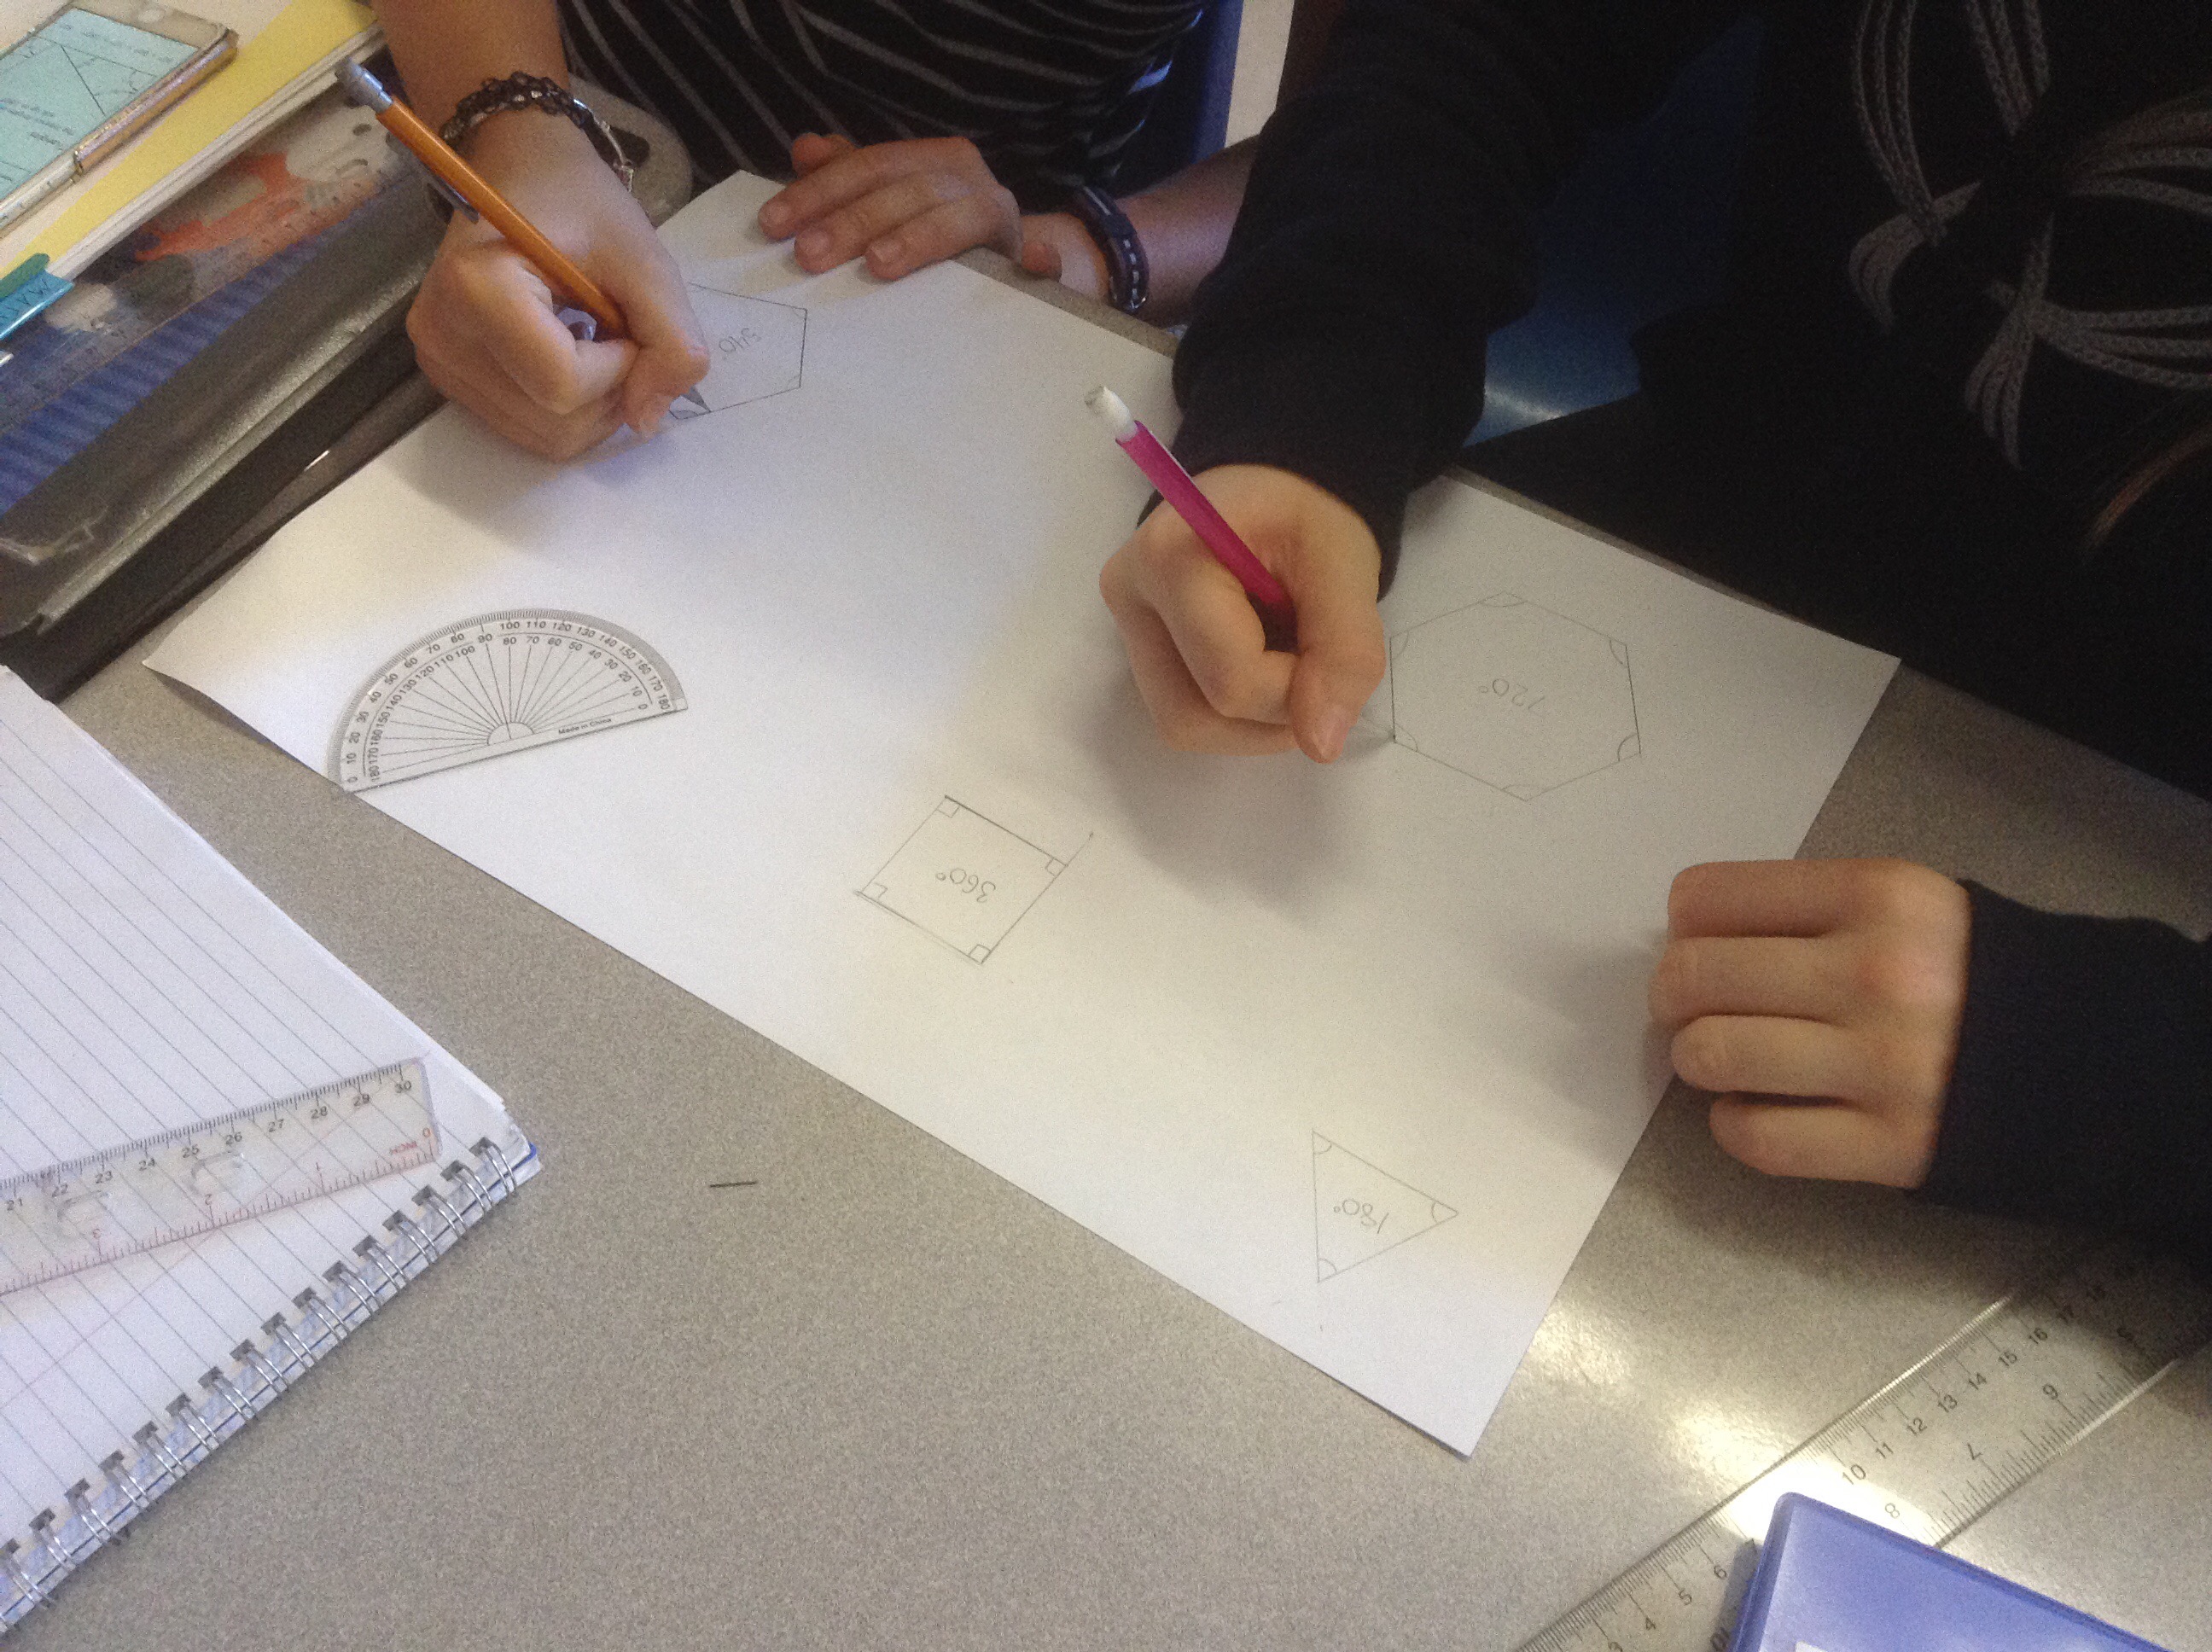
We are looking at the patterns involving the sum of the interior angles of a polygon. We made a variety of polygons and measured the angles inside them.
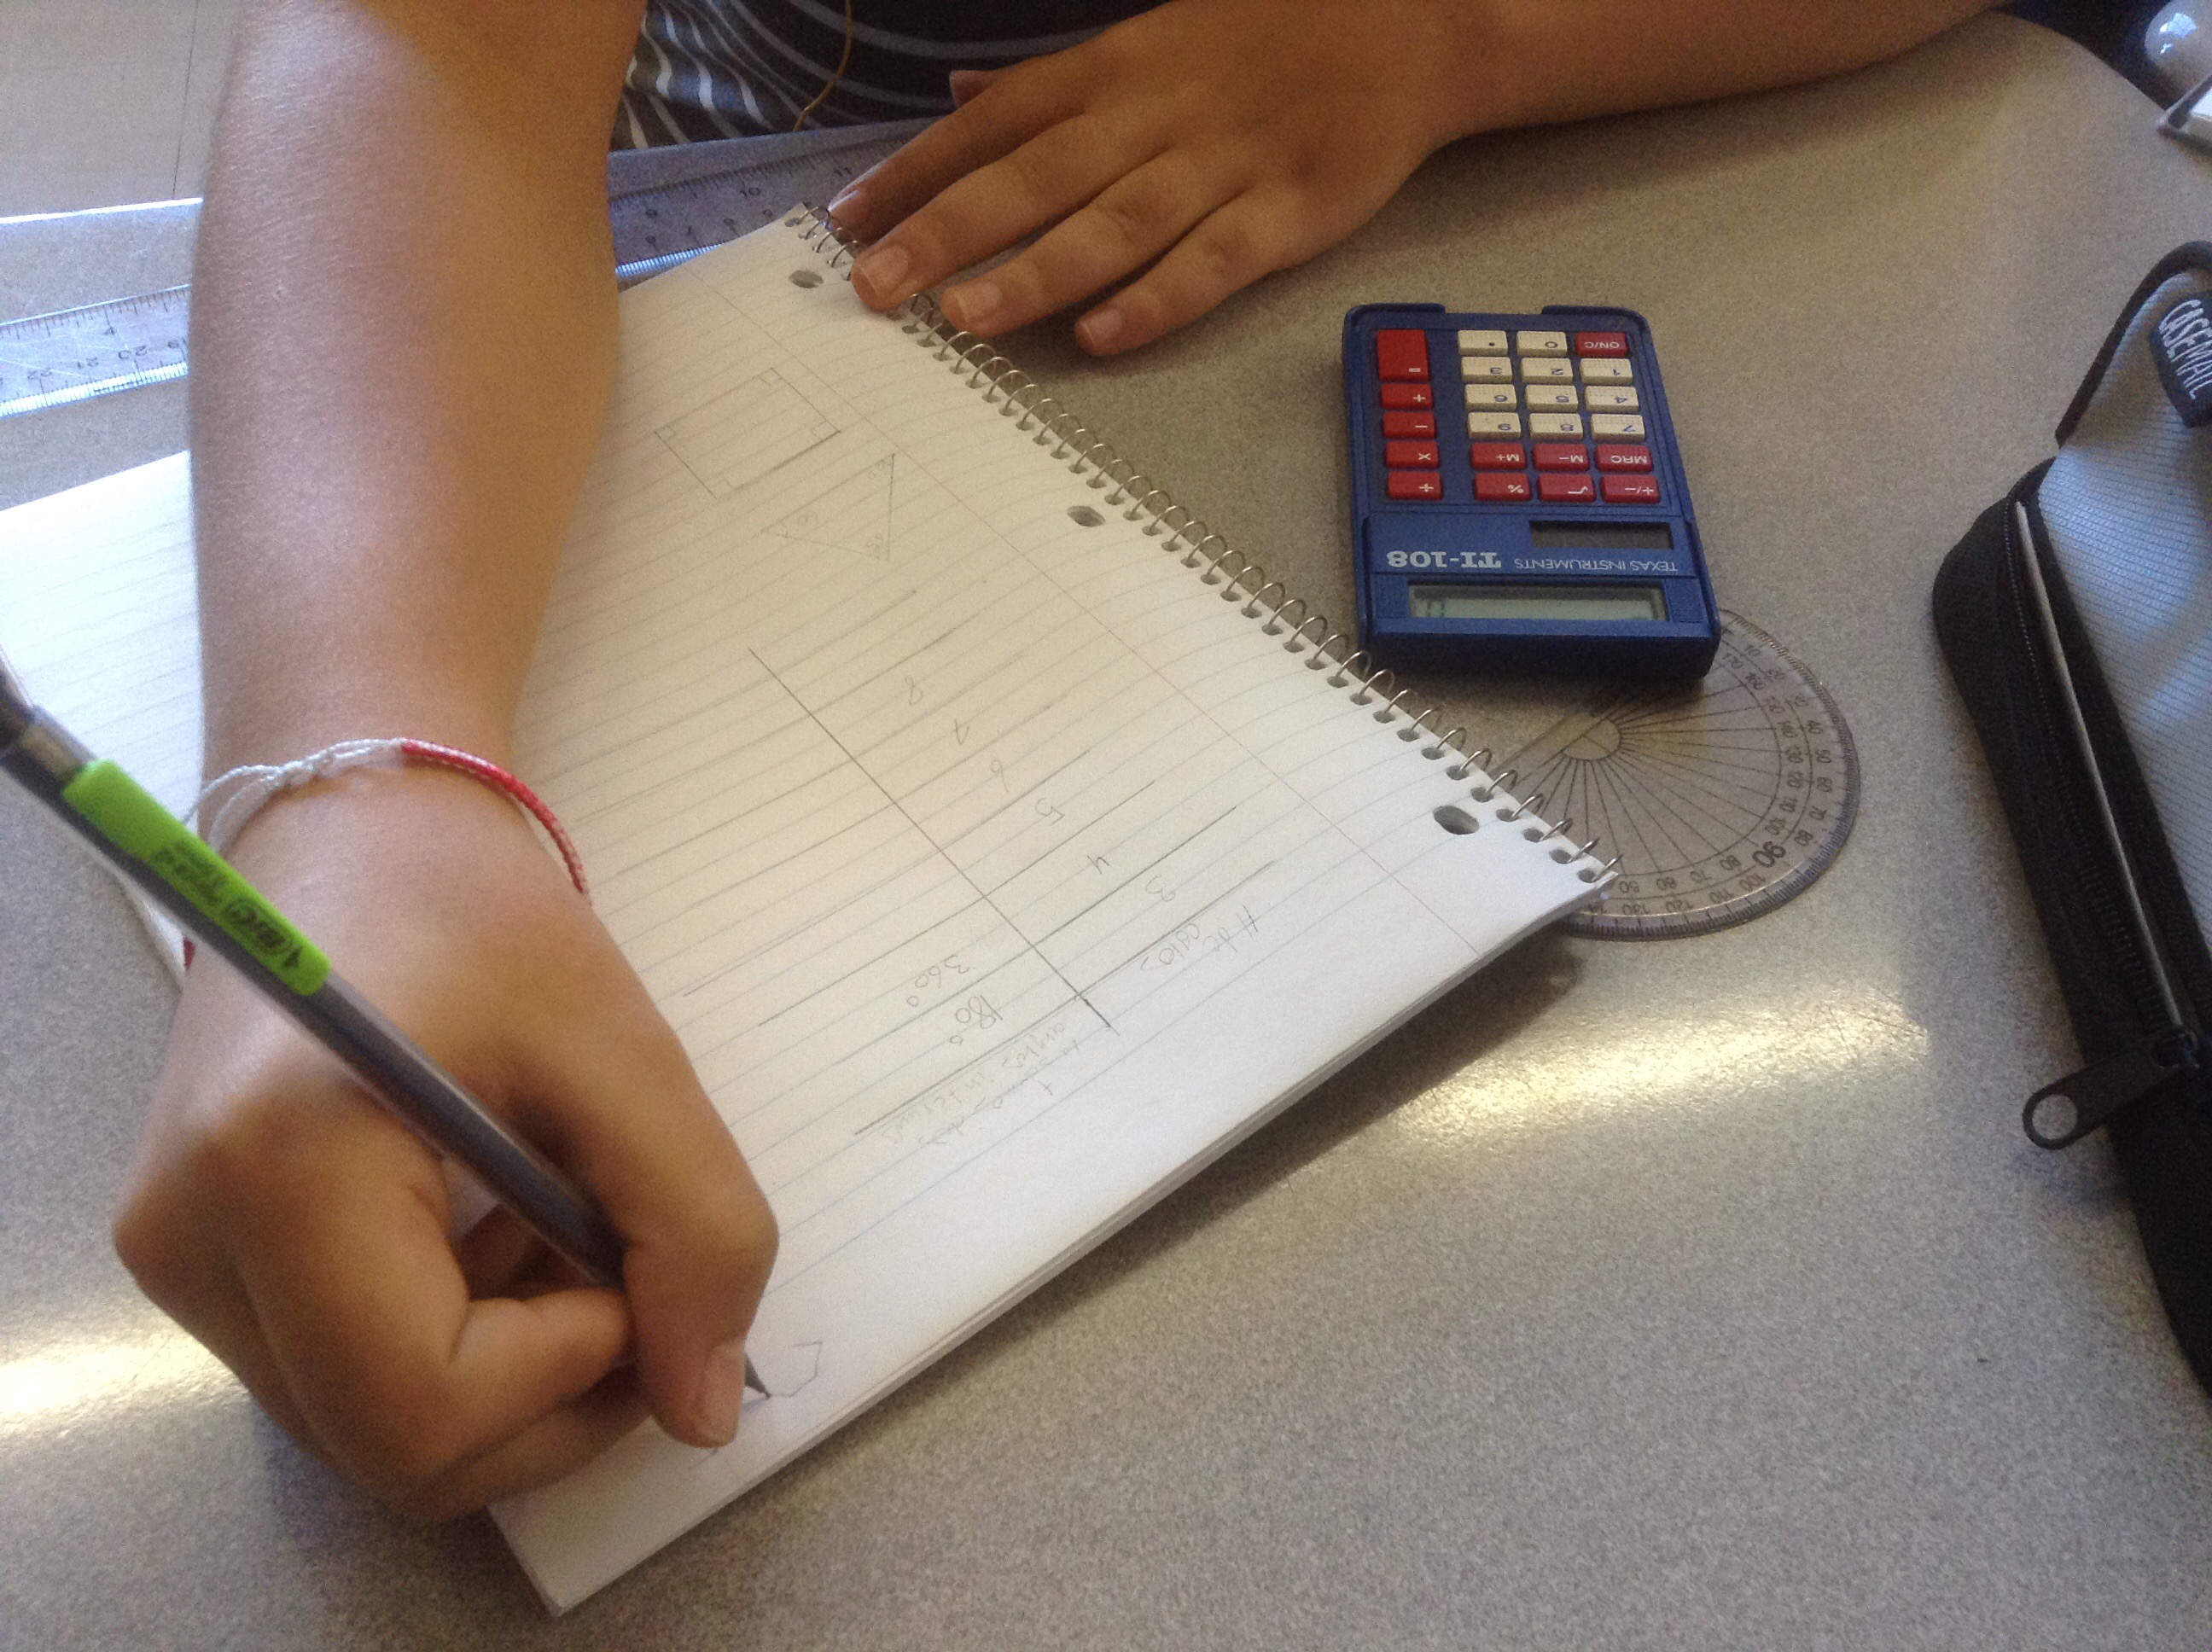
We collected data in tables of values, and saw how that can be plotted using desmos.com (also there’s a free app)
We saw how the first differences of the table data is the same, and how that relates to the linear graph we saw.
There are two ways that we can calculate the sum of the interior angles. We can multiply the number of sides by 180 then subtract 360. We could also subtract two from the number of sides first, then multiply the result by 180.
