Multiple representations
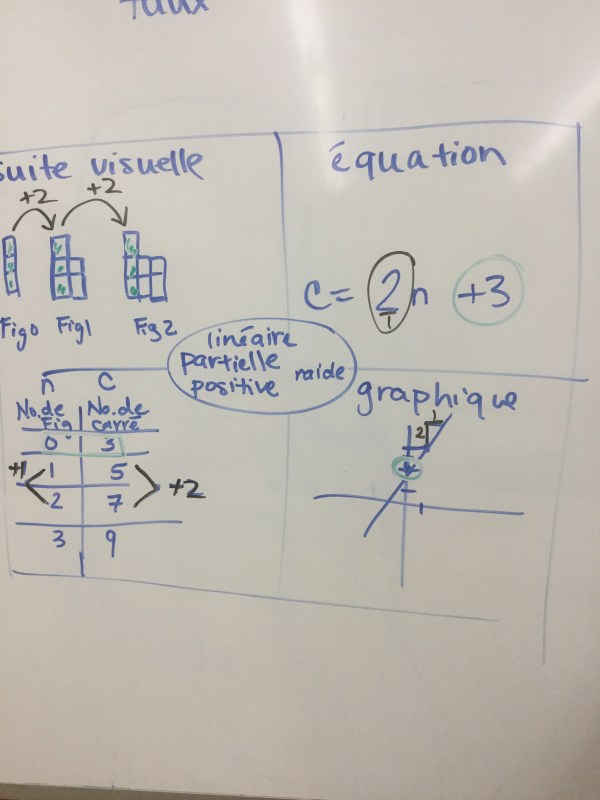
Here’s an example of all the ways we can represent a linear relation. A visual pattern, an equation, a graph, vocabulary, and a table of values. The rate is shown in black, and the constant in green.
We worked on solving a problem in class too about a fridge repair. The first repair job cost 176$ and took 2 hours. The next job took 3.5 hours and cost 263$. We made a graph and found the rate (using the triangle). The price increased by 87$ for 1.5 hours of increased time. We looked for the unit rate which is 58$/h. The constant is found on the vertical axis, but we can’t know exactly what it is without some more calculations
 we can use our table of values and count backwards, for every hour we back track, the cost decreases by 58$. The constant is 60$.
We can also make an equation with the cost and time. “B” is our constant, which we are trying to calculate. We substitute values that we know. For time we used 2 hours and for cost we used 176$. We already know the hourly rate is 58$/h. We can then calculate the value of “b” which is the same as we got from our table.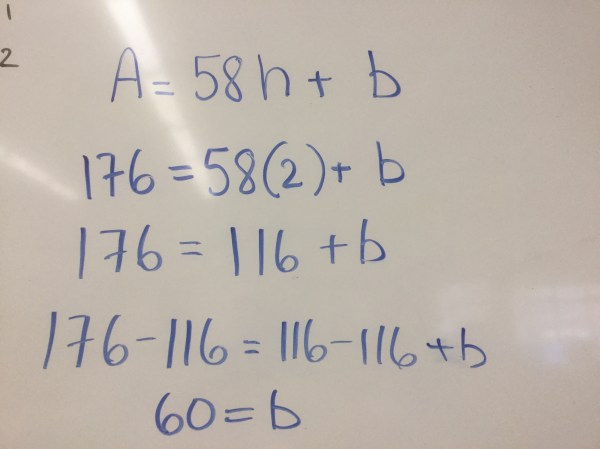
Applying our skills with lines

Grade 9s worked backwards today, given the graph of several lines, they determined the equations based on the constant, and the rate.
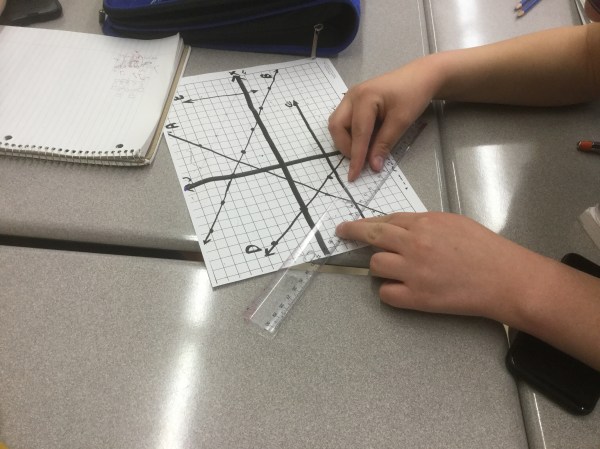
Their challenge then was extended to create lines that were parallel or perpendicular to the given lines. We’d seen parallel lines before and knew that they have the same slope. We have a call and repeat chant “parallèle” “même pente” that we have engrained in our long term memory.
Some of these lines were tricky since we couldn’t read the constant on the graph, we needed to use our reasoning skills to determine the equation.
Our new chant of the day is “perpendiculaire” “inverse négative” which means we take the slope of one line and flip the fraction, and multiply by negative 1. In English that is called the “negative reciprocal”.
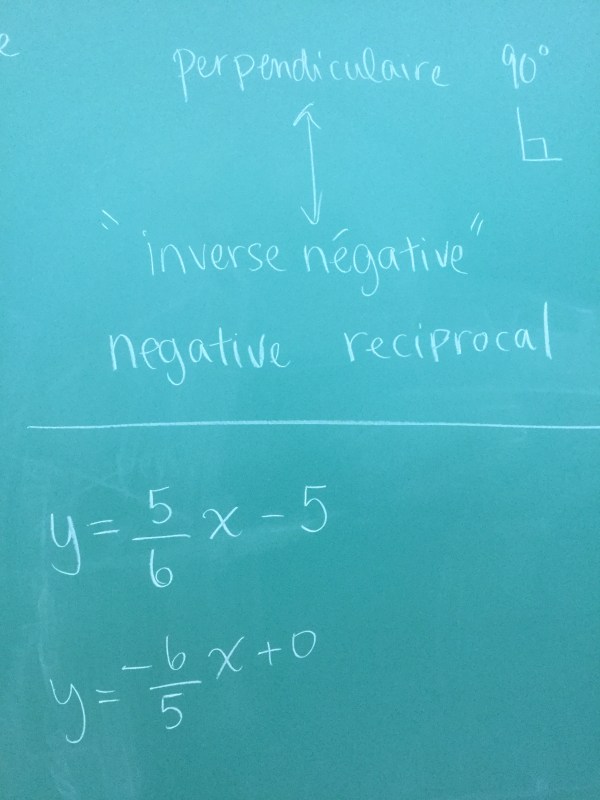
The second equation is perpendicular to the first, and also direct.
We looked a little at different ways of managing if the line doesn’t look like y=mx+b. We can either do some algebra to isolate y, or we can use the x and y intercepts to graph the line.

Here’s the algebra to isolate y.

And here’s how we can find the intercepts. We know that the equation of the x axis is y=0, and the equation of the y axis is x=0 so we sub x=0 and solve for y, and also y=0 and solve for x.

We can see how all of this makes sense on the graph

Busy day today learning a lot!
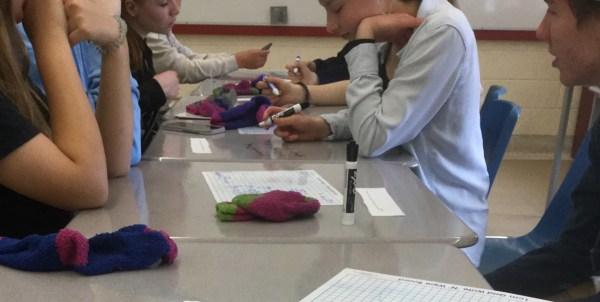
Clothes line activity
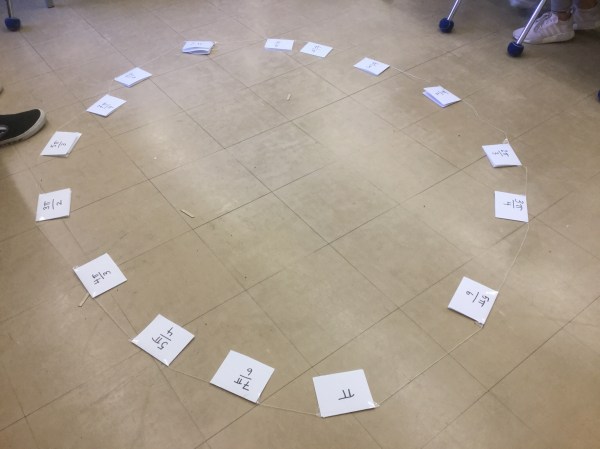
 grade 12s are developing their comfort with radian measure. Today we made a proportional clothesline of radians. We taped all the cards to the string, and then made the string into a circle to check our work.
 we noticed that 2pi and pi are directly opposite, and so are (pi/2) and (3pi/2). We did a pretty good job with our spacing.
Our new favourite song
We completed the square of the general standard form equation today. We then set y=0 to solve for the roots. 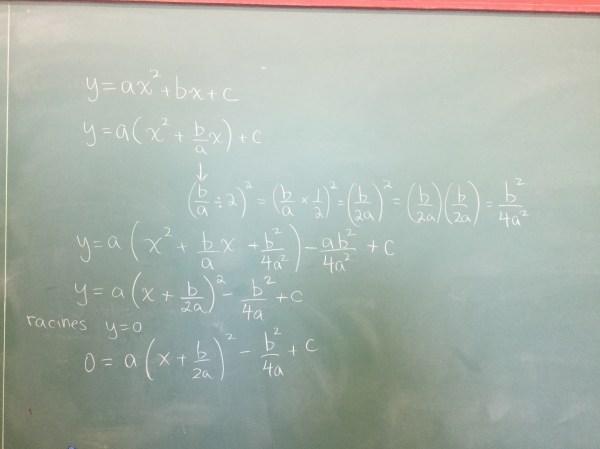

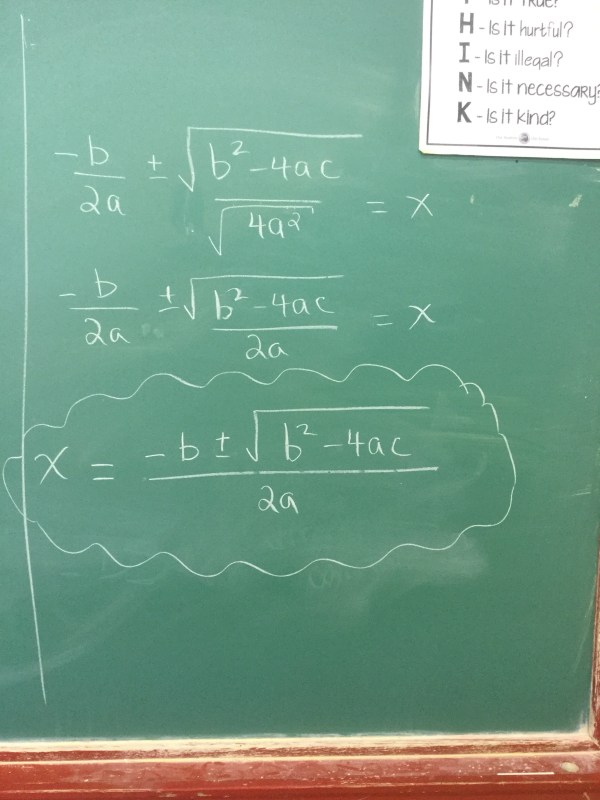
It’s a complicated procedure, but in the end gives us our new favourite formula (which can be sung to pop goes the weasel). We looked at how to sub in “a”, “b” and “c” and how what is under the square root is really important. It tells us how many roots there are.

Lines, lines, lines
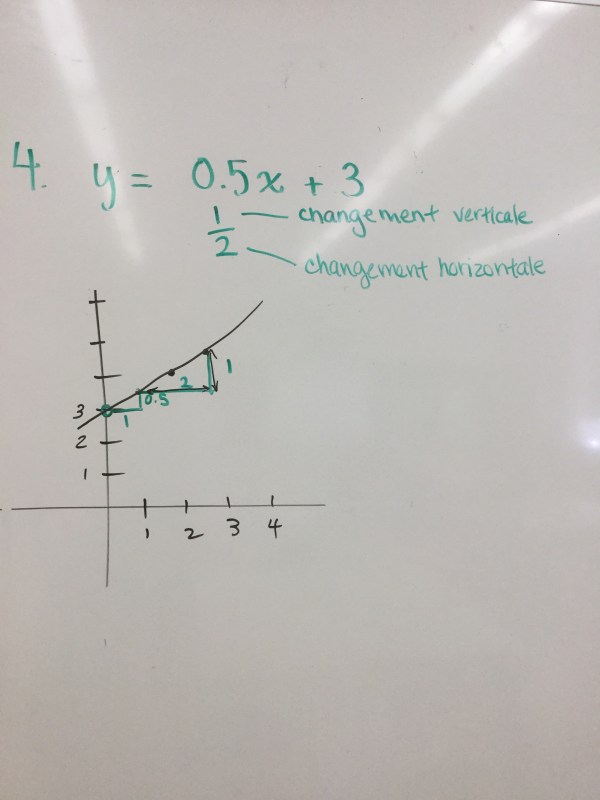
we looked at lots of lines today, some were direct, like this one with a constant of 0, we noticed the rate triangle which shows that the line goes up by 2 for every one it goes over. We also looked at how each point has coordinates that satisfy the equation, so if x=5, y=(2)(5)=10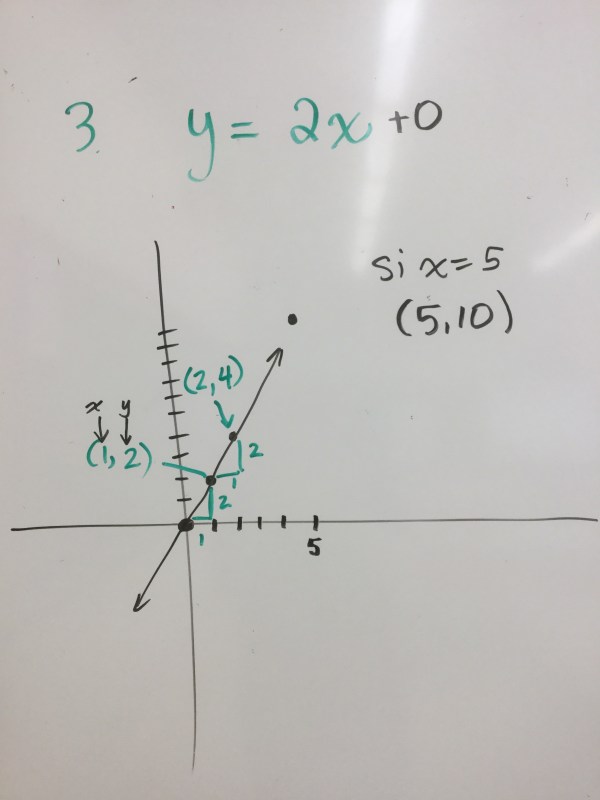
We saw that if the rate is written as a decimal or a fraction it’s the same thing. The line can go up by 0.5 every one time it goes over, or it can go up by 1 every time it goes over by 2.
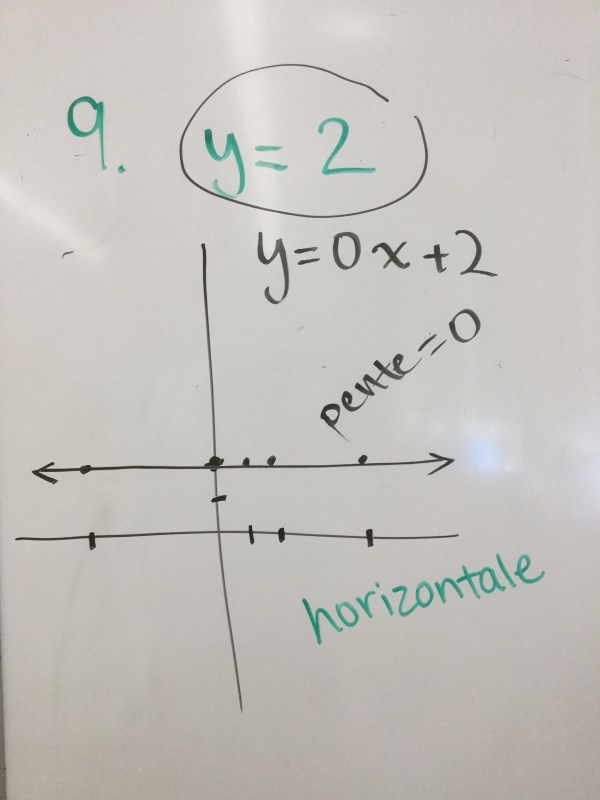
We saw how if there is just a constant, the rate is 0 so it is a horizontal line.
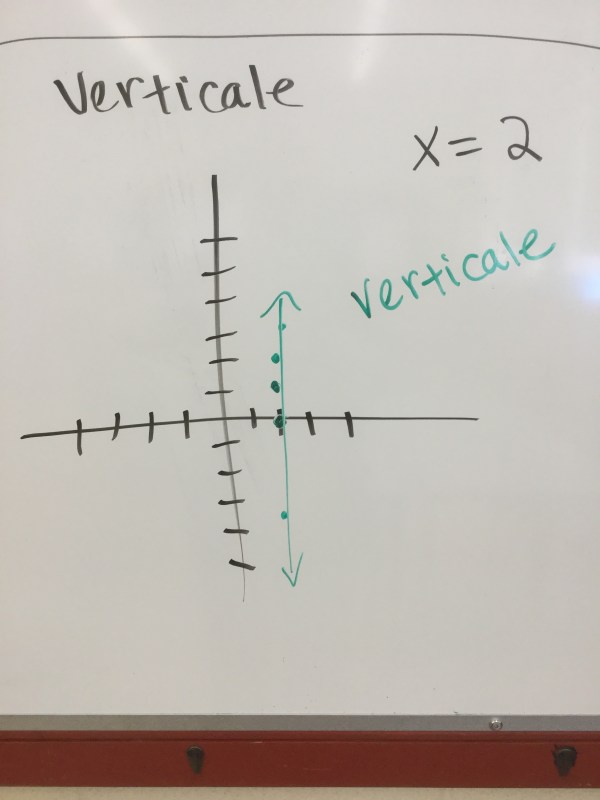
And if there is x=a number for the equation, it’s a vertical line.
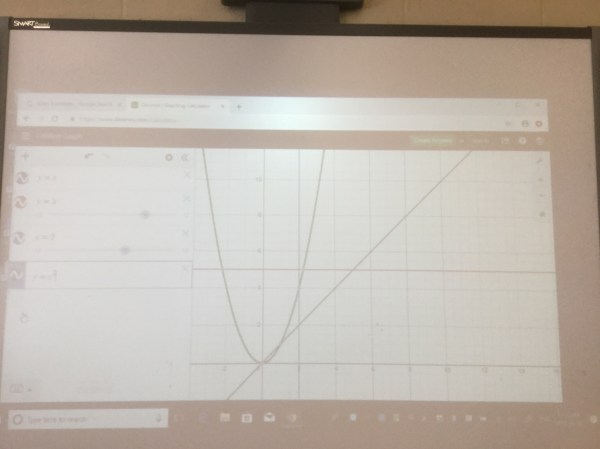
We looked at how helpful desmos can be for graphing lines, and for telling if an equation is linear or not.
Speed dating for review
In grade 10 and 12 today we did a speed dating style review. Paired up, we looked at solving problems.
Grade 10s were looking at features of parabolas given different forms of the equations, completing the square, and factoring. Grade 12s were working on special triangles, graphing trig functions, and solving problems all using radian measure.
After working on a problem, one side of the partnership shifts one space to their right, and tries the next problem with support from the expert who stayed behind.

A timer is set, and after the 5 minutes is done, the other side of the partnership shifts one space to THEIR right to create a new partnership. Each person gets a chance to be the expert, after having been supported through the problem. Each person gets opportunities to work with many different partners.

Students become better at pacing, better at giving good clues, and asking good questions, communication improves, and 72 minute classes pass by pretty quickly when done in this format!
Multiple representations
In grade 9 we’ve been working on patterning. We use visualpatterns.org to supply some patterns, and we are getting good at making our own as well.

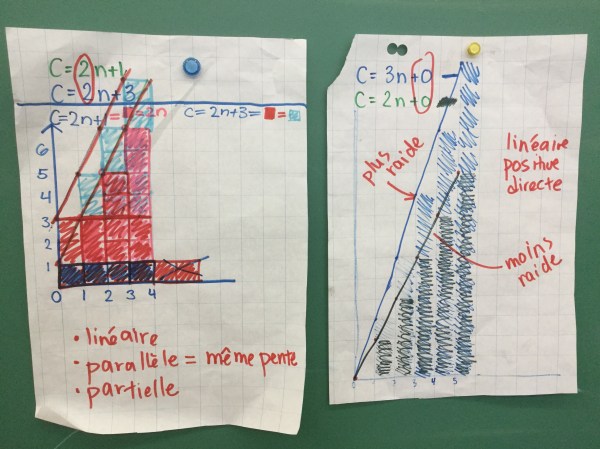
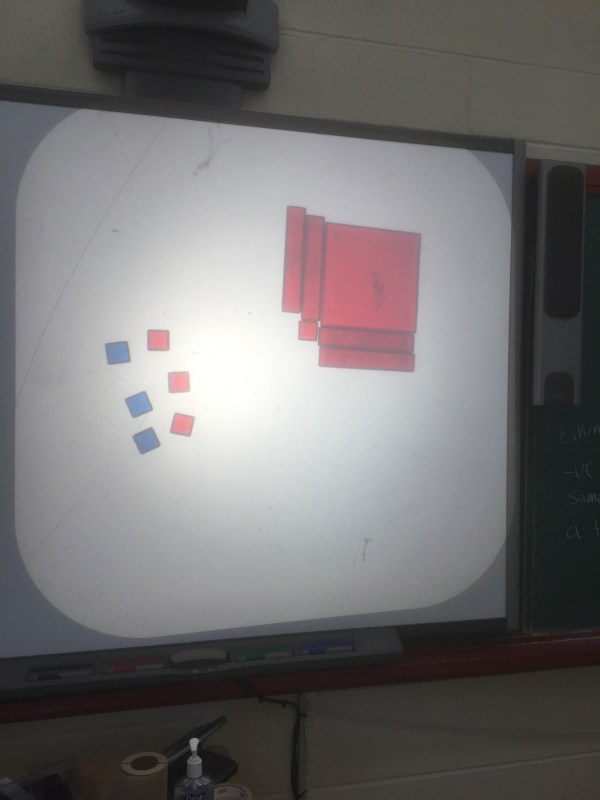
Those two show examples of what c=3n+1 looks like. The constant is 1, and we see 3 groups of “n” (the figure number) in each figure. We also notice that each pattern adds 3 each time, so it is linear, growing at a consistent rate.
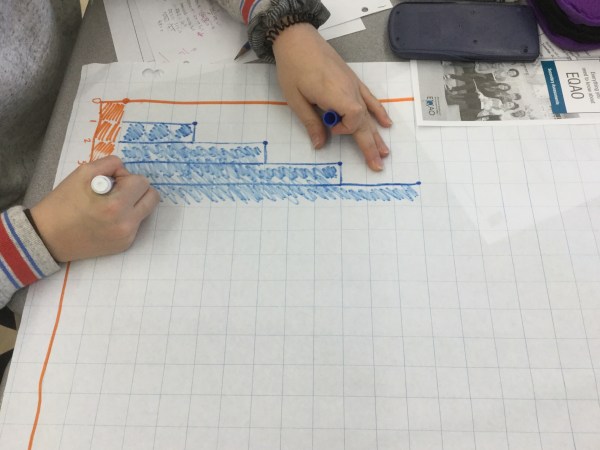
We placed the squares from each figure on the graph, and coloured in the column. We showed the constant is always there (in orange here), and it doesn’t change. The number of blue changes, it goes up by 3 each time. This corresponds to c=3n+1. We noticed that it is partial, that the constant is the initial value on the vertical axis, and that the rate of increase is 3 squares for each increase of figure number.
Each small group was then given 2 equations to draw, and notice things about. Here the constants are different, and the rate is the same. The lines are both positive, partial, and also parallel.

We looked at some with negative constants, and different rates. If the coefficient is bigger we noticed that the line is steeper. The other graph shows the same constant, of 6, and one with a positive rate, and another with a negative rate. That was a bit tricky to figure out how to manage a rate of decrease.
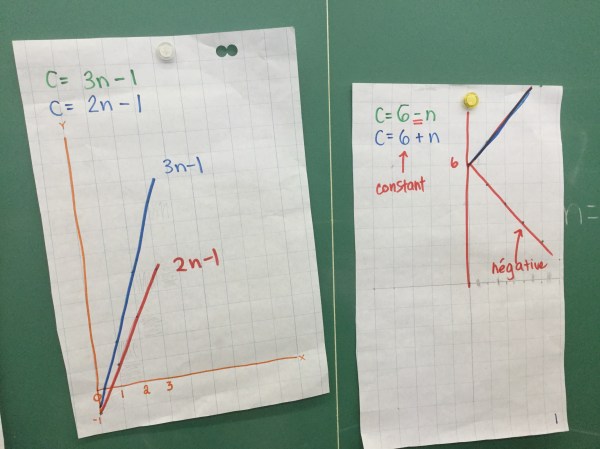
We noticed that if the constant is 0 then it is a direct graph, passing through (0,0).
We did a lot for our first day graphing lines! Good job everyone. We can now connect the representations of visual pattern, equation and graph.
Different forms of quadratics
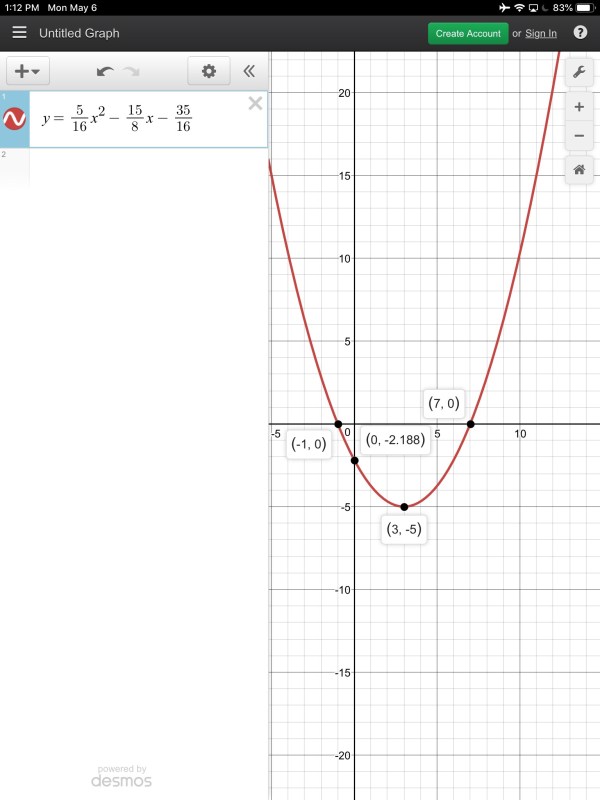
Grade 10s are working hard to determine the key features of parabolas from different equation forms, and vice versa. We looked at working backwards to create equations given different graph features.
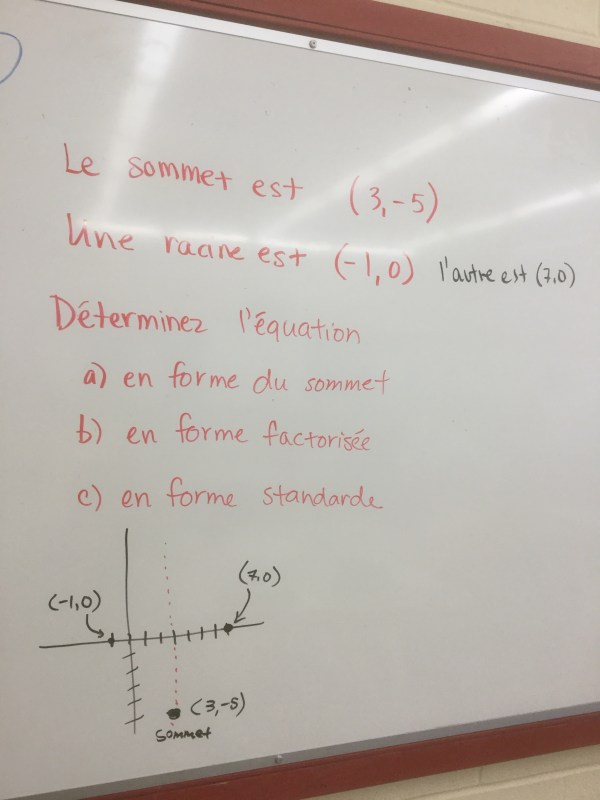
We used symmetry to determine one zero when we knew one zero and the vertex
We worked through all the forms, starting with creating the vertex form equation. We substituted the values of the vertex, and then the given root, we subbed in for x and y. We calculated “a”.

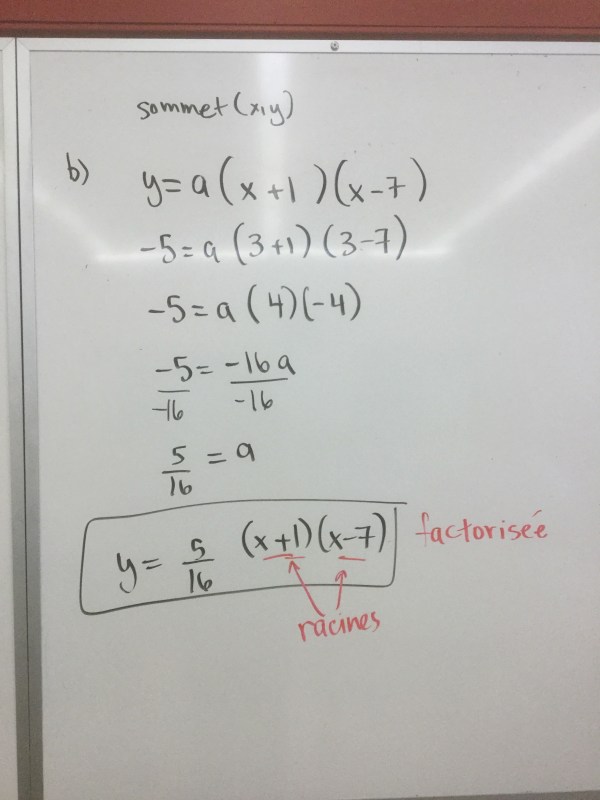
The next form was factored form, so we needed both zeros and a point (the vertex) and we subbed in our values and calculated “a” (which was the same as before! We noticed “a” is the same in all forms).
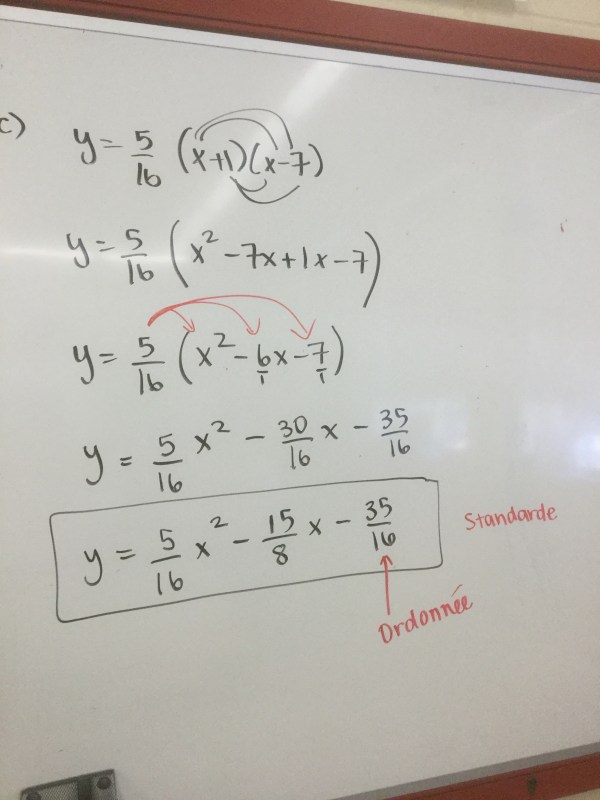
We expanded to get standard form, and saw the y intercept, the “c” value
By plotting this equation on desmos, we could verify that the vertex and roots were what they were supposed to be.
It’s pretty elegant how all of these forms fit together!
Completing the square
Grade 10s are getting skilled with using vertex form, and we are now learning how to change an equation into vertex form, by completing the square.
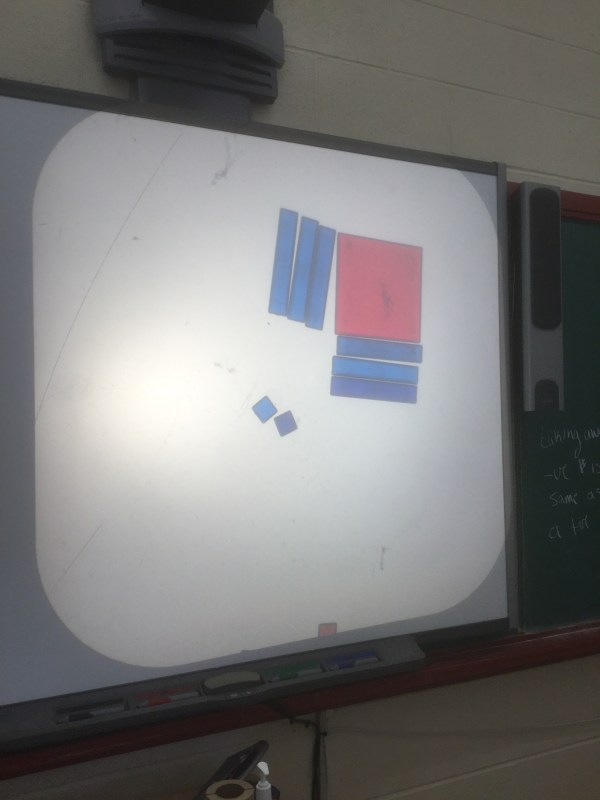
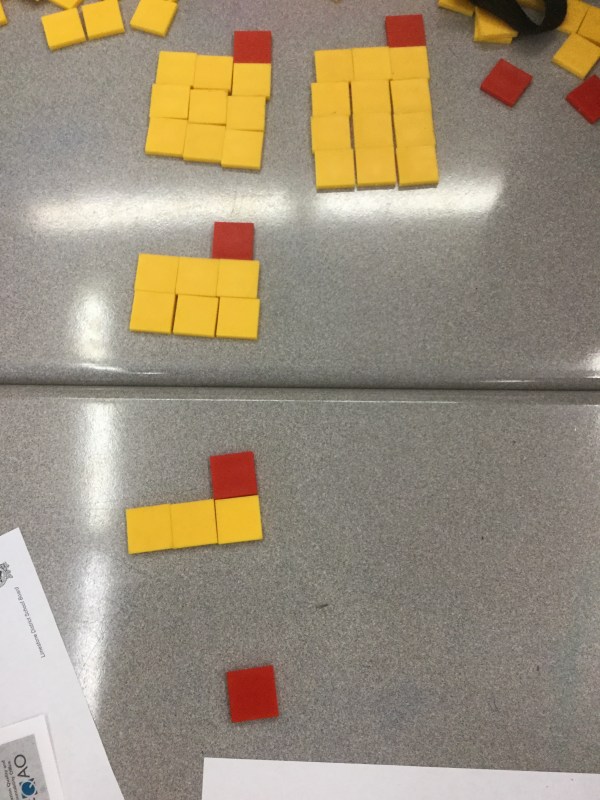
Step 1: represent the trinomial, and in this case we always want to make a square, so we split the x term in 2 groups, and use those for the sides of the square. We need to fill the square with 9 red squares. In order to get 9 red squares we need to add 9 zero pairs.

Our final equation in vertex form is y=(x-3)^2-11
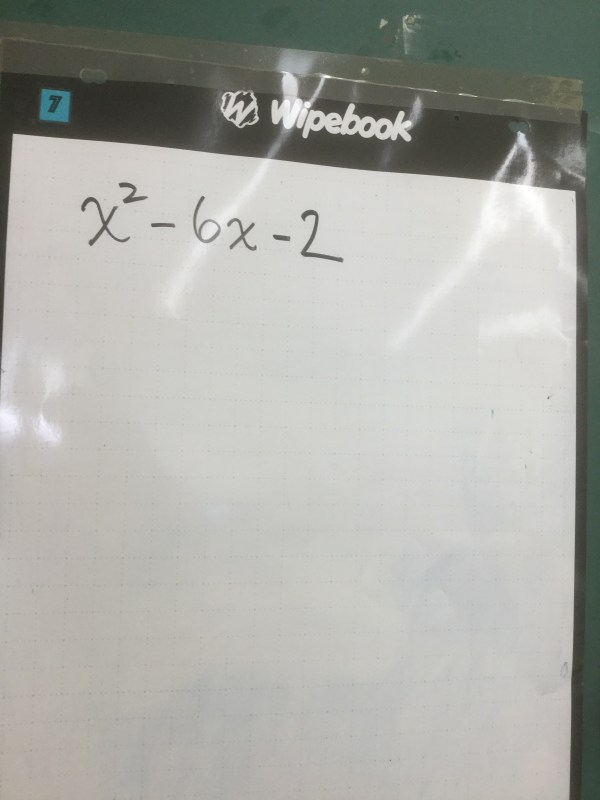
Here’s another example: x^2+4x+1

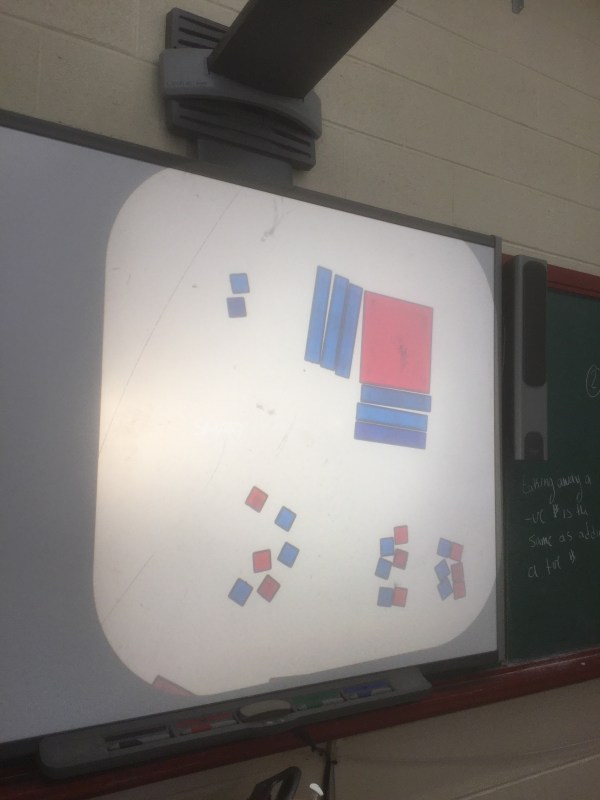
We need to complete the square with 3 more red squares so we add 3 zero pairs
And complete the square

Our final form is y=(x+2)^2-3
Patterning
from the same drawing of figure 2 we were able to create many different patterns. Some grew by 2 with a constant of 1.
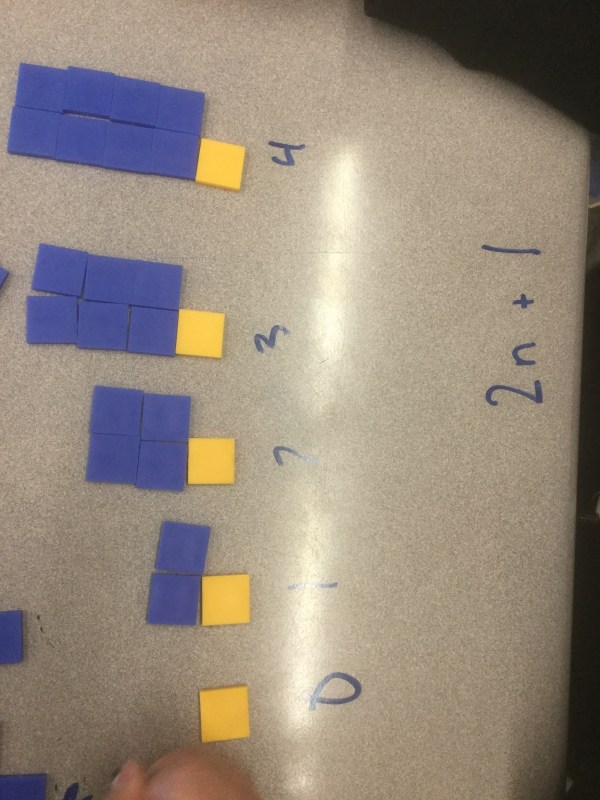
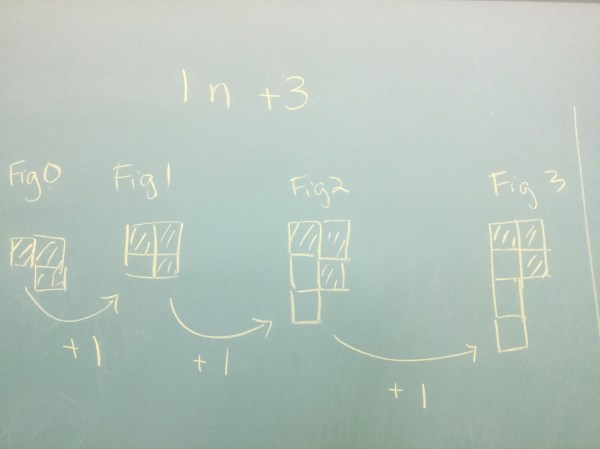
Some grew by 1 with a constant of 3

Some grew by 2 with a constant of 1, but in a different way than before…

We looked at how to know if a pattern is growing linearly, by adding the same thing each time to get to the next term
Or non-linearly by adding different numbers of squares each time. In this case, we look for squares of “n” as well as groups of “n” to determine the equation (which we do lots of in grade 10).

We explored visualpatterns.org and found some patterns quite tricky. This one has a constant that is negative!

We will be looking at patterning and how patterns relate to equations and graphs over the next little while.
