Reviewing in grade 10
We are working hard to master our chapter 1 problem solving techniques. We are writing out full solutions…
We are working together and making sure our solutions make sense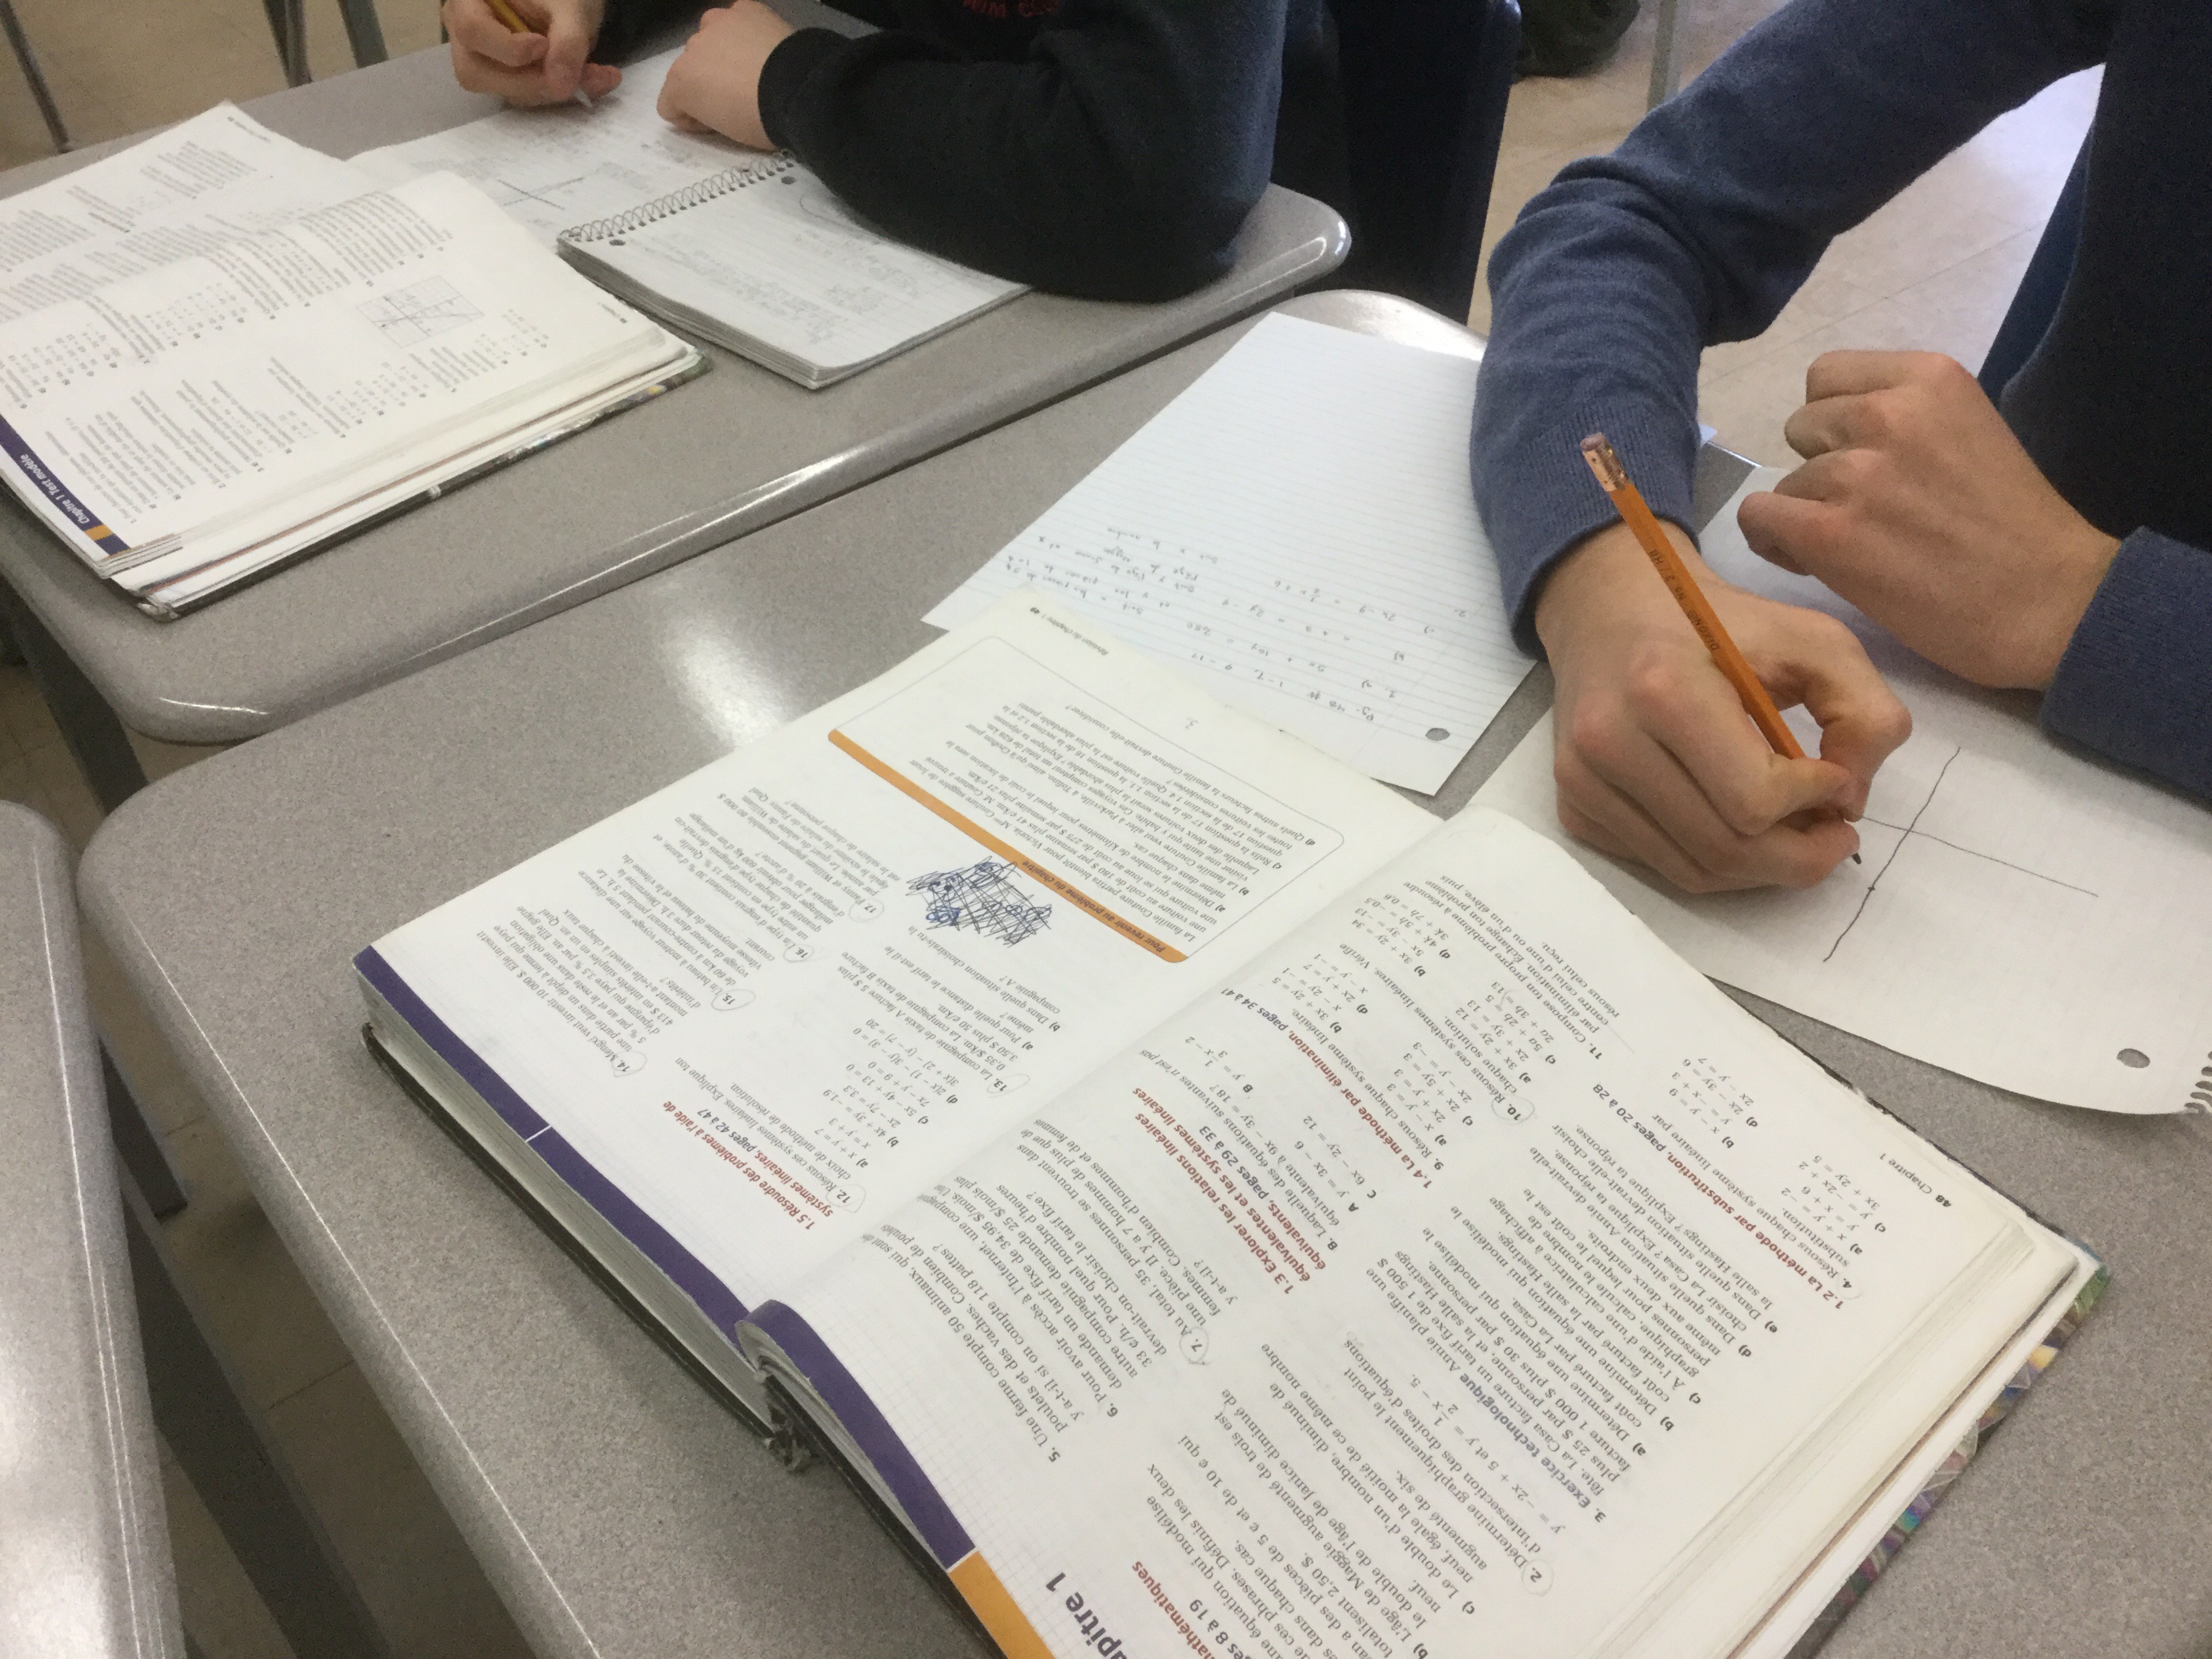
We’re also working on completing our study notes assignment that is due tomorrow.
Keep up the great work grade 10s!
Bottle blowing experiment
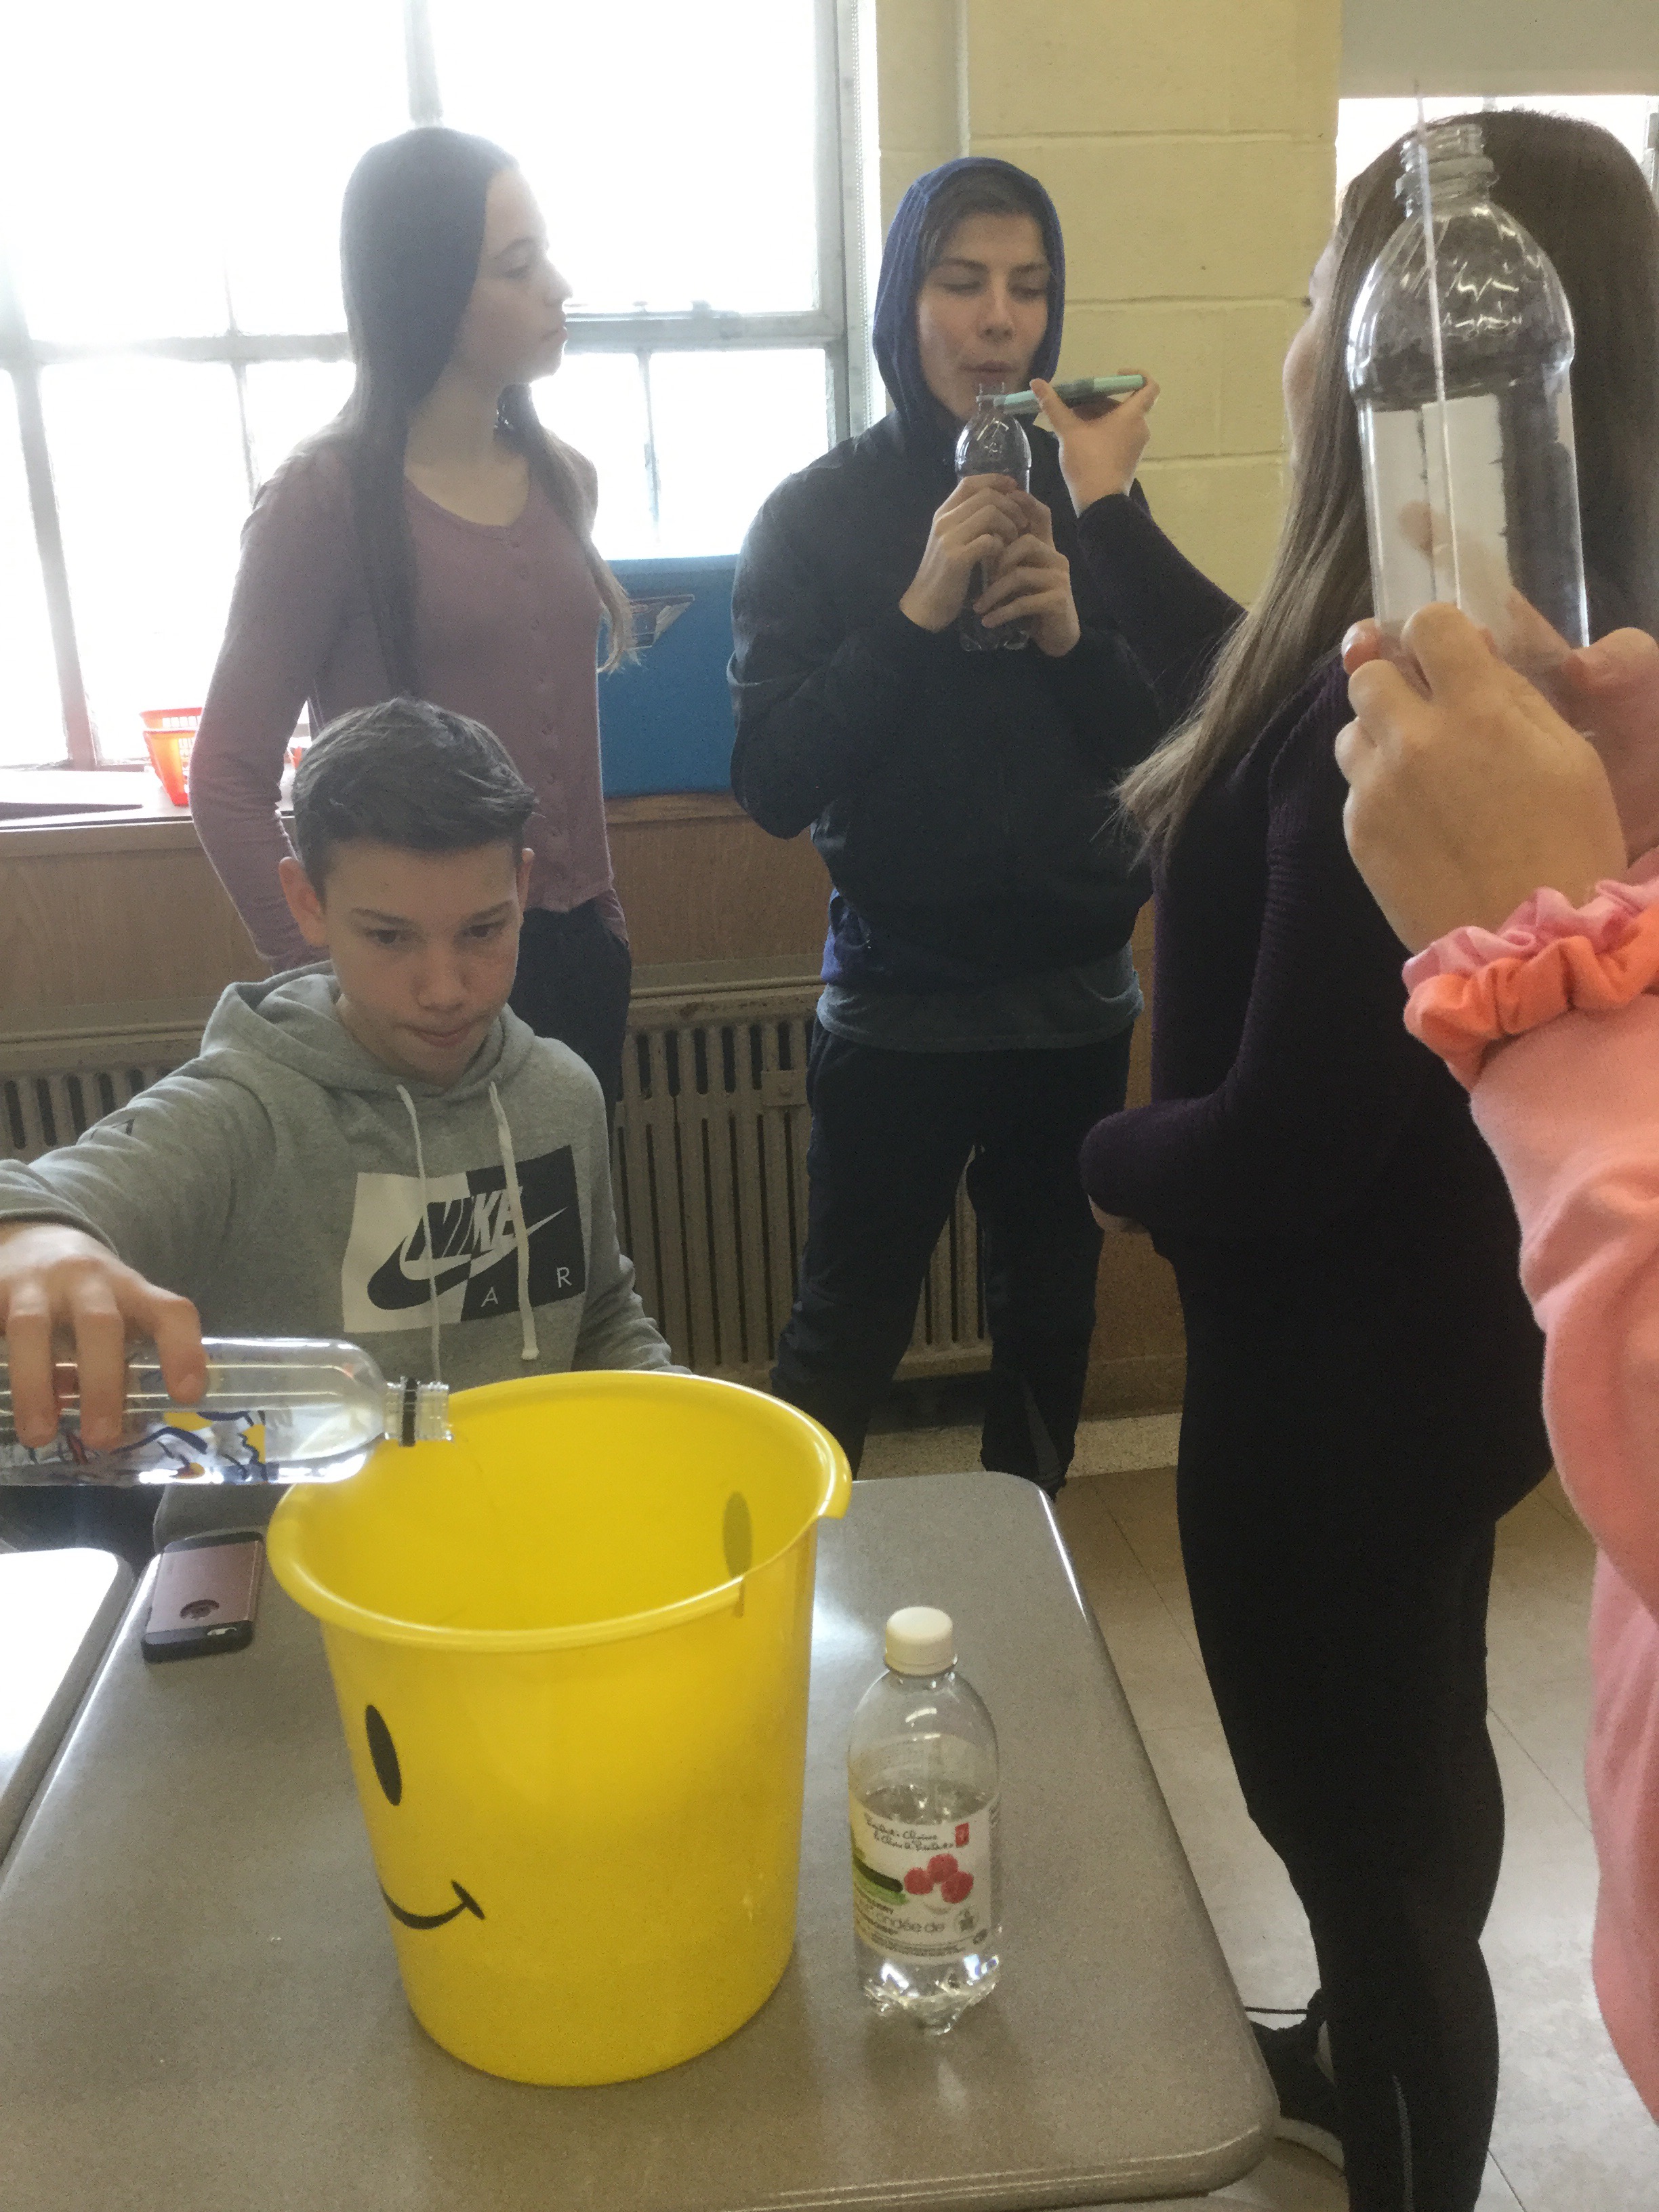
Today in grade 9 we experimented with the sound produced when blowing over the neck of a bottle with more or less water in it.
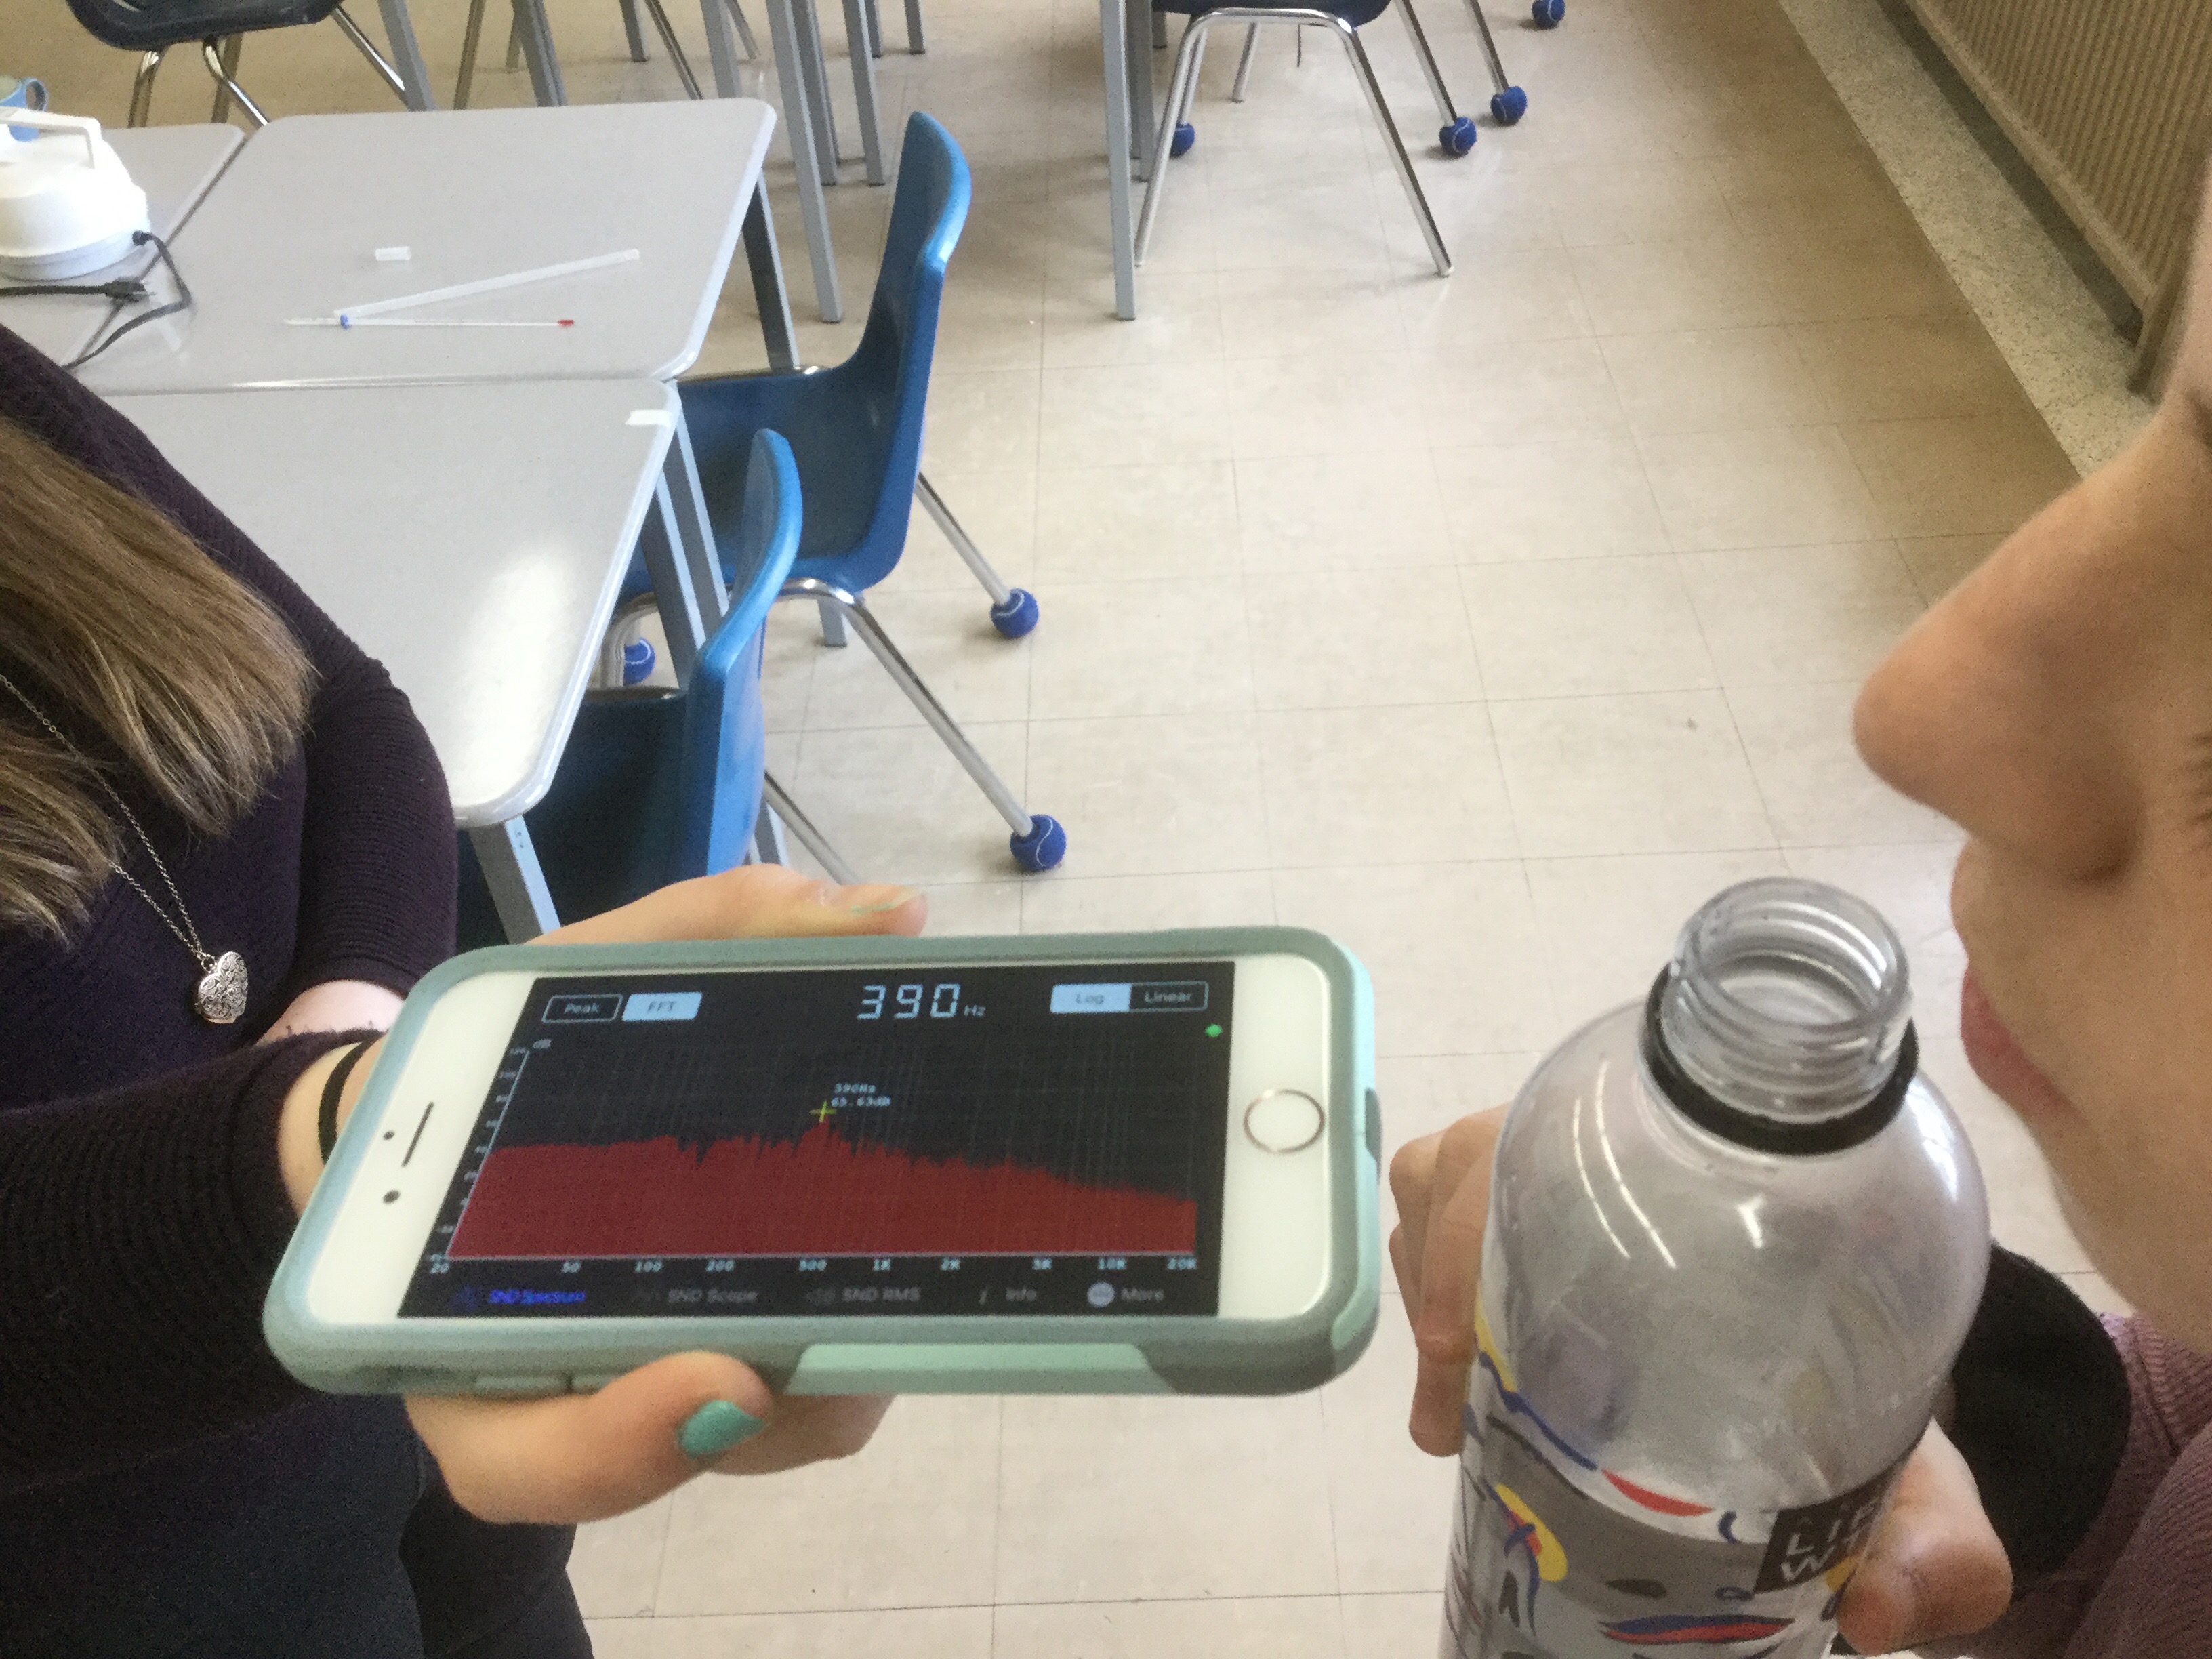
We used the app “sonic tools” to determine the frequency, and we started out with a lot of water in our bottles (which creates a small air column), and we decreased the level of water between trials, which increases the column of air in the bottle.
Once we got going, we collected a lot of data in a relatively short time.
We learned how to use google sheets to make a graph from a spreadsheet. Although it’s not ideal to use an ipad (graphs don’t format well) the computer version can make some great graphs.
This graph has the frequency on the vertical axis, it is what we measured, and it depends on the height of the air column. The frequency is the dependent variable. The height of the air column is on the horizontal axis, it is the independent variable, which we modified as part of our experiment.
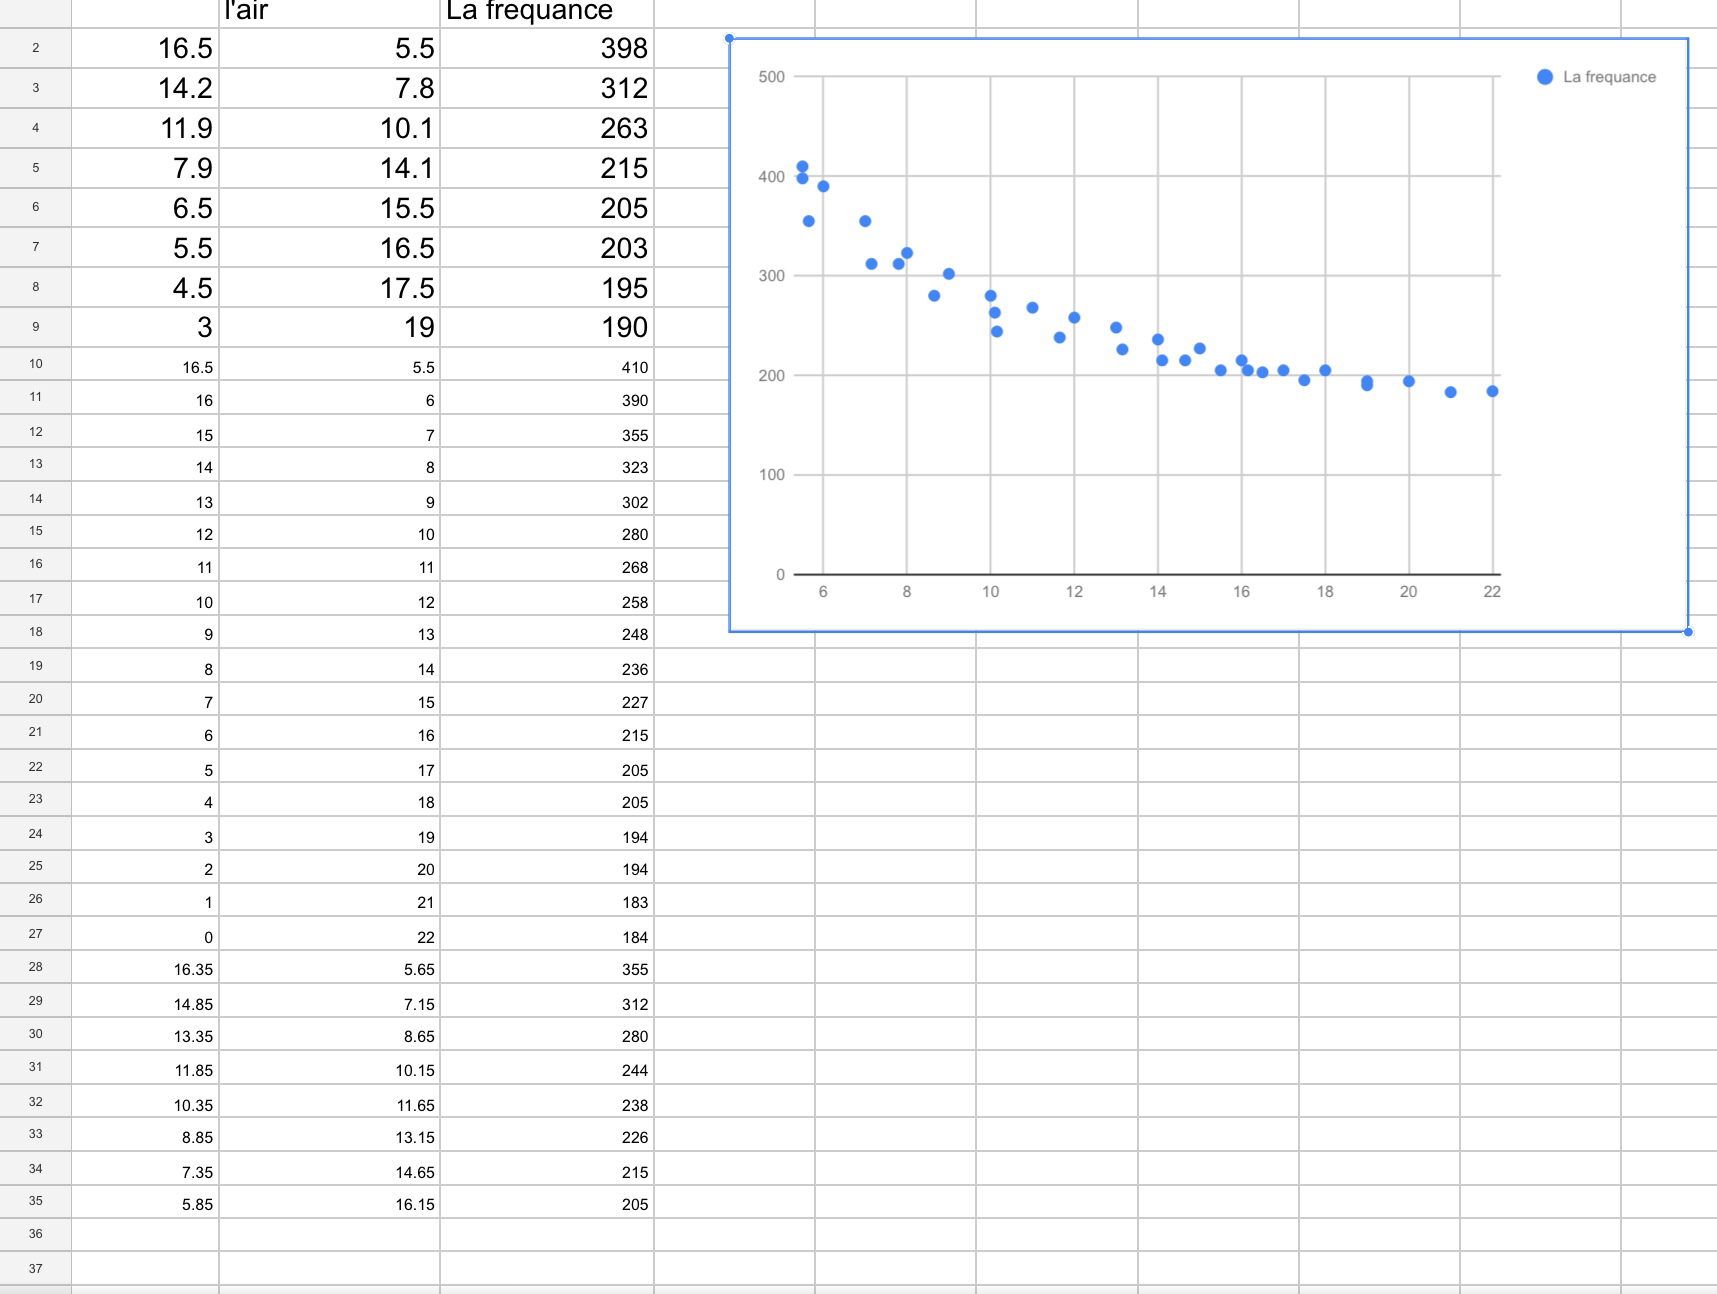
We see that the graph is non linear, and fairly strong but not perfectly correlated, it is partial, and it is negative.
Literacy practice in grade 10
We worked on literacy test prep today


The focus was on text features, and how to approach multiple choice questions.
Cheerio Graphing part 2
Grade 9s continued with their graphs from yesterday.
Some decided their graphs looked linear, and so they drew lines of best fit to model the trend.

Others weren’t exactly convinced the trend would be a straight line, so they added lines or a curve of best fit to model how the trend changed.
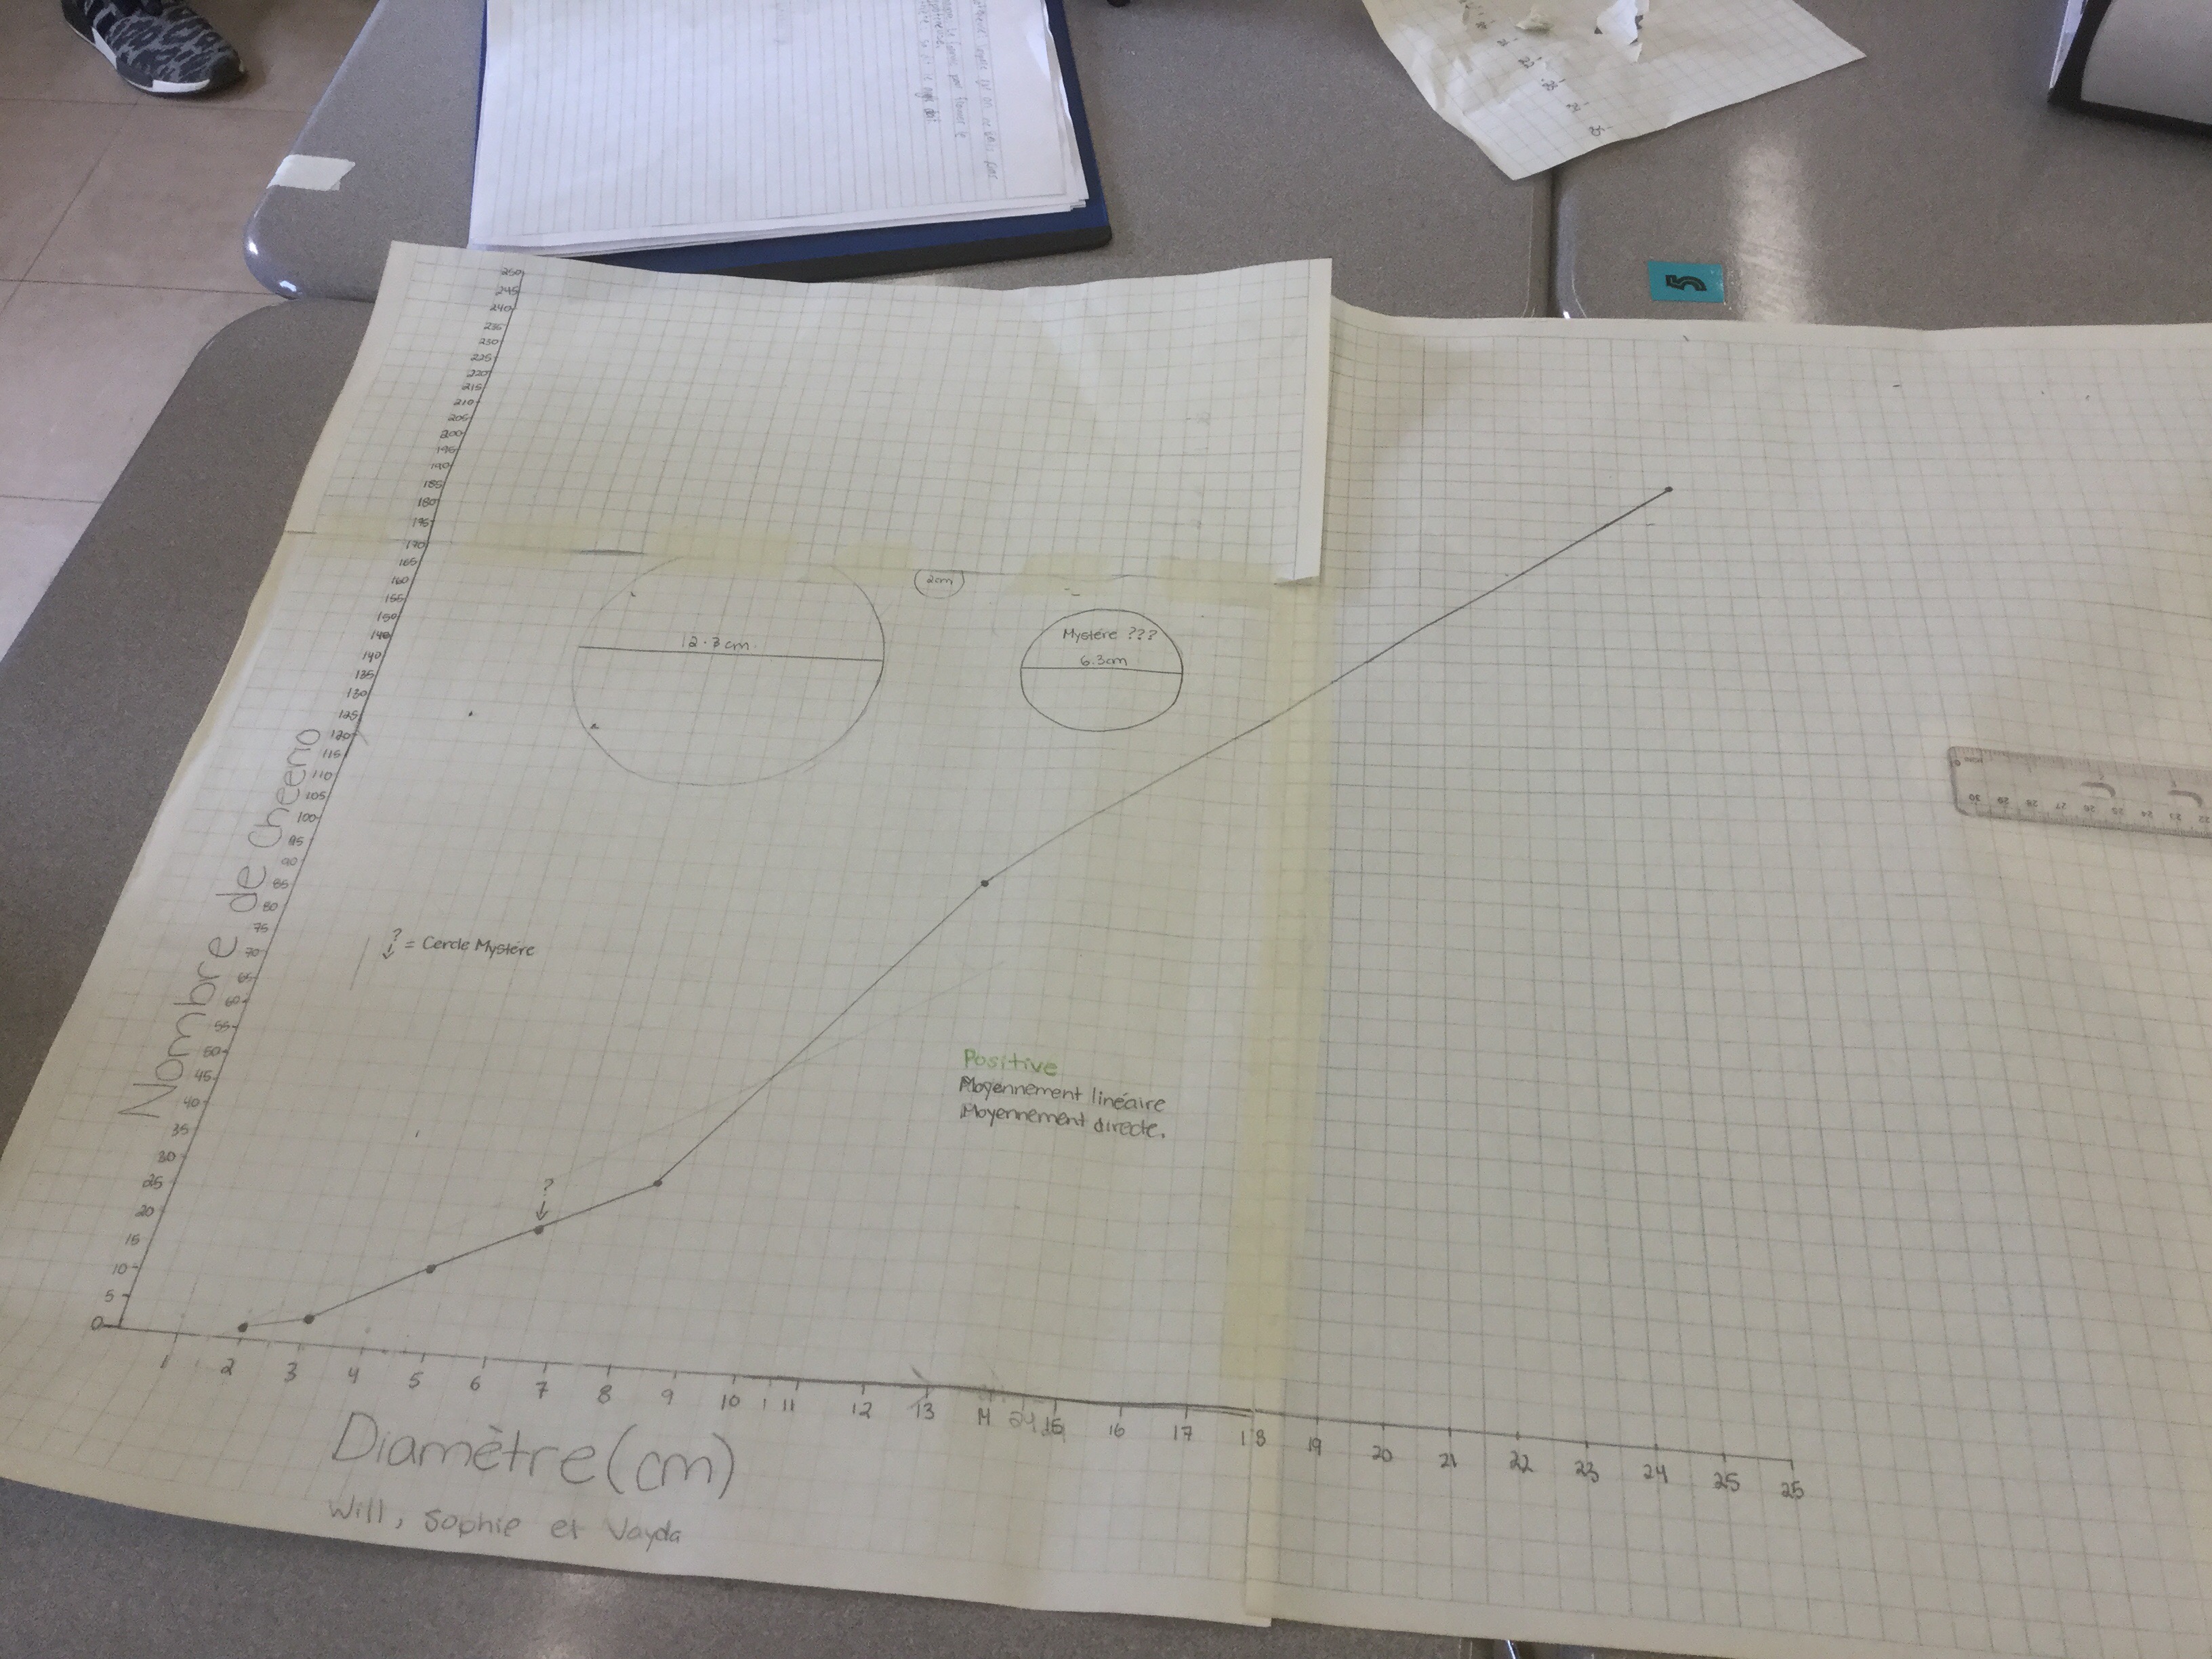
After everyone had their graphs, the goal was to predict how many cheerios would fit on two mystery circles. One was a small circle, (that fell between data points on the graph), and another was really big, bigger than any other circle we had filled before.
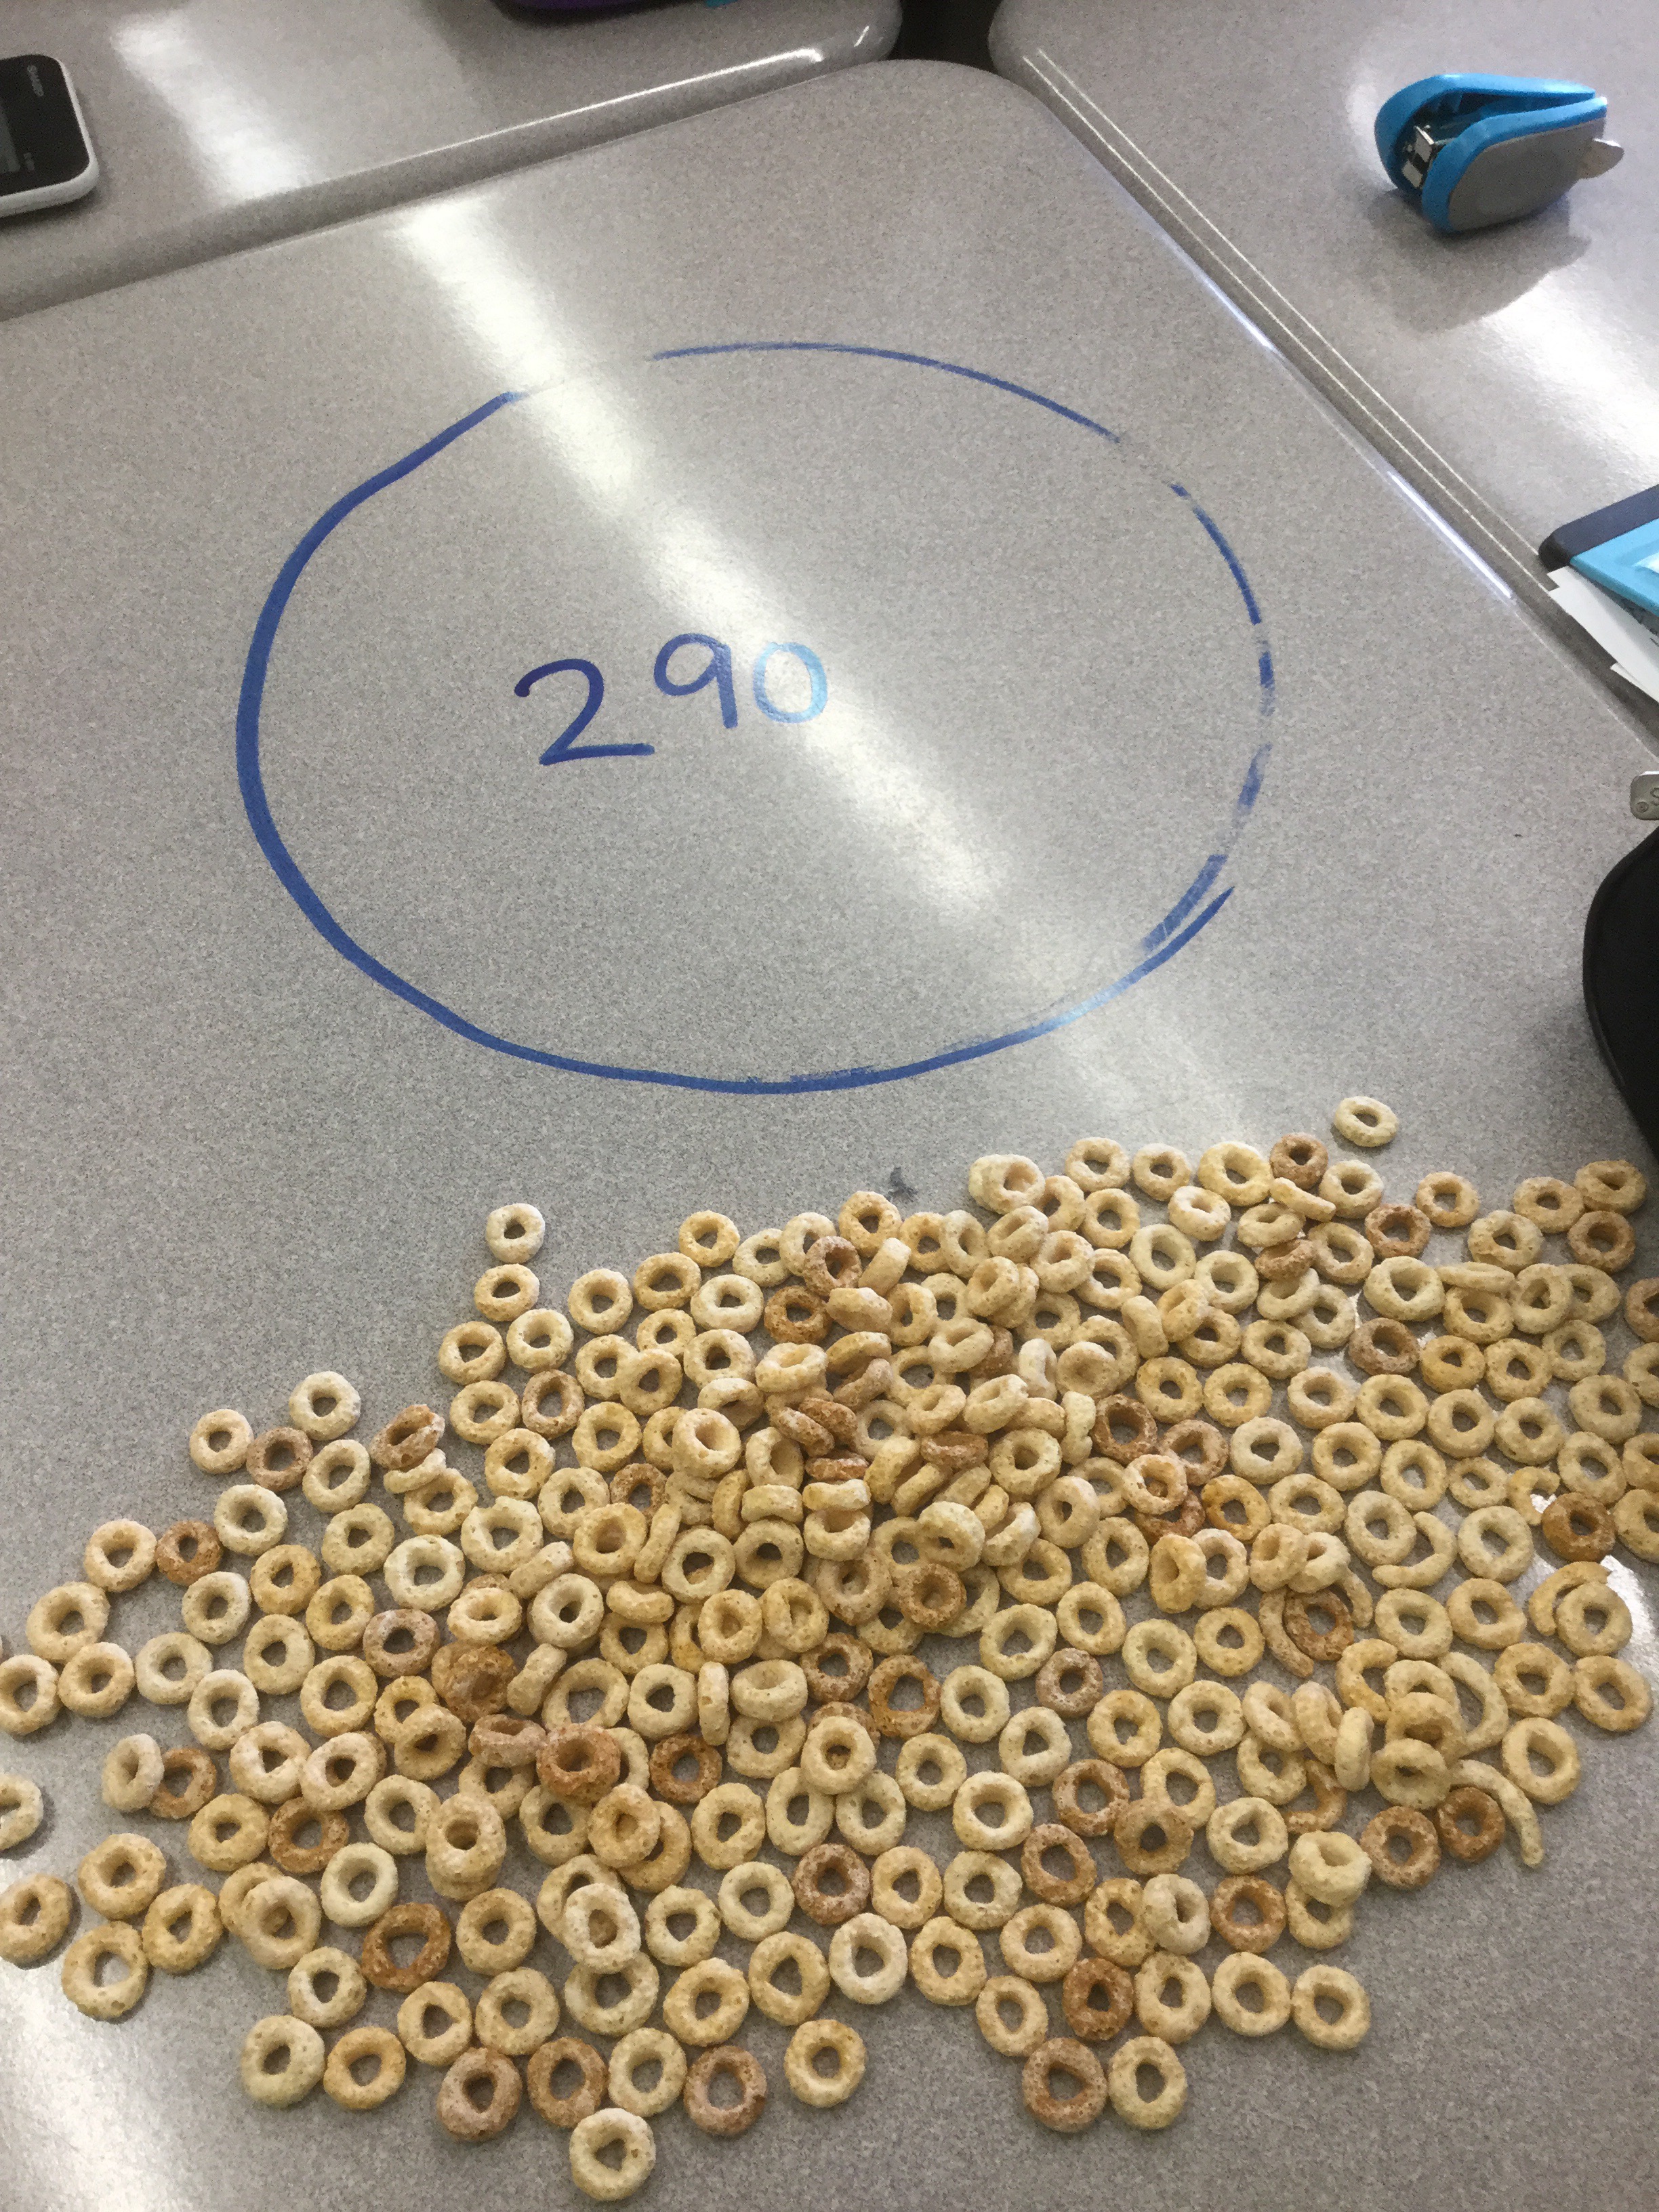
Estimates for the big circle ranged from 160-300 cheerios based on our various graphical models.
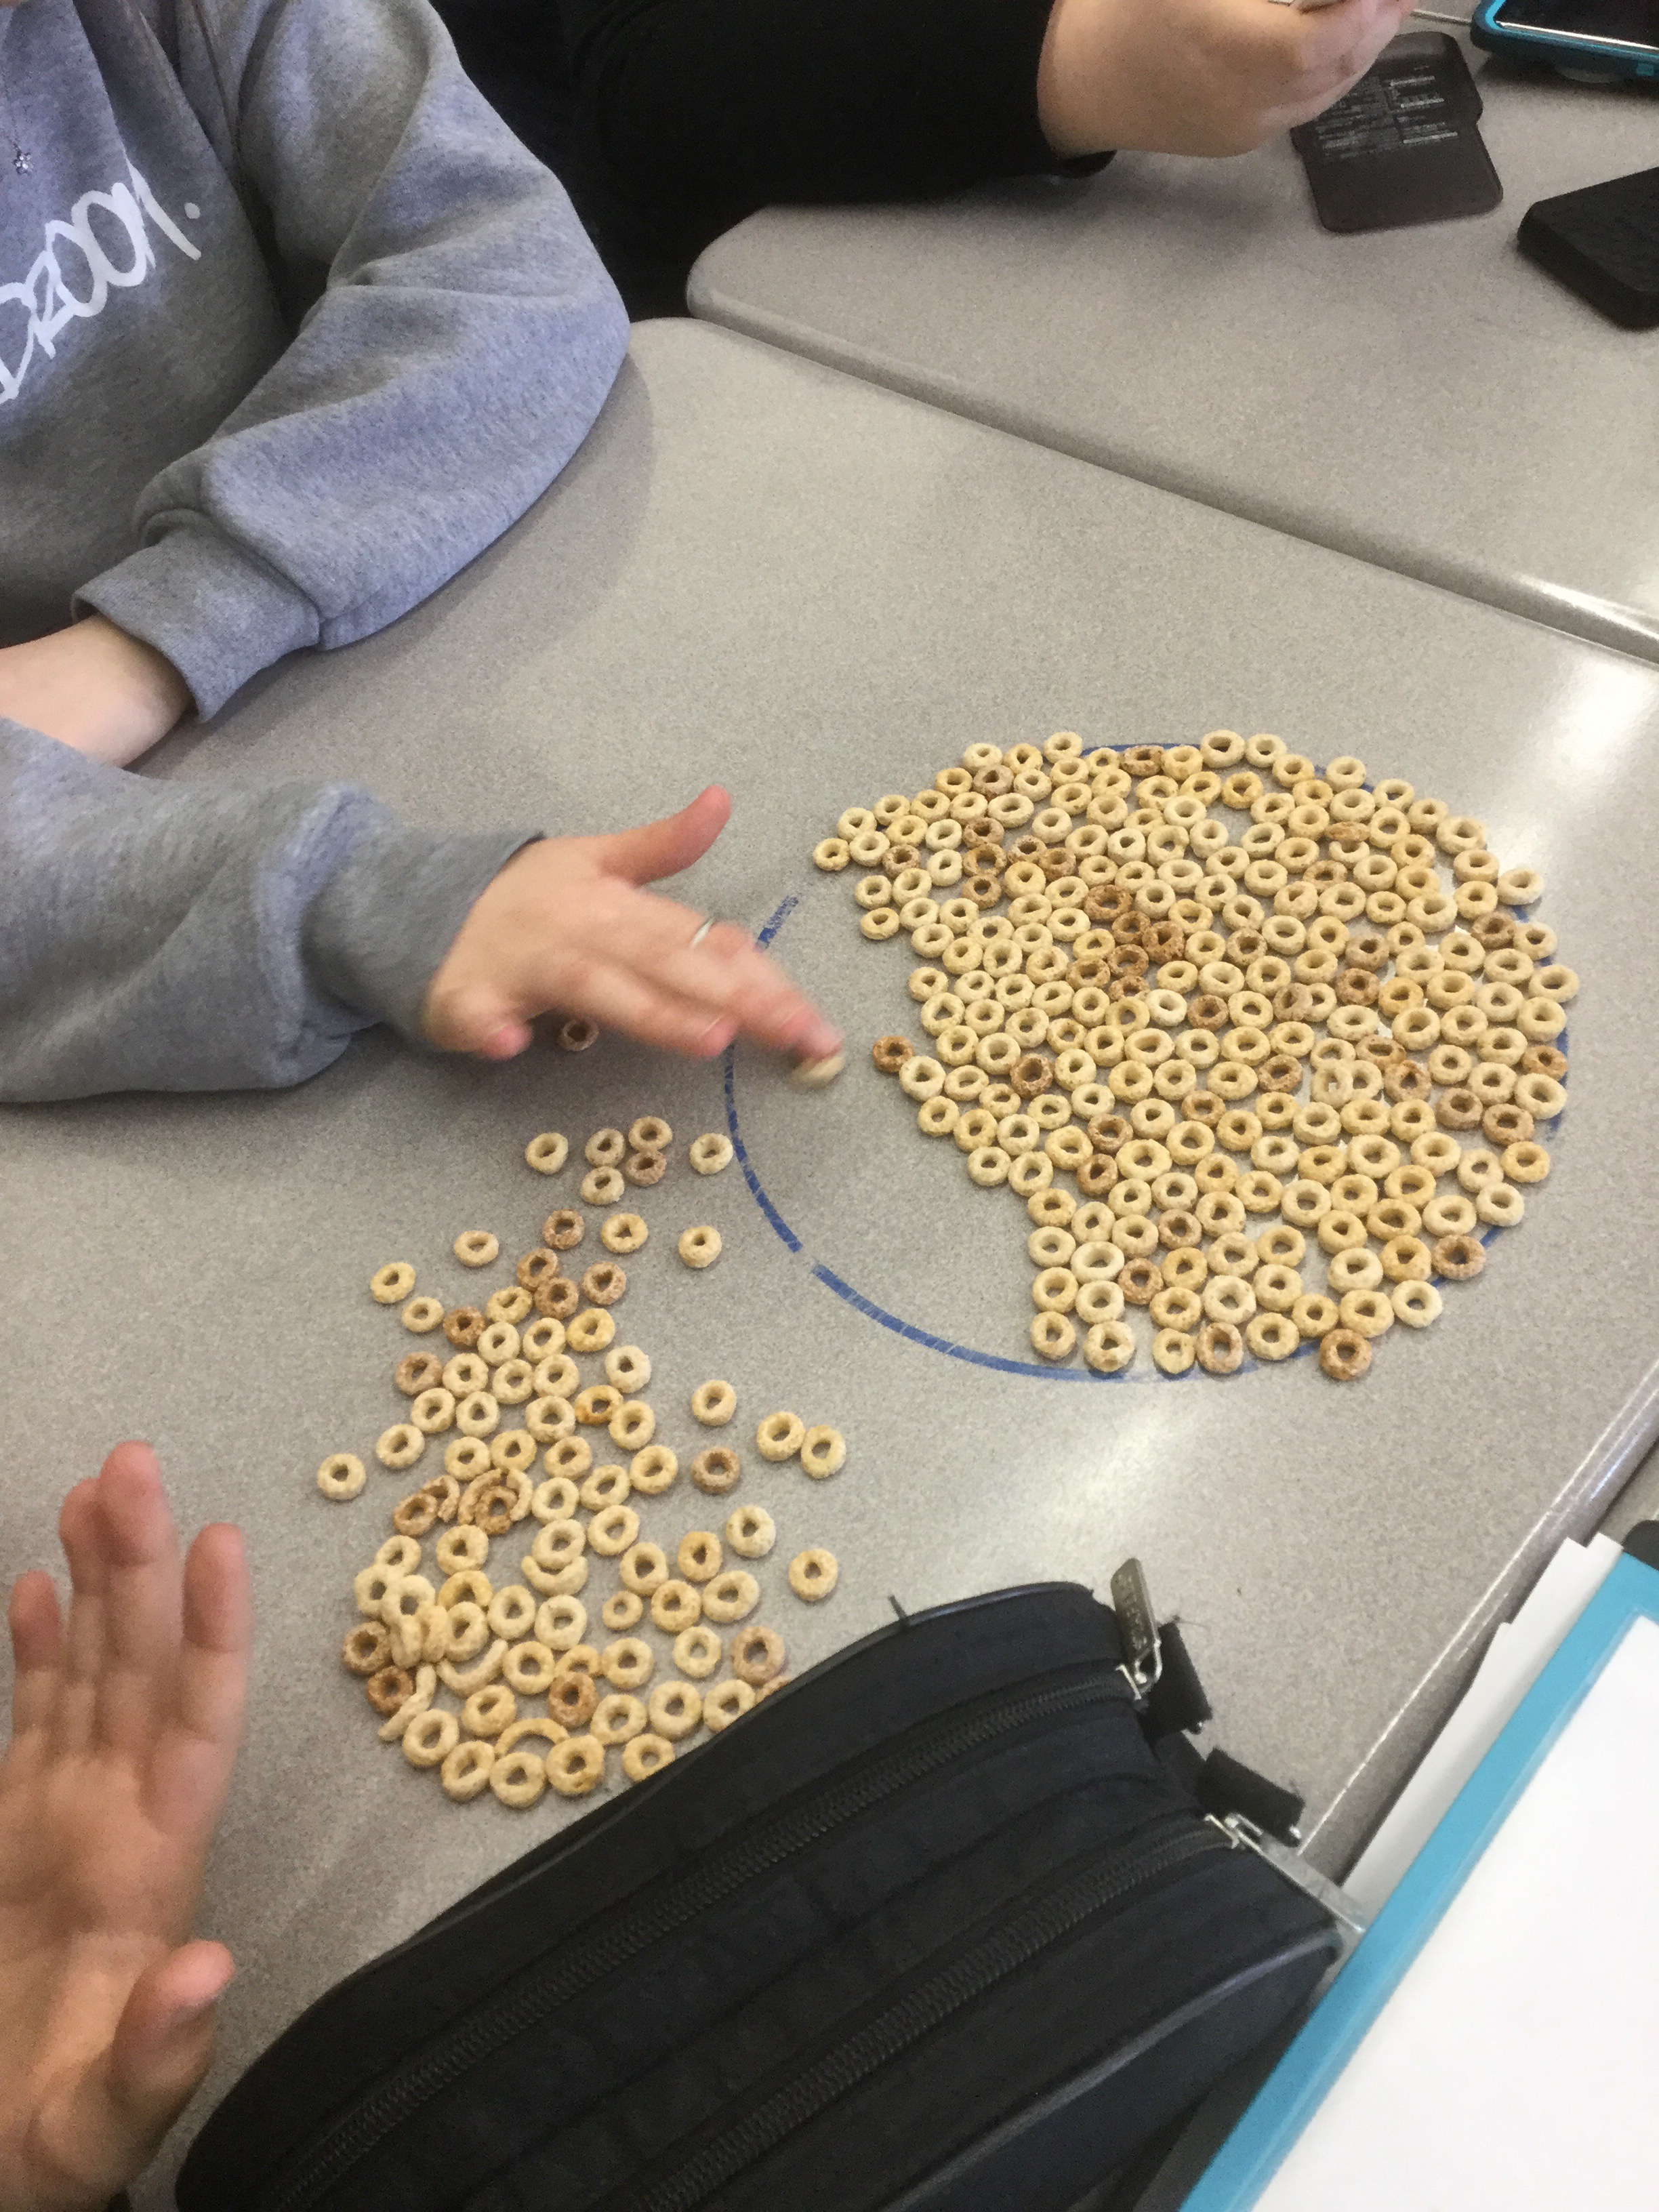
To see how close our estimations were, we filled the circle and counted.
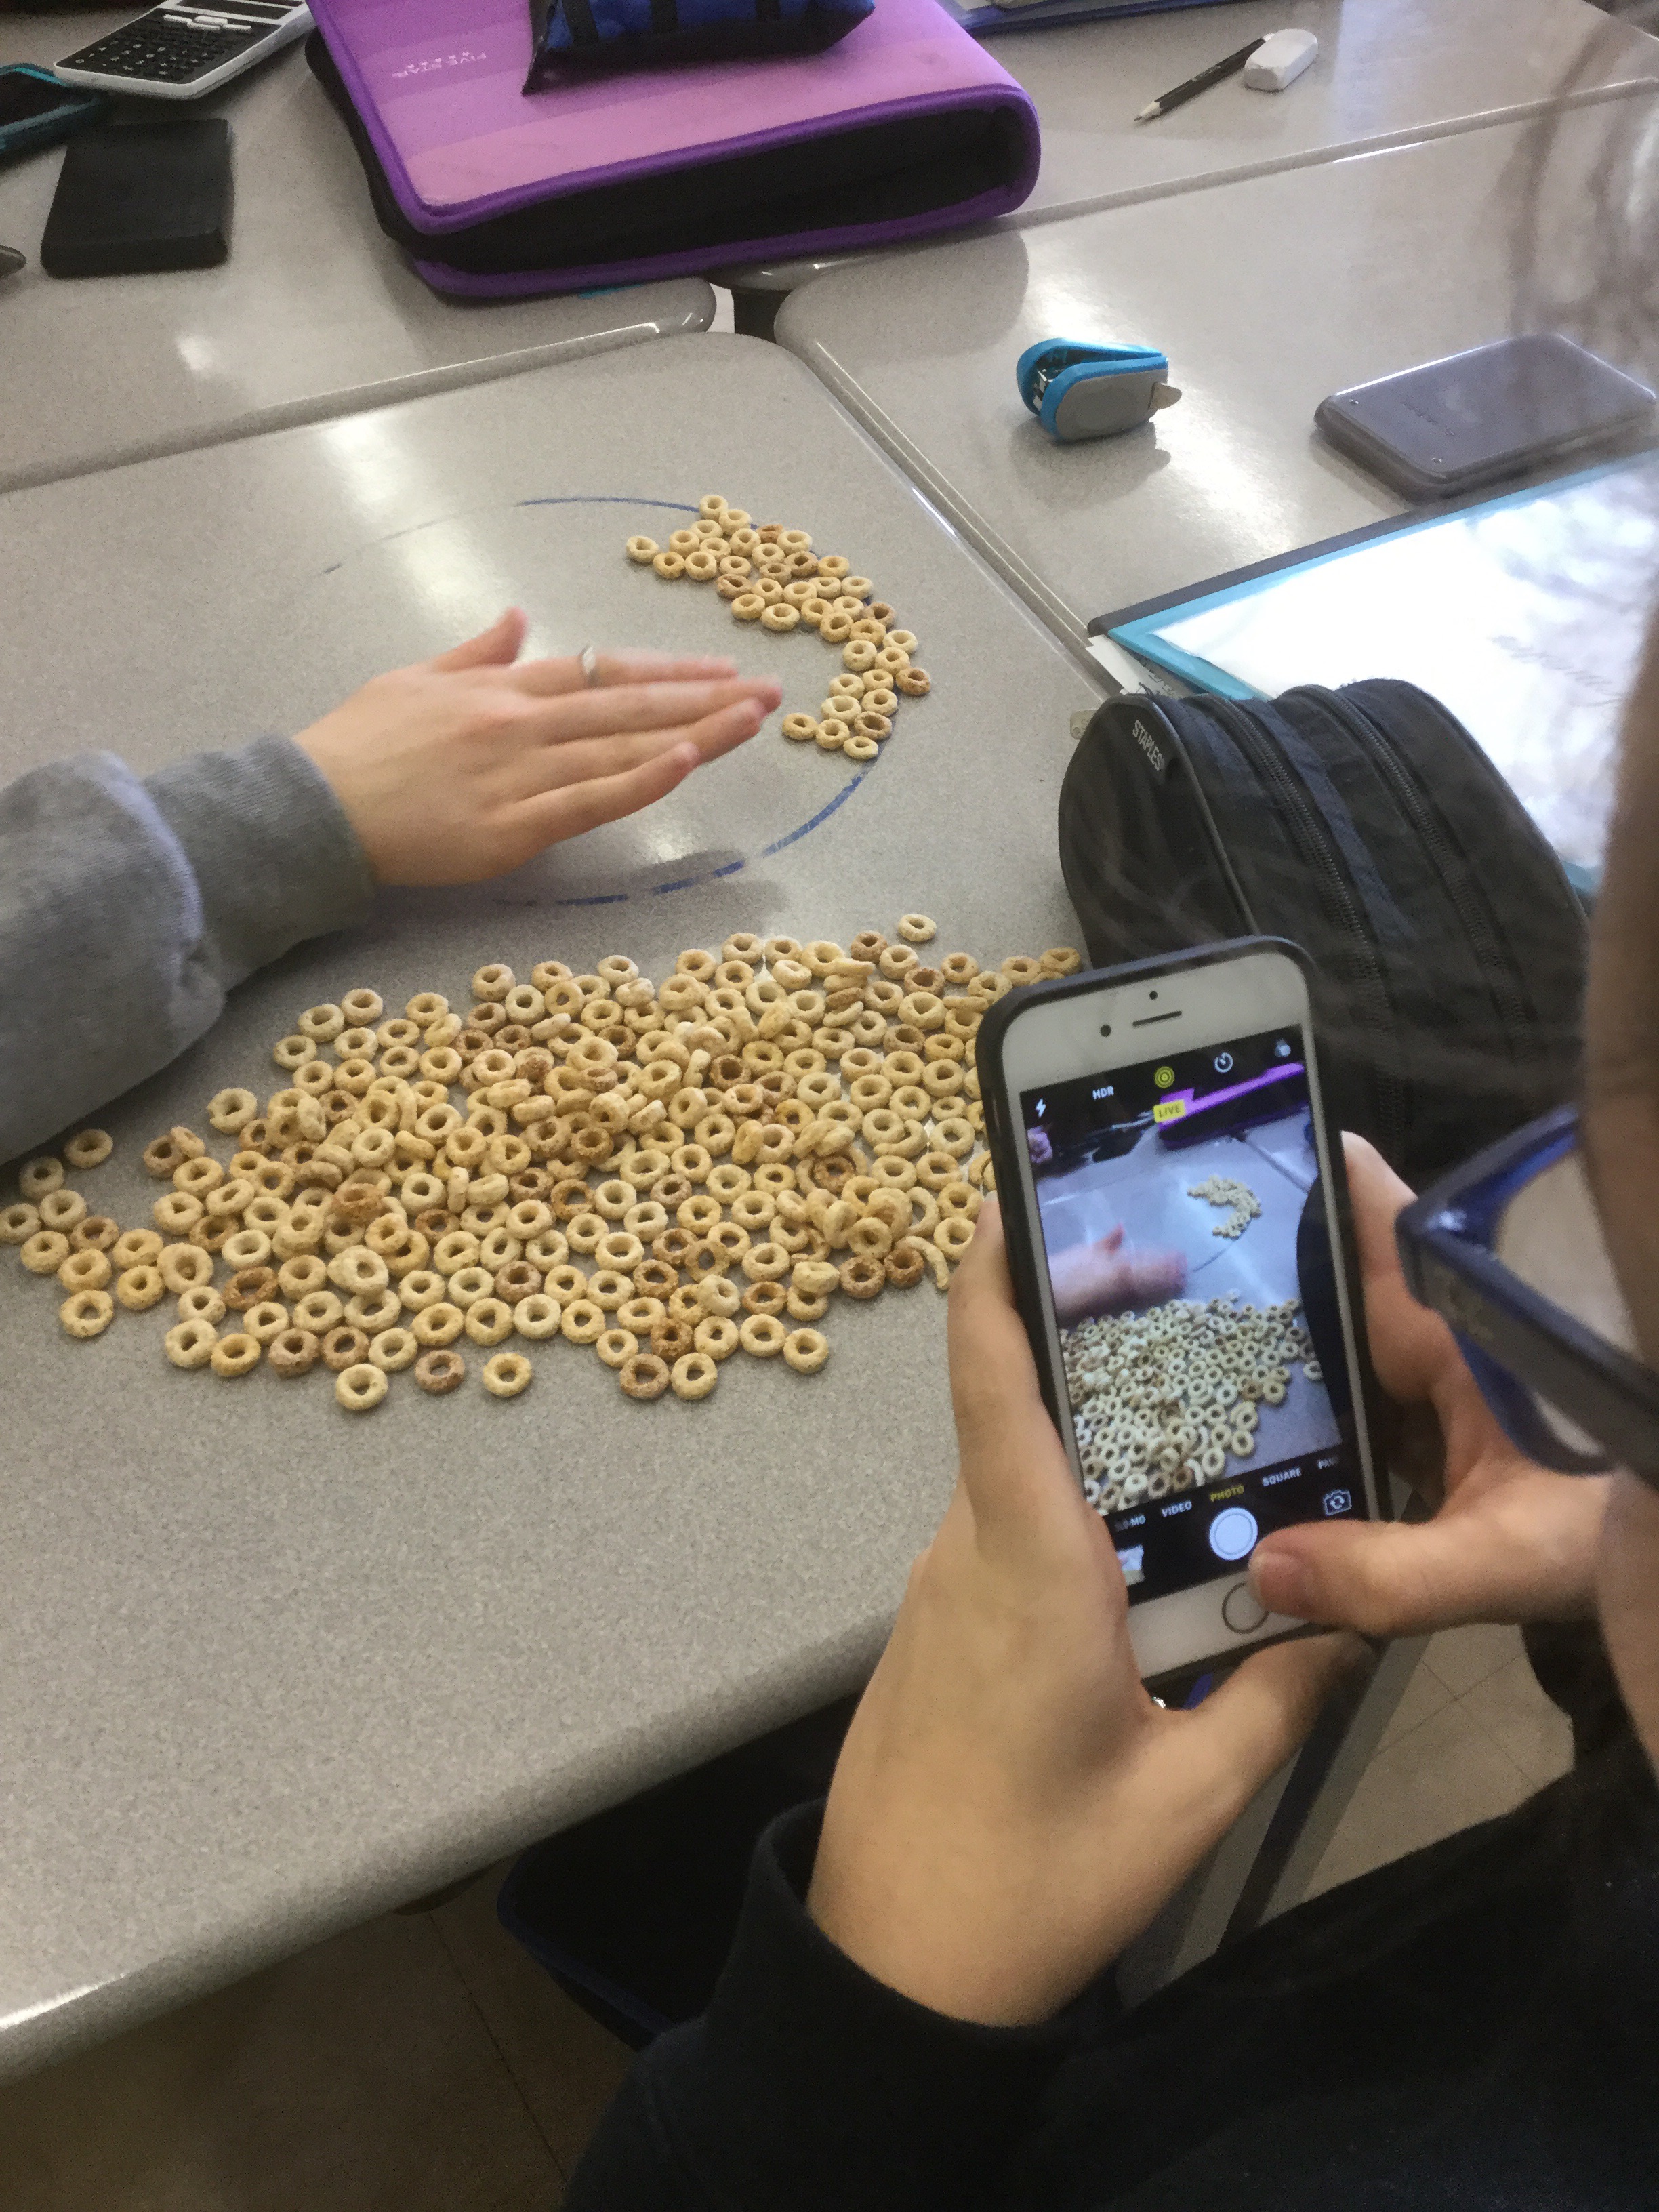
Our total number of cheerios was 290
We learned a few things while working on this activity.
- Graphing by hand is tedious!
- When you need to use your graph to make a prediction of a larger value, you may need to make your graph bigger, and use a lot more paper.
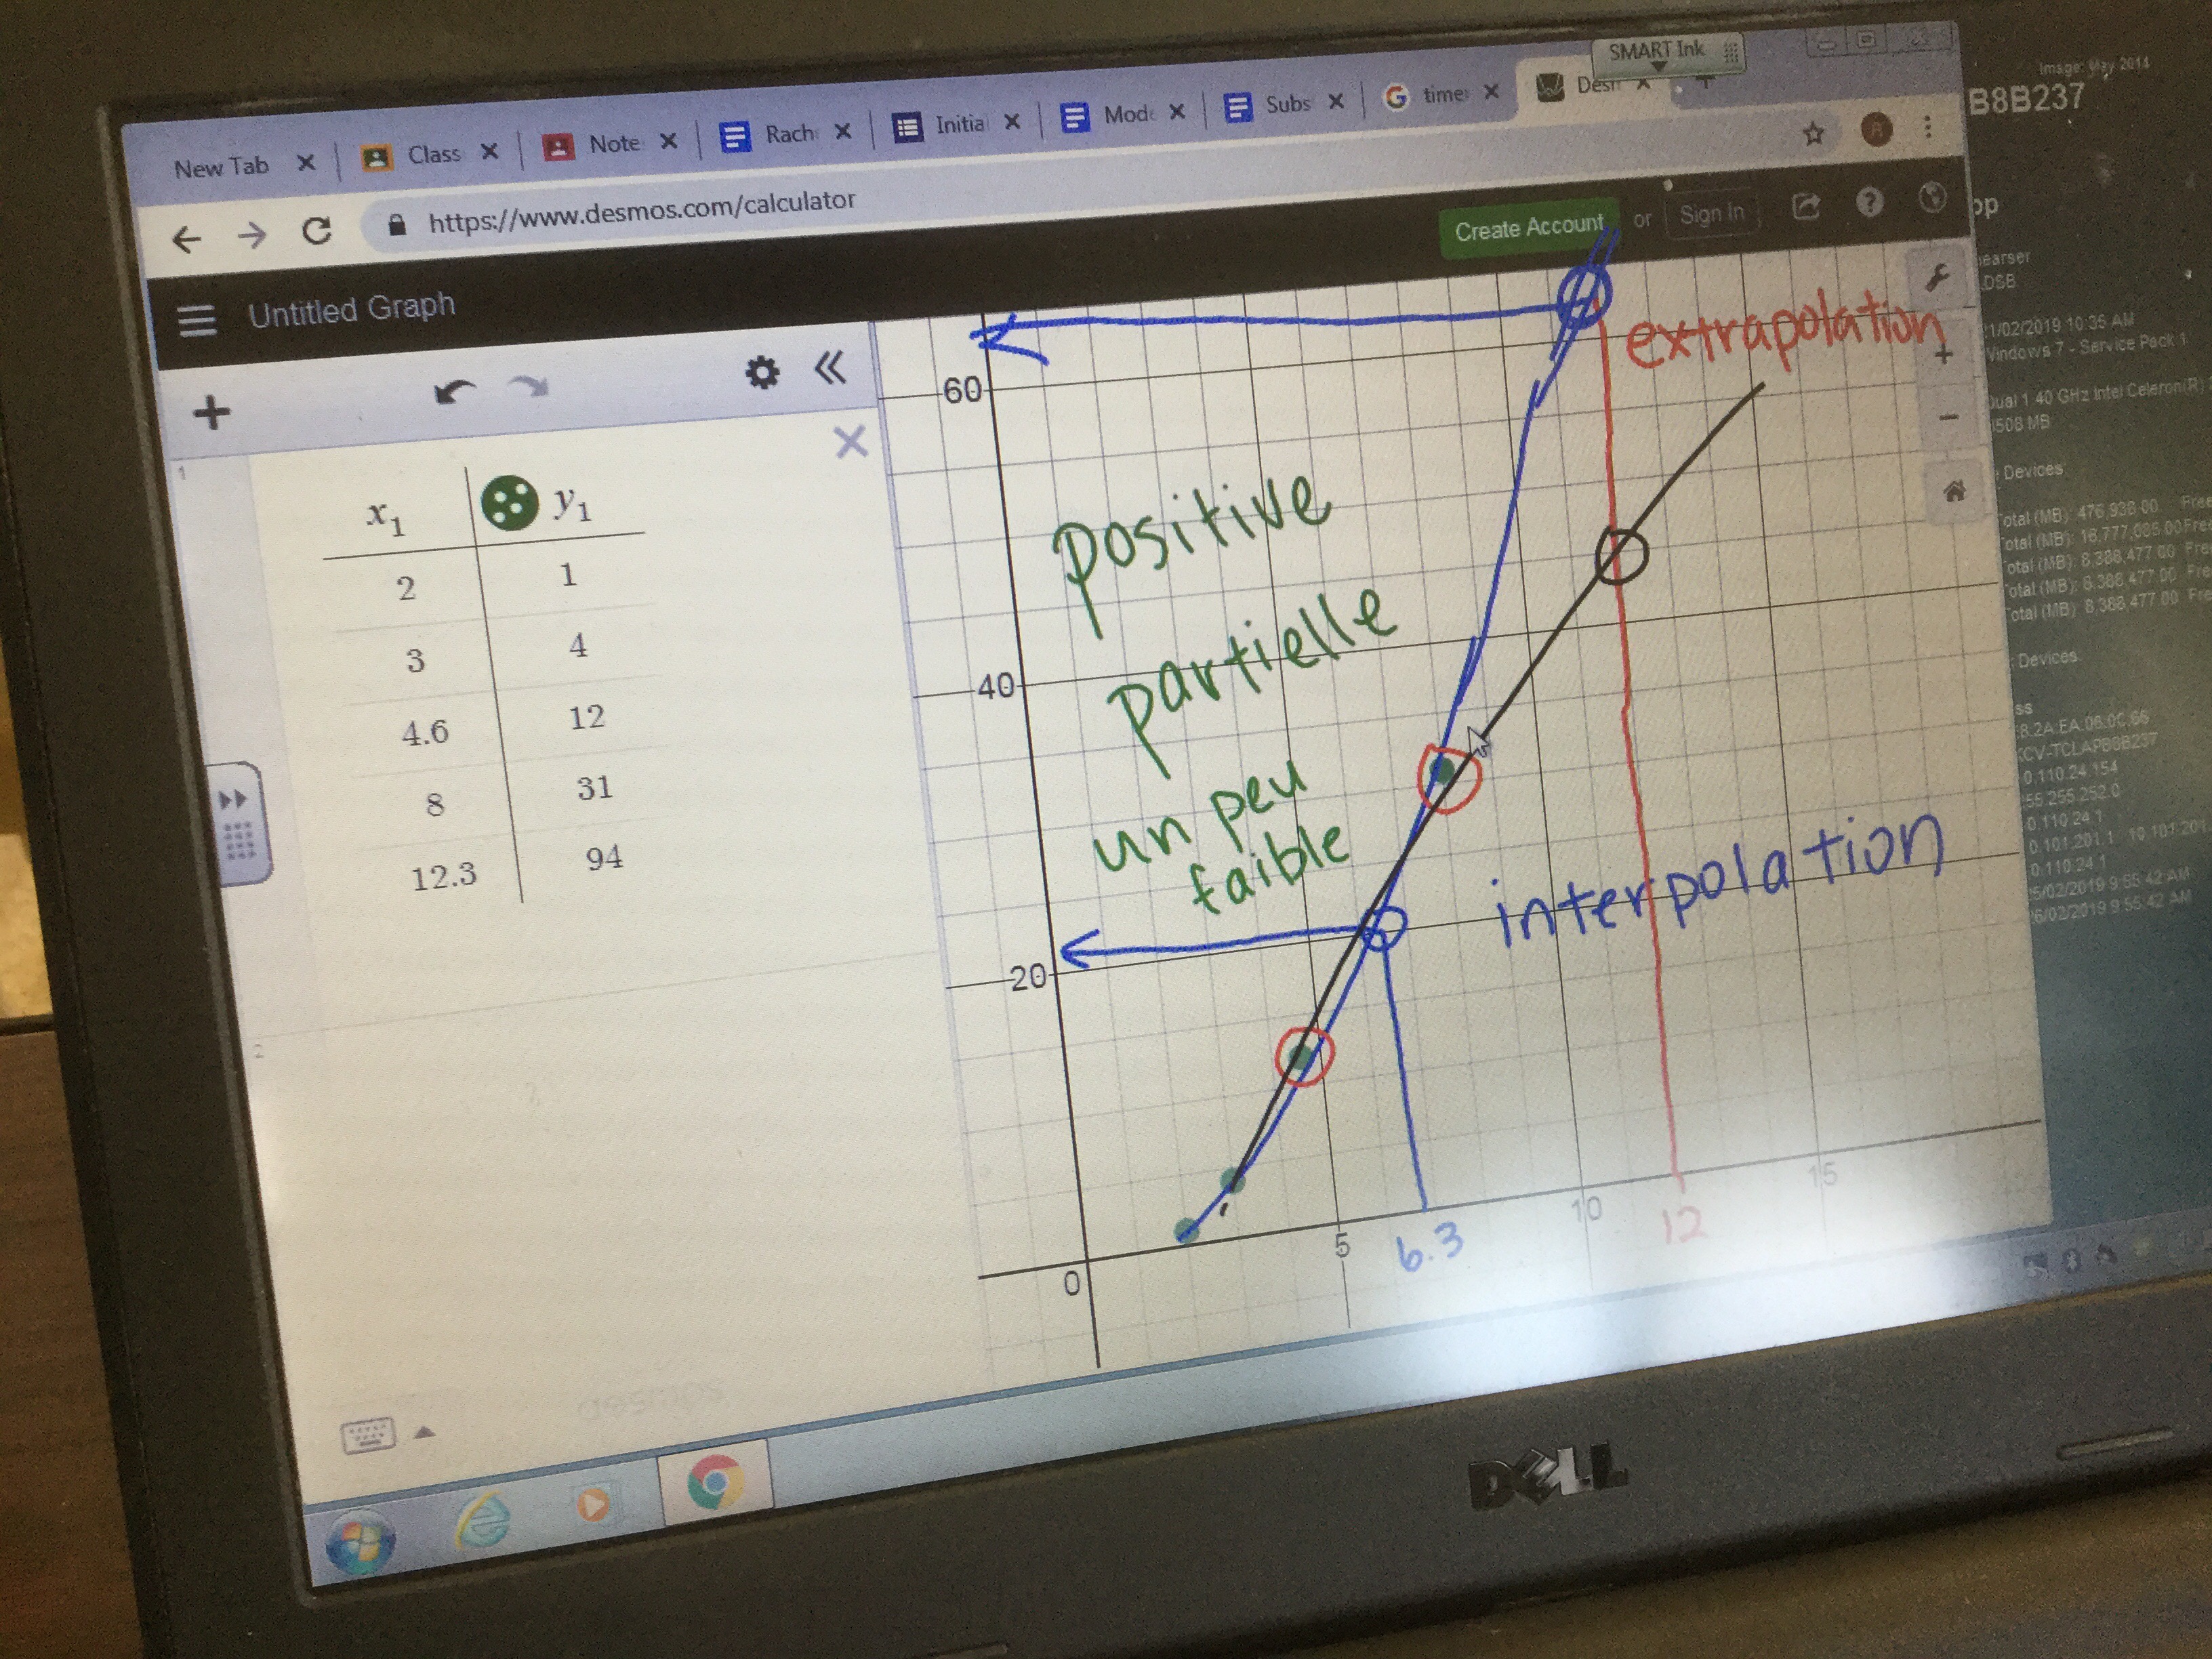
- Desmos scales the graph for you, and errors are fixed quickly.
We also learned that we can estimate within our data range with pretty good results. This is called interpolation. We had less success estimating outside our data range (extrapolation), which had to do with our choice of model and whether we used a line or curve of best fit.
We will continue to do experiments and graphs this week to get more comfortable with scatter plots.
How many cheerios fit on the circles?
Grade 9s worked hard to model the number of cheerios that could fit on a variety of circles.


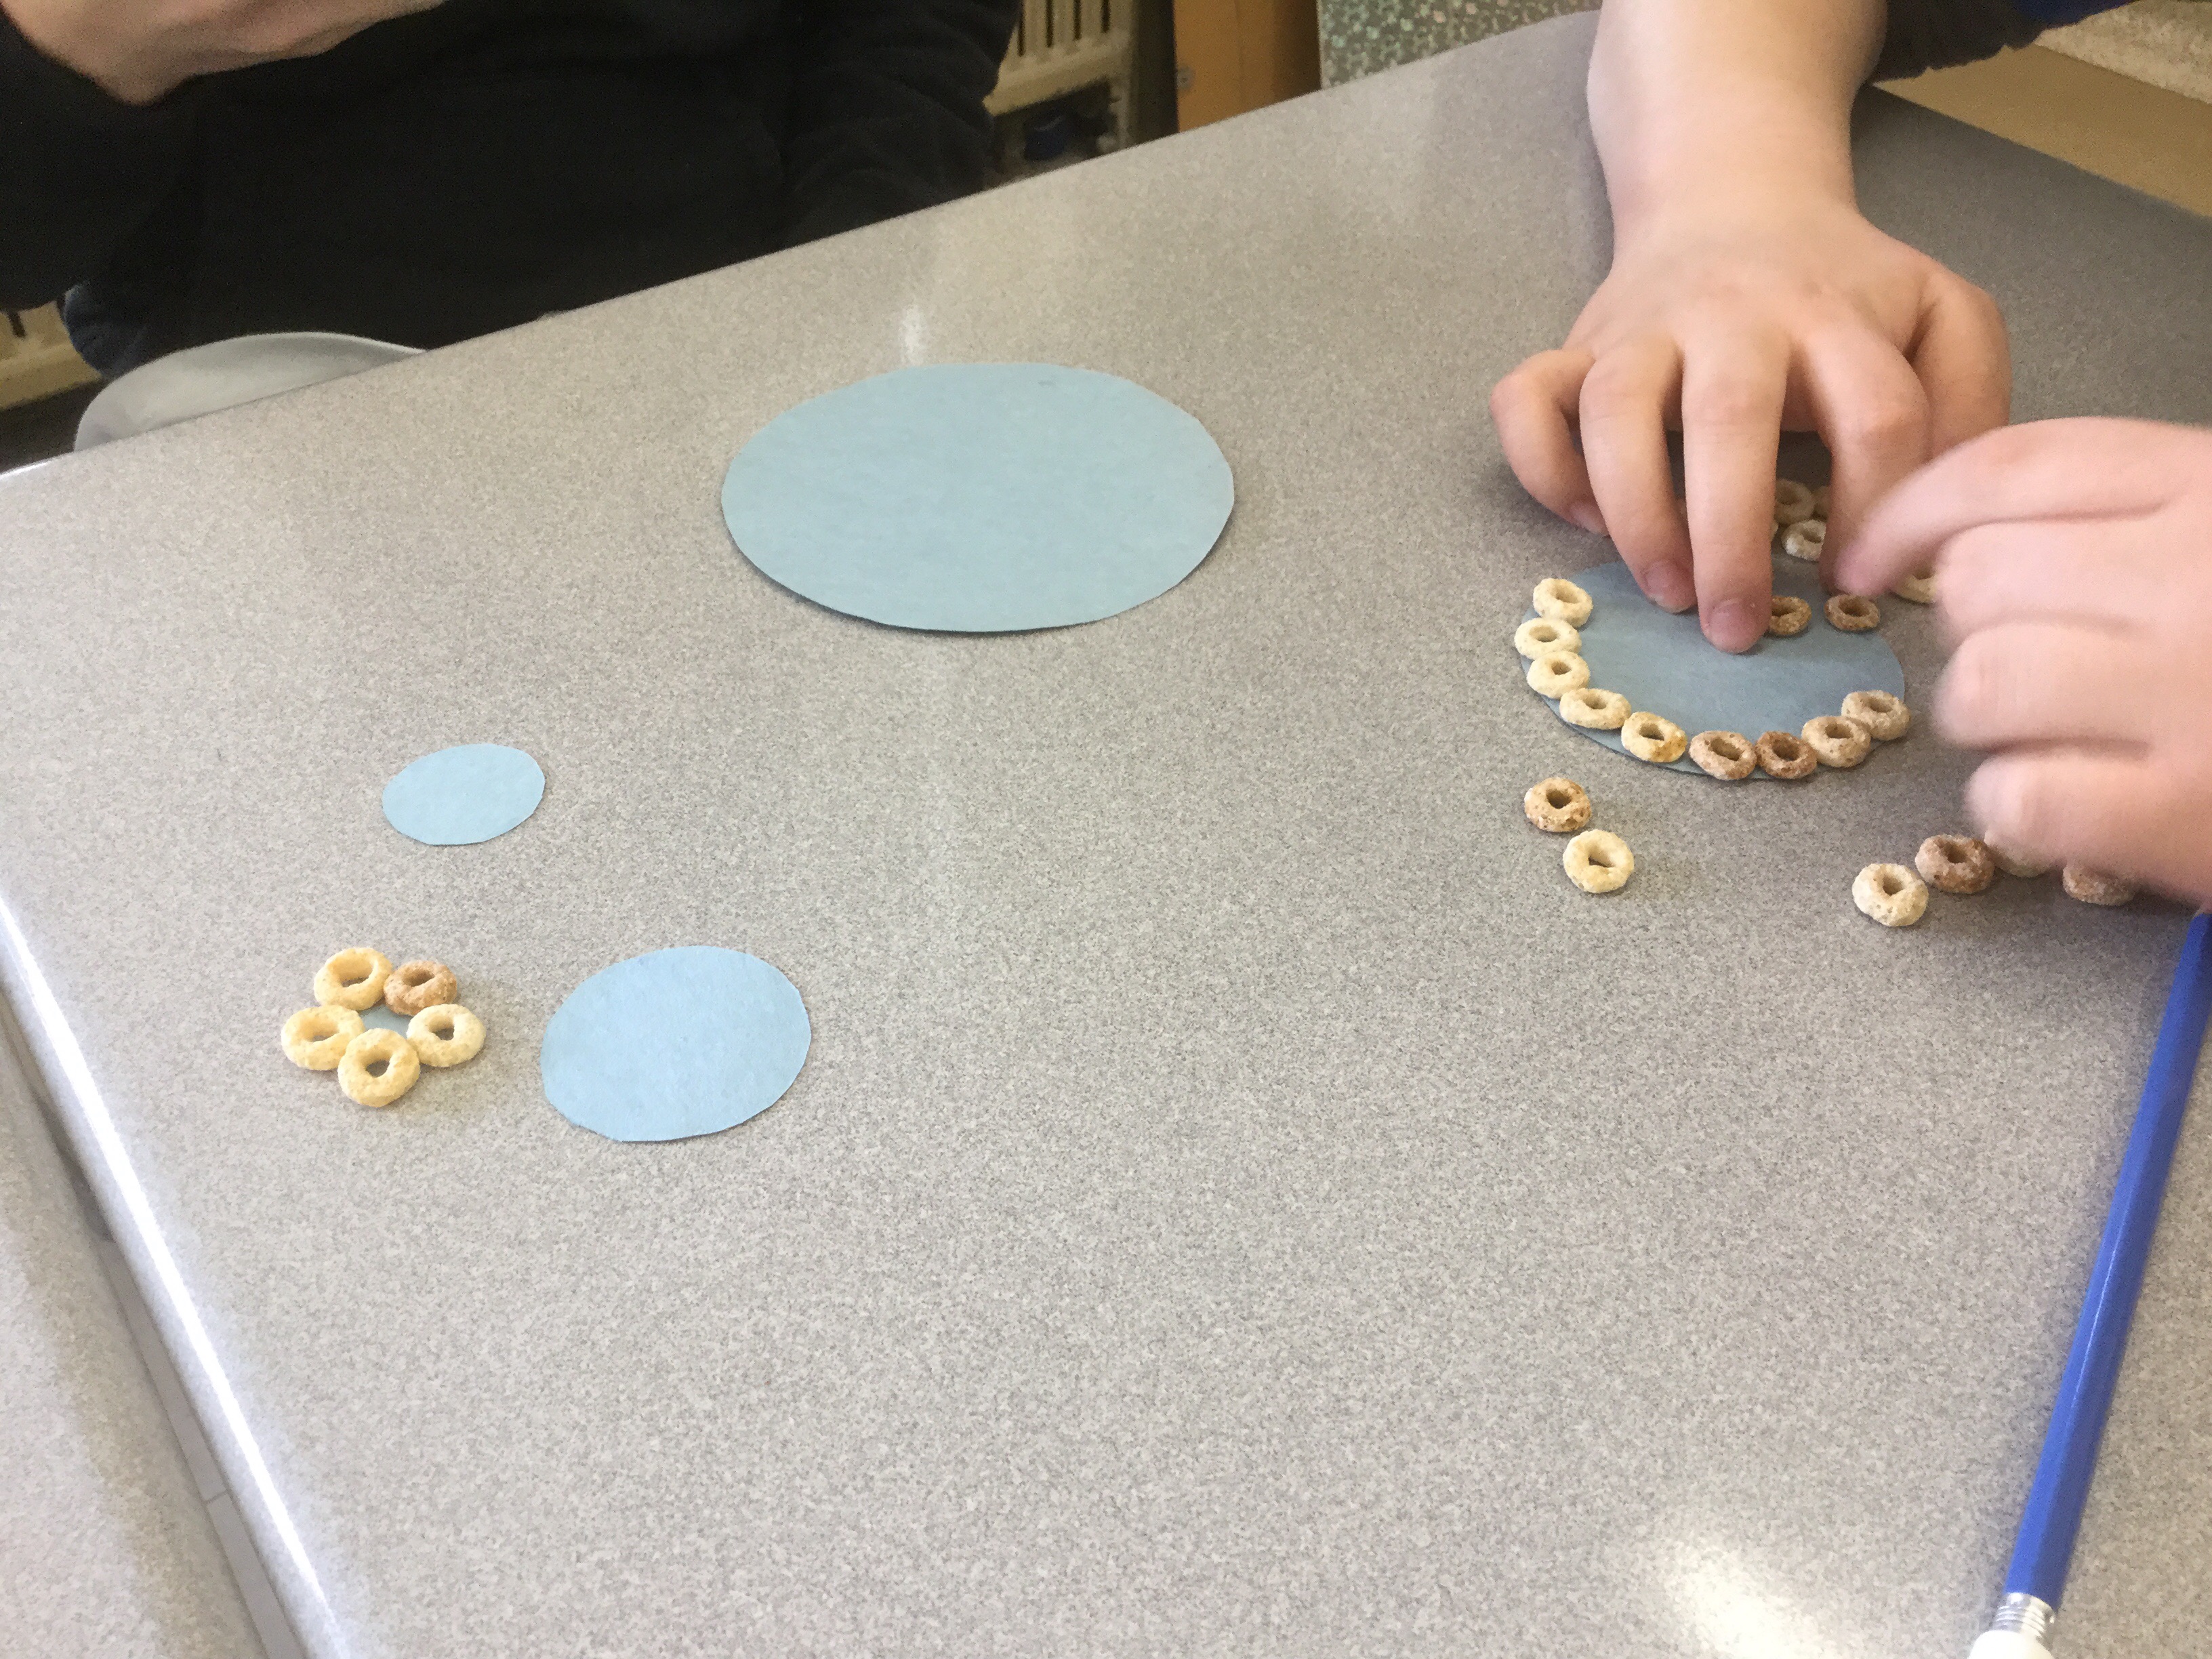
The end goal is to be able to predict how many cheerios would fit on a different circle, like a cookie tin.

We measured dimensions, decided what variables to track, and then made data tables
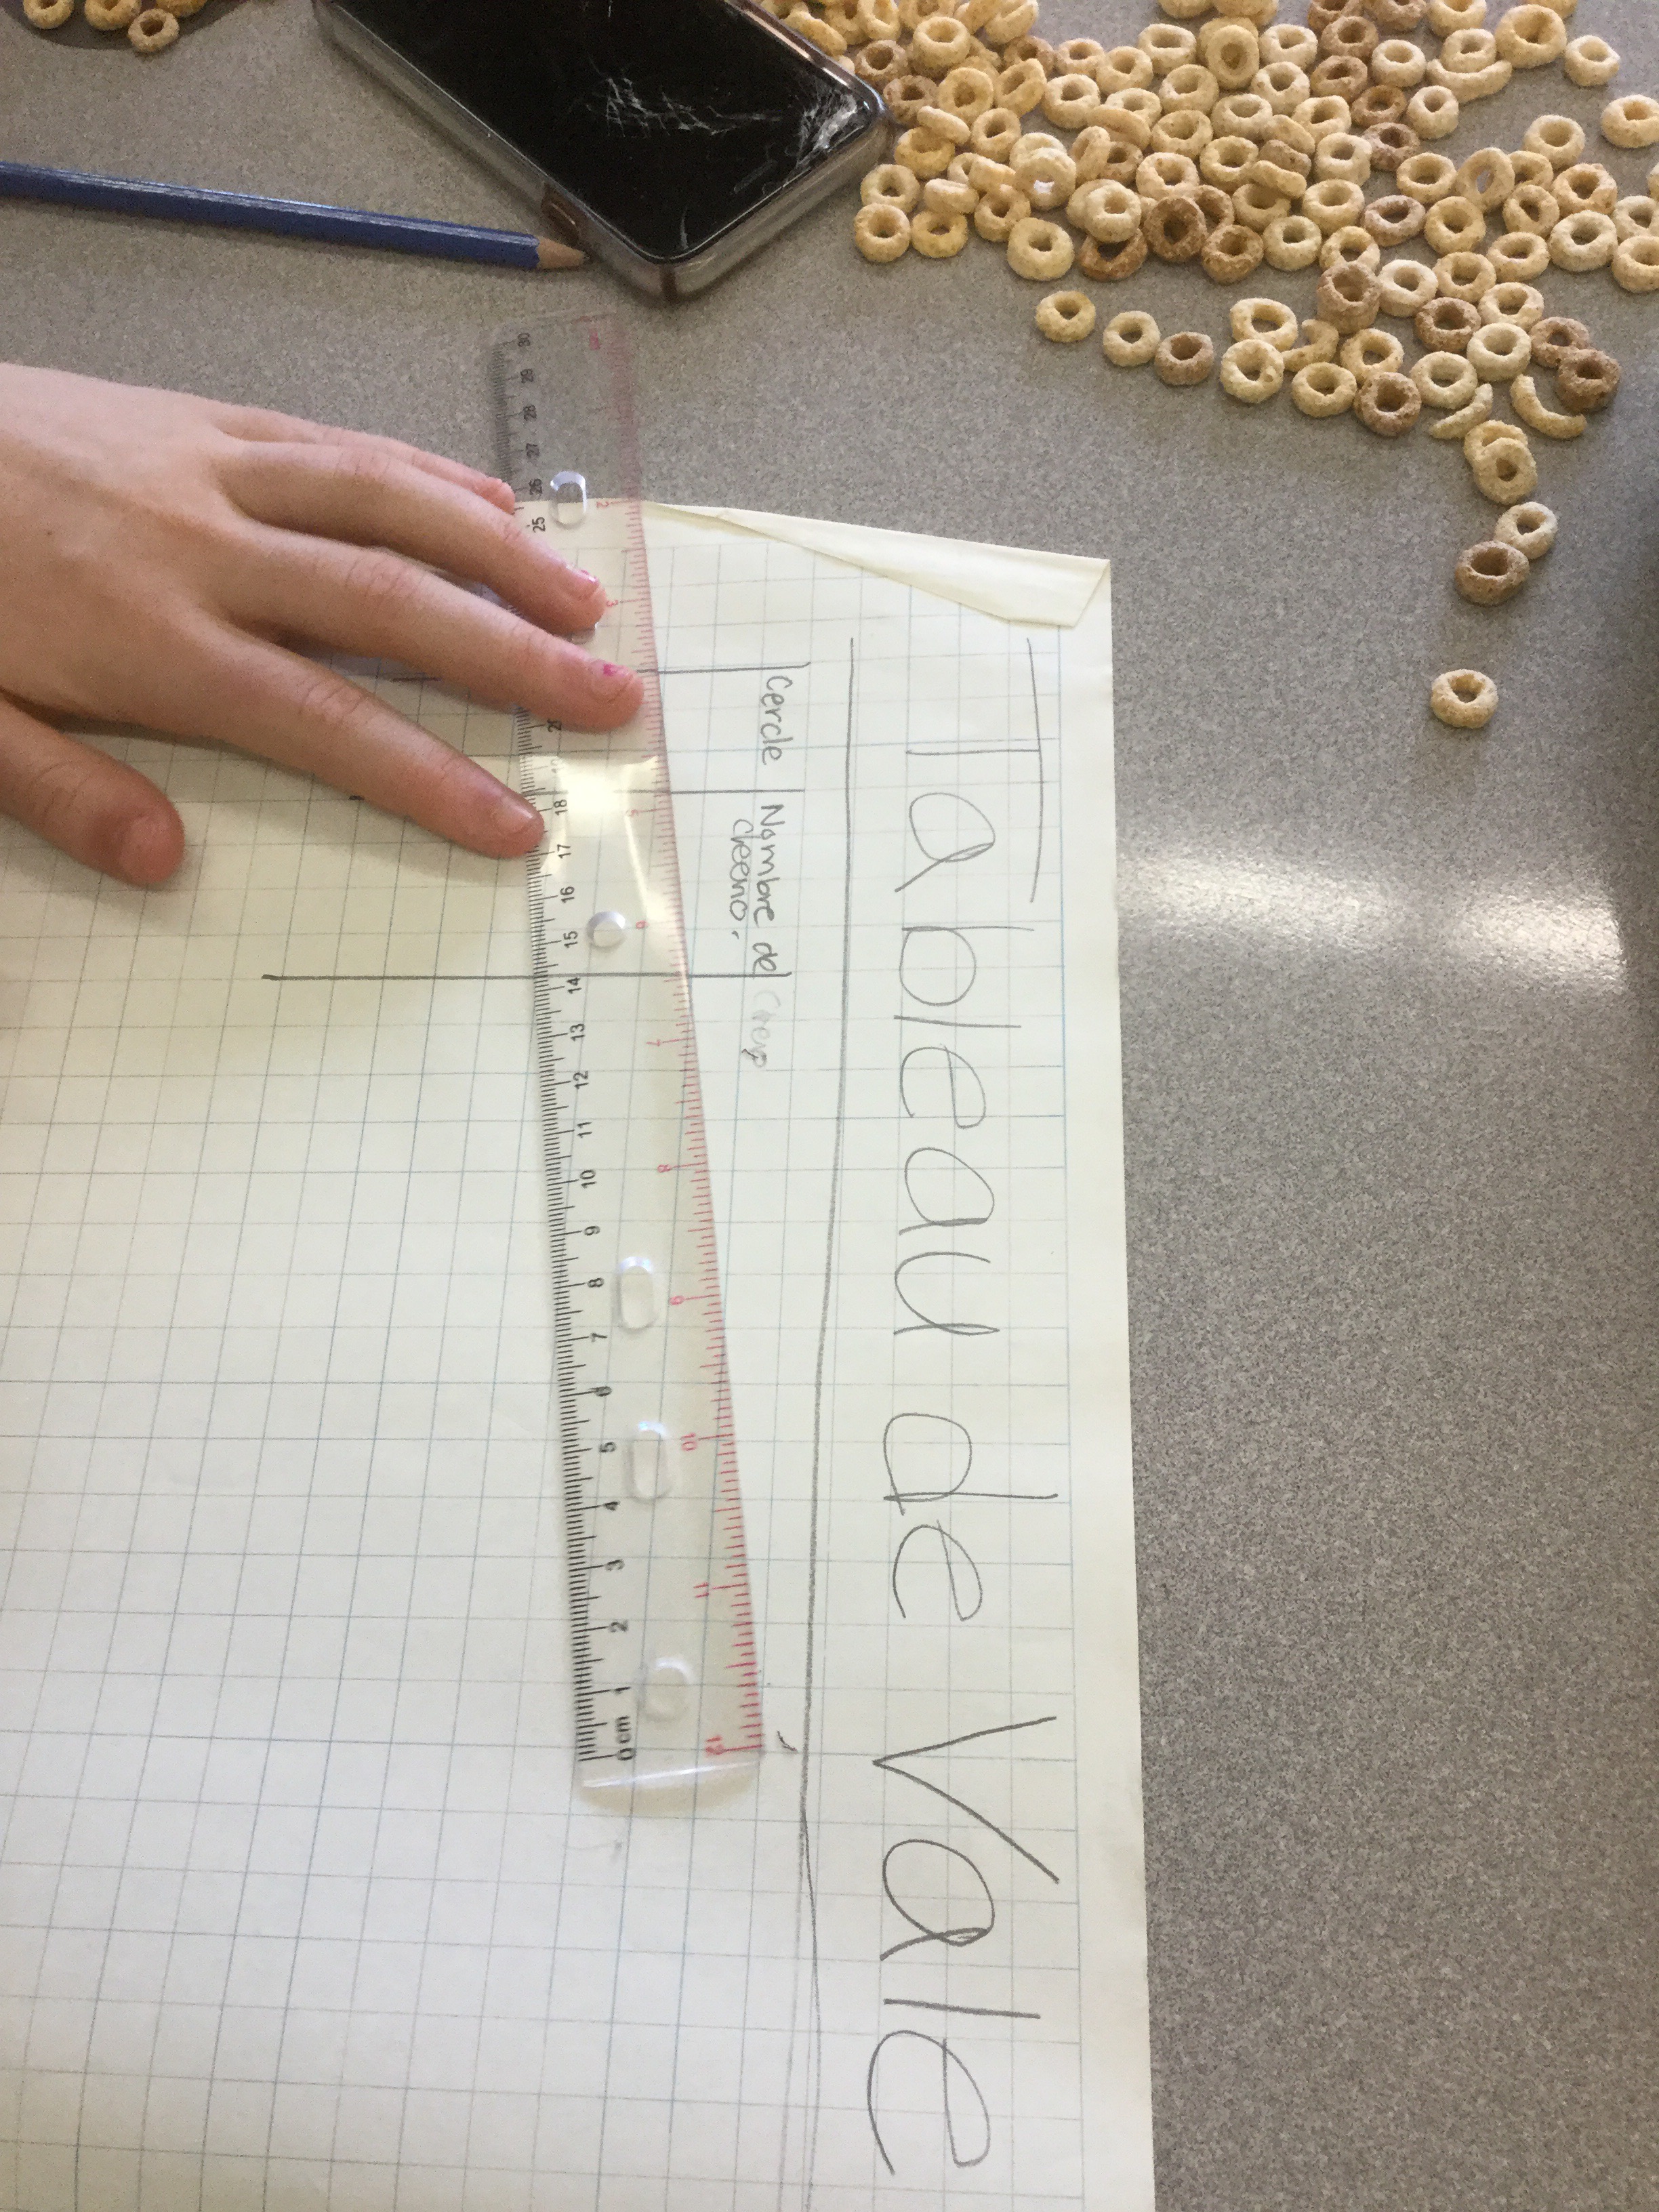
We’re making graphs to see what the trend looks like.

We’ve had estimates that the trend is positive because the numbers are getting bigger in the columns, and that it will be weak because it’s hard to know exactly how many cheerios will fit on a circle, and because cheerios are of varying sizes. We’ll see tomorrow how it turns out.
Grade 12 Loose ends
We have gone over many topics about functions and are heading toward calculation of average and instantaneous rate of change.
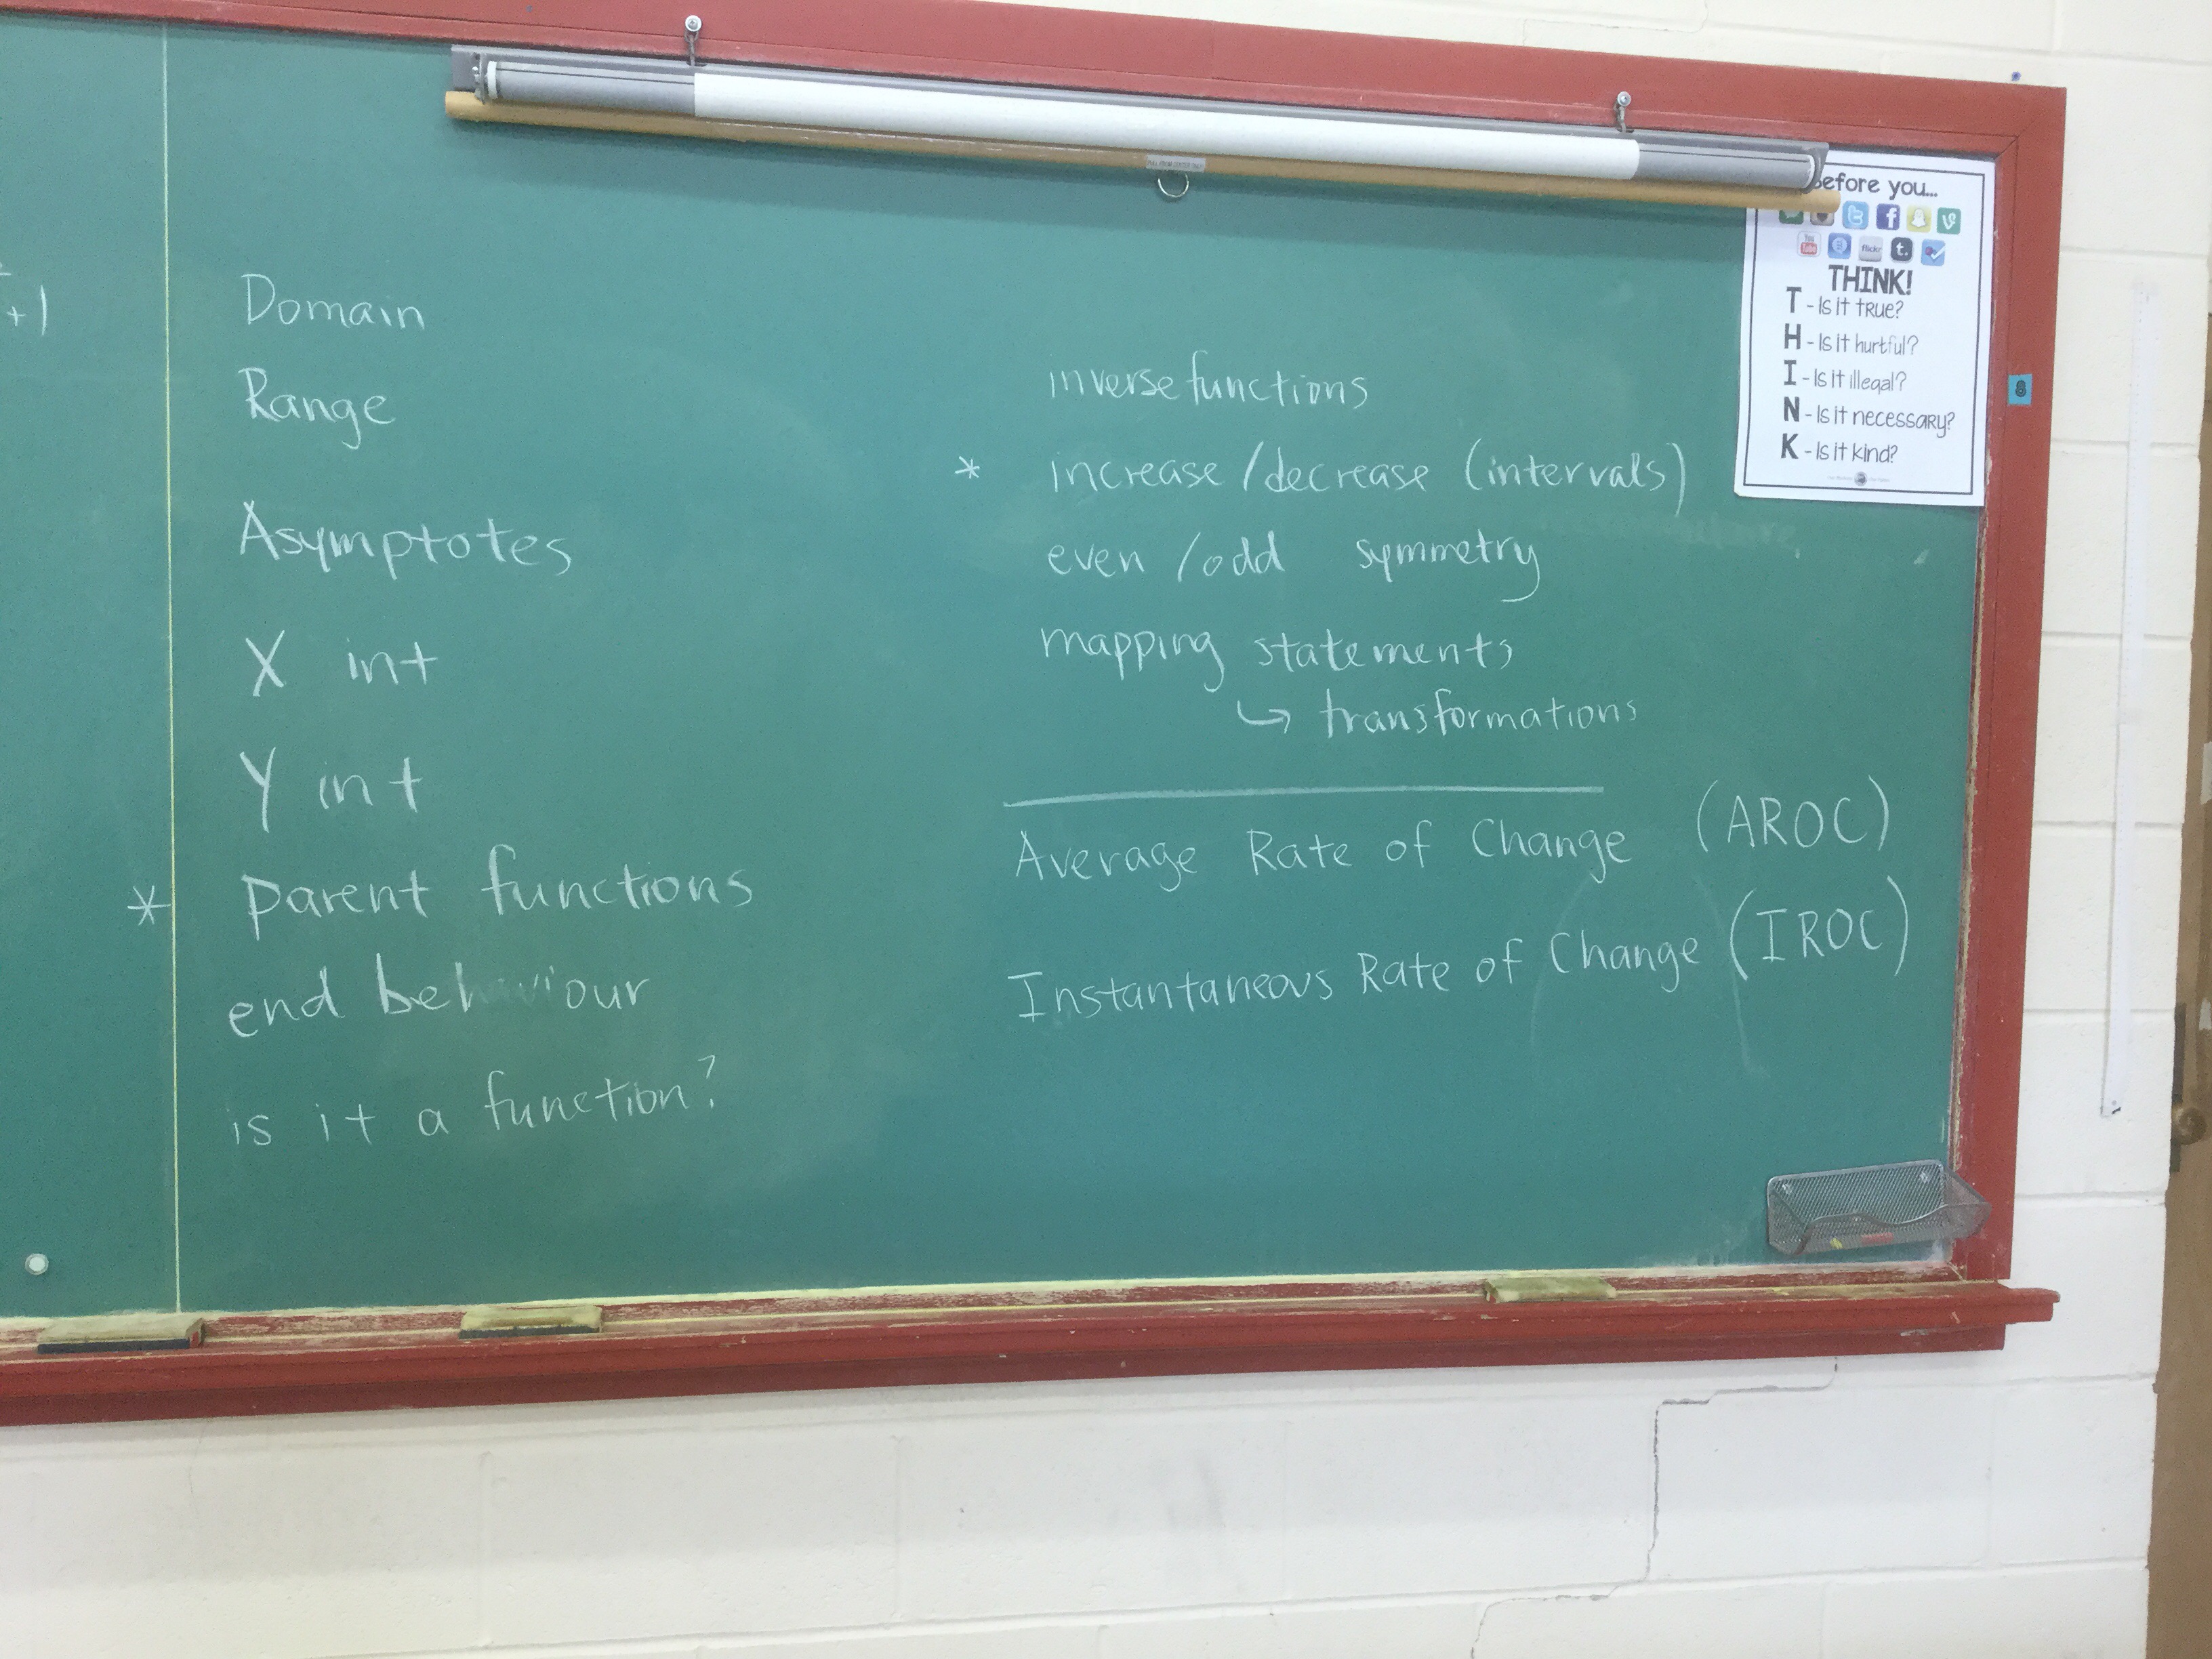
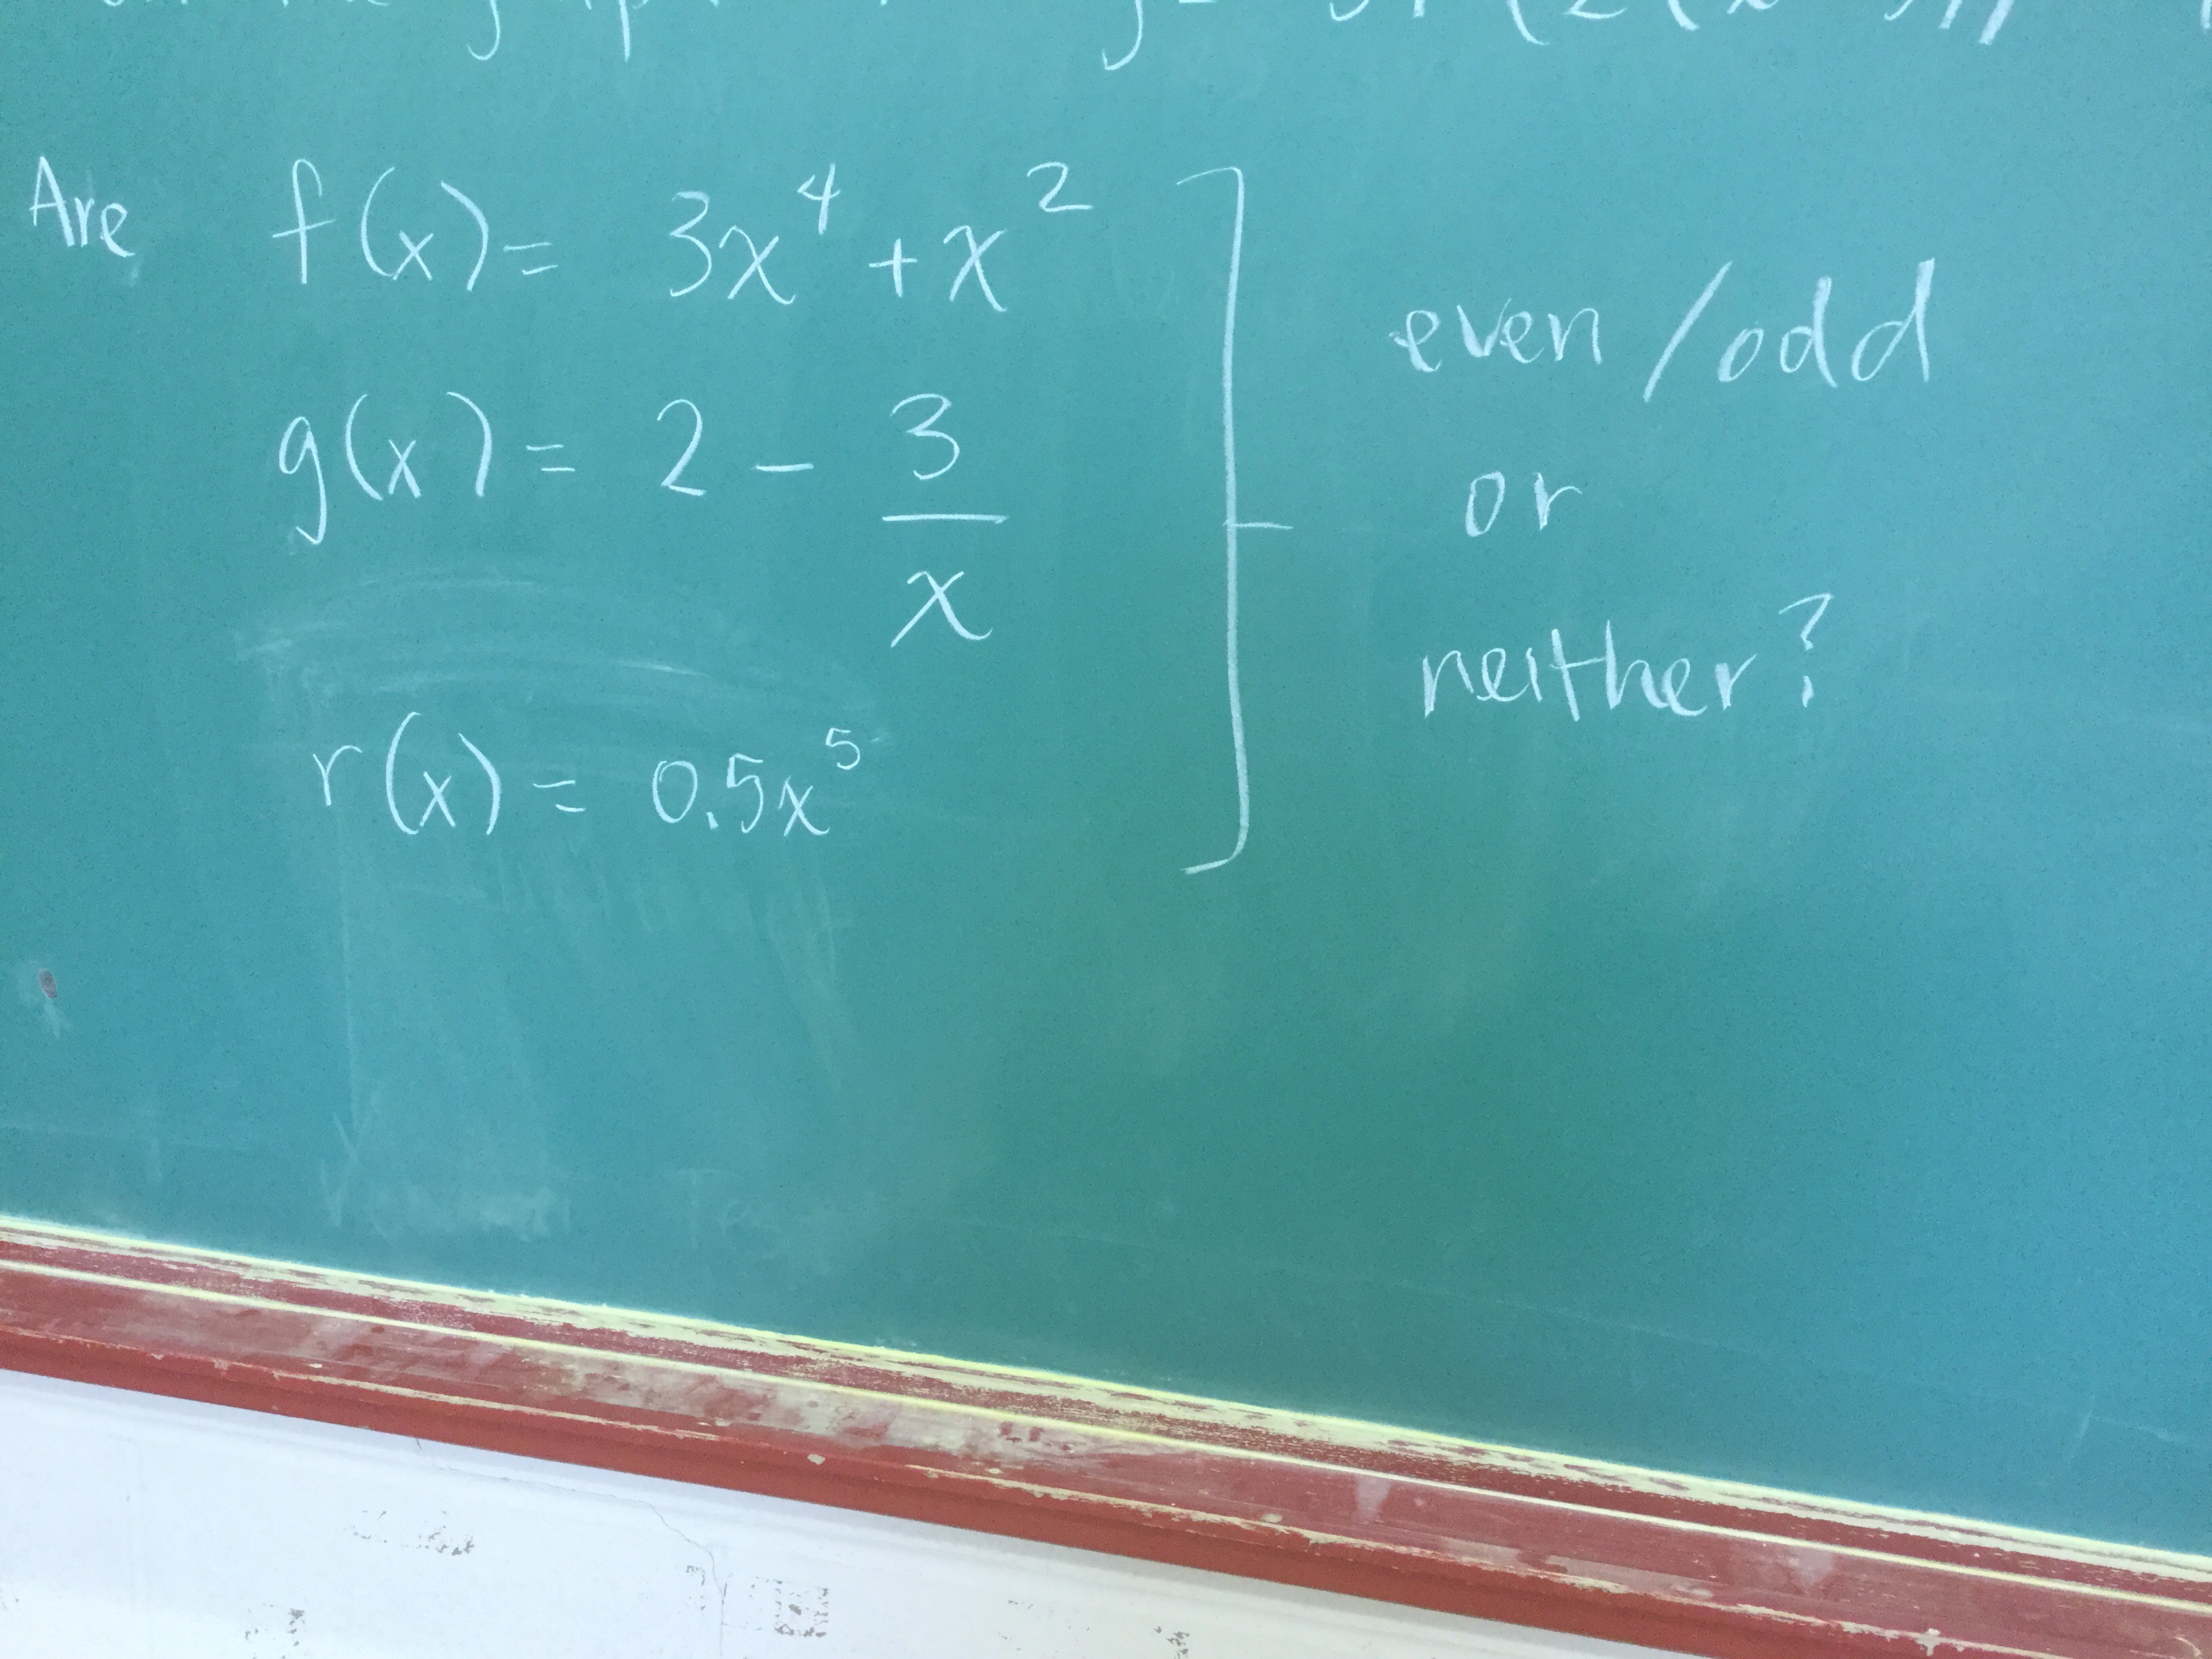
We looked at functions and determined with algebra if they are even or odd.

We also looked at inverses to be sure we understood how to calculate them and interpret our answers.

Here’s a sketch of the function and its inverse relation (which is not a function).

And here’s the algebra:swap x and y and isolate y.

When looking for the inverse at 13 we get proof that it is not a function since we get two outputs.

And the inverse at -3 doesn’t exist (no real value), because we cant take square roots of negative numbers, which makes sense when you look at the graph, because there are no points on the graph of the inverse that correspond to x=-3.

Angst in grade 10
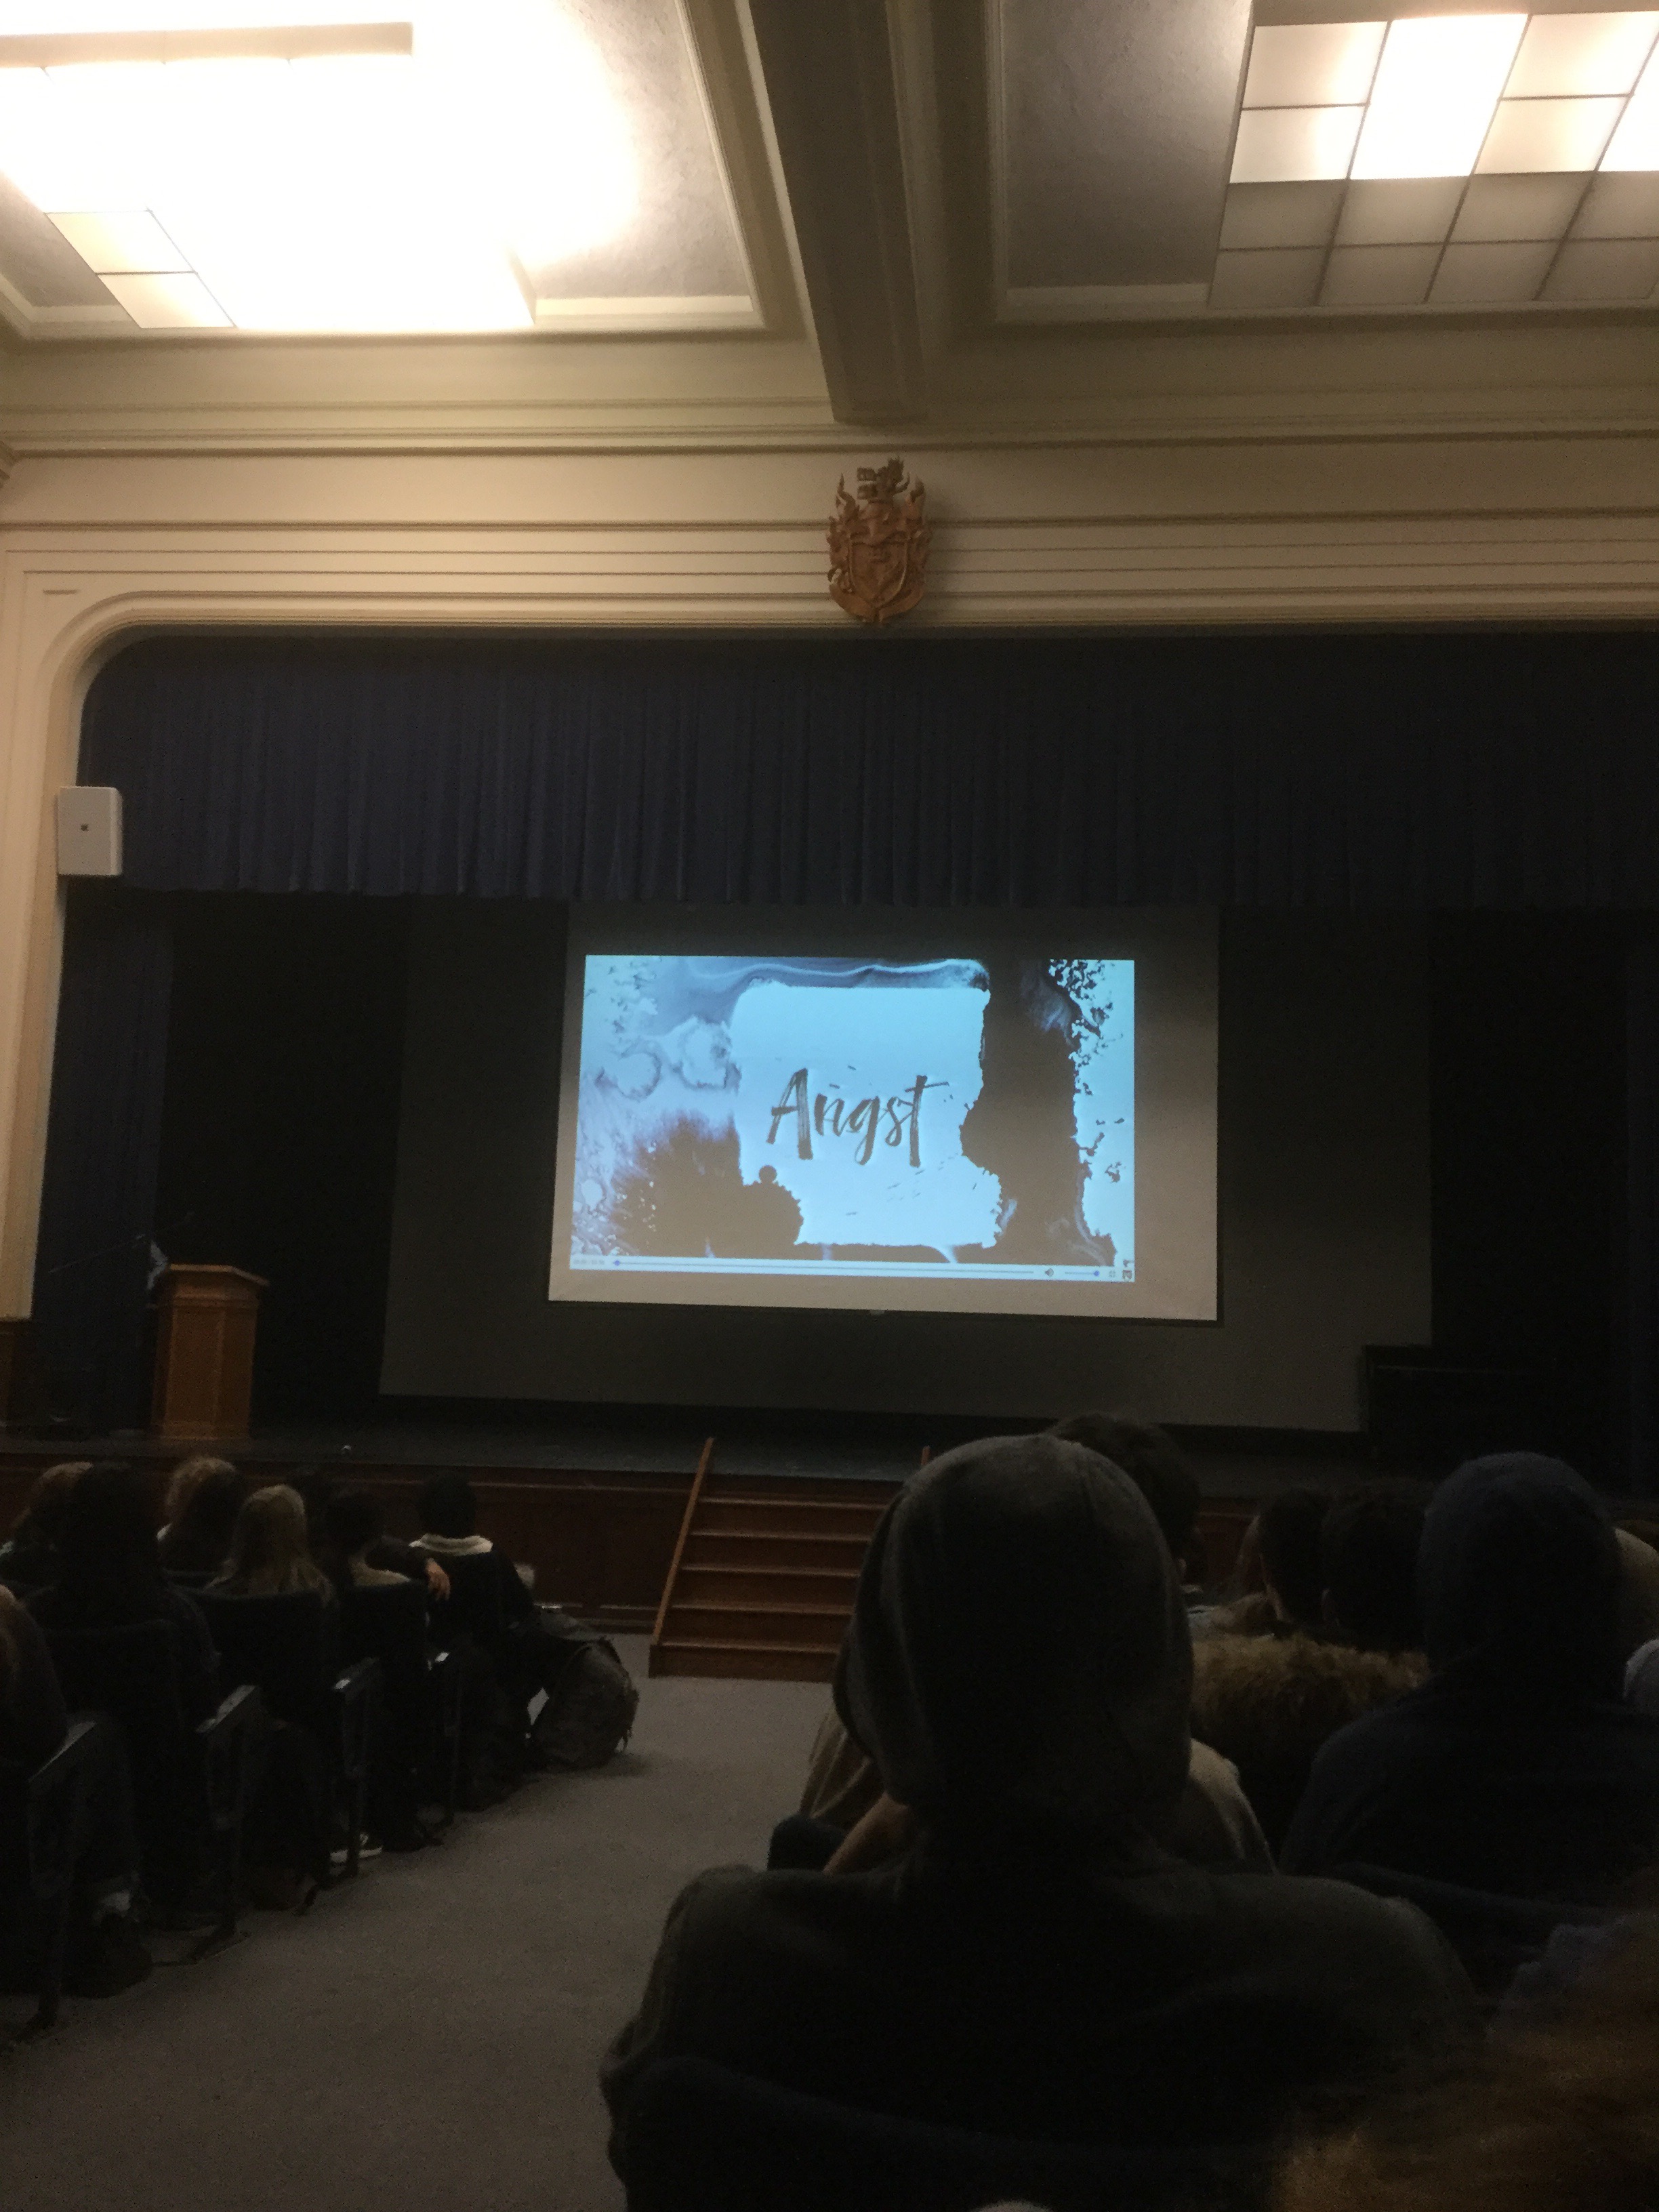 We watched a powerful documentary today about anxiety and how to ask for help. We’ll be back to the regular math swing of things tomorrow.
Building Prisms in grade 9
We had the task of building rectangular prisms wih a volume of 300 cubic centimeters.
We made plans and determined dimensions. Some chose square bases, and others did not.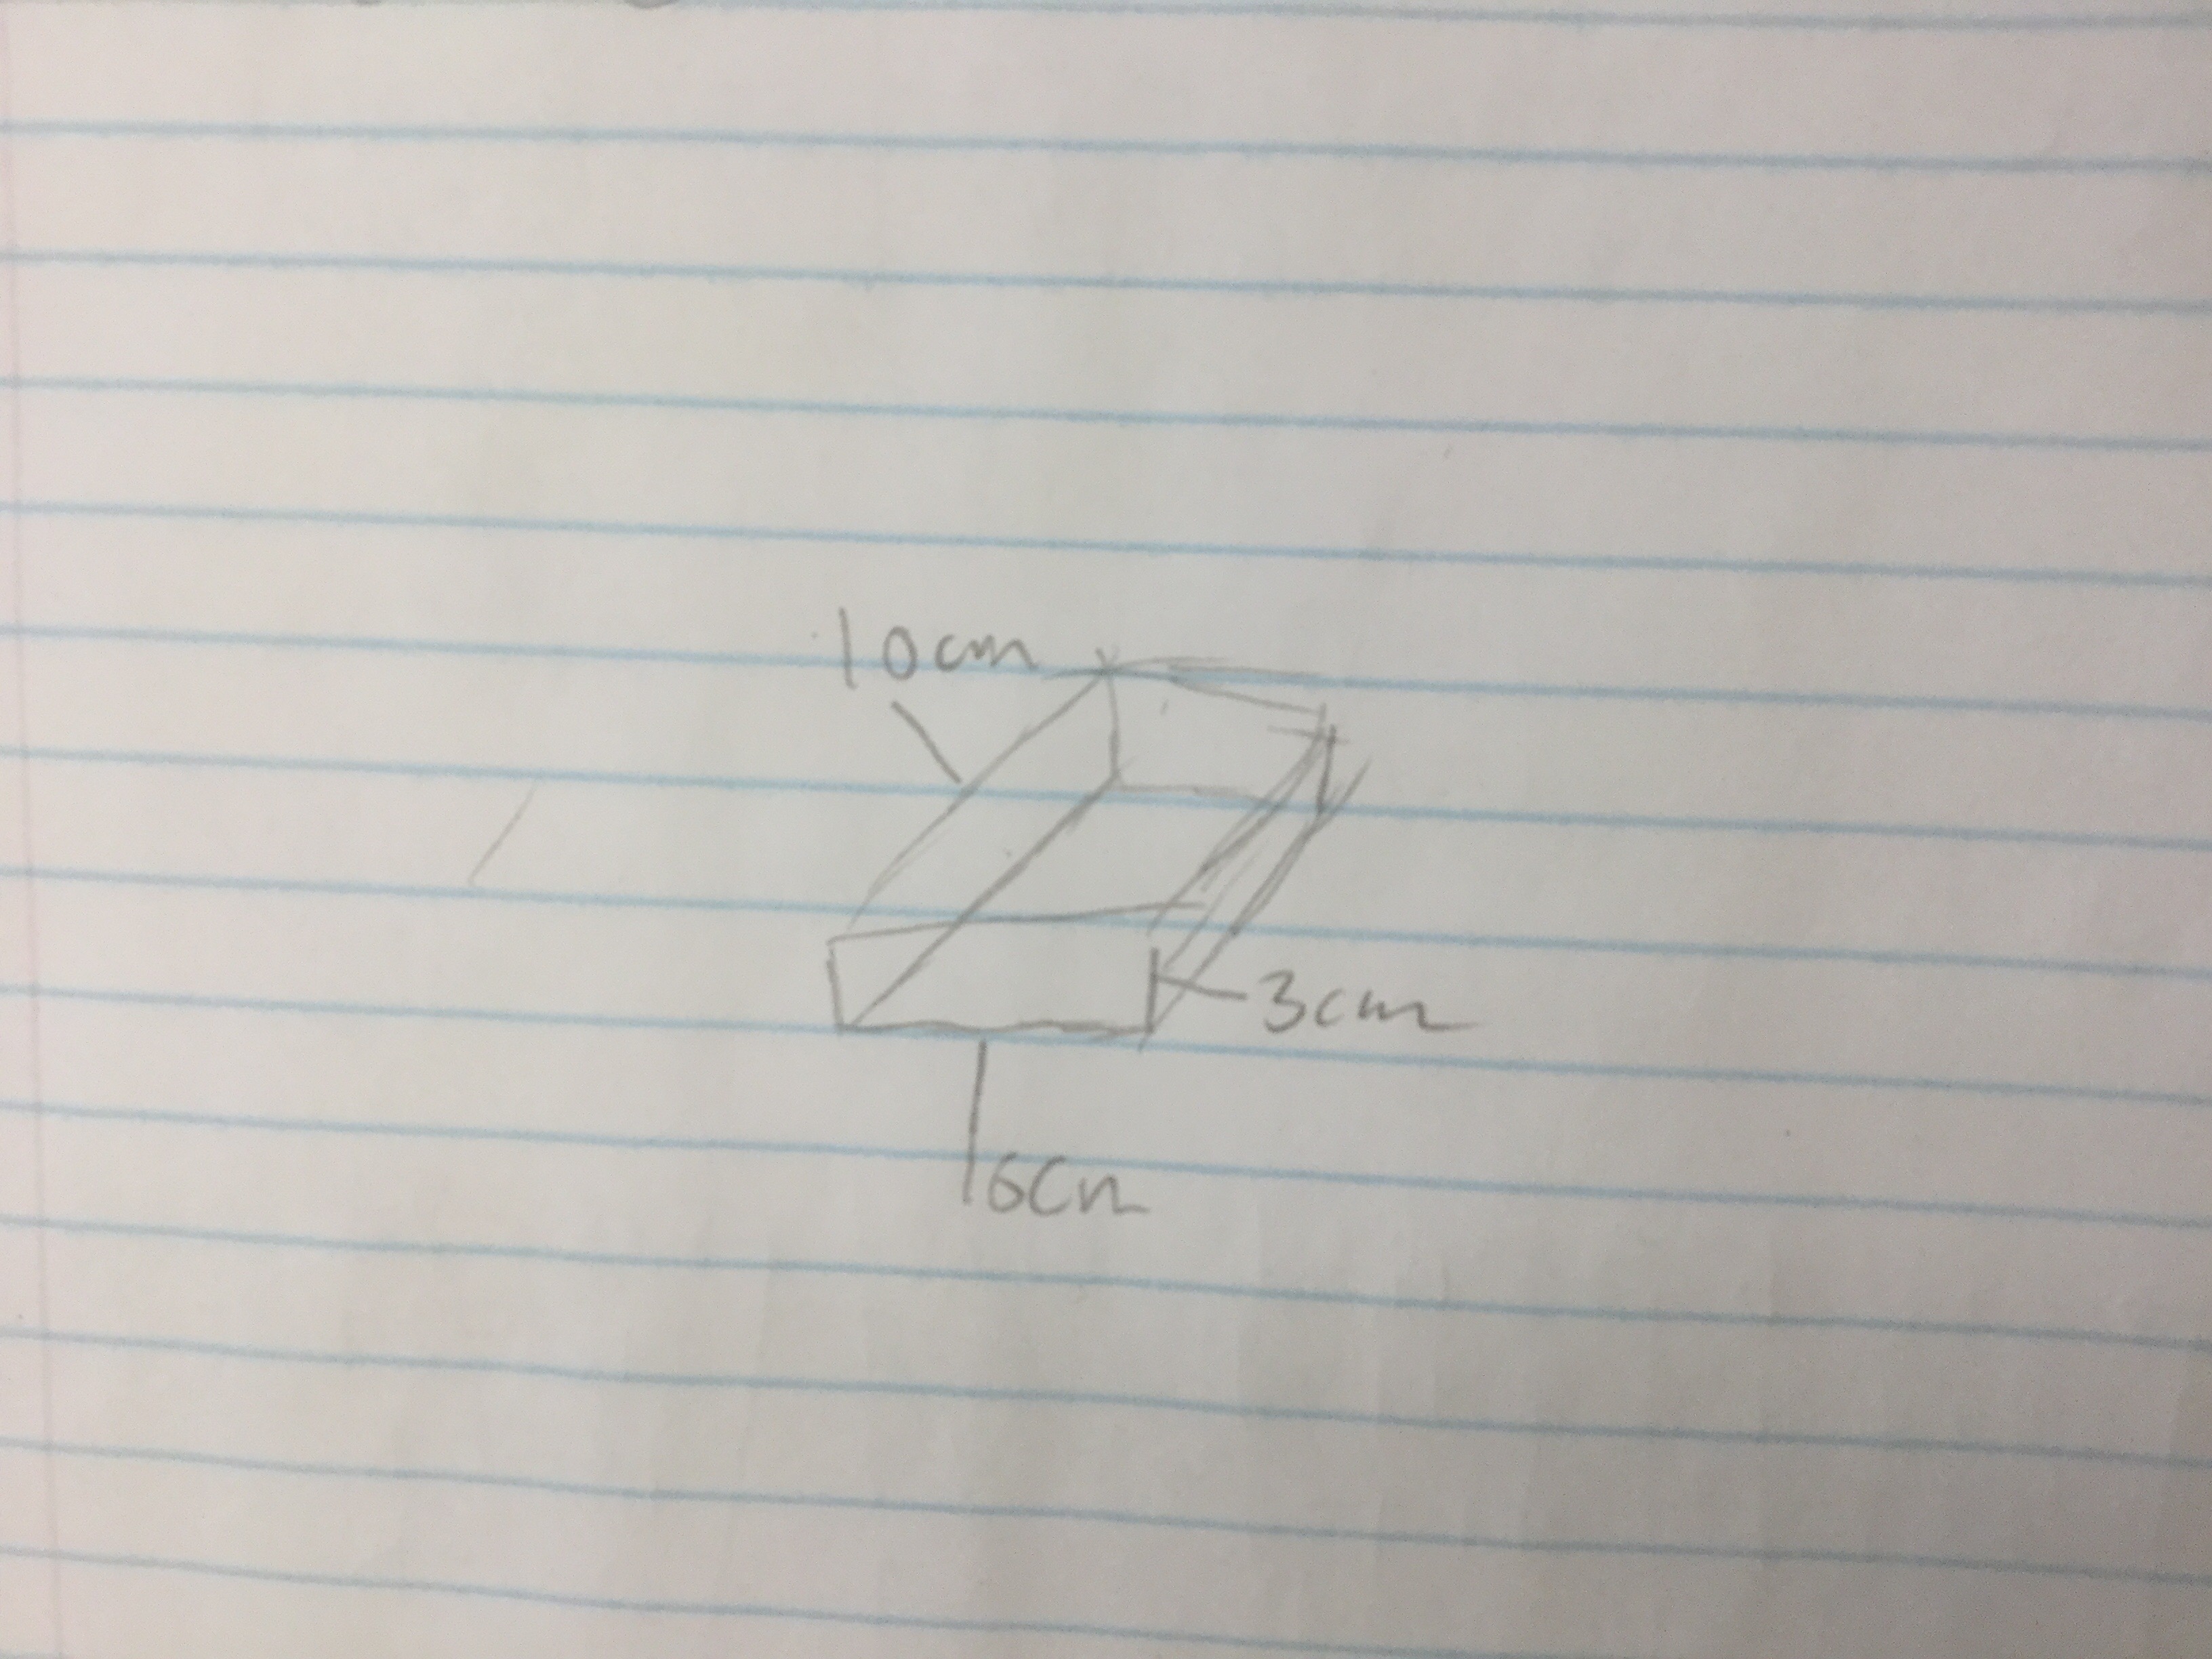
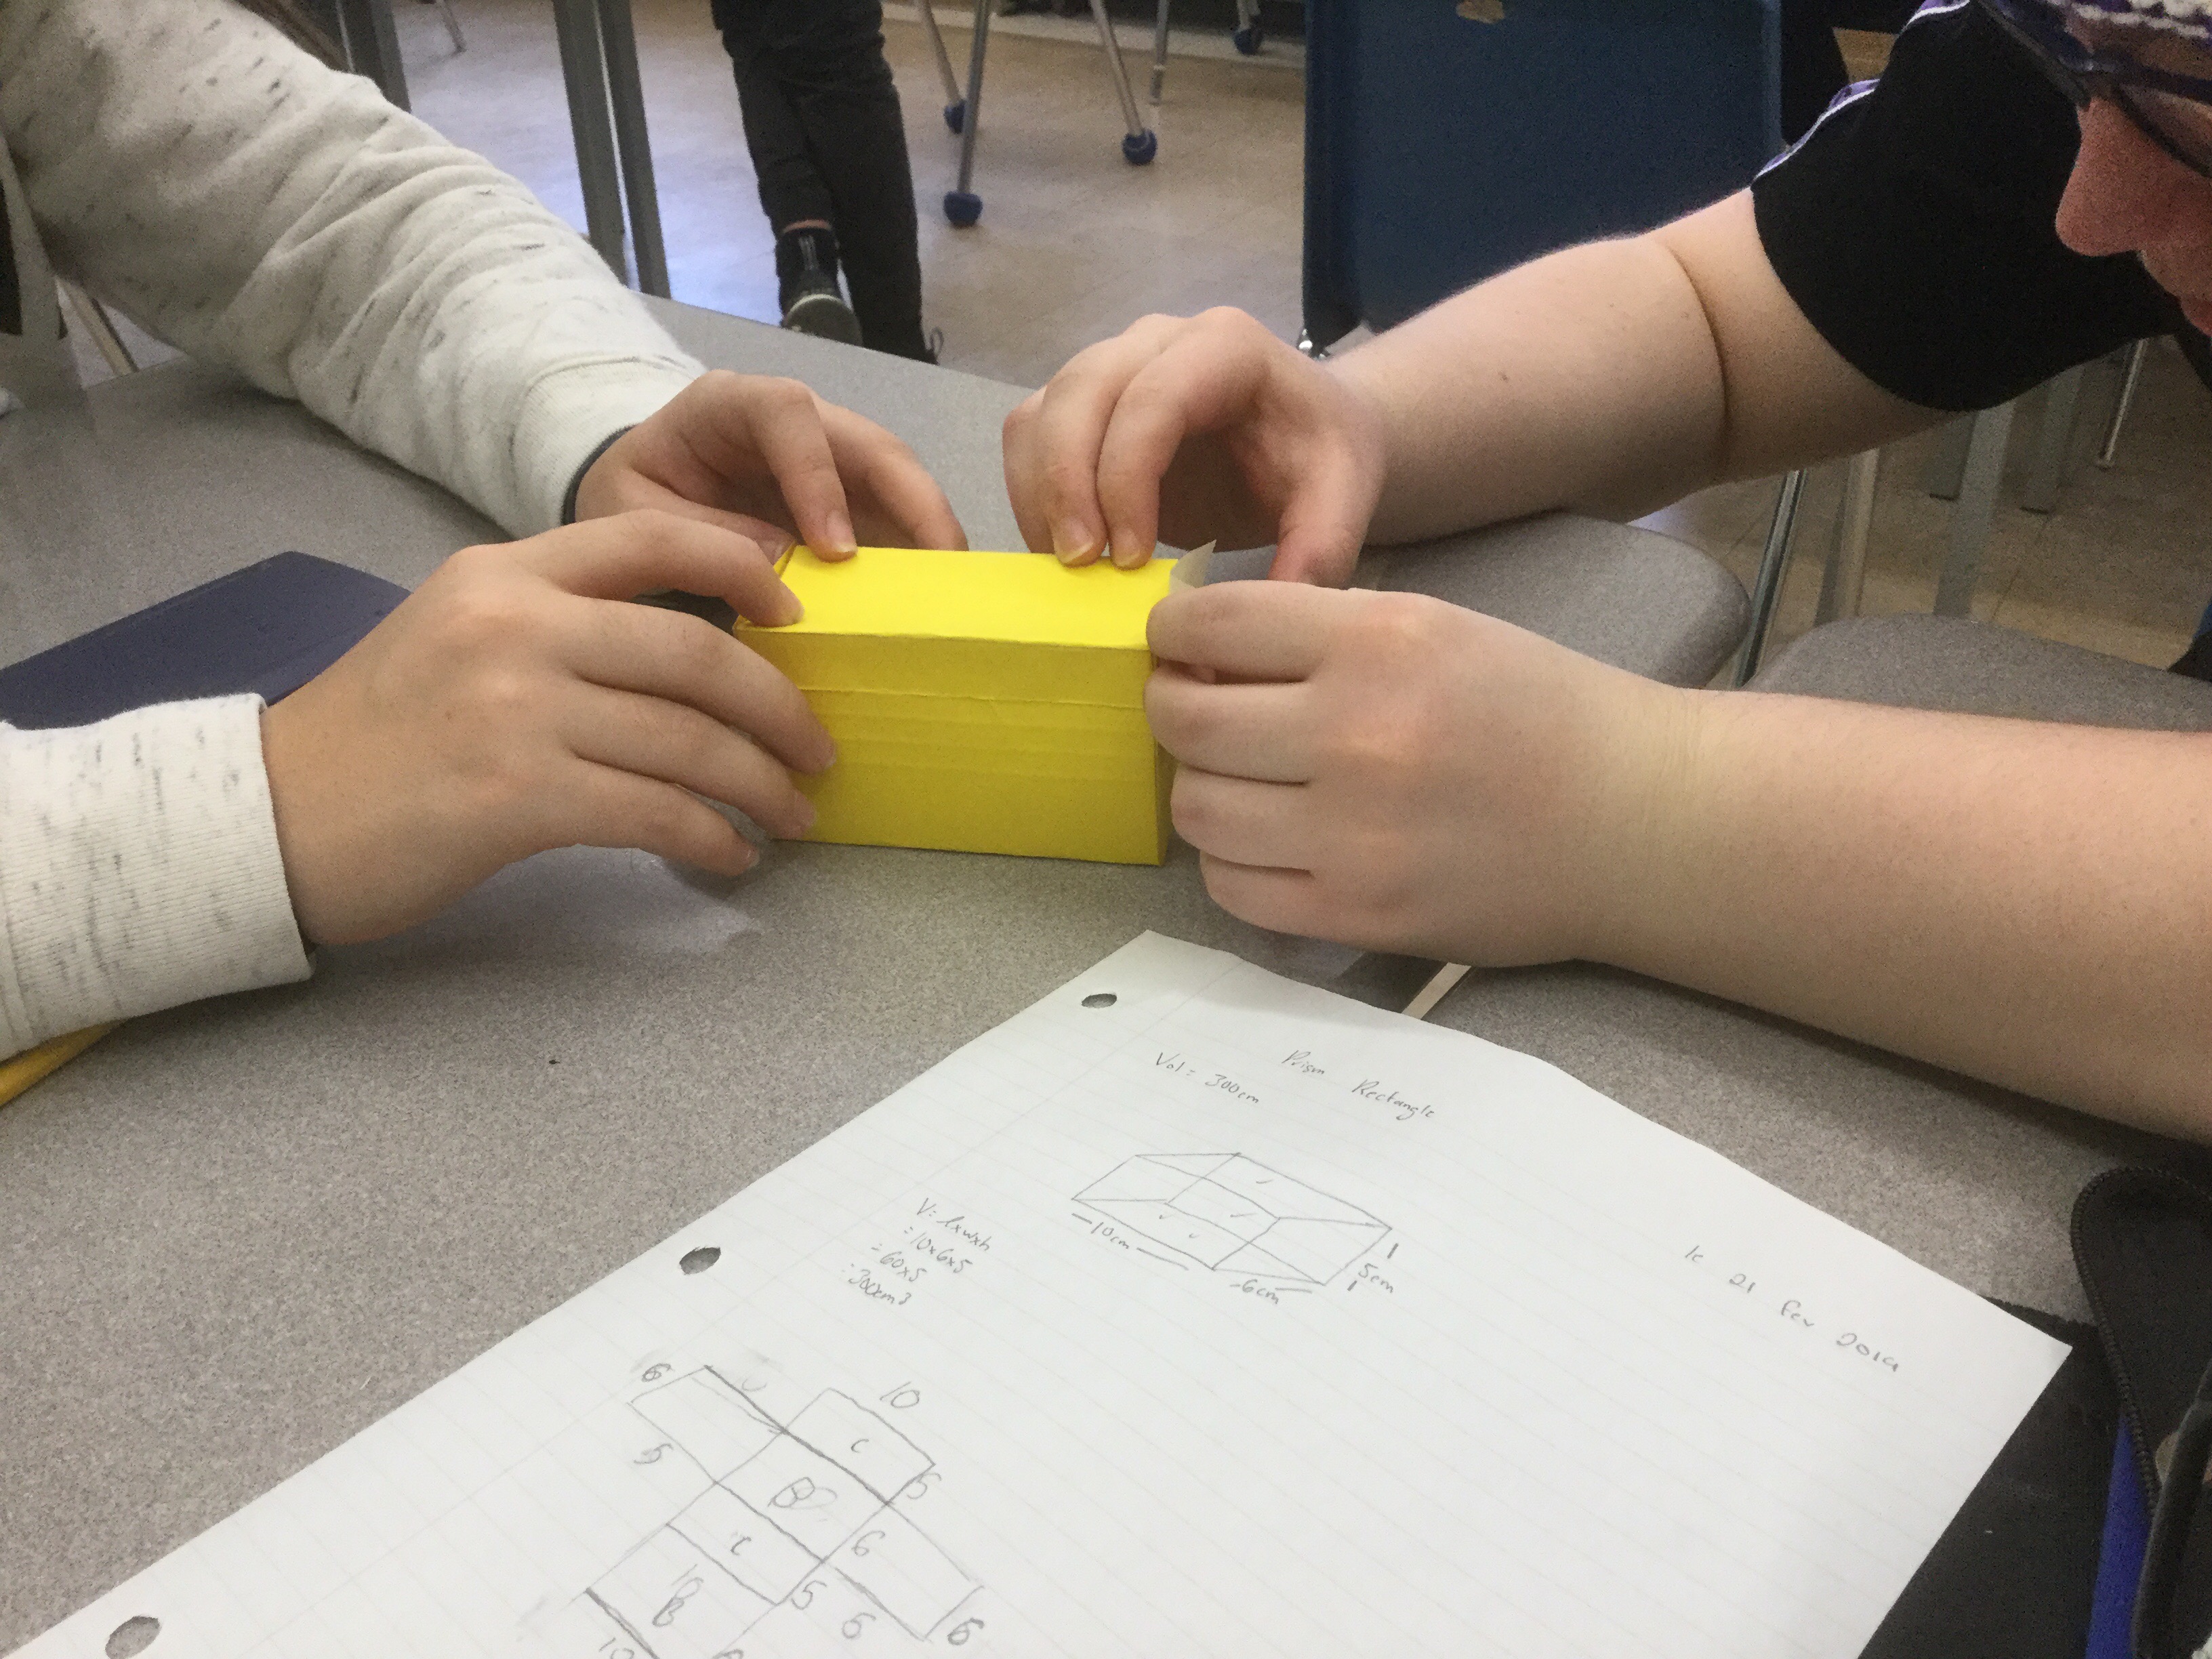
Some cut out all their pieces and then taped them…
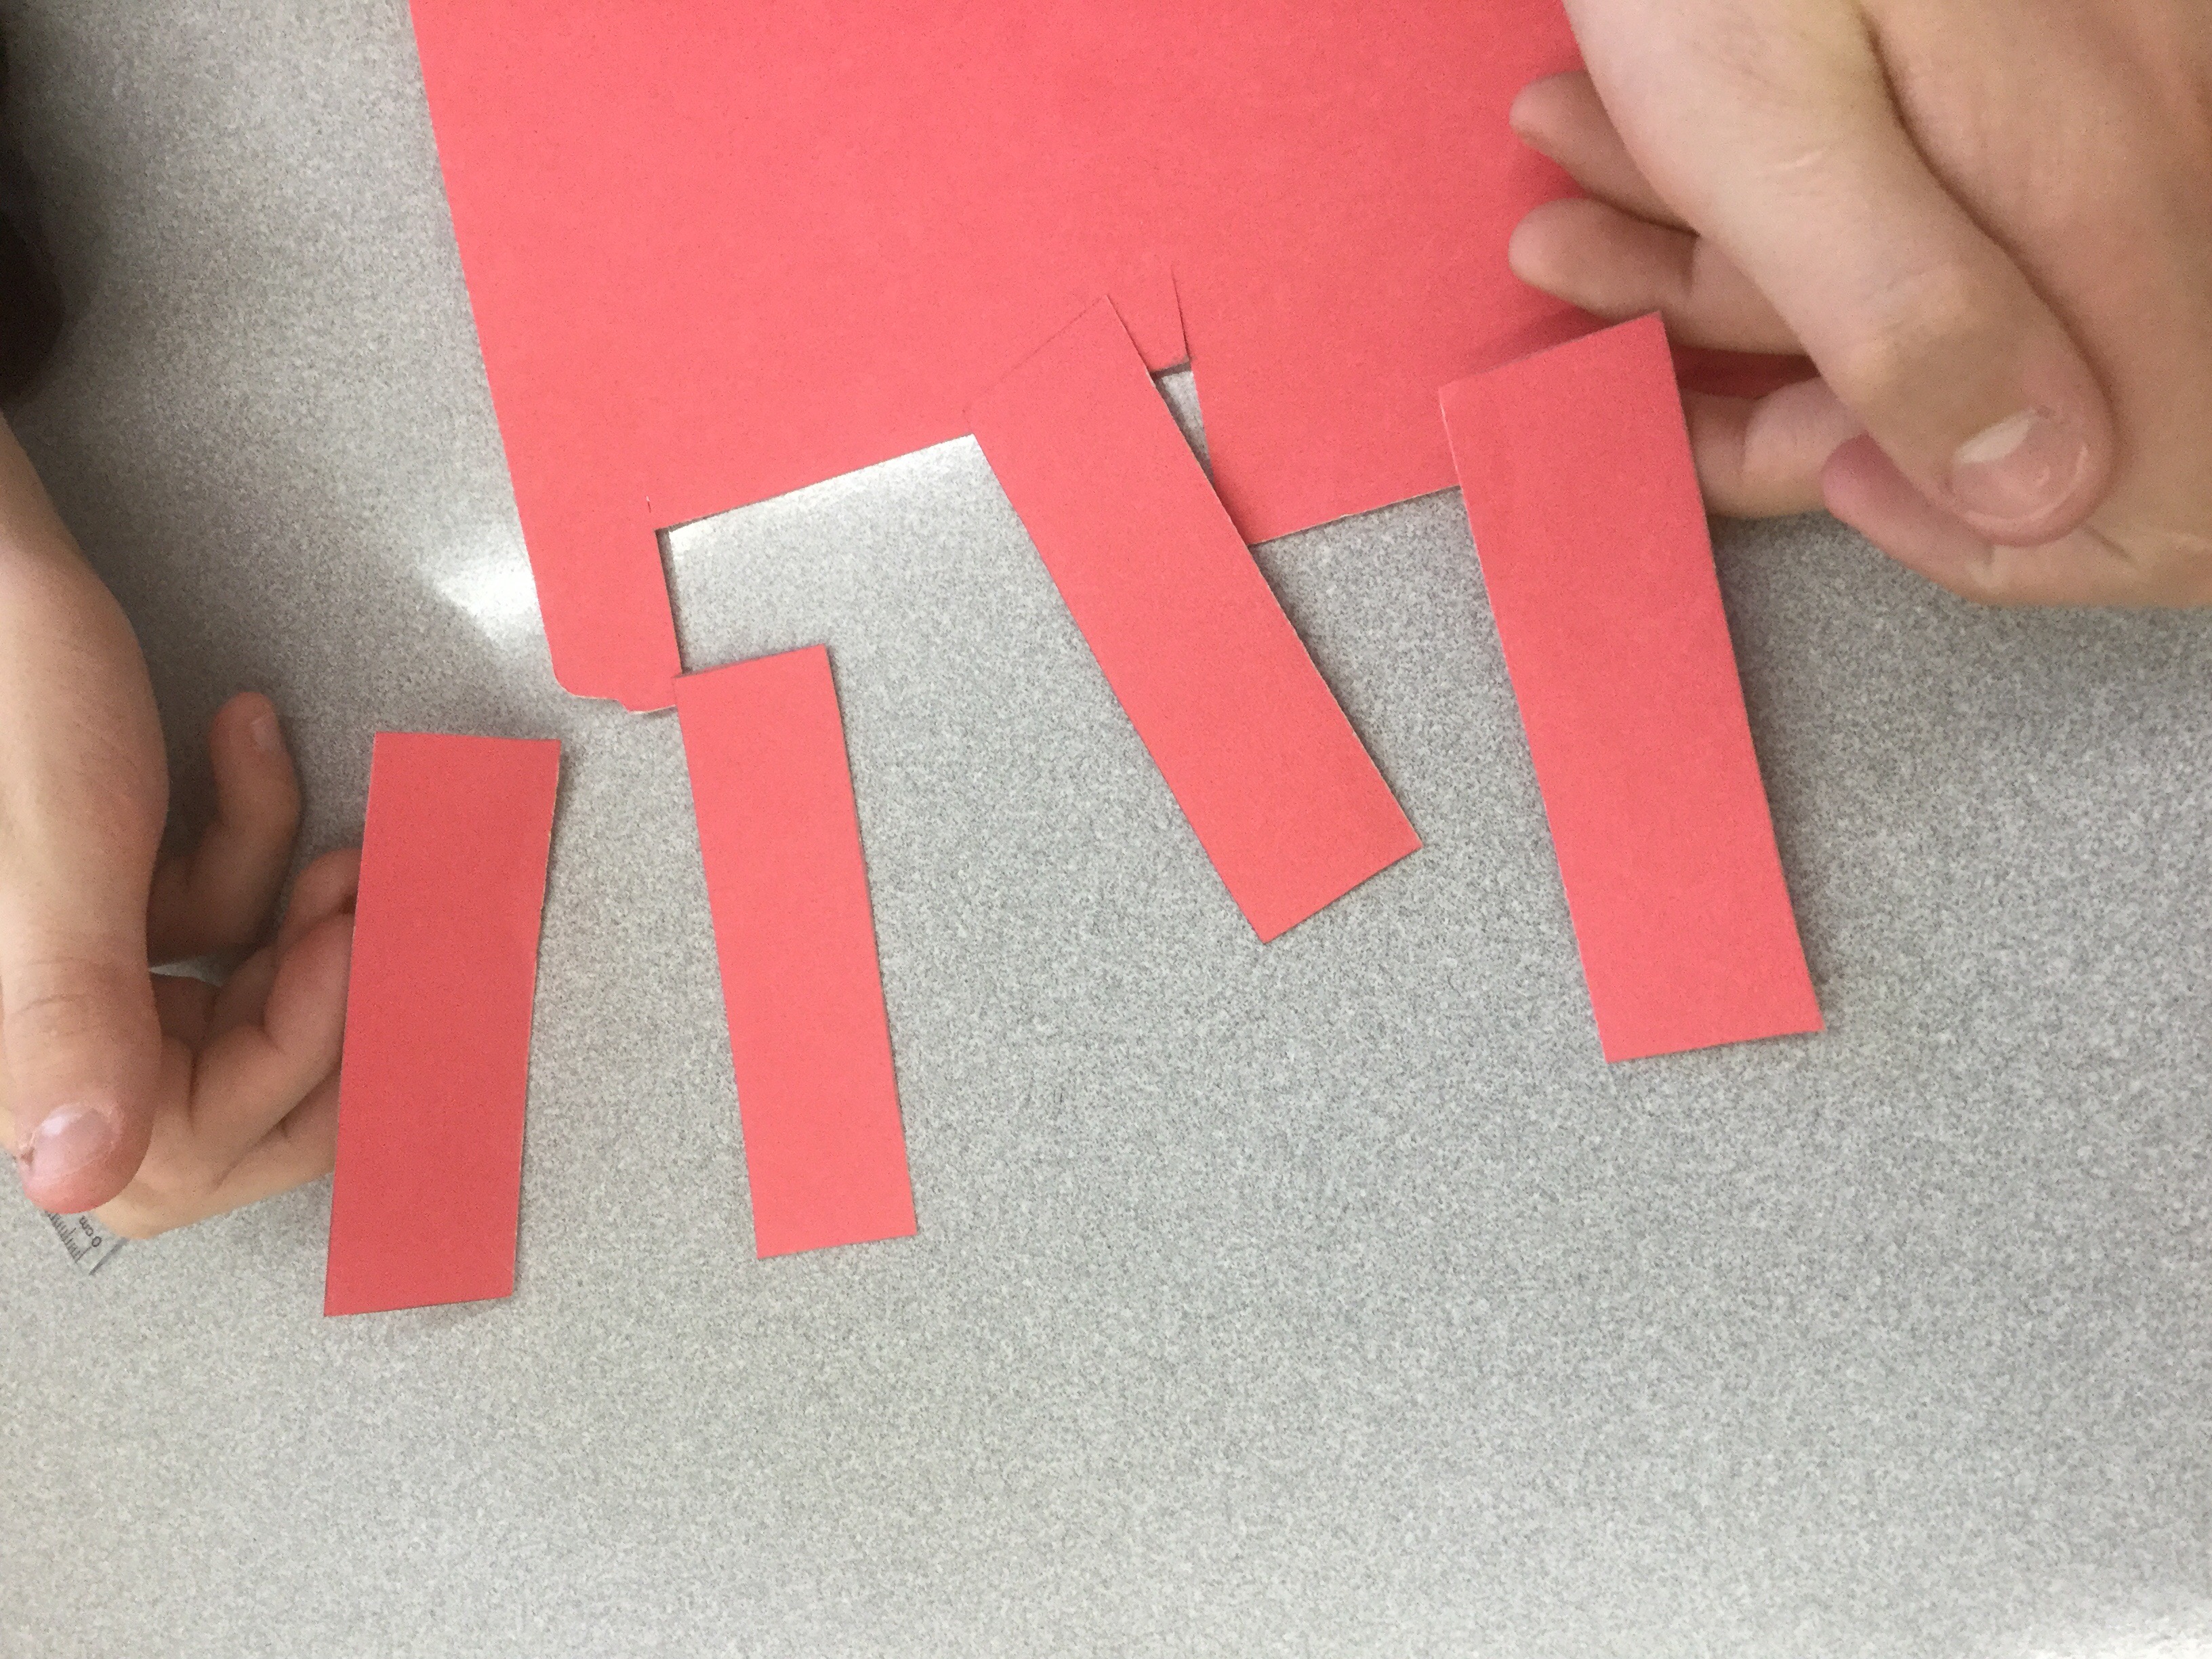
Others drew the entire net and then folded up the prism.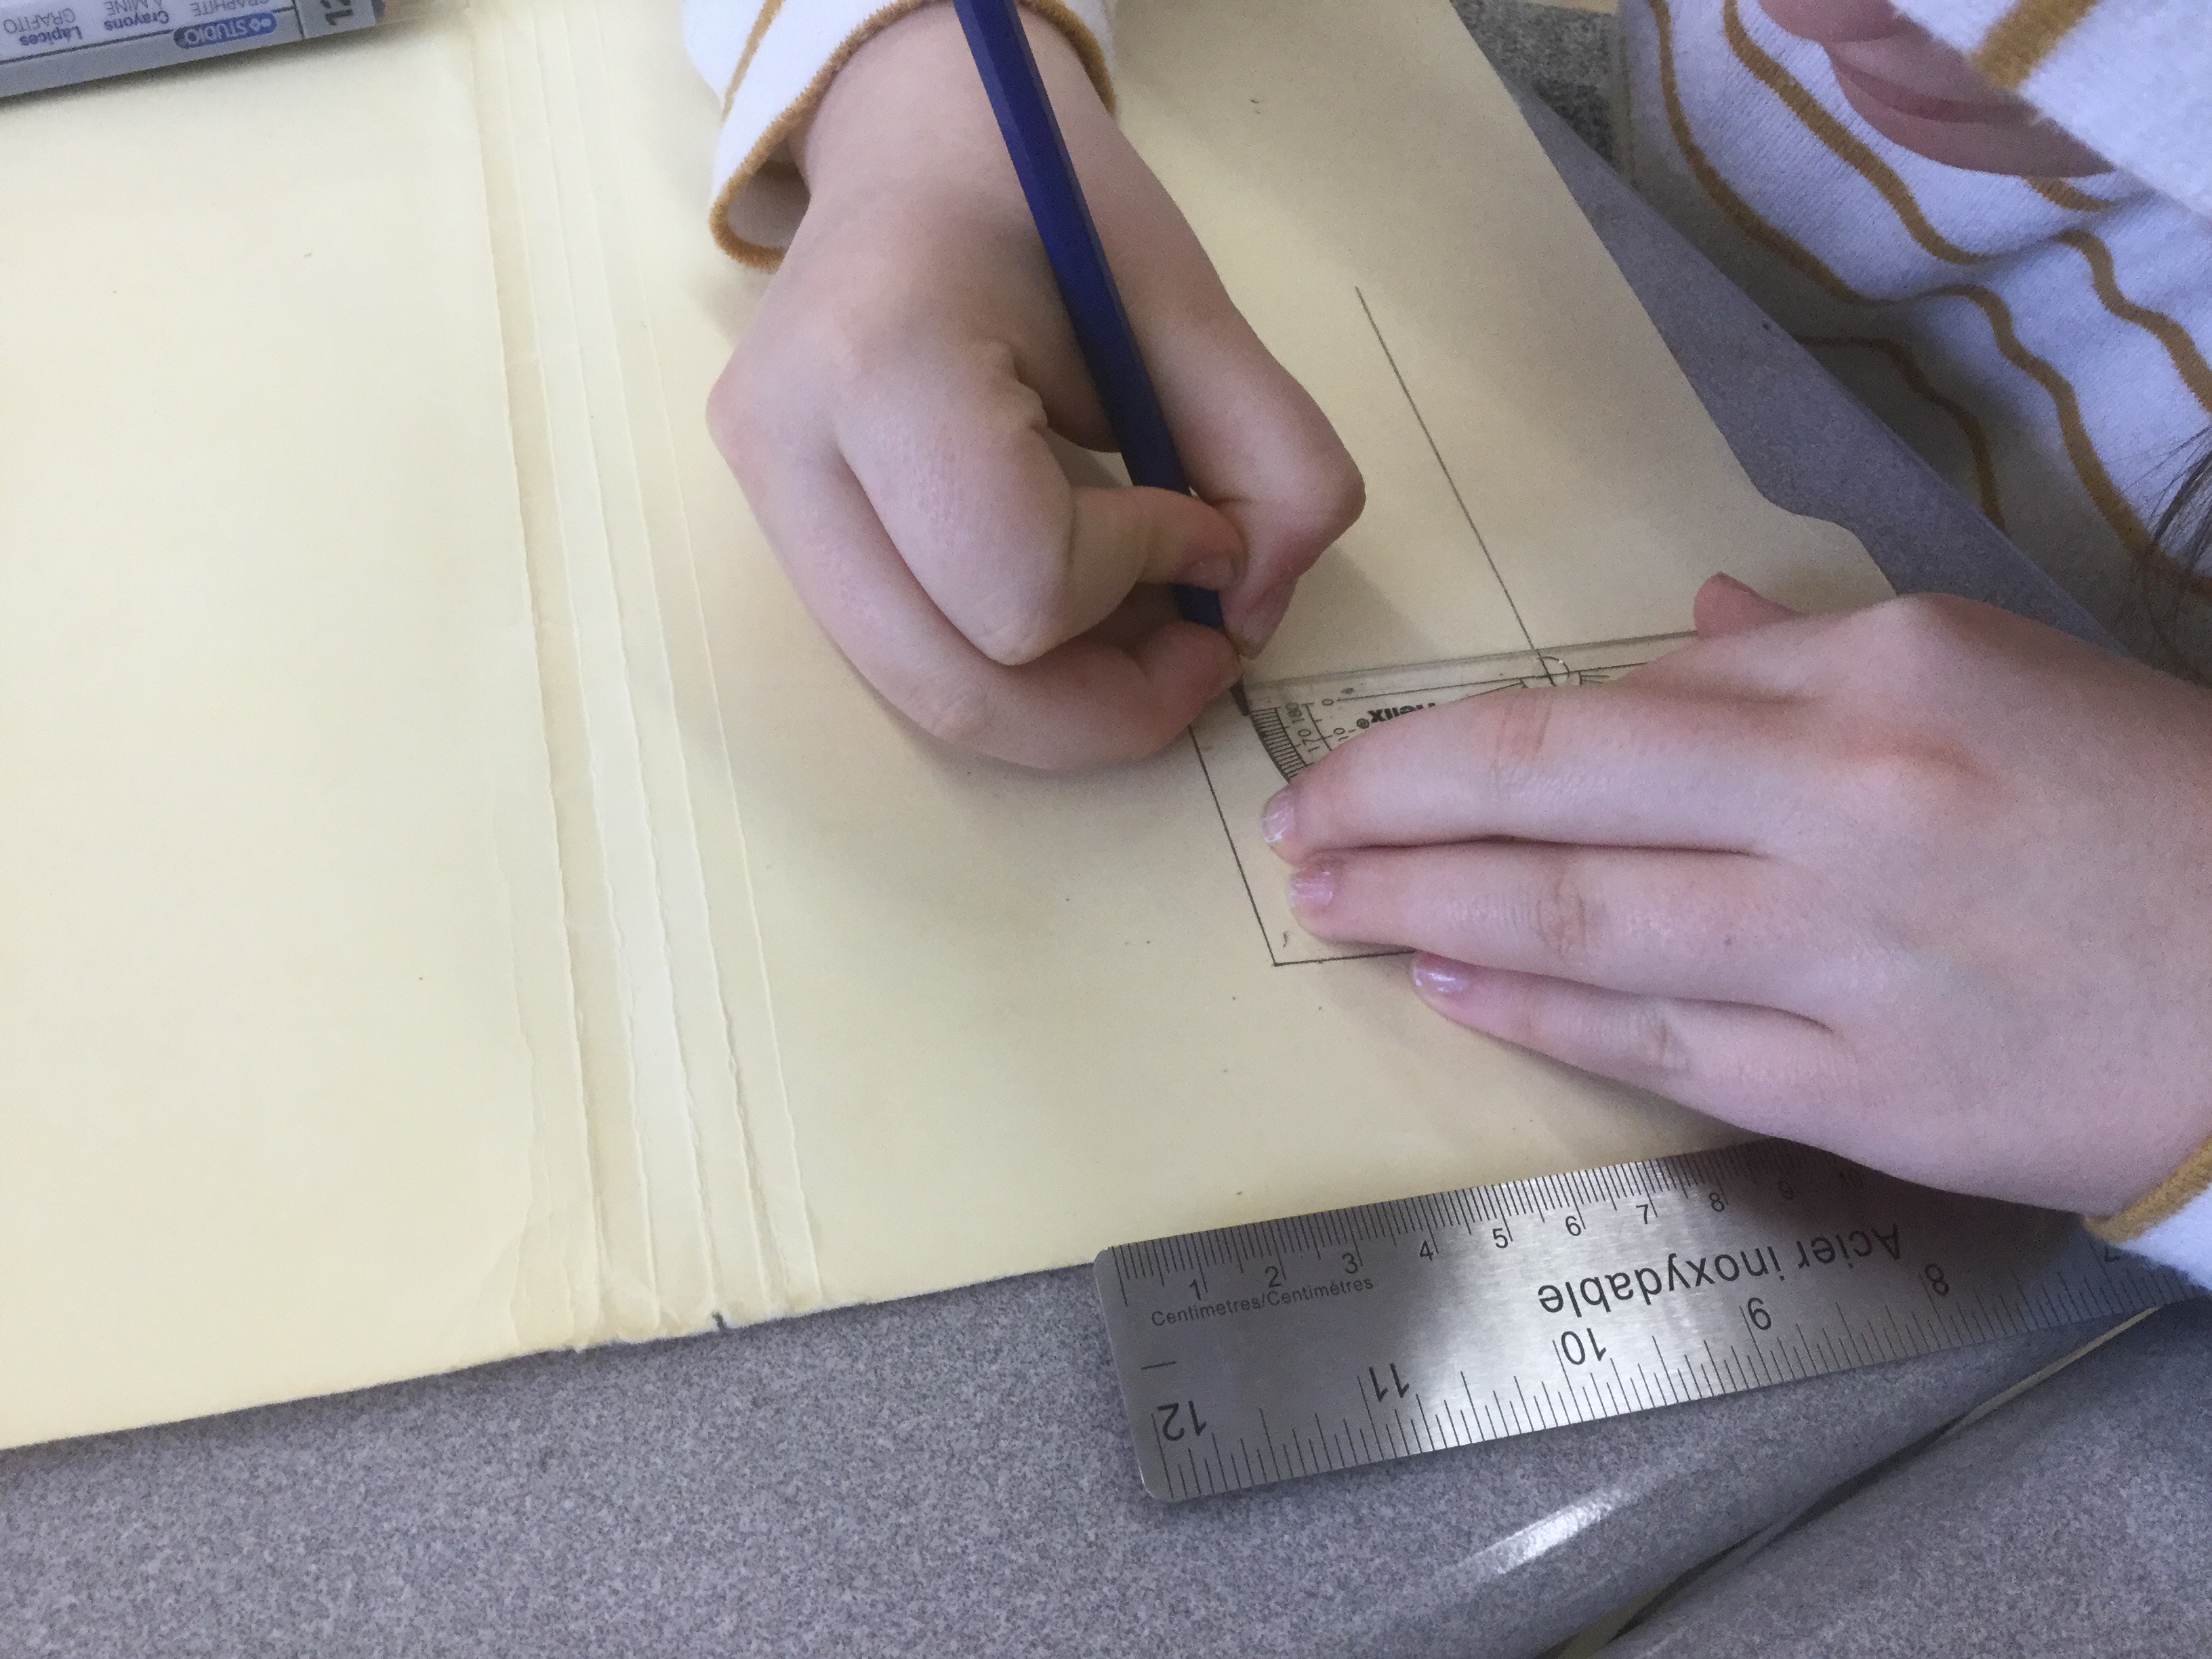
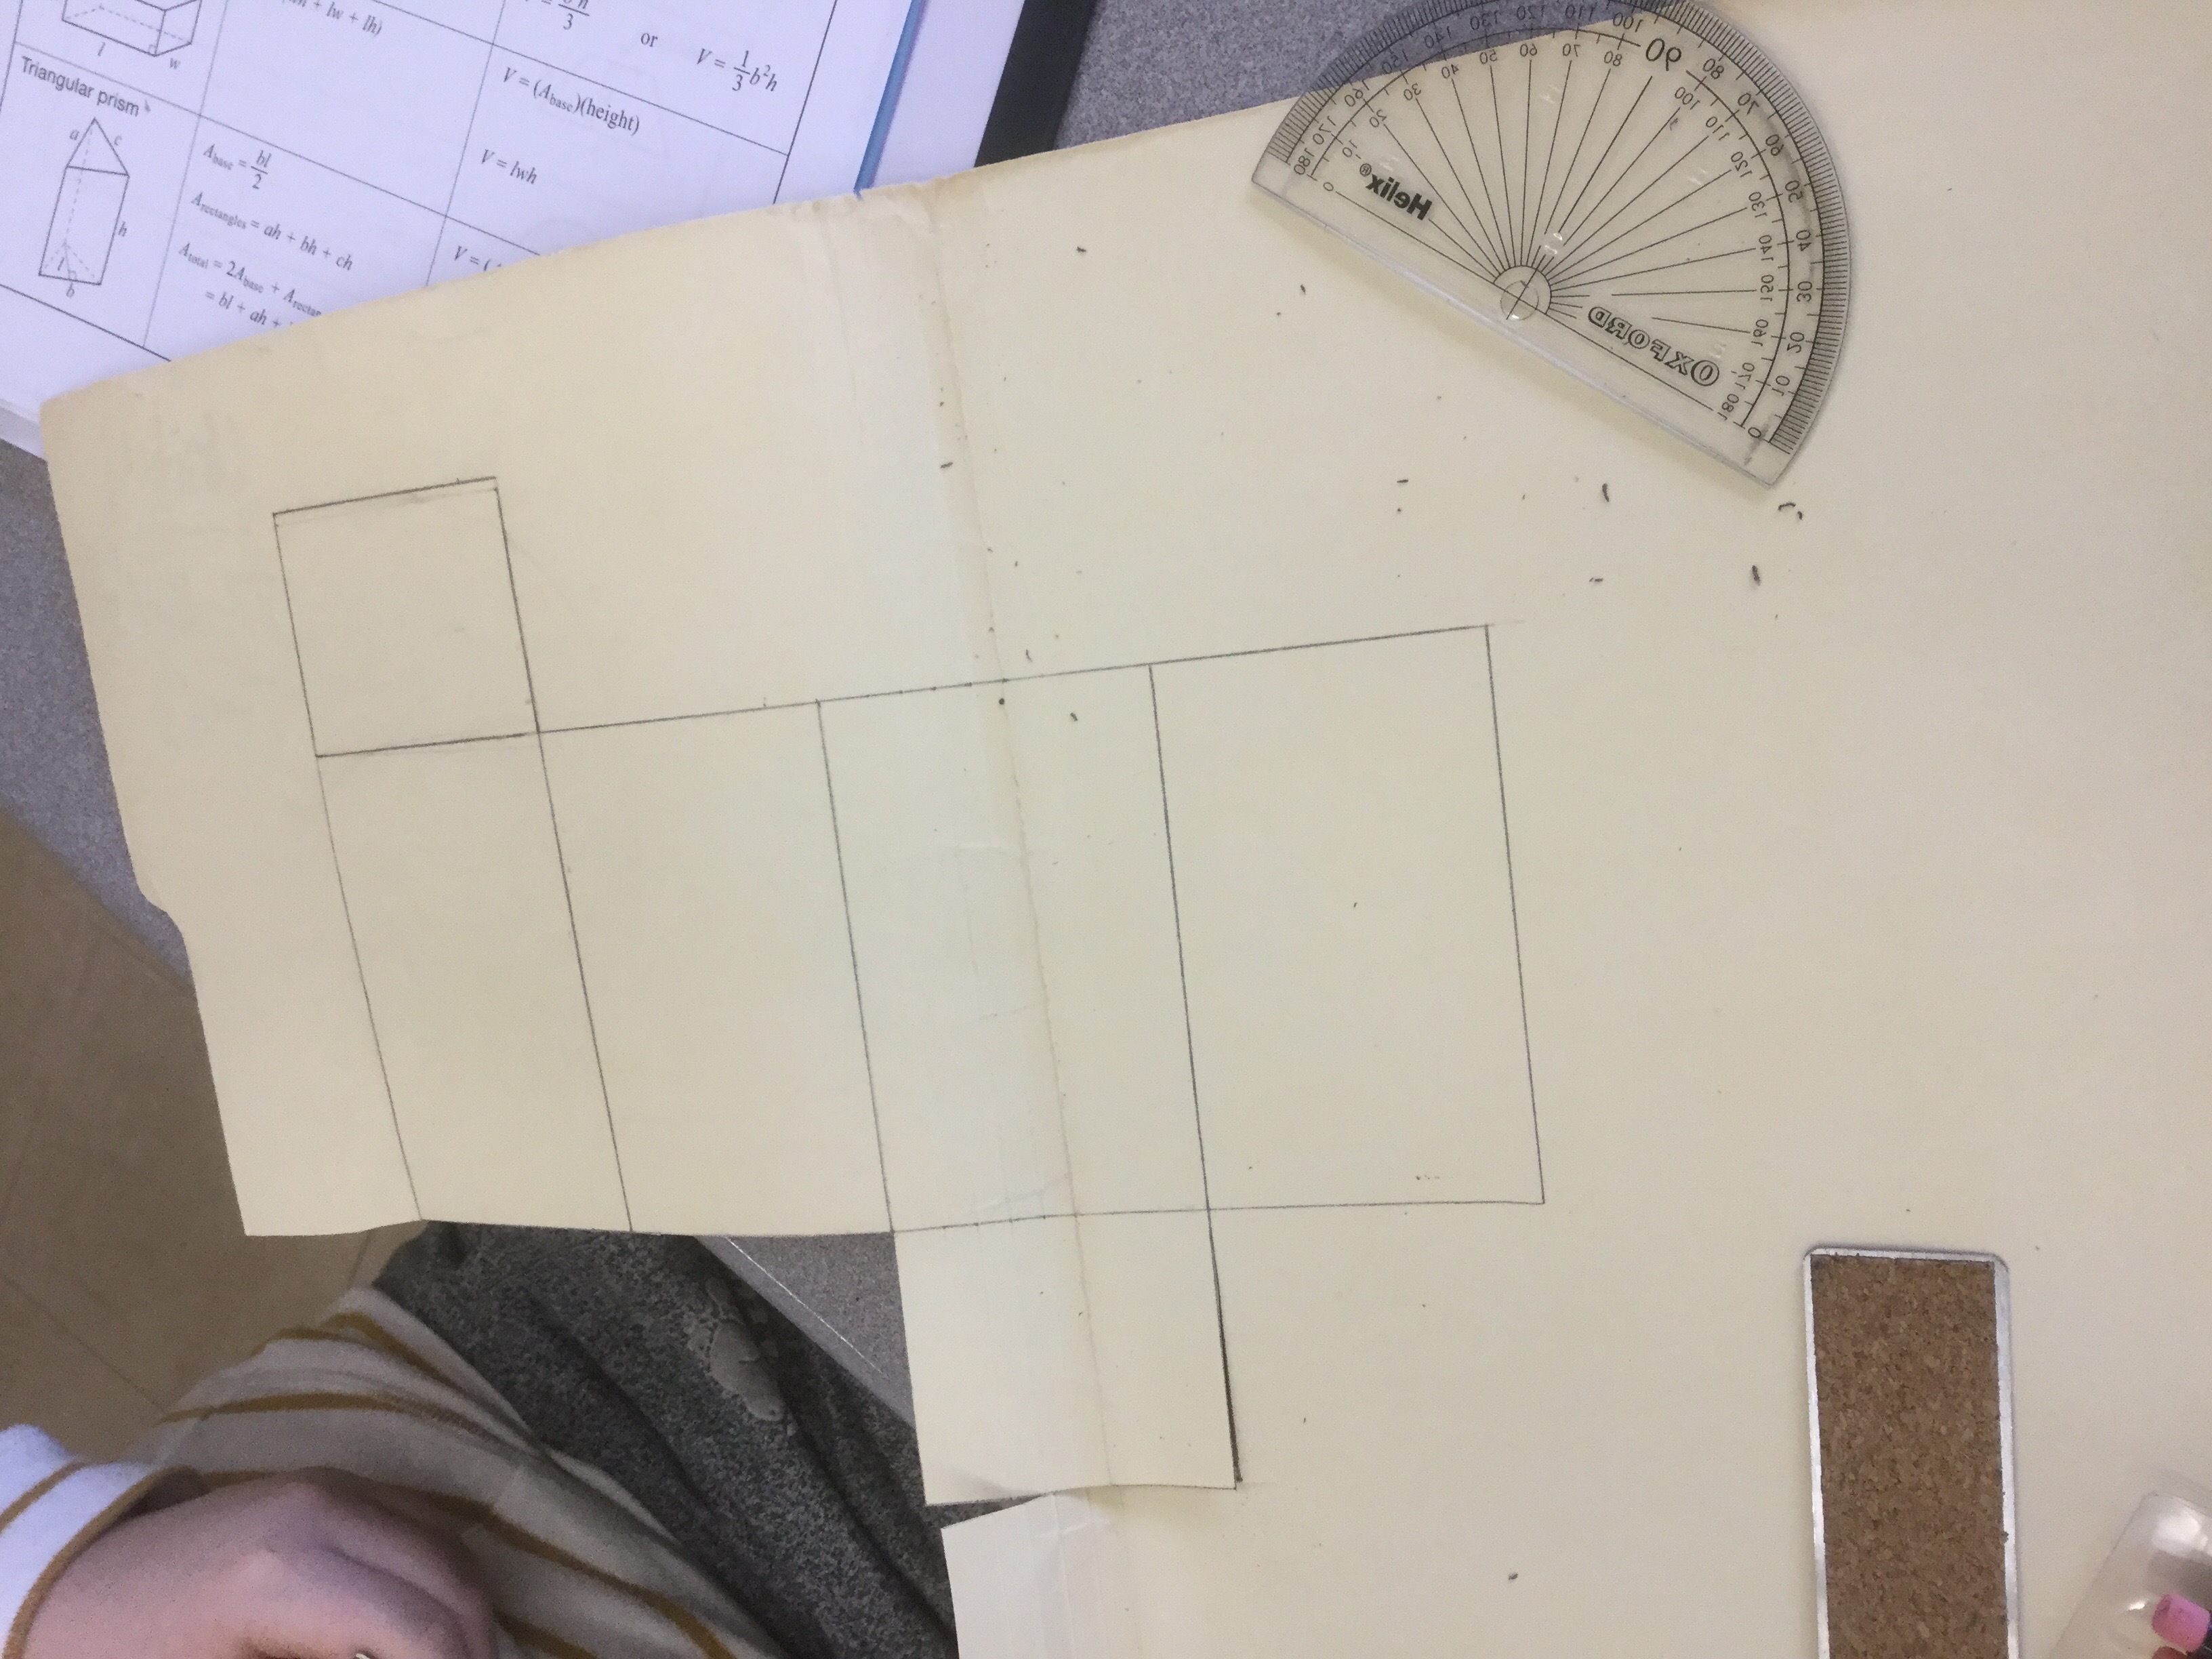
It took teamwork to get everything assembled.
We calculate the surface area of our prisms. It is pretty neat that we can have the same volume but different surface areas depending on the dimensions we chose.
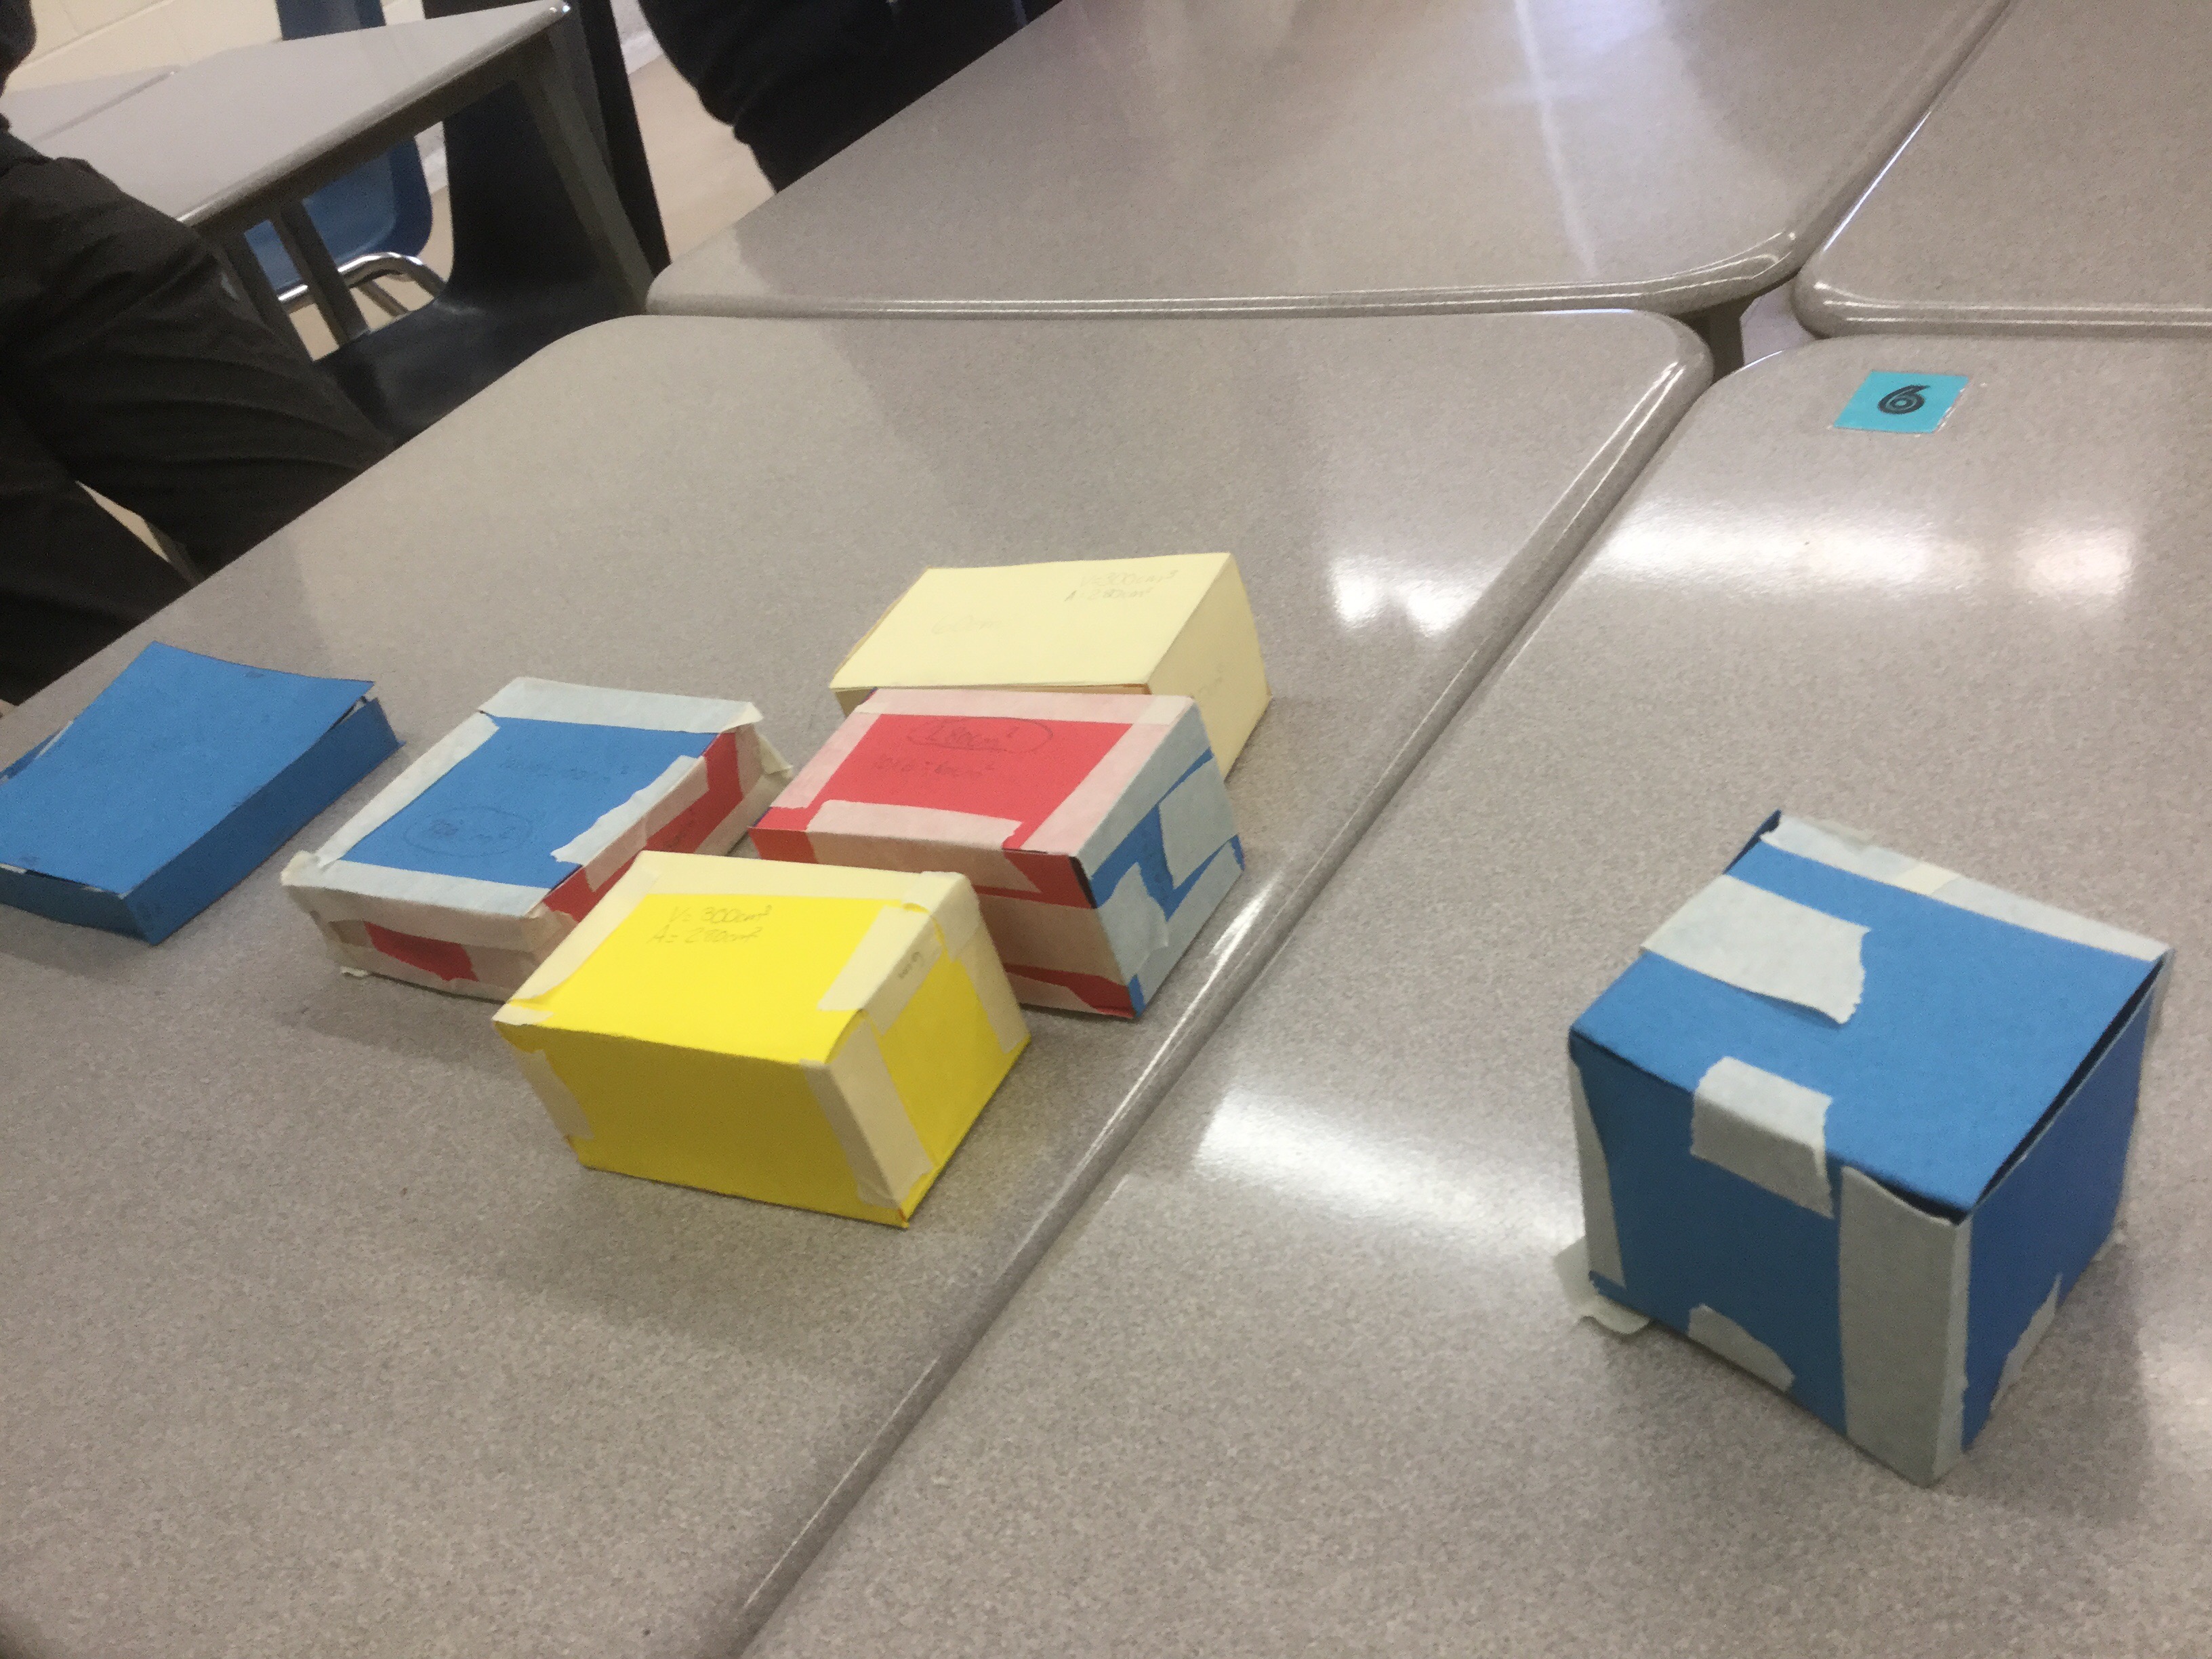
The cube, with all sides equal, has the minimum area. The farther apart the dimensions are, the larger the surface area. We could make a very long snake like box that is 3m by 1cm by 1cm and it would have an even bigger area than the prisms shown here.
Grade 12s Inverse Functions
There are lots of great videos and practice problems here.
Grade 12 mapping statements, transformations and polygraph
We worked on transformations of functions today and understanding what mapping statements are, and how to apply them. We also took some time to practice our vocabulary skills and played polygraph on desmos.
We were paired up with teams in our class and we had to ask yes or no questions in order to narrow in on which function our partner had chosen.
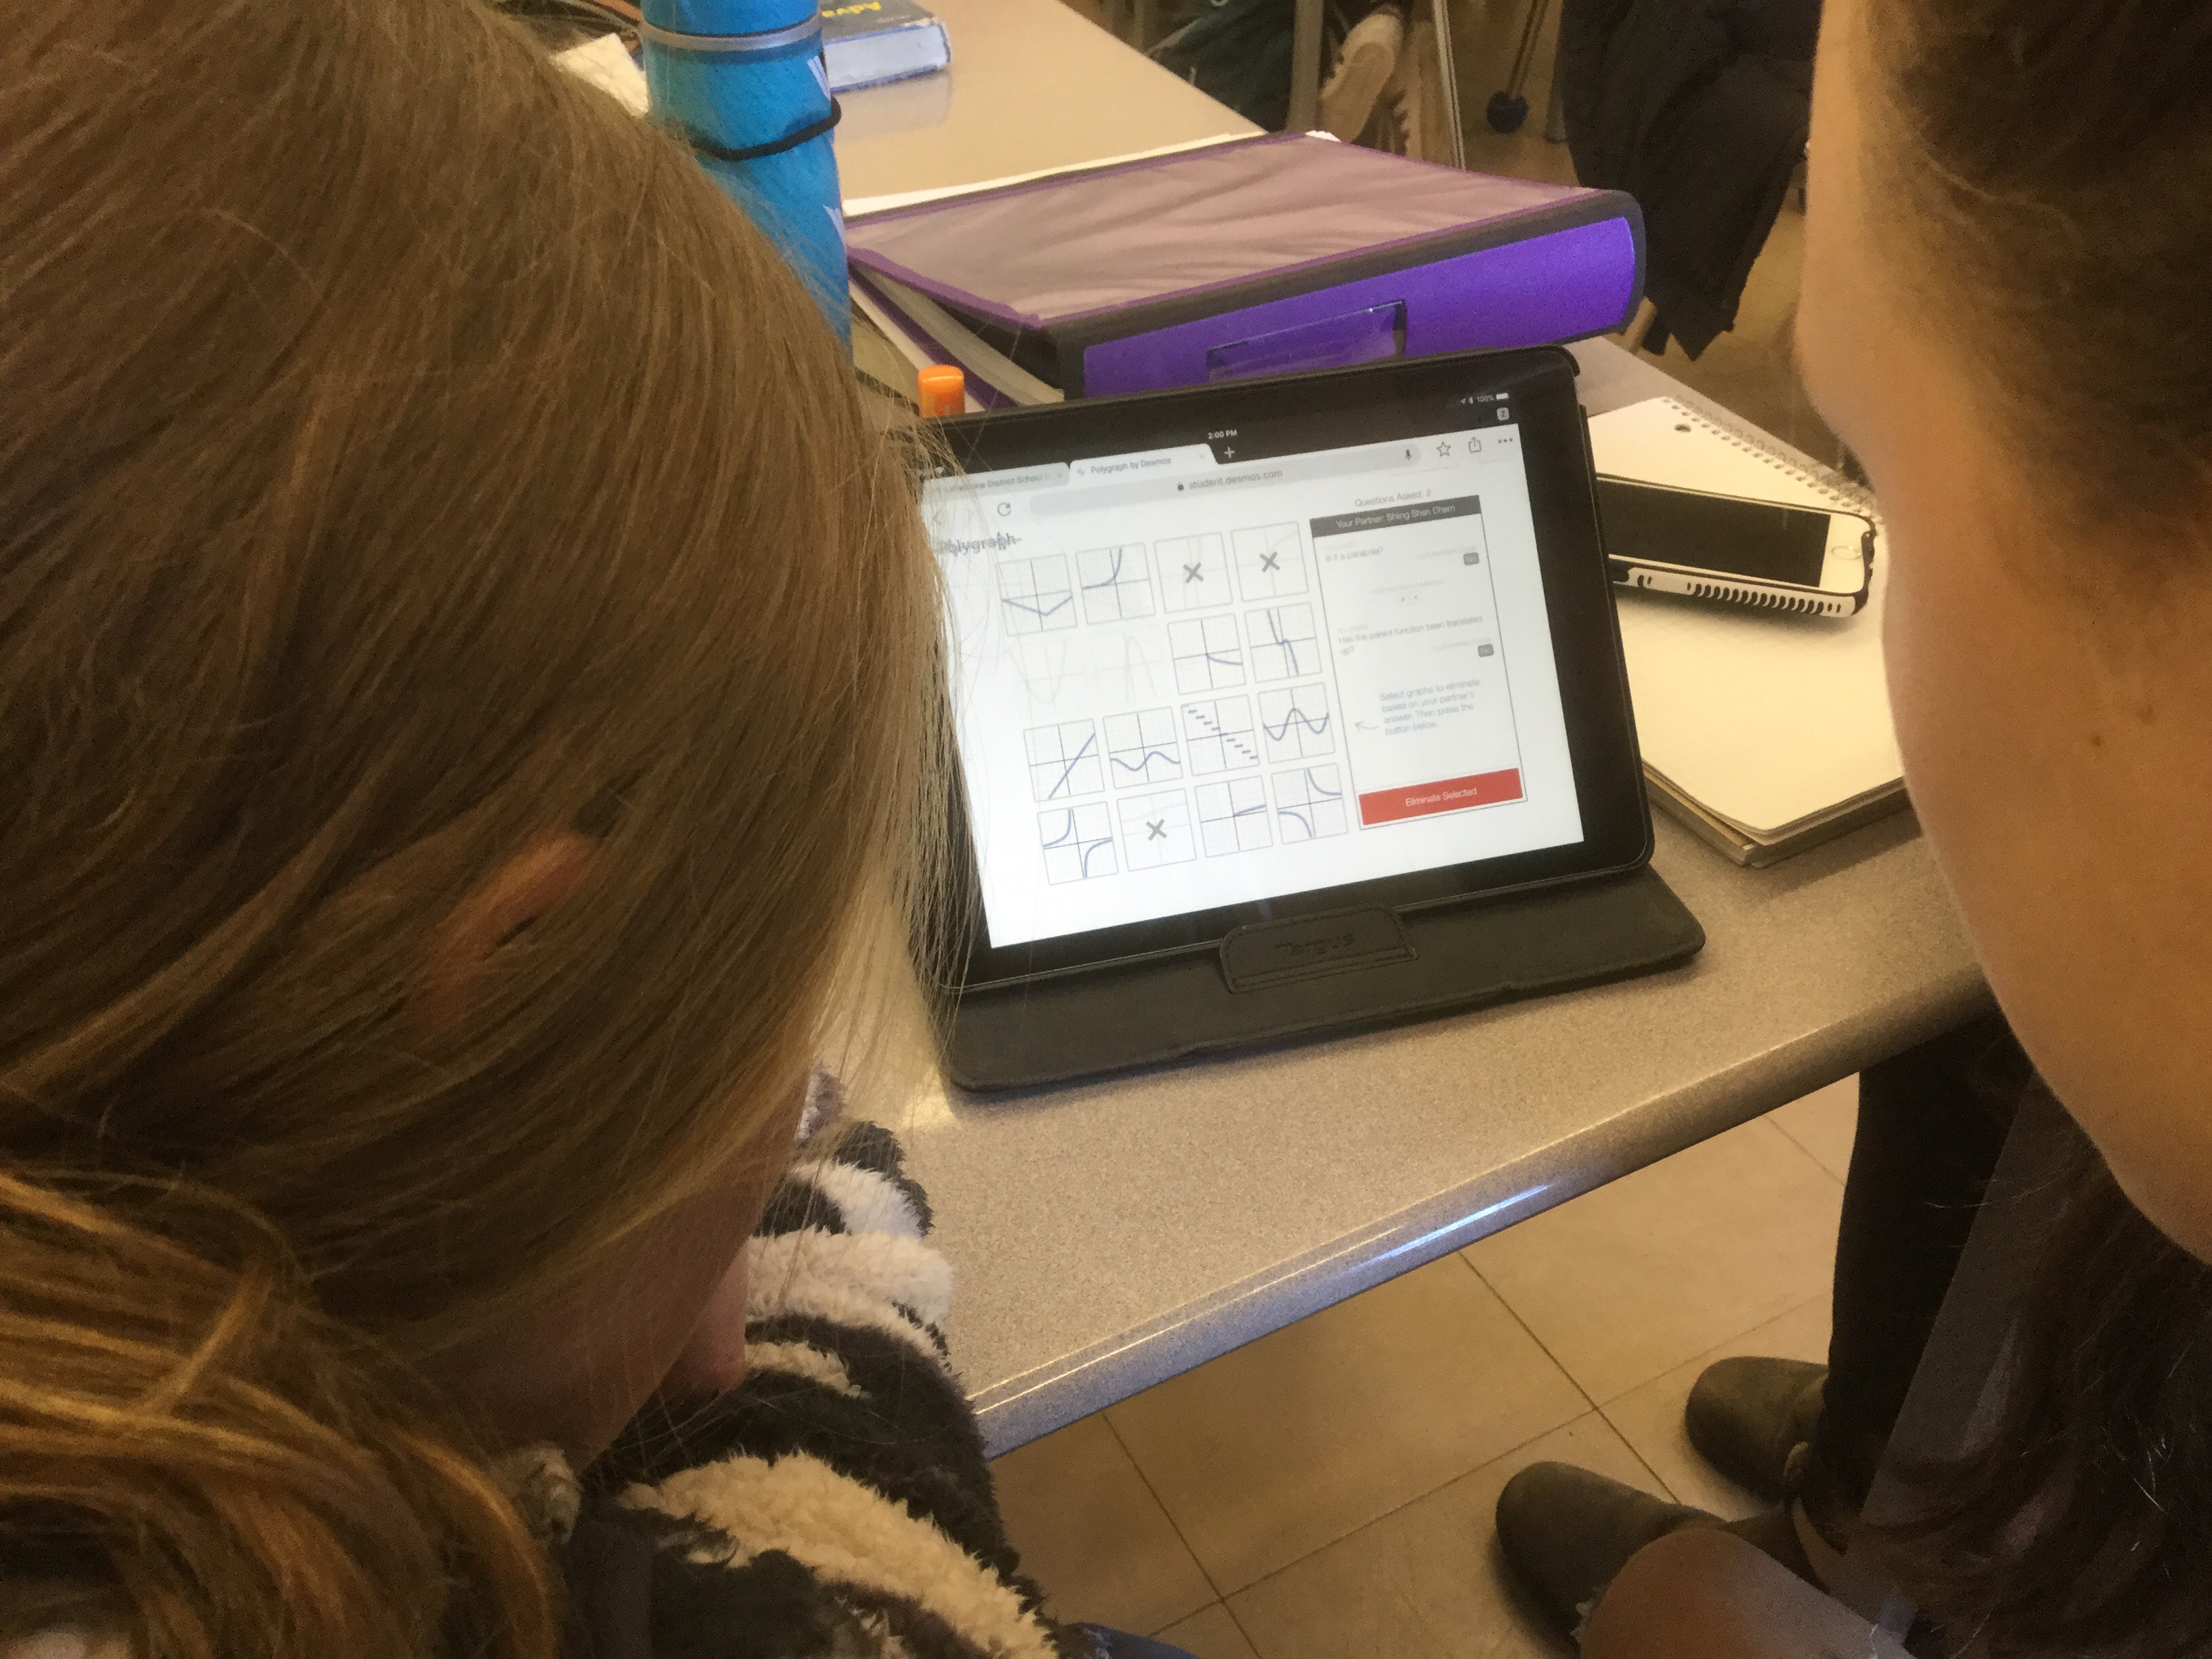
We are getting better at choosing efficient questioning strategies. One group managed to hess the function in 3 questions!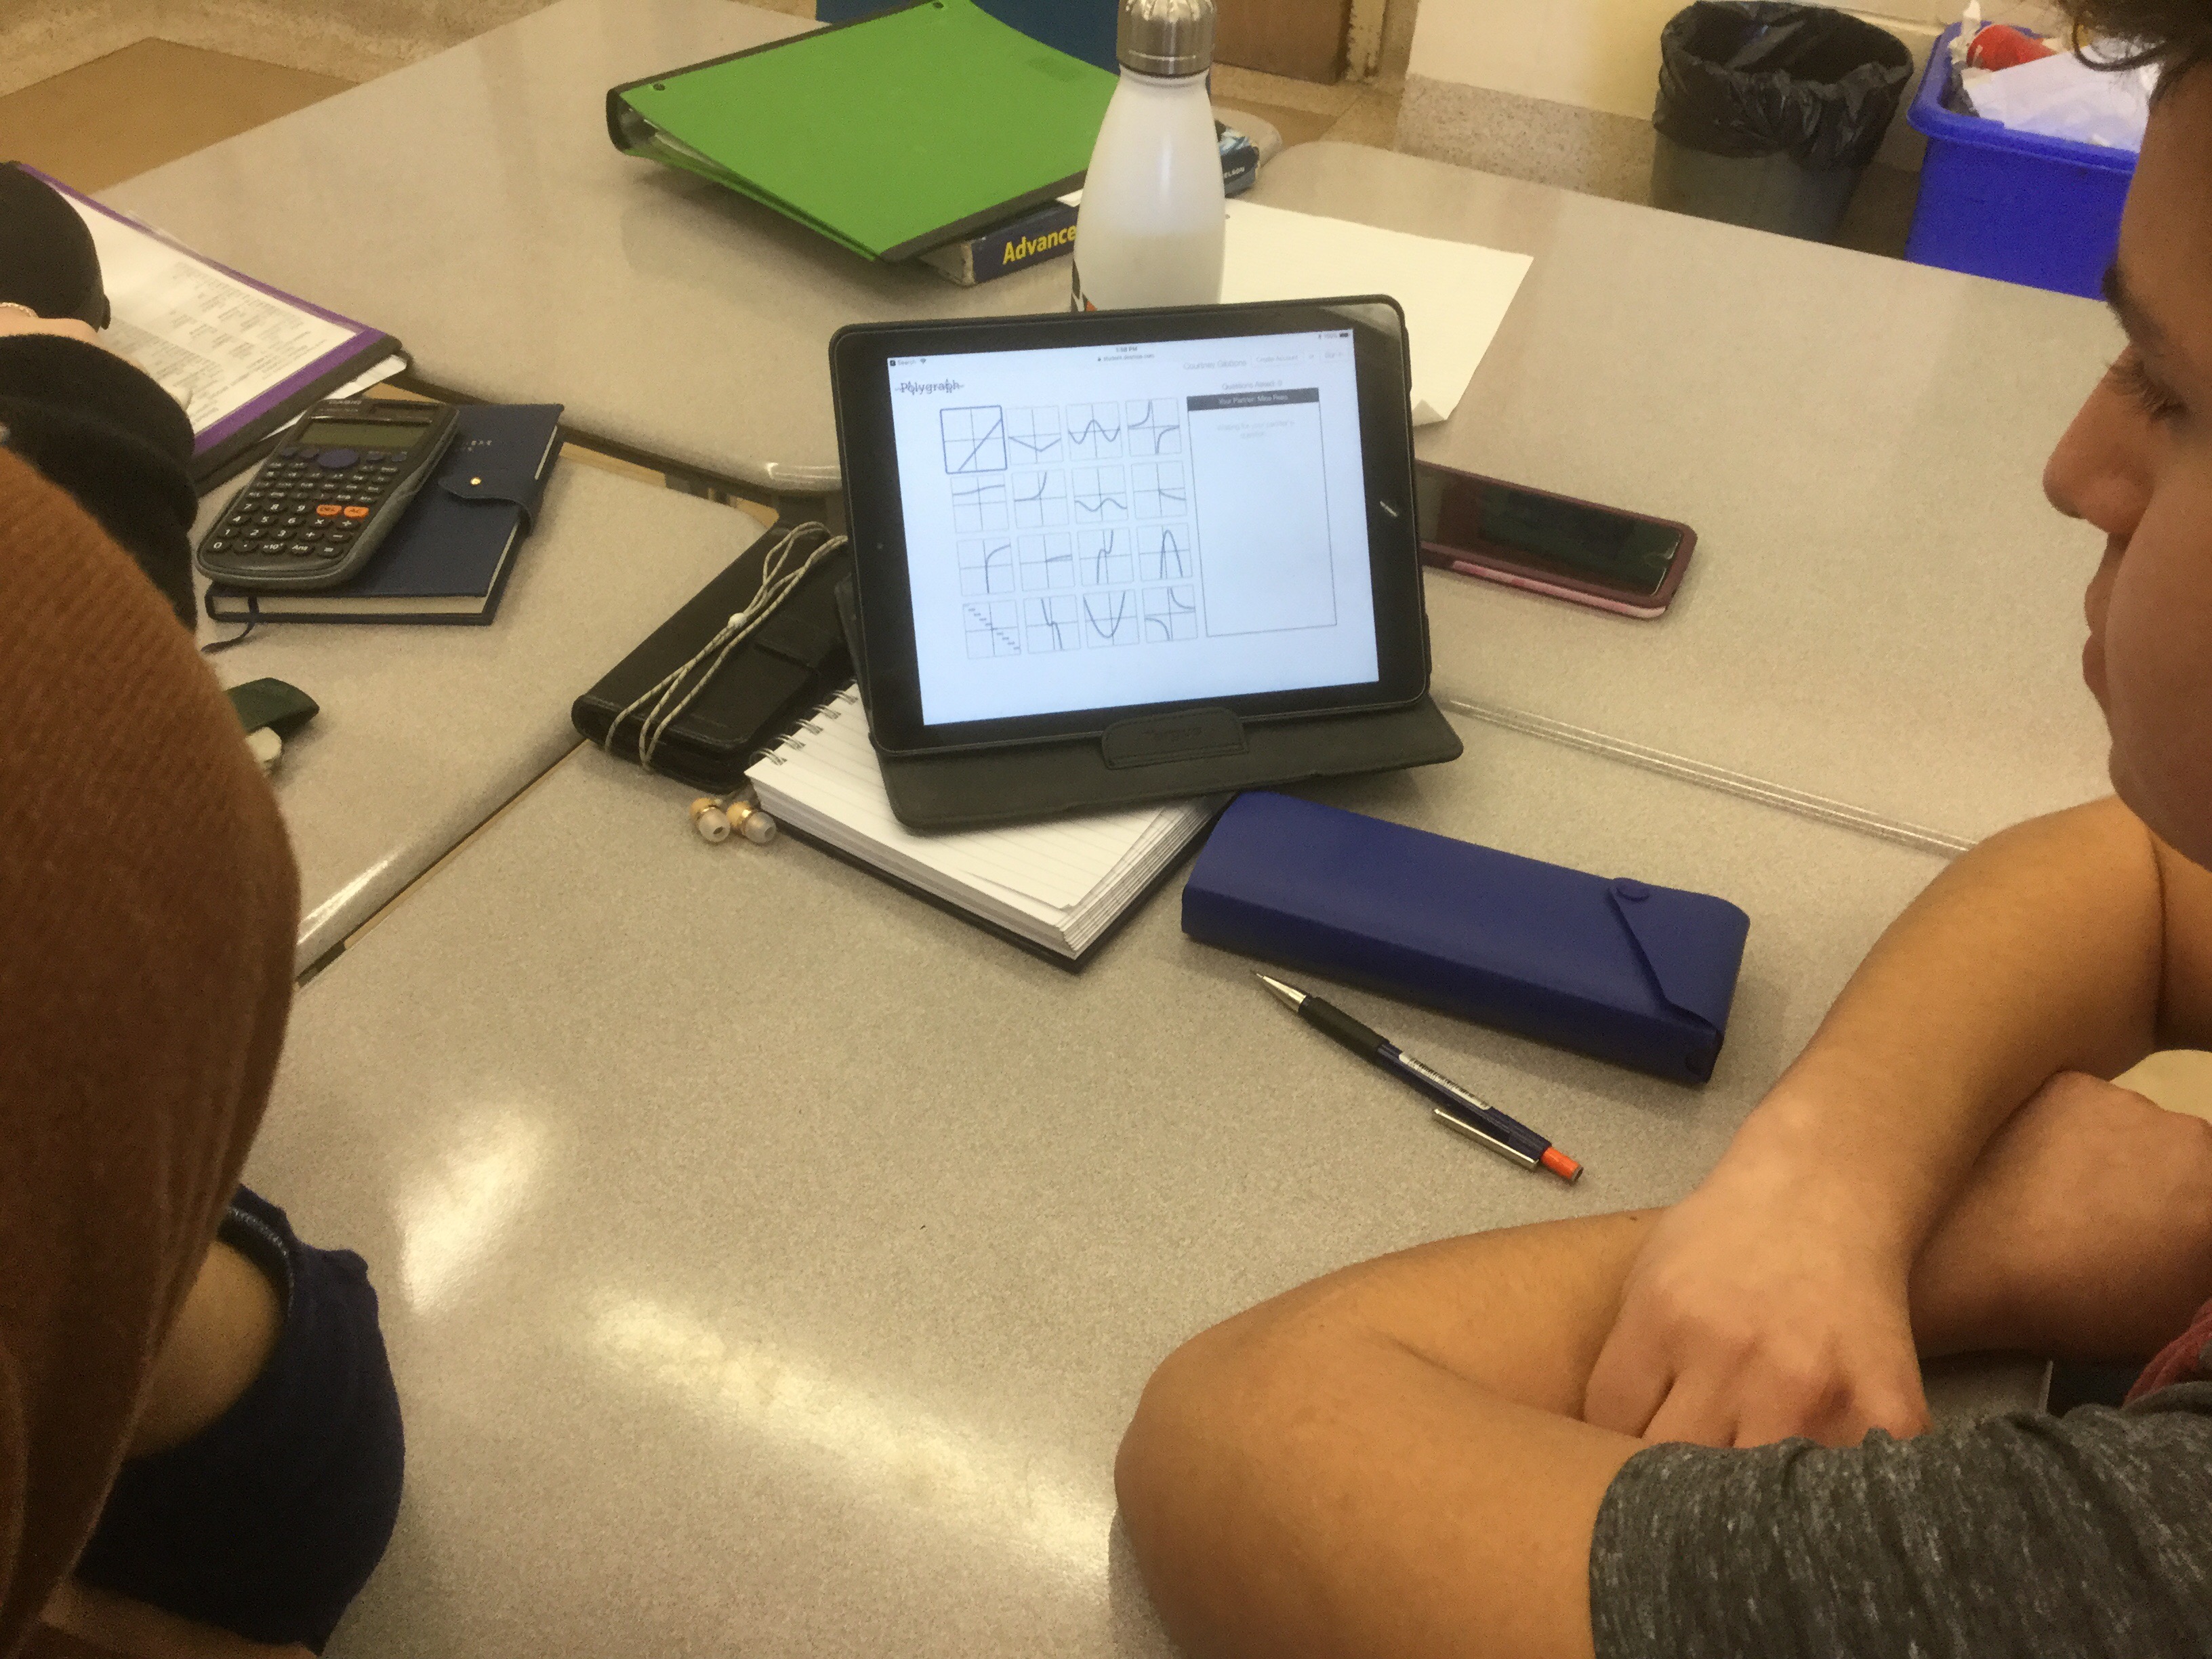
Good job today! Keep working on reviewing properties of parent functions and transformations. Check your quiz corrections with the solutions online.
