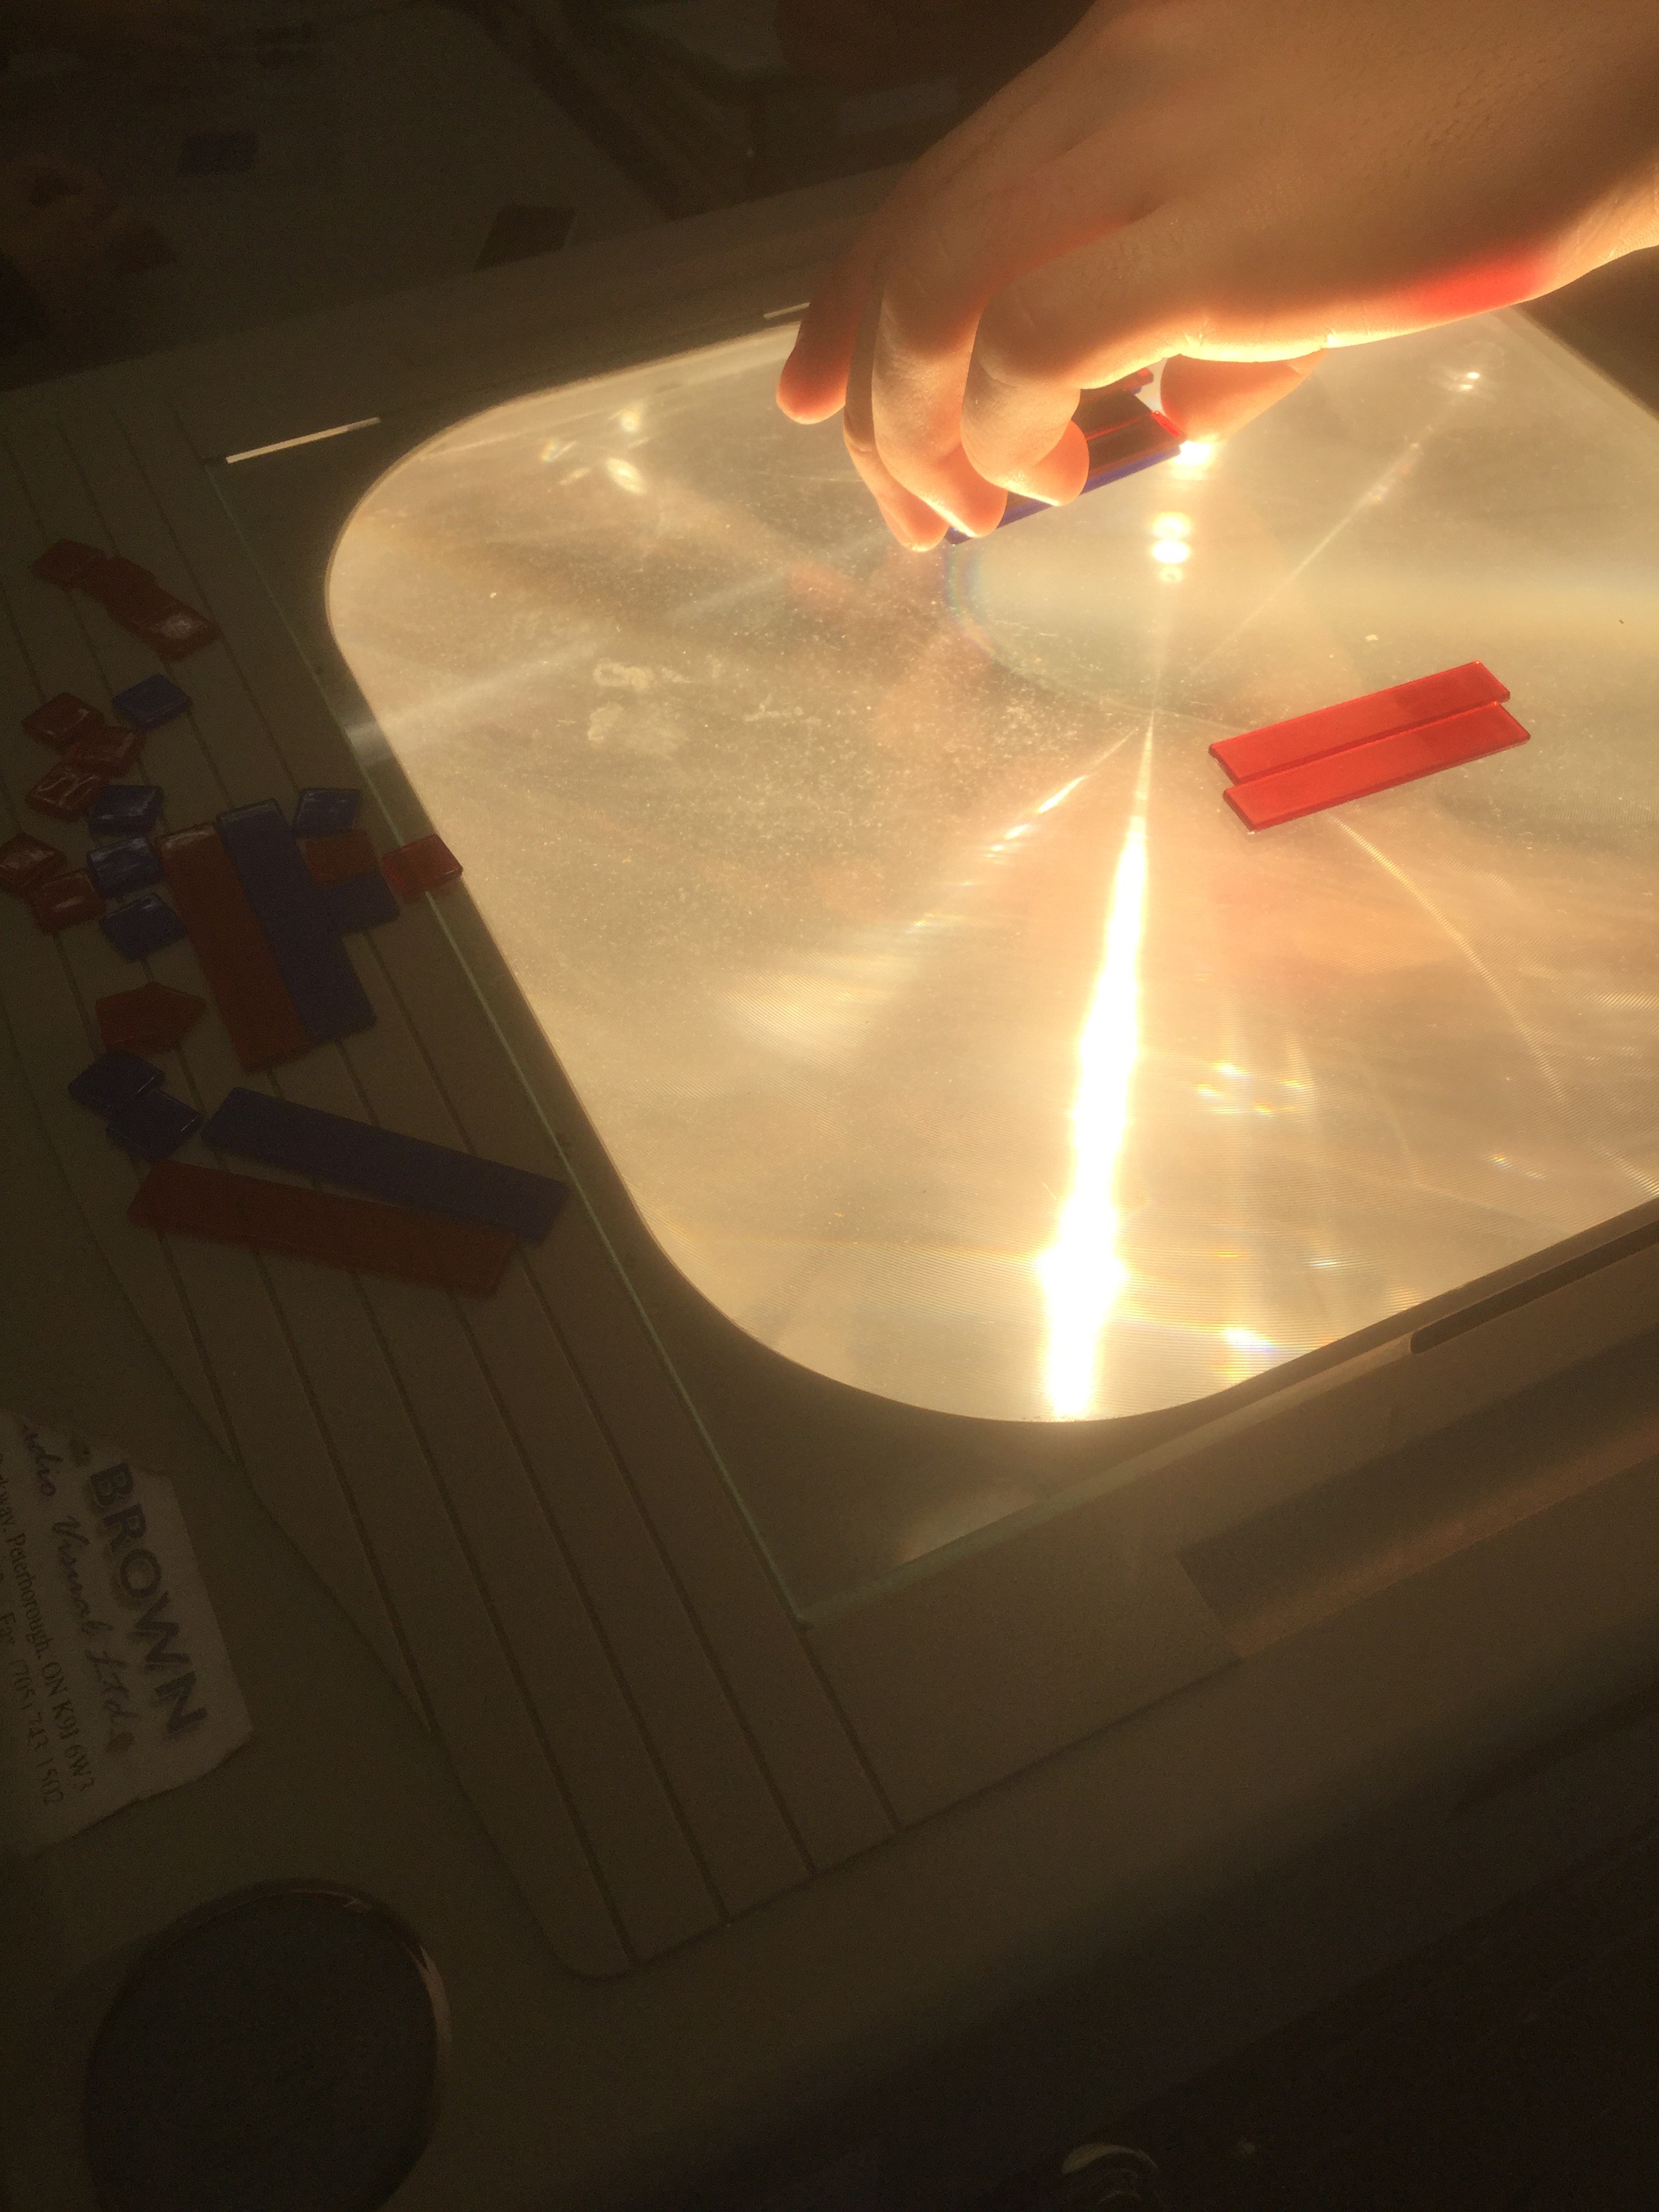
All about exponents
Grade 9s are working on evaluating expressions with exponents. Today we looked at bases that are integers, and fractions.
We look each time to see what the base is, and can show the repeated multiplication. In the following examples, if there are parentheses surrounding a negative number which is raised to an exponent, that negative number is what is repeatedly multiplied. If there are no parentheses, the exponent does not affect the negative. The base is the positive number the exponent touches. That number is then repeatedly multiplied, and the negative is applied after.

We noticed that if the base is negative, and the power is an even number, the answer will always be positive.
We looked also today at the pattern that we see when we have the same base (in this case 2) raised to many different powers. We made a table, and looked for the patterns. We made the exponents go all the way into the negative numbers.
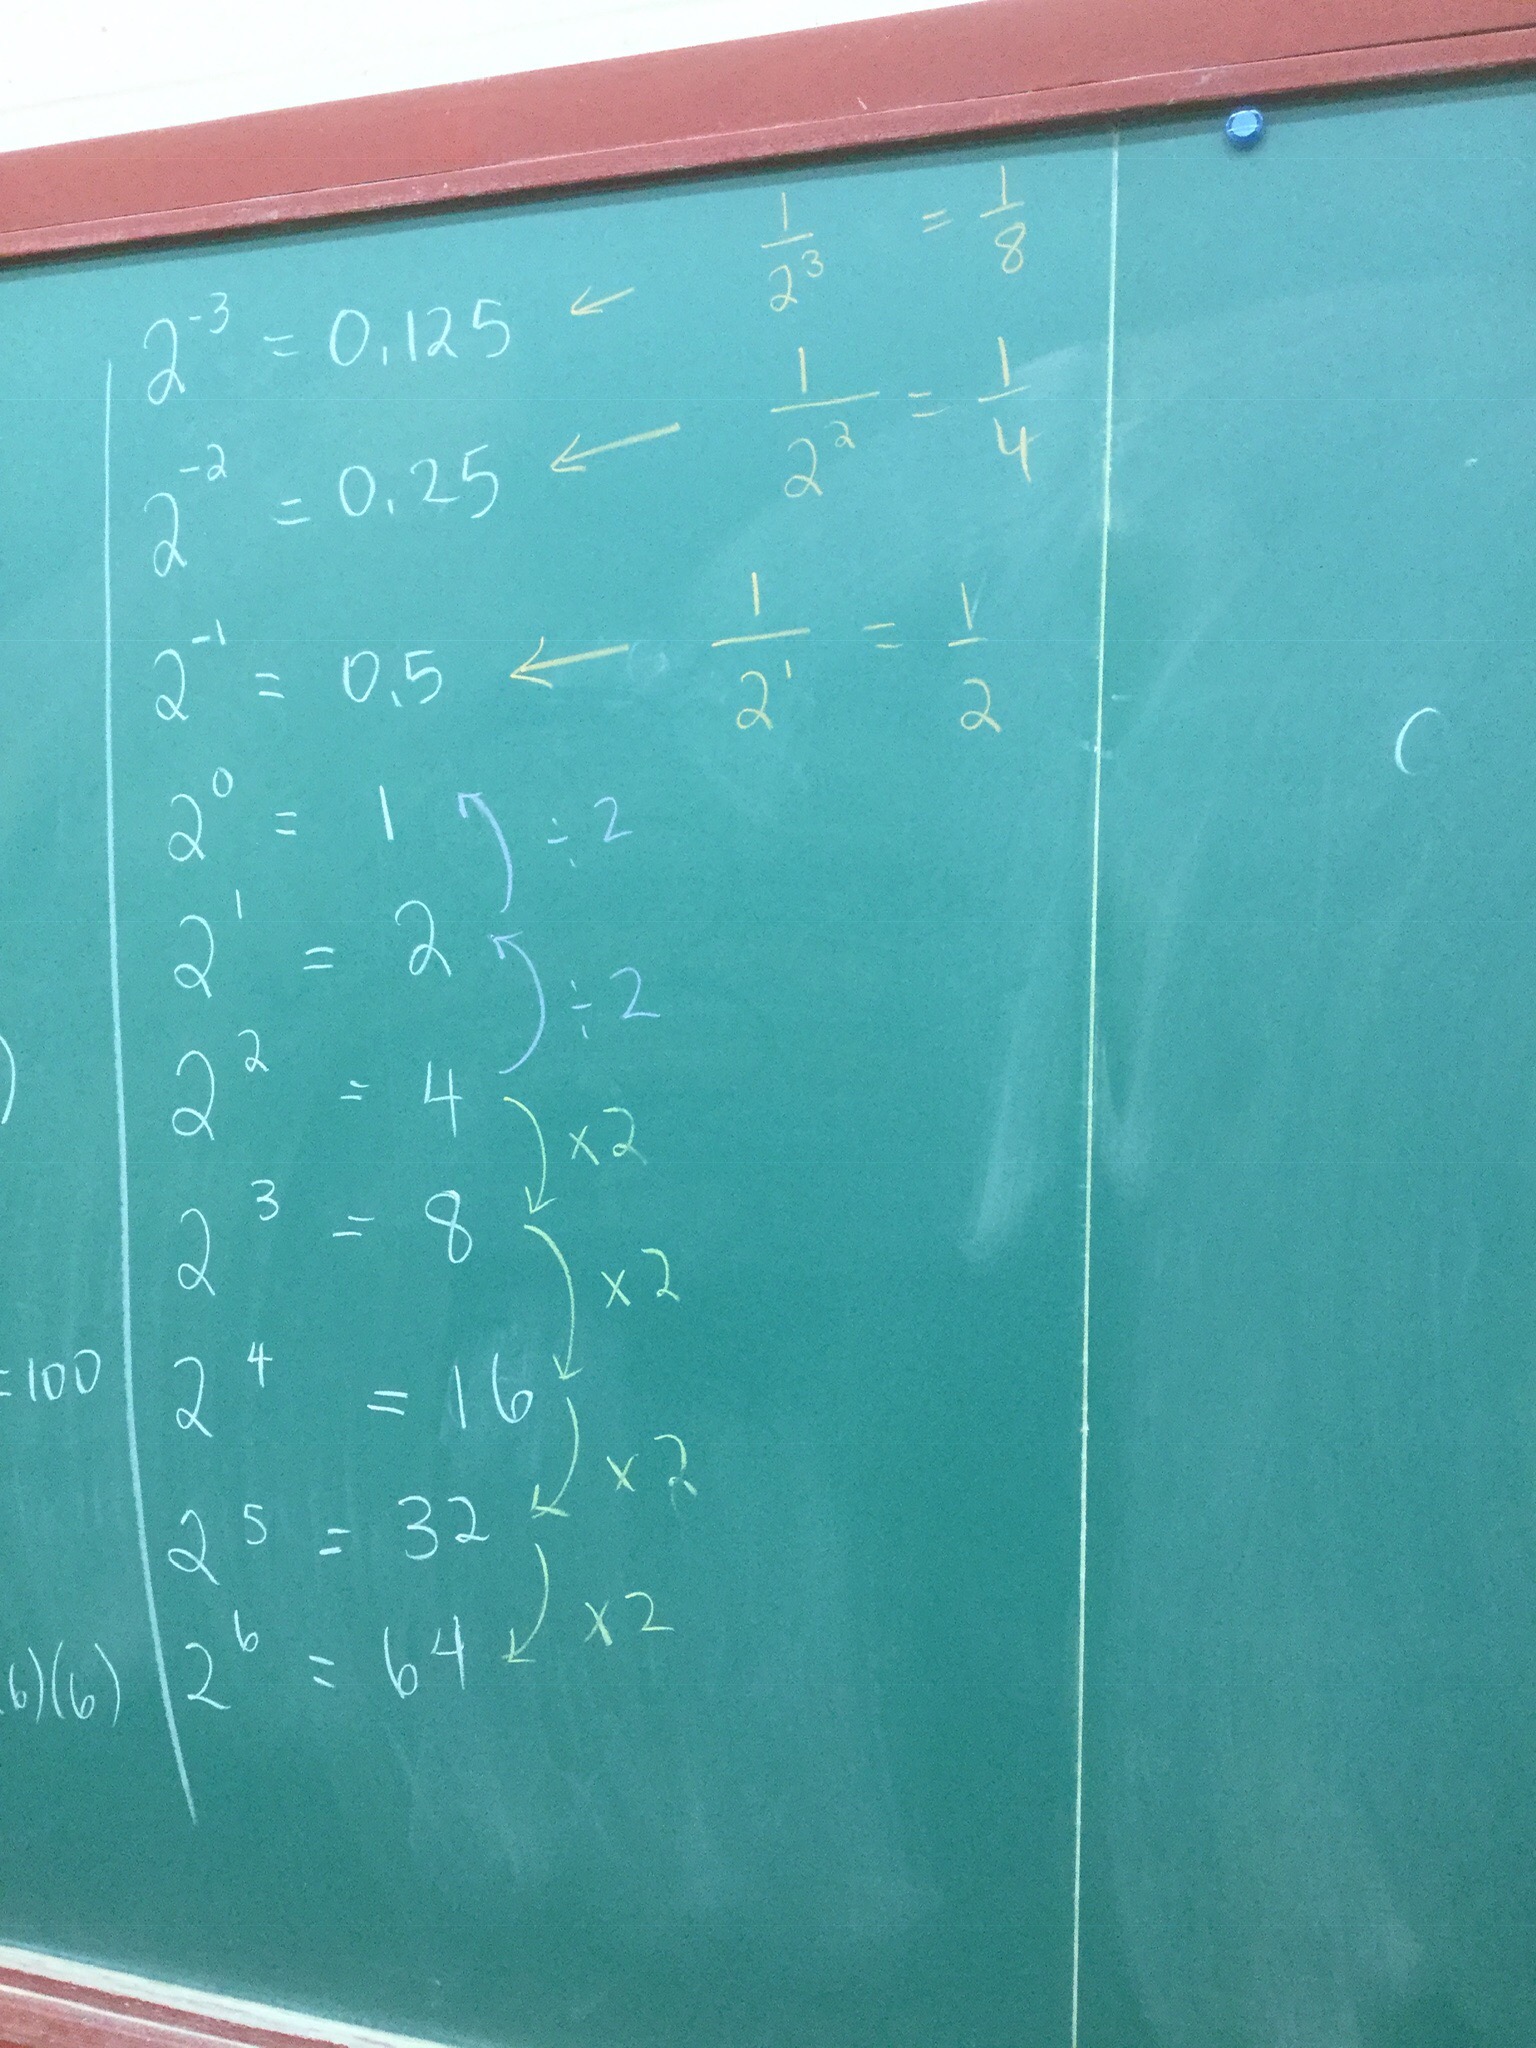
We explored to see if this is a linear or non-linear pattern, positive or negative, direct or partial. It turns out to be pretty interesting on a graph.

It is positive, non-linear, and partial. The y intercept (ordonnée à l’origine) is 1 and it will never cross the x axis. It gets super close to it, but will never reach it. That means there is an asymptote (something to learn more about in grade 11).
We looked a bit at what an exponent of 0 means. We arrive at it by creating a division with the same base and same power in numerator and denominator.
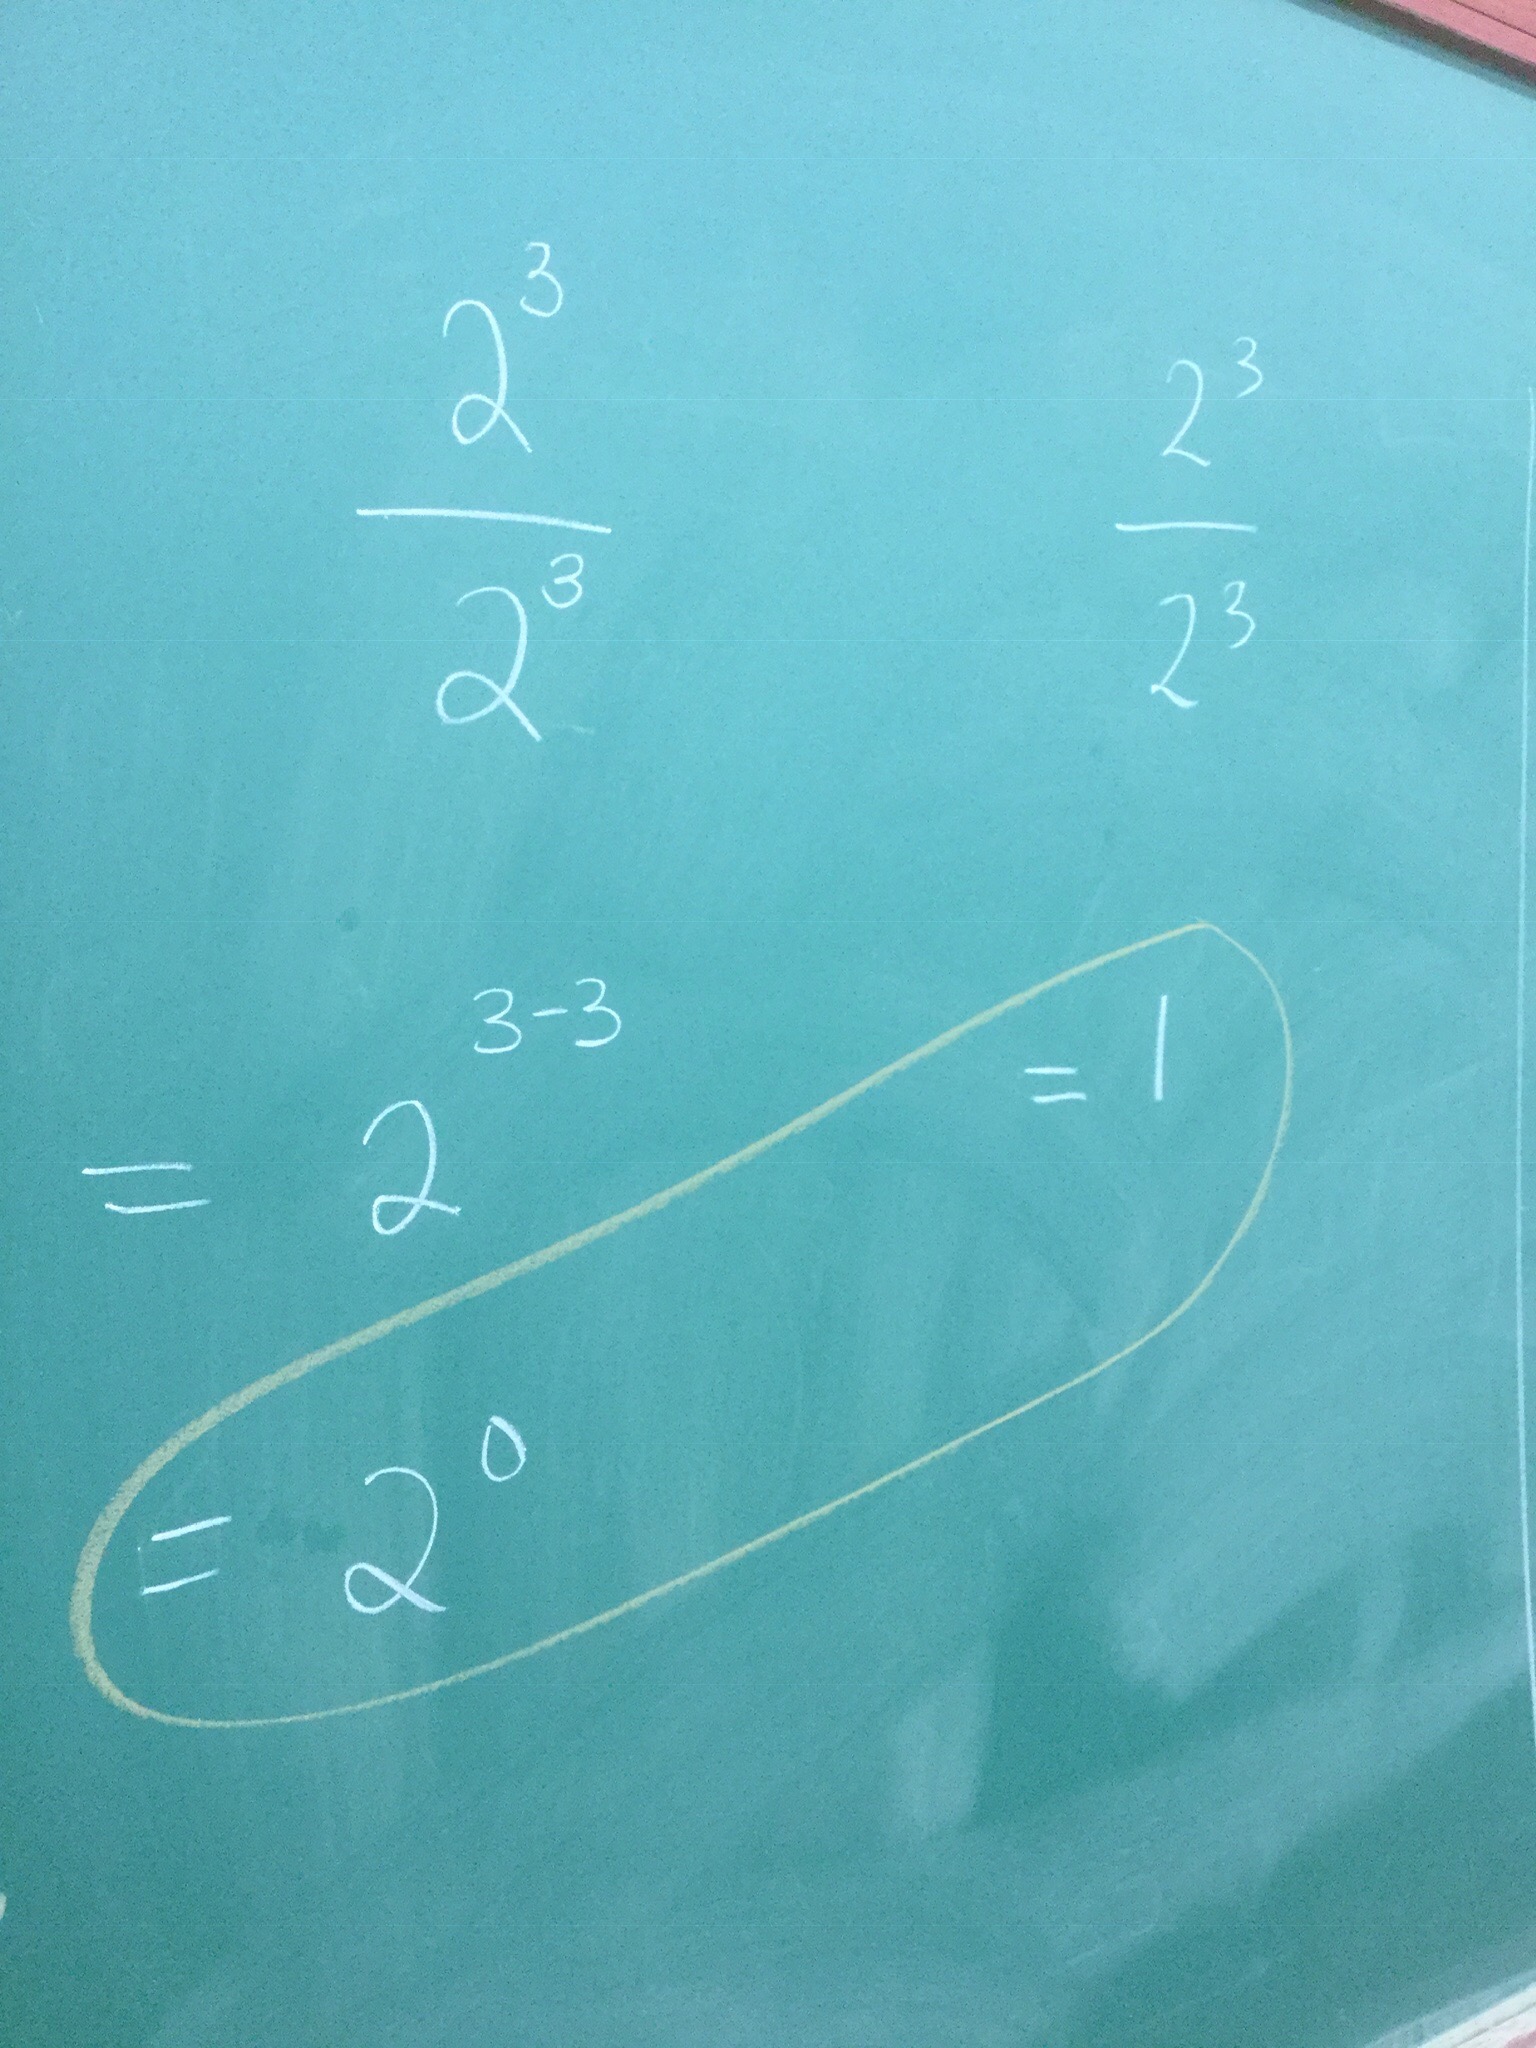
We know that anything that is the same on top and bottom will divide to make 1. We also know that with our exponent laws we can subtract the powers in a division question with the same bases. Using 2 perspectives we get 2 answers which are then equal.
We used similar logic to explain negative exponents.

Patterning to Graphing
Grade 10s continued to work on their patterning activity from a few days ago.
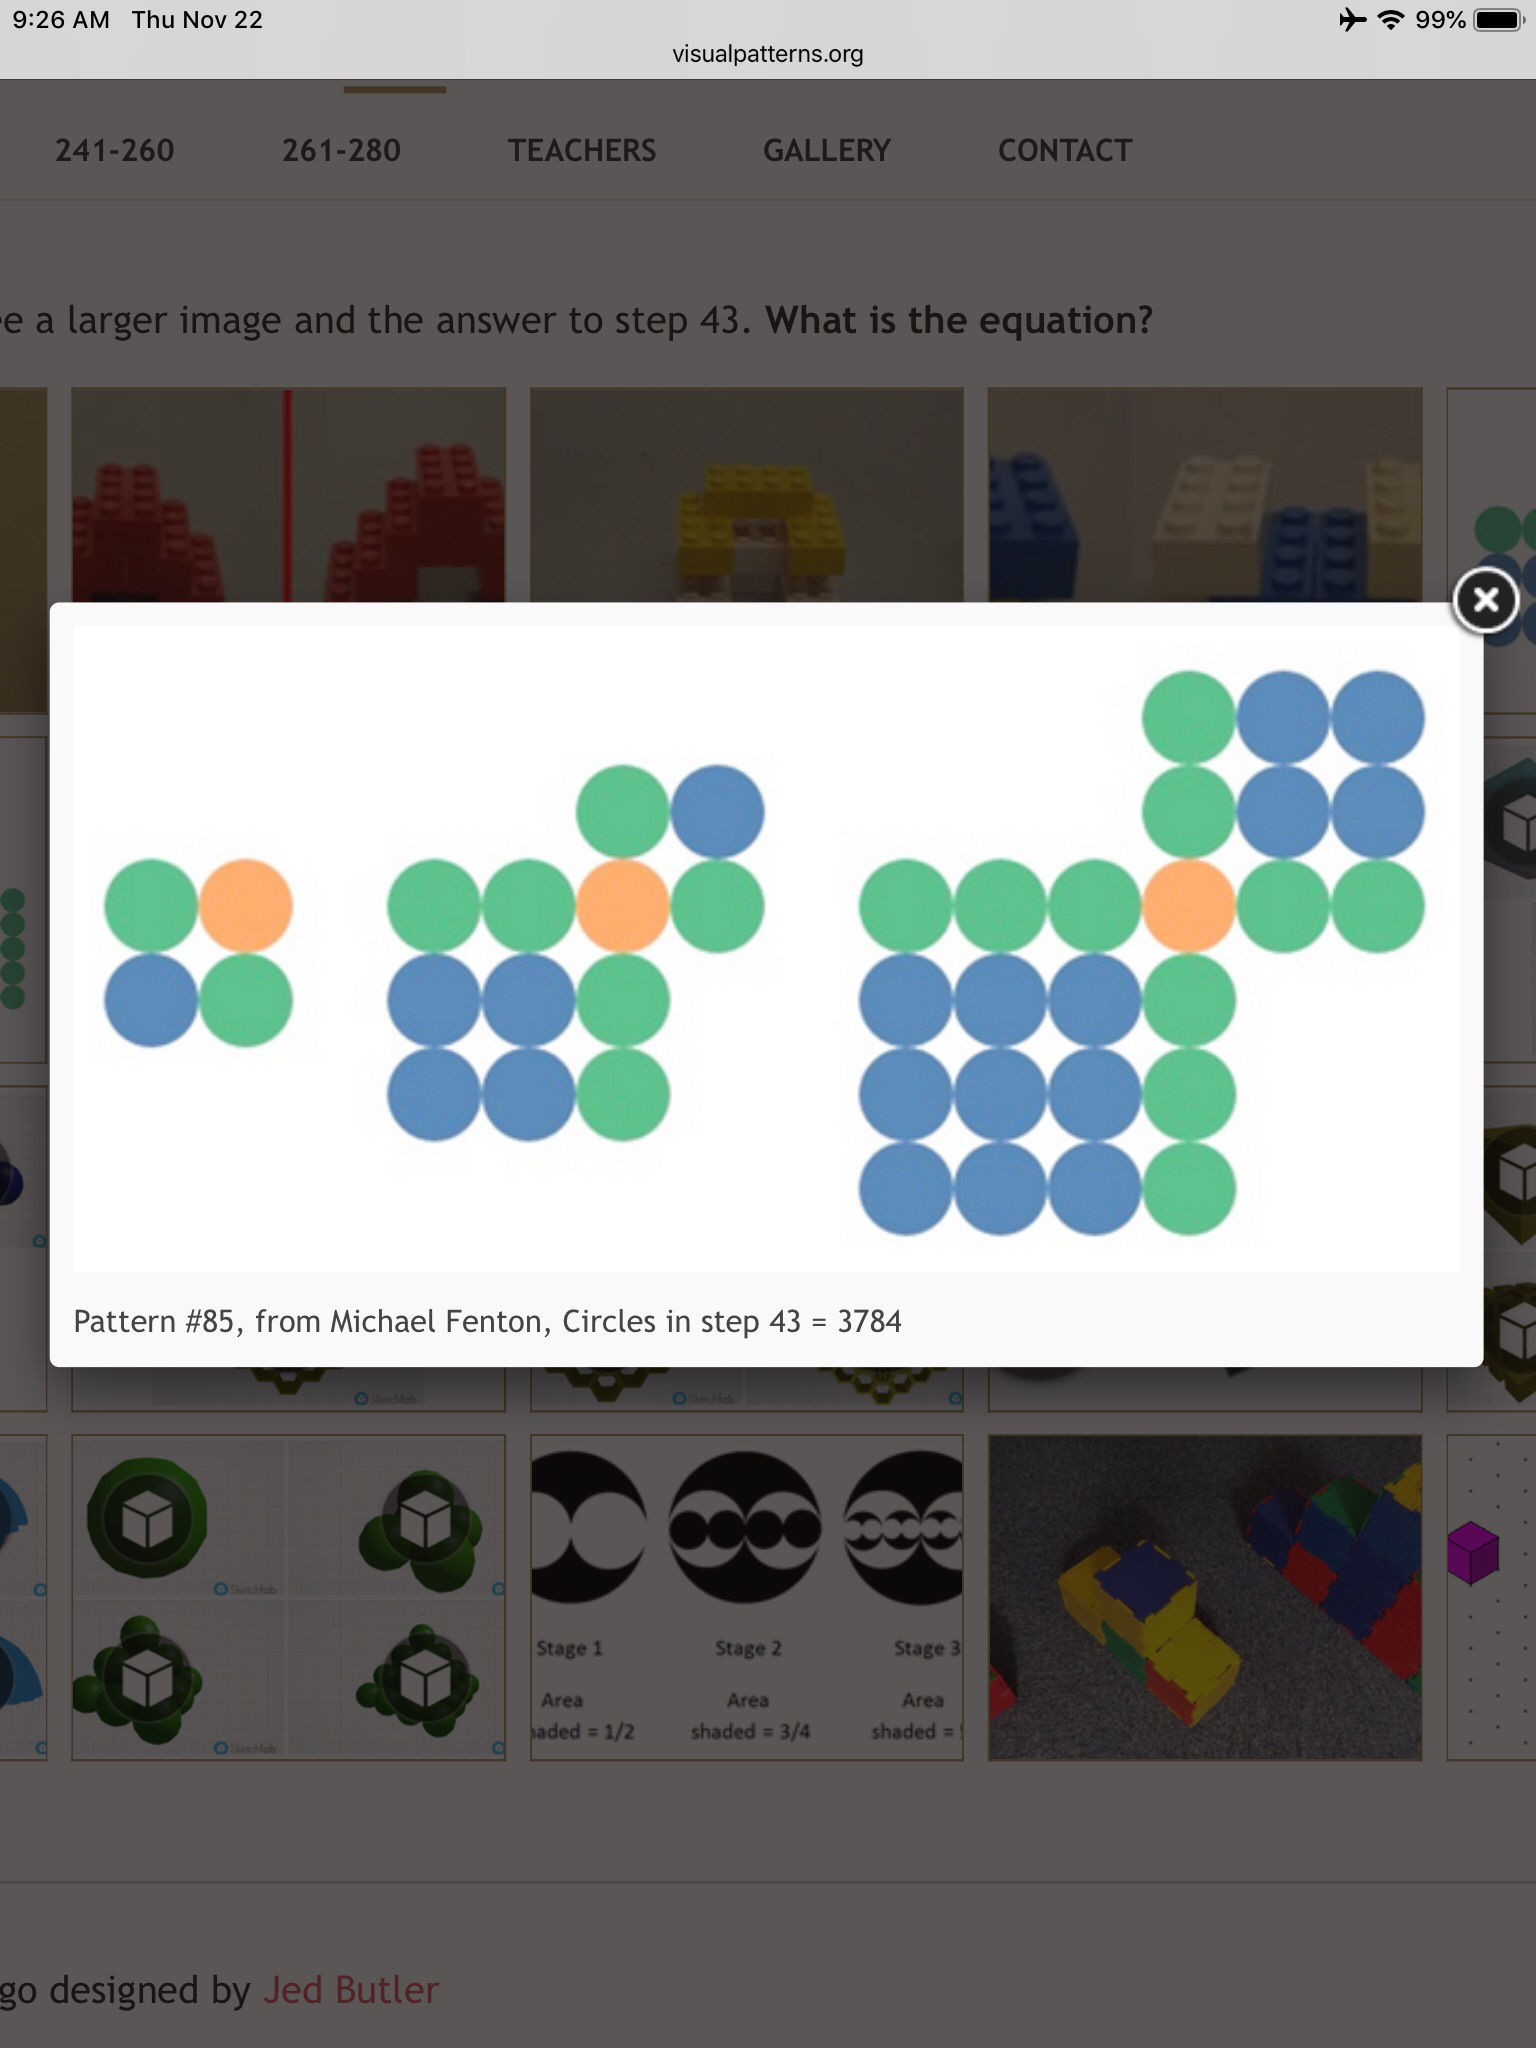
We had previously constructed and graphed the pattern.
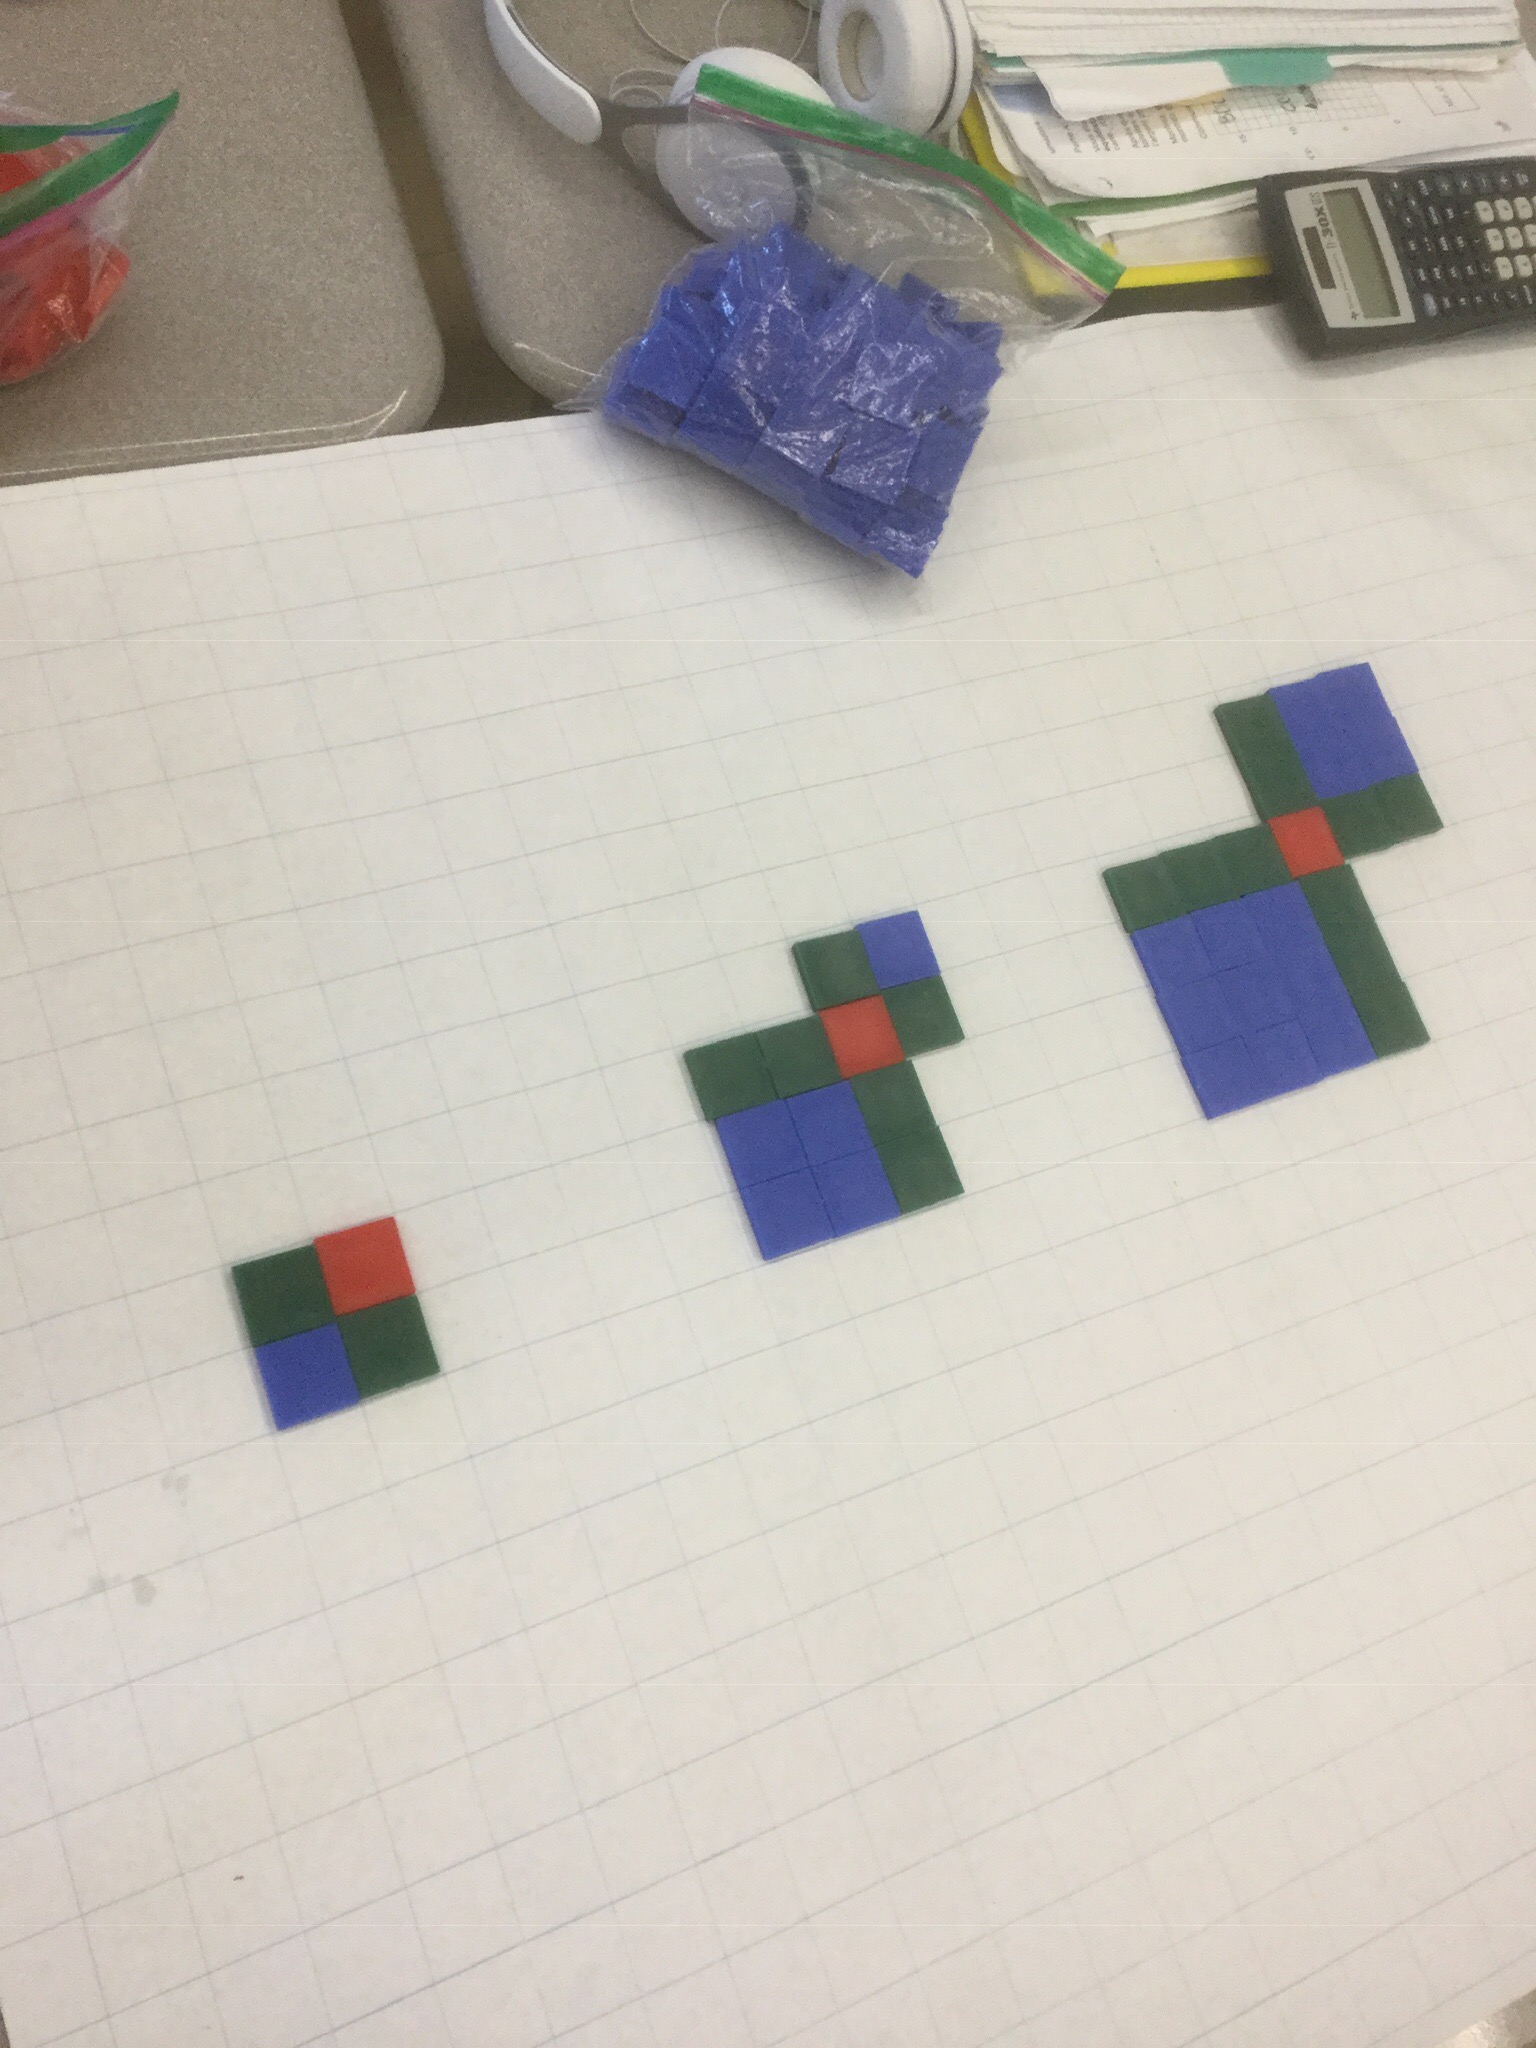
But now we are working on figuring out an equation to model the situation.
We are working from the visual representation, and connecting what we know about the graph from the tables of values. We know the “a” value is half of the second differences, and we know that in this case figure 0 is 0, so our constant is 0.
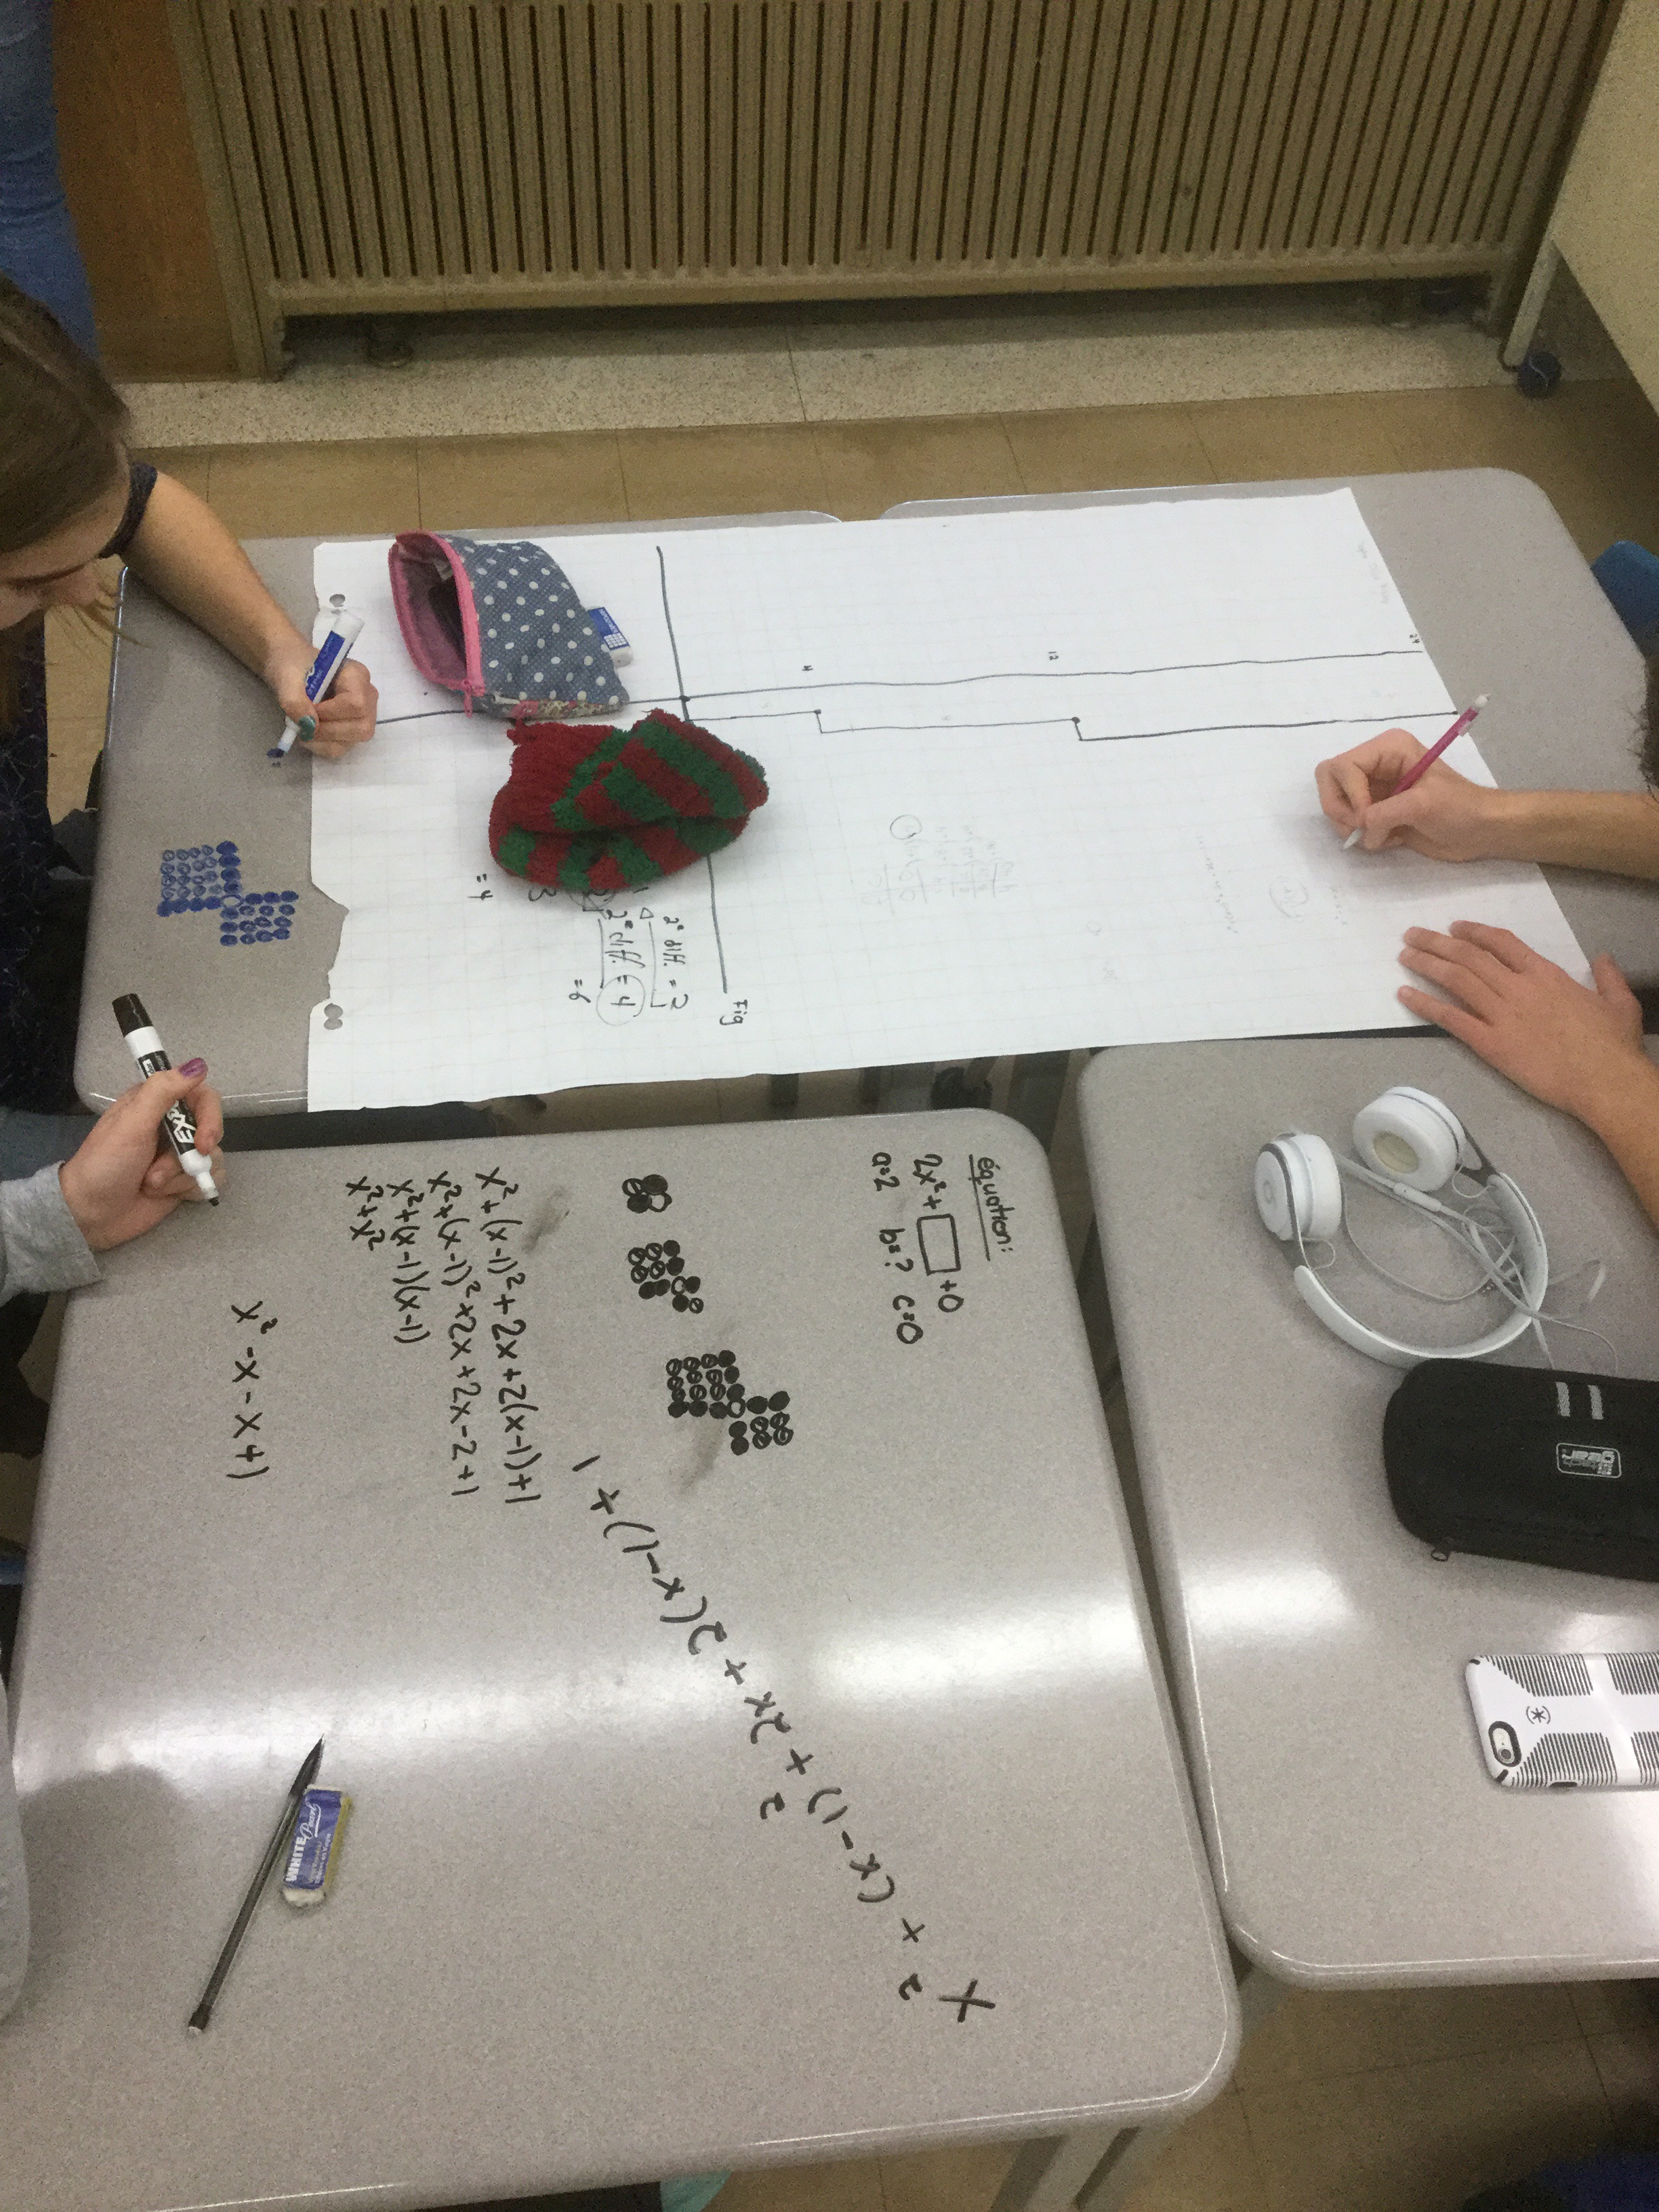
Some of us are working on simplifying complex equations…
If we use the colours as a way to group things….
We get a long equation!
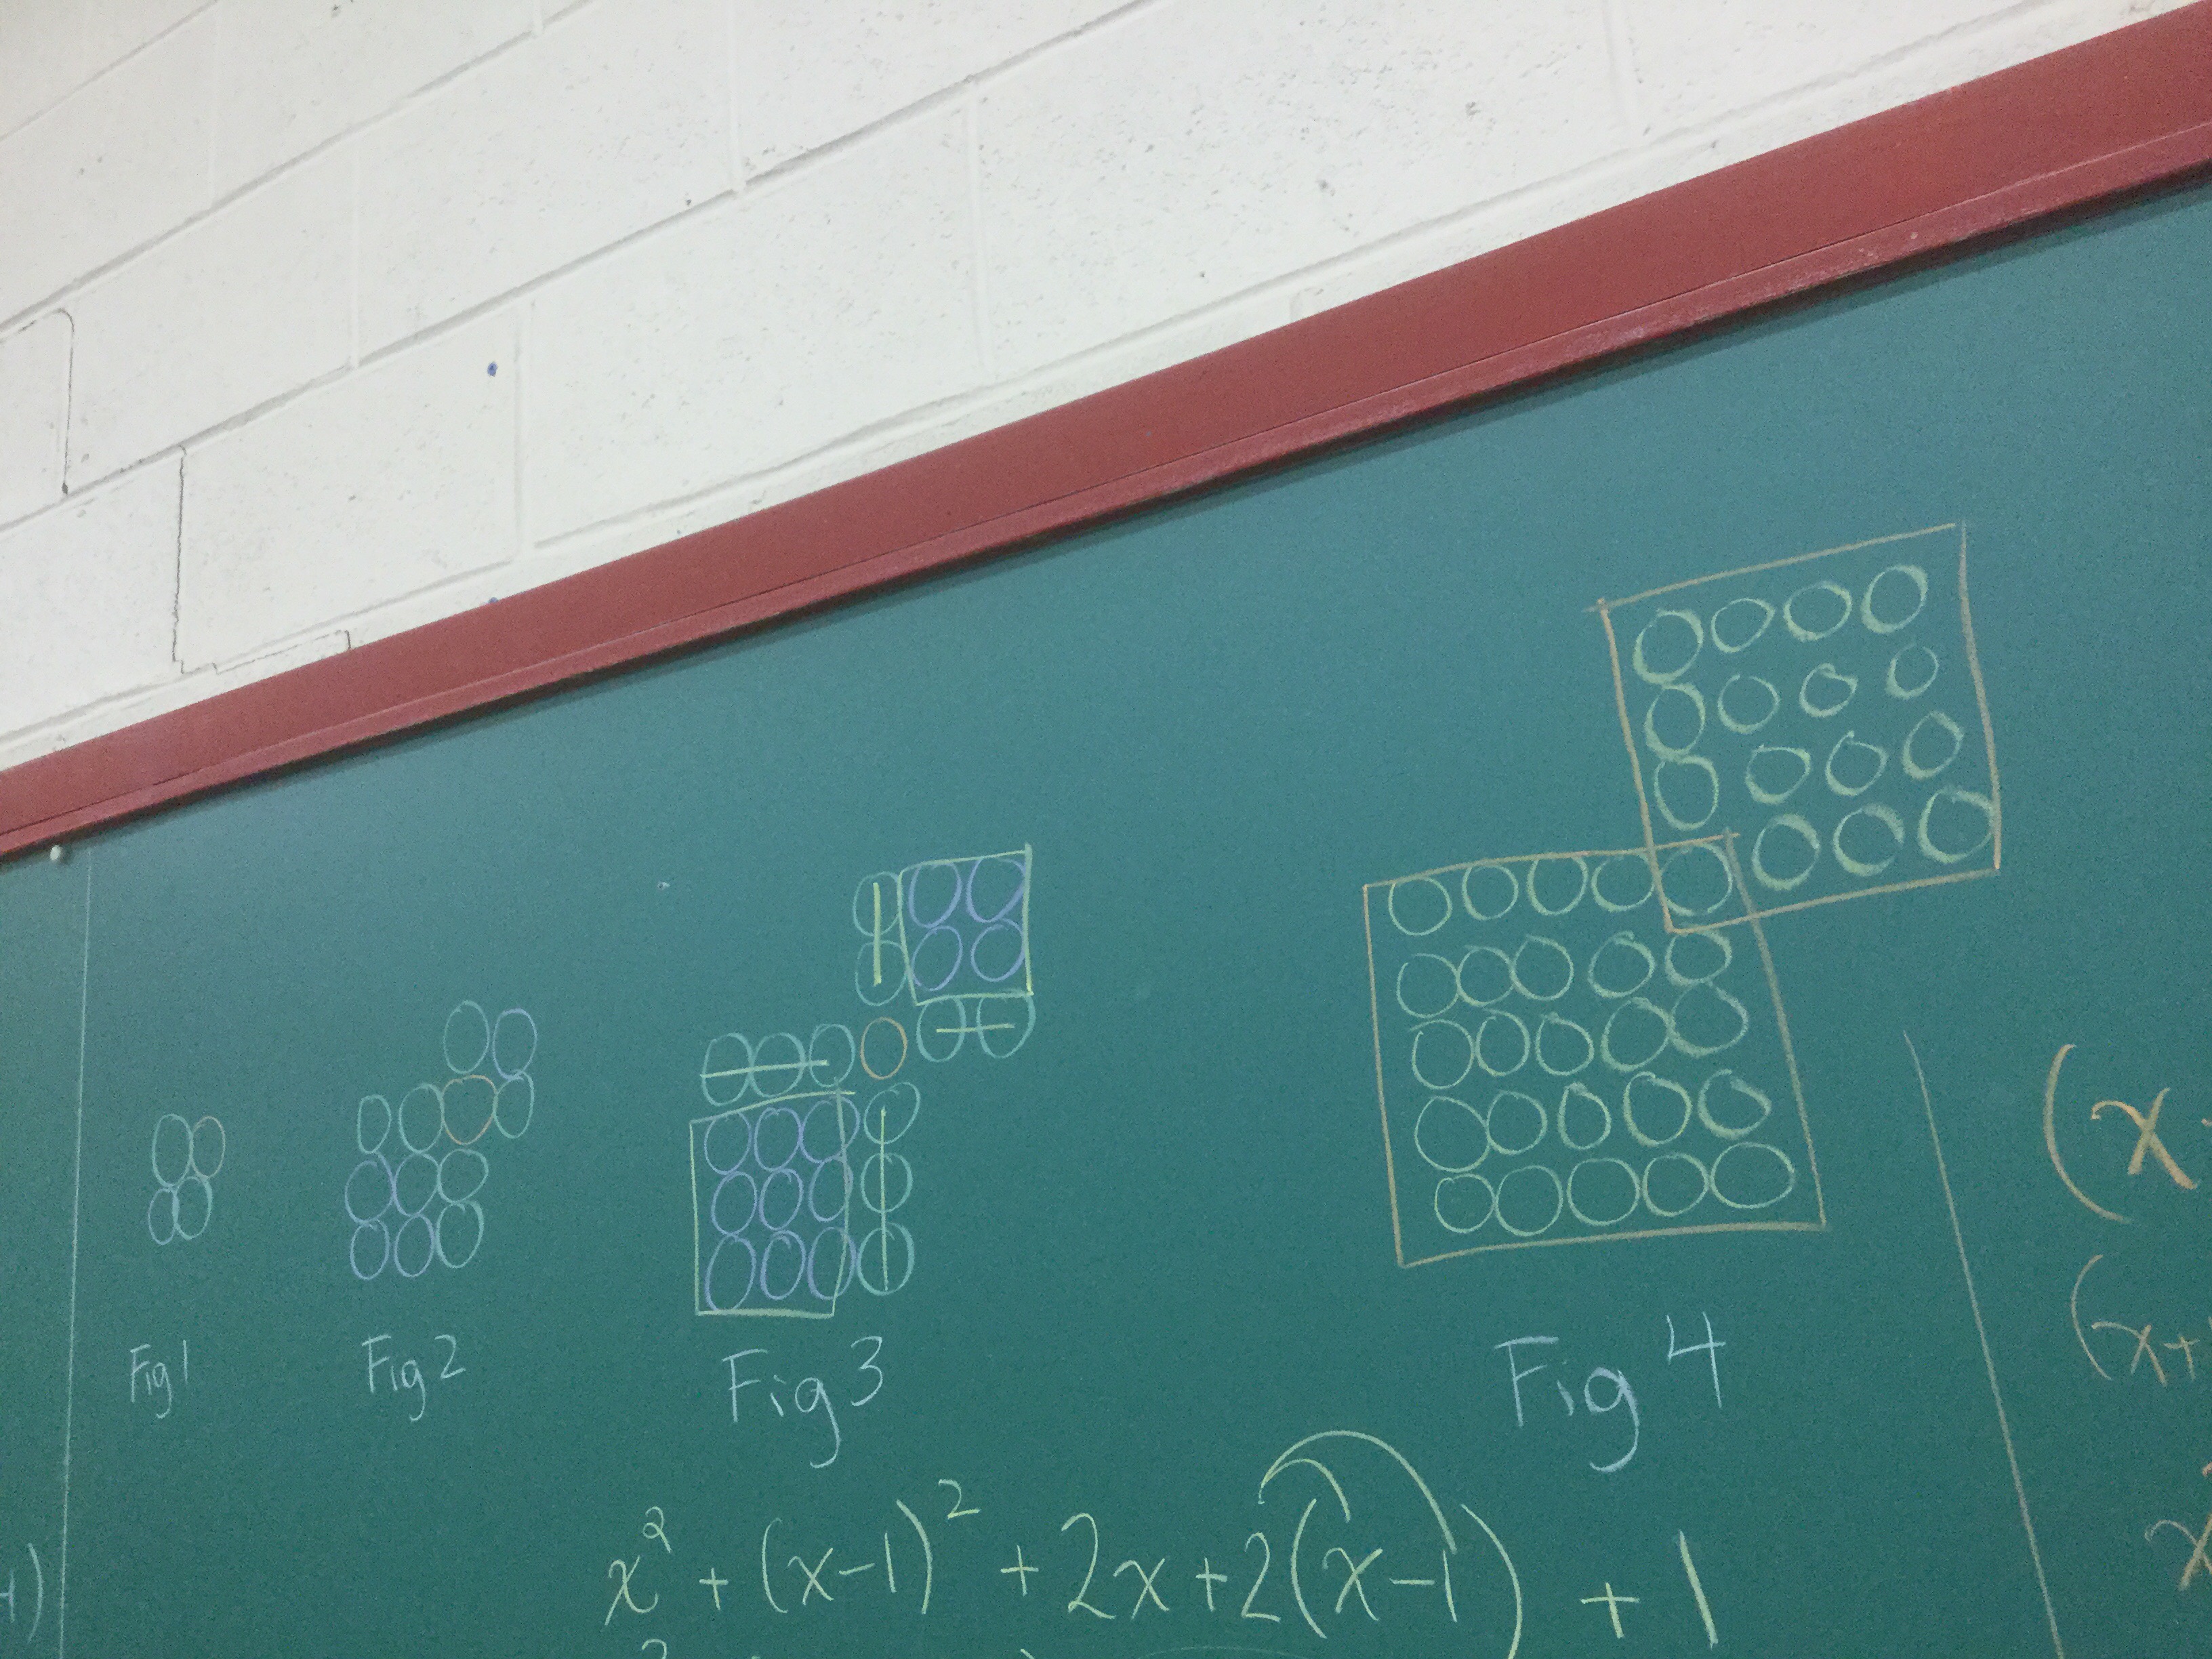
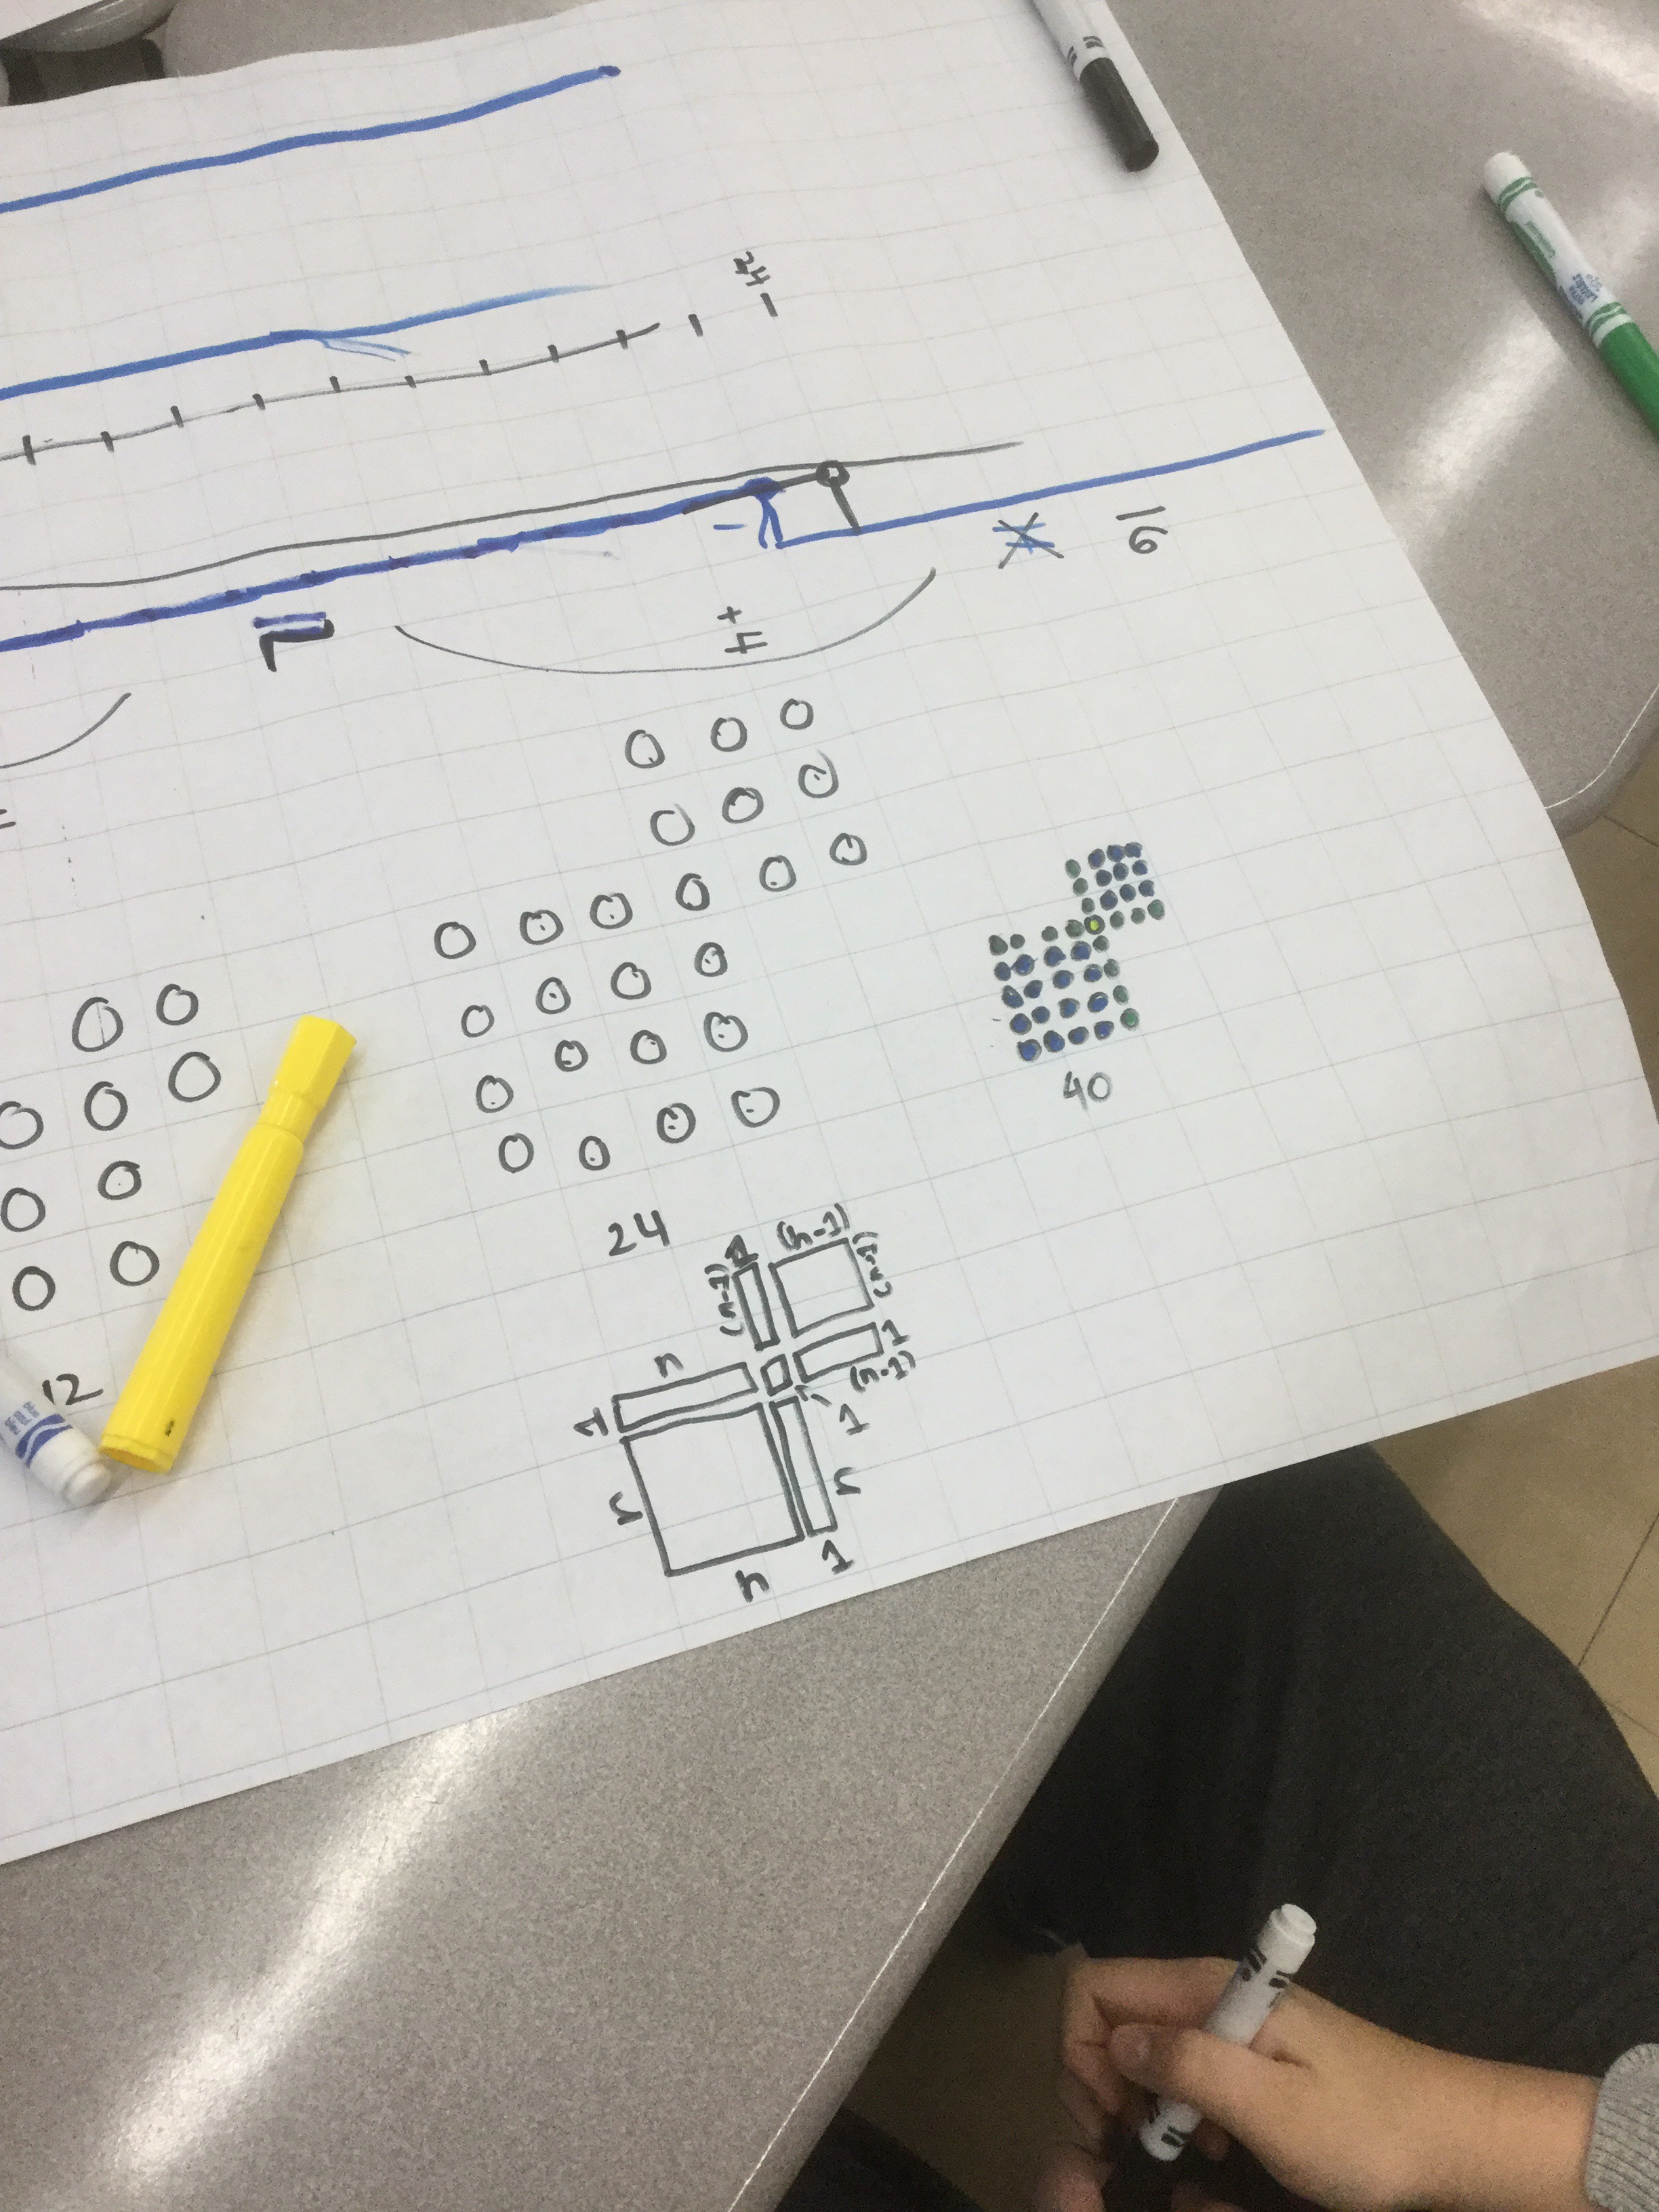
If we ignore the colour…

We get a simpler equation
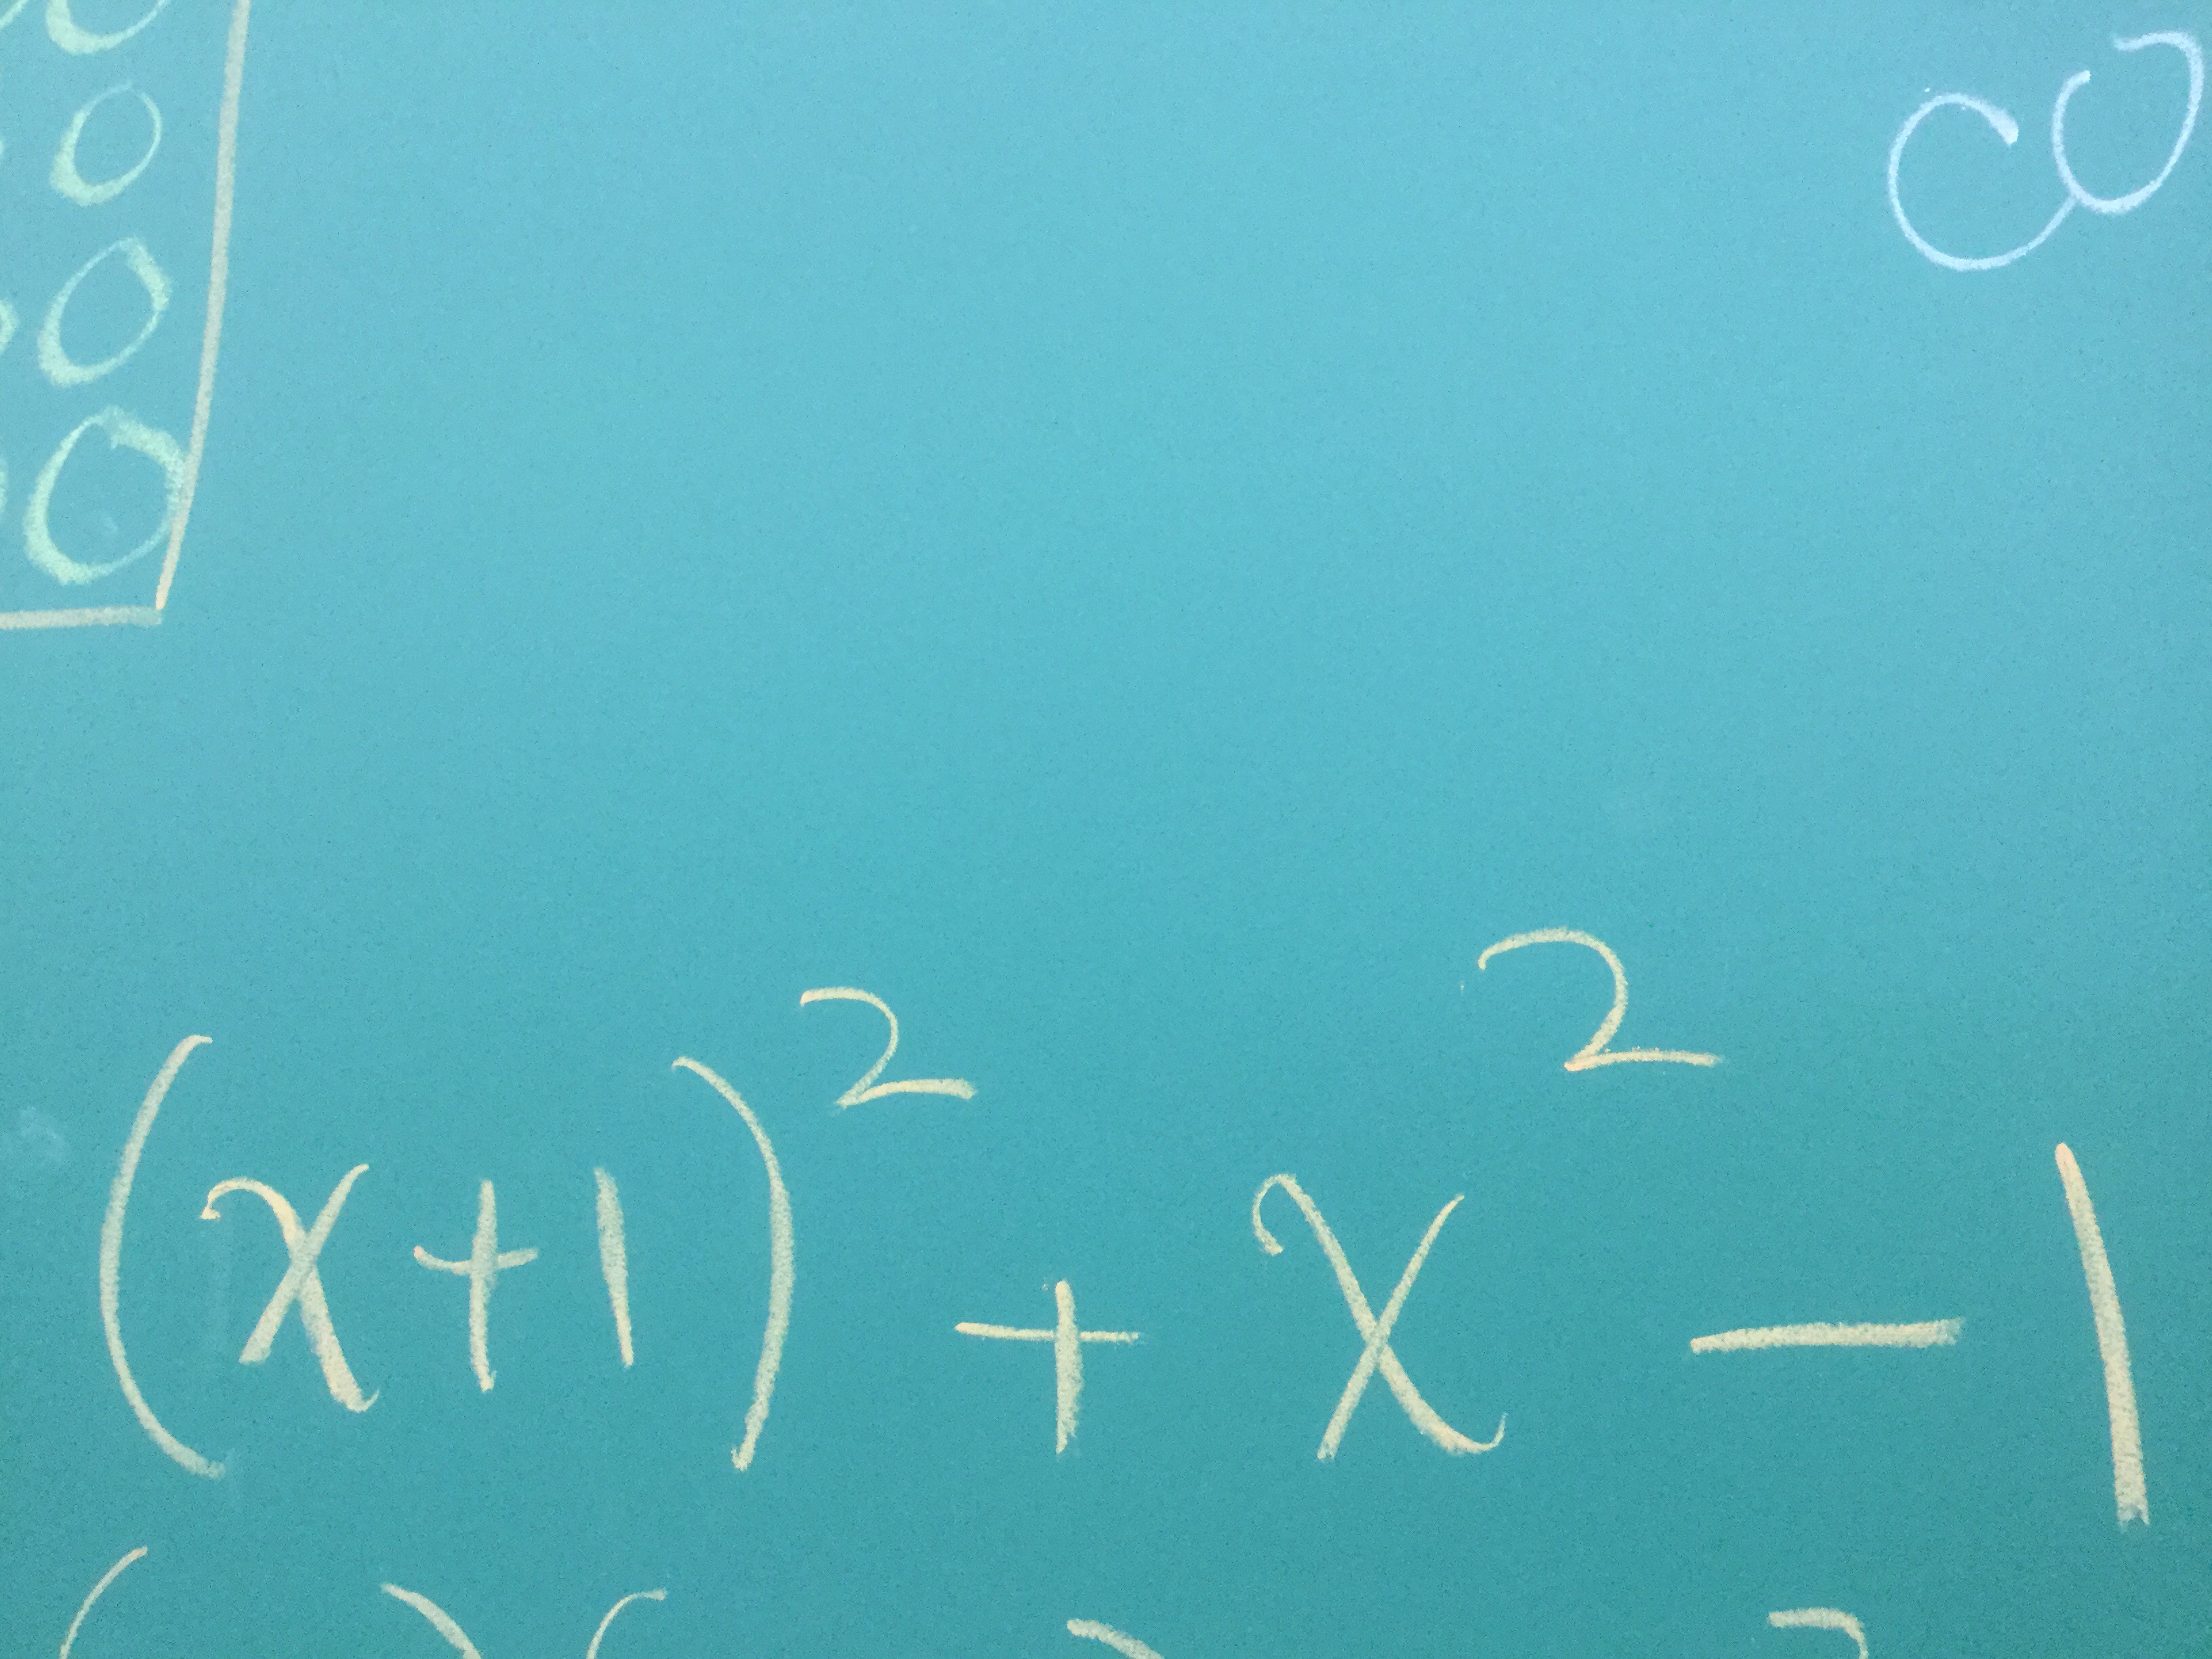
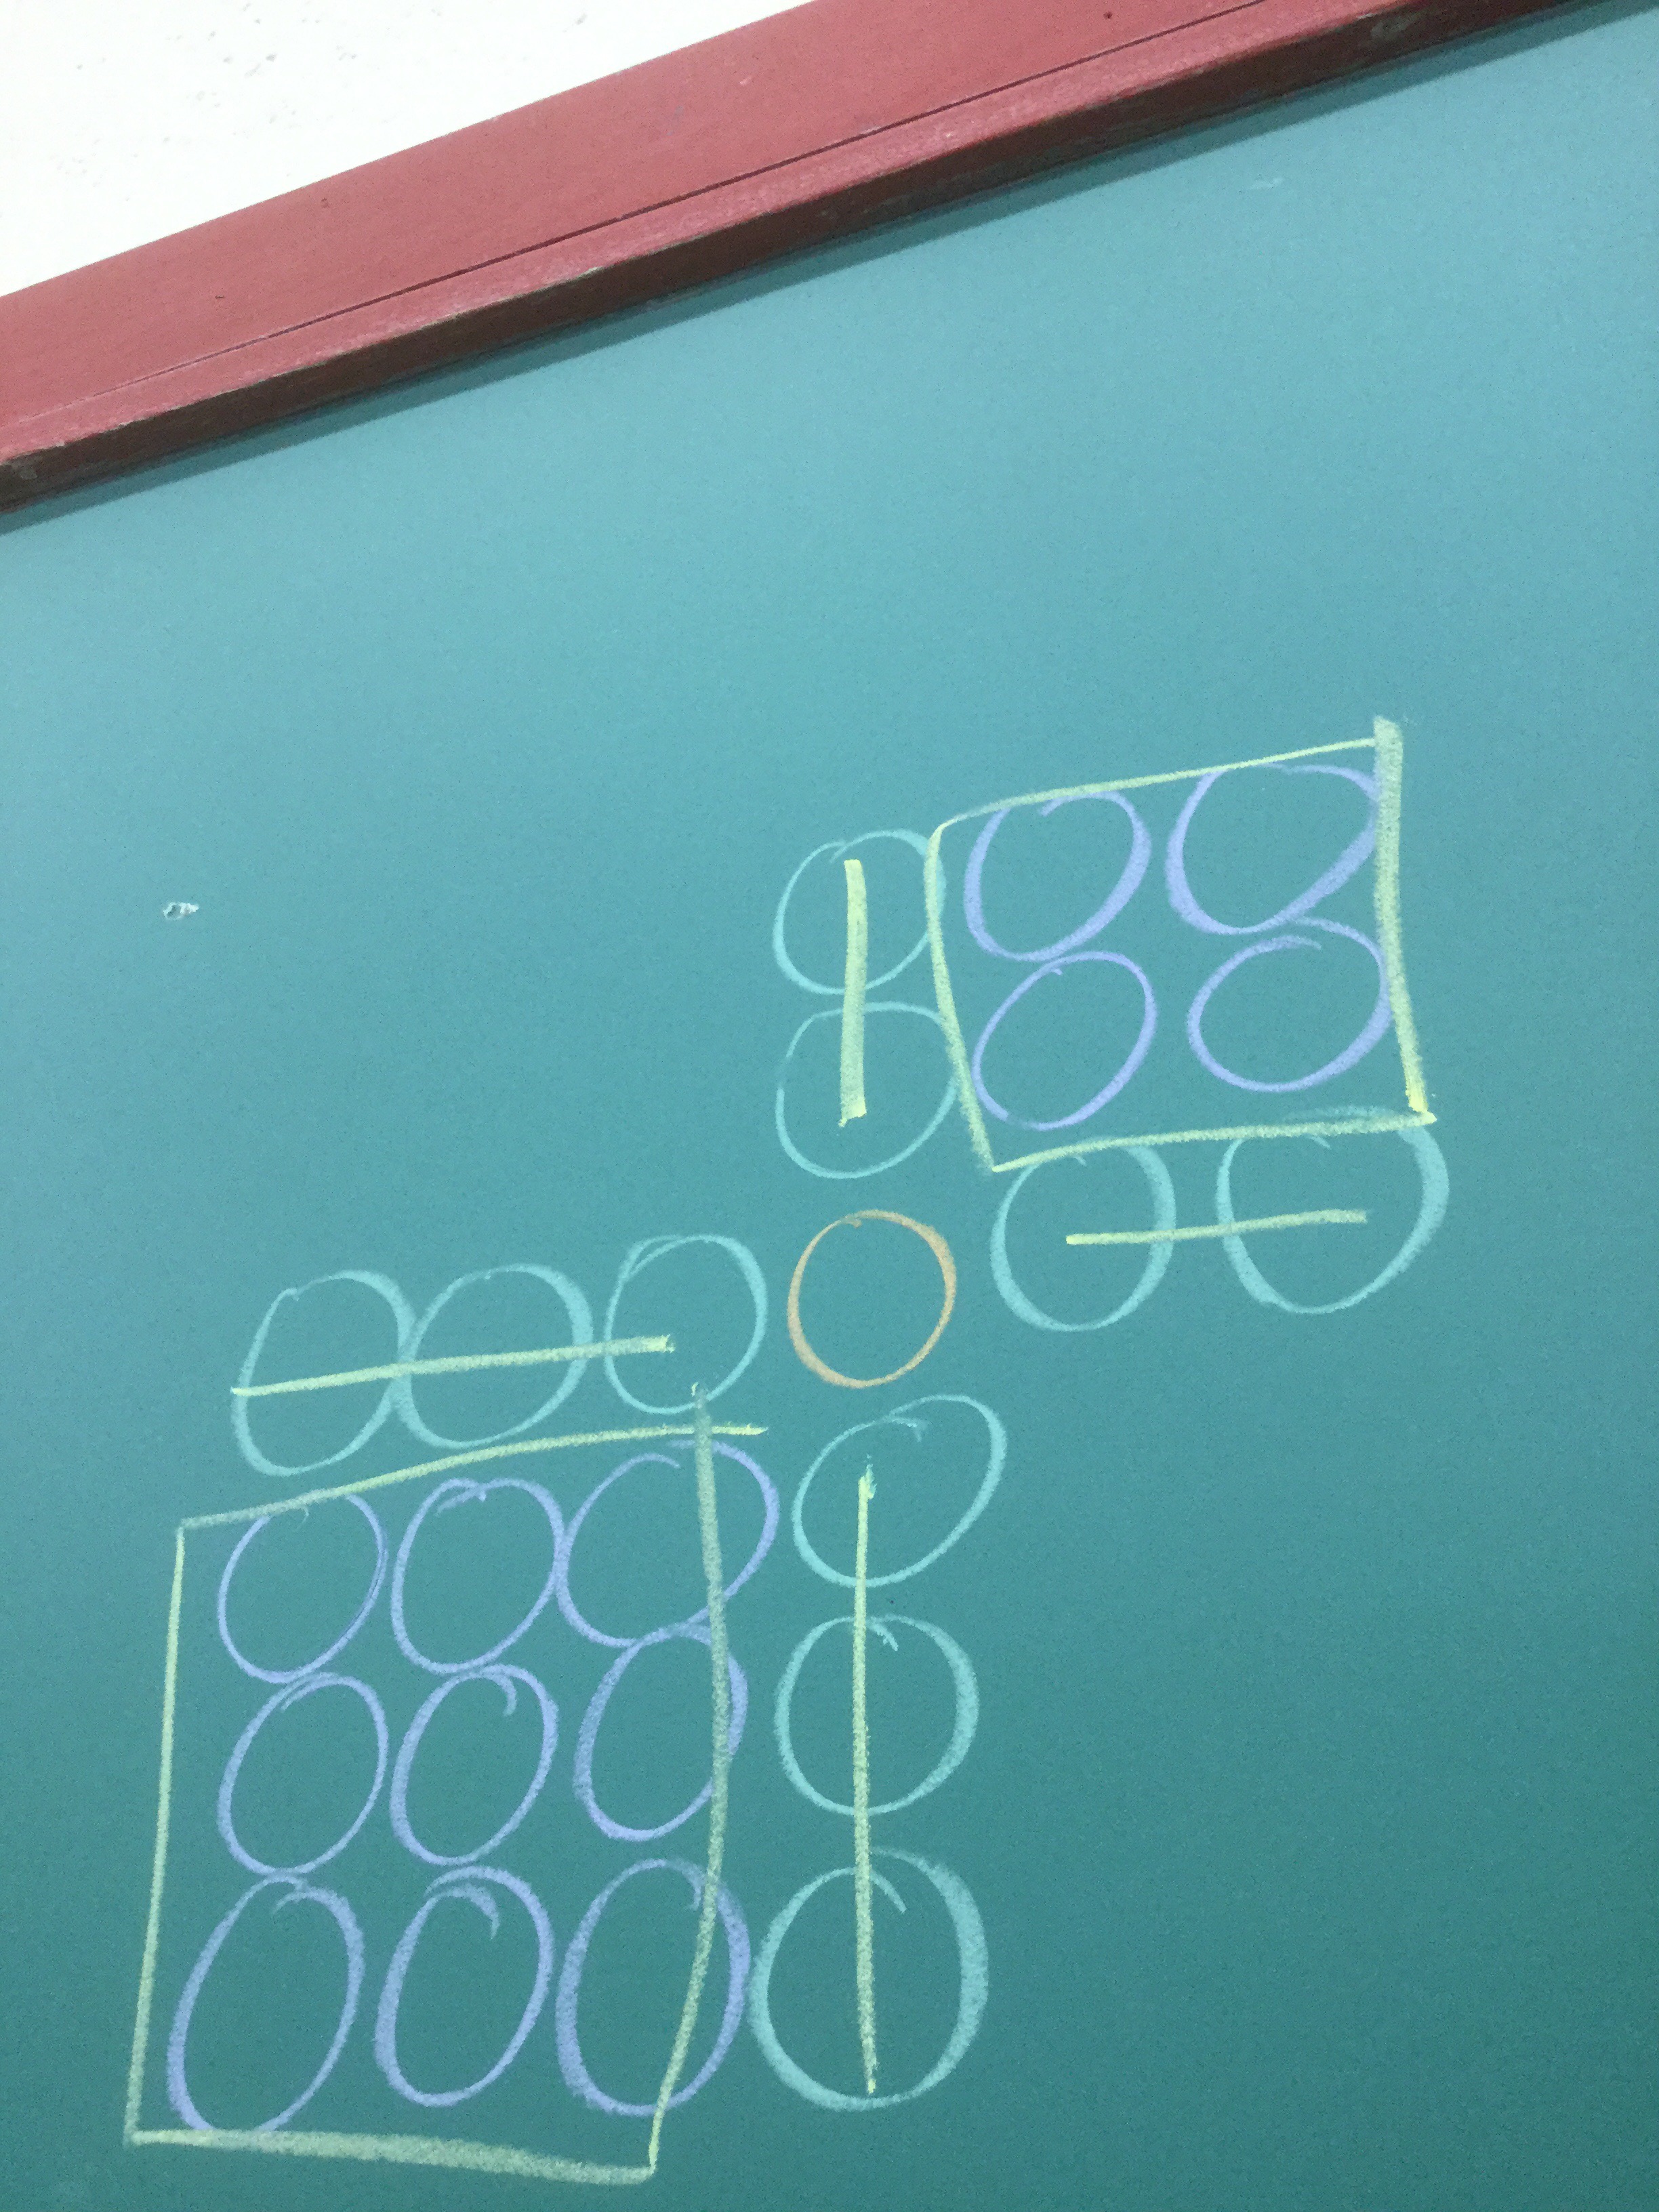
If we are creative and try to rearrange the circles…
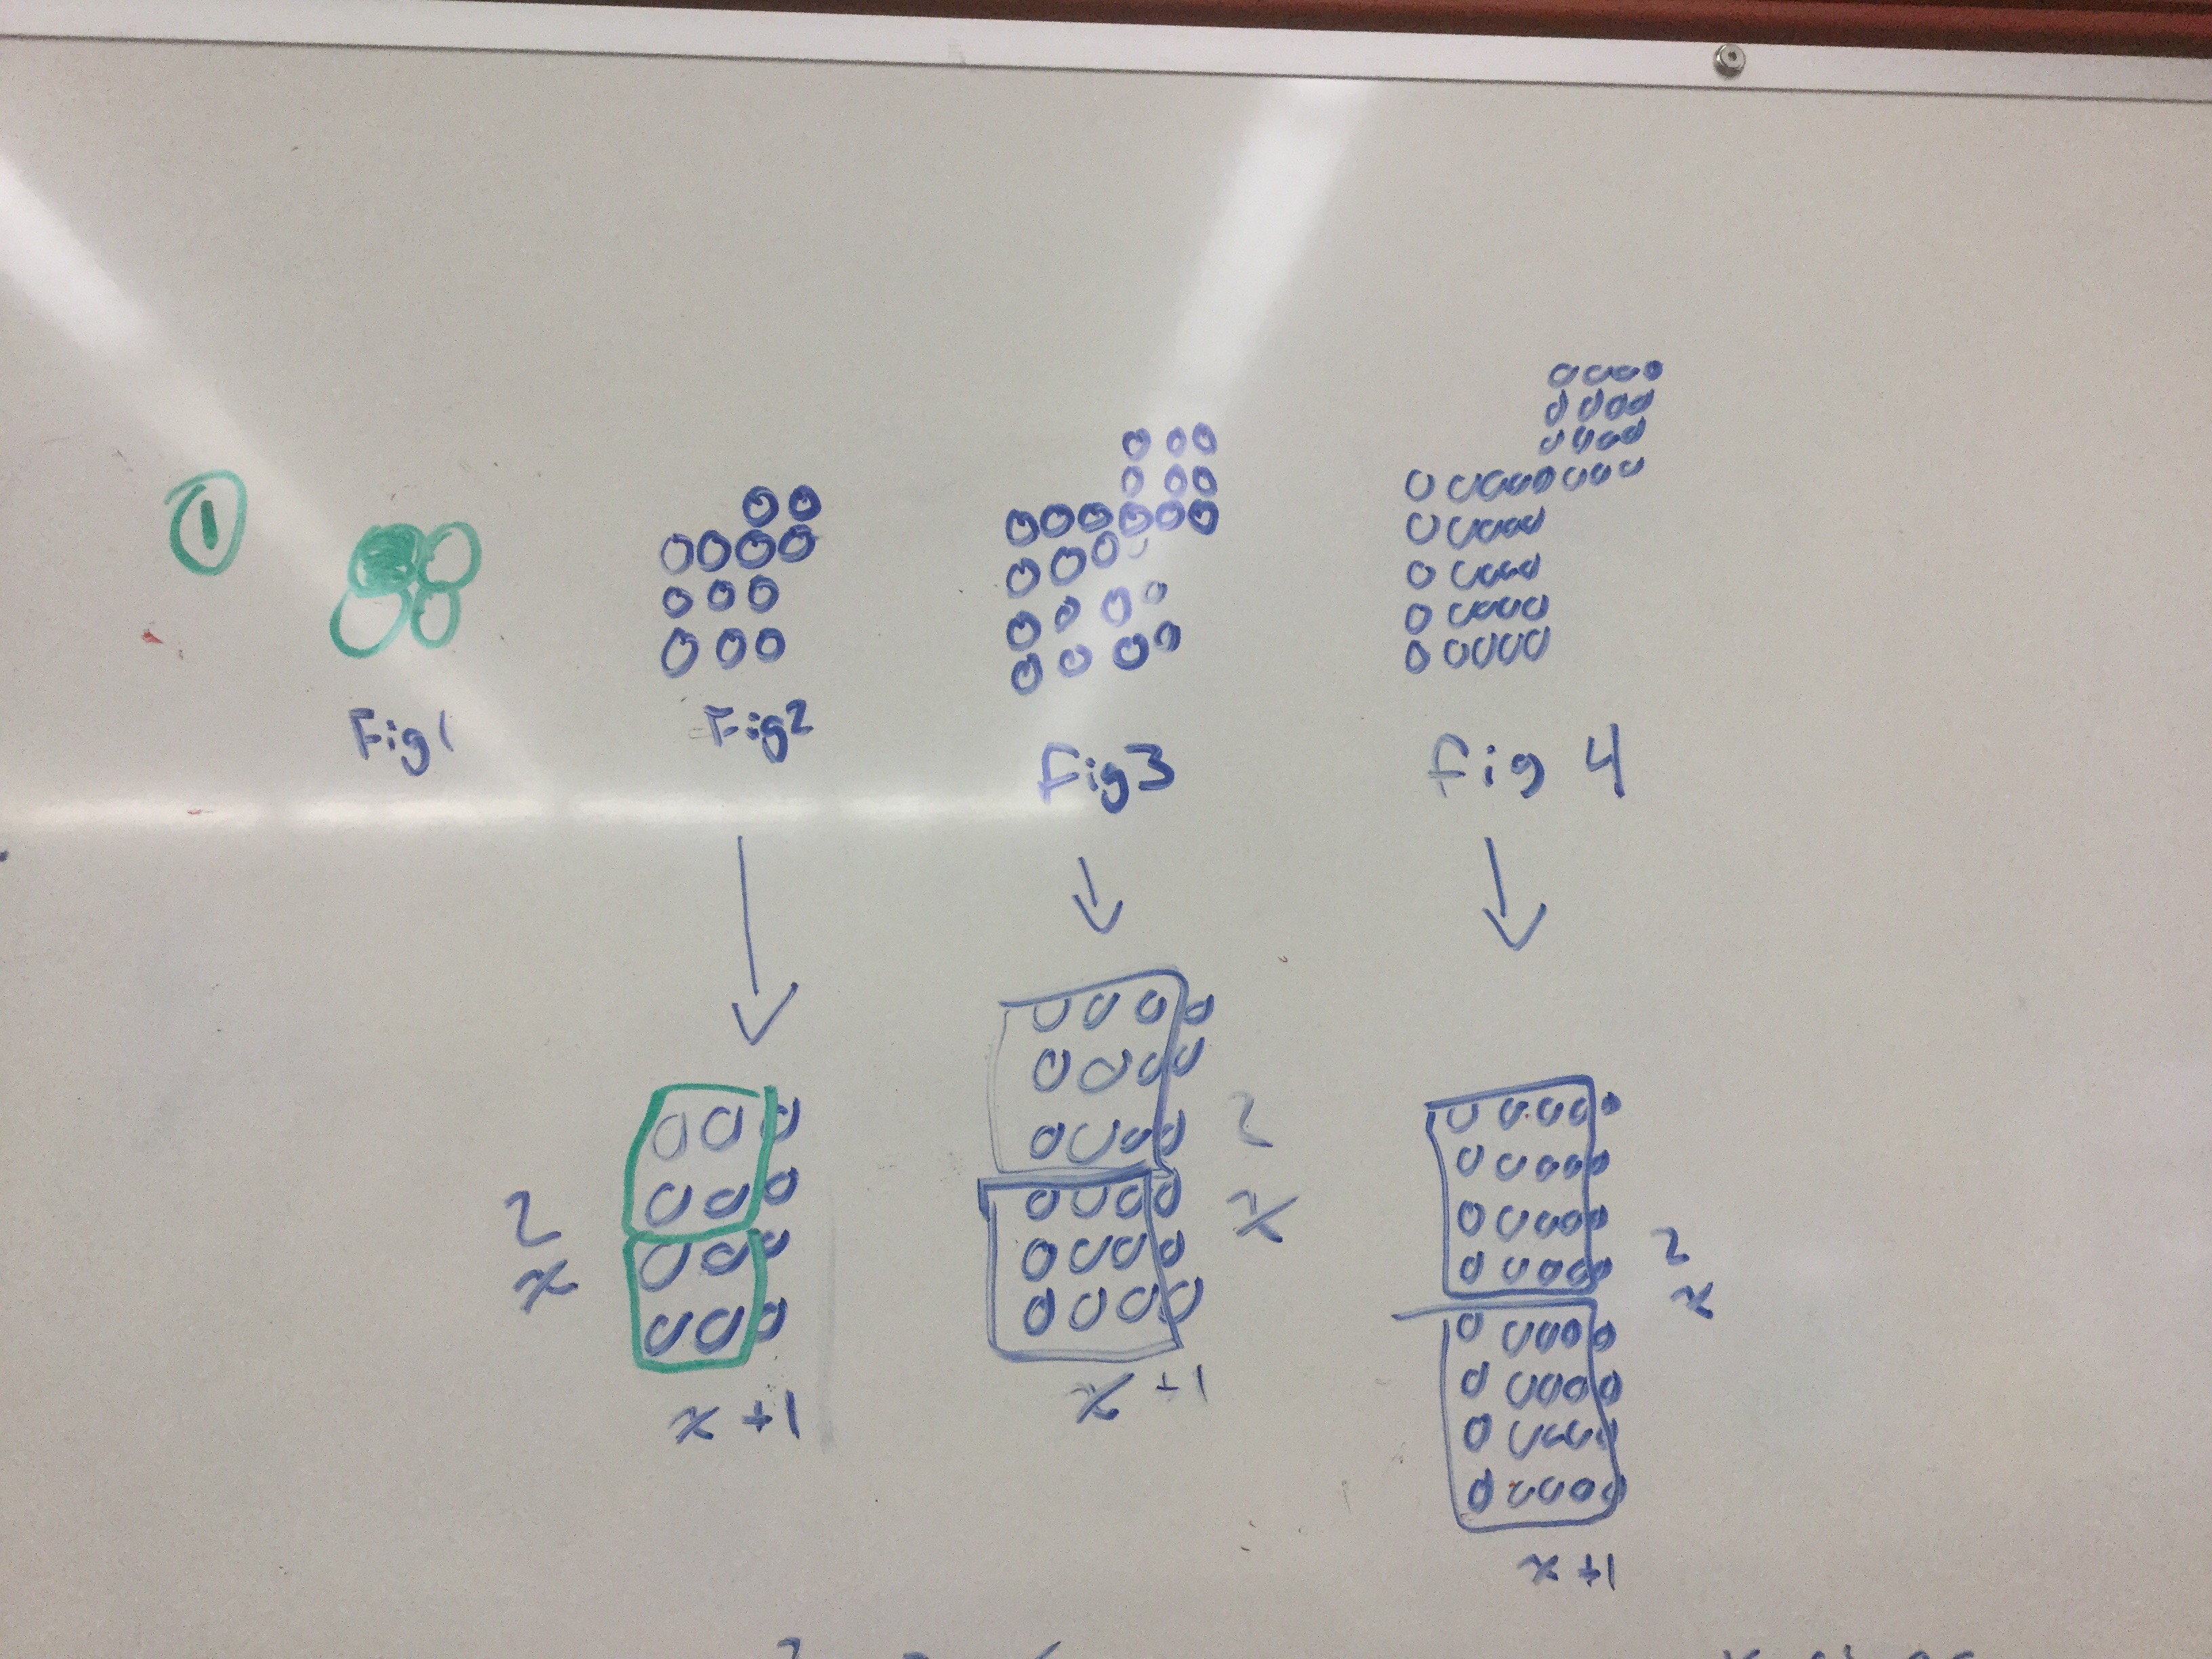
We can create rectangles that have dimensions 2x and (x+1) so that leads us to a simple equation! Y=(2x)(x+1)
Here’s another way to factor that expression
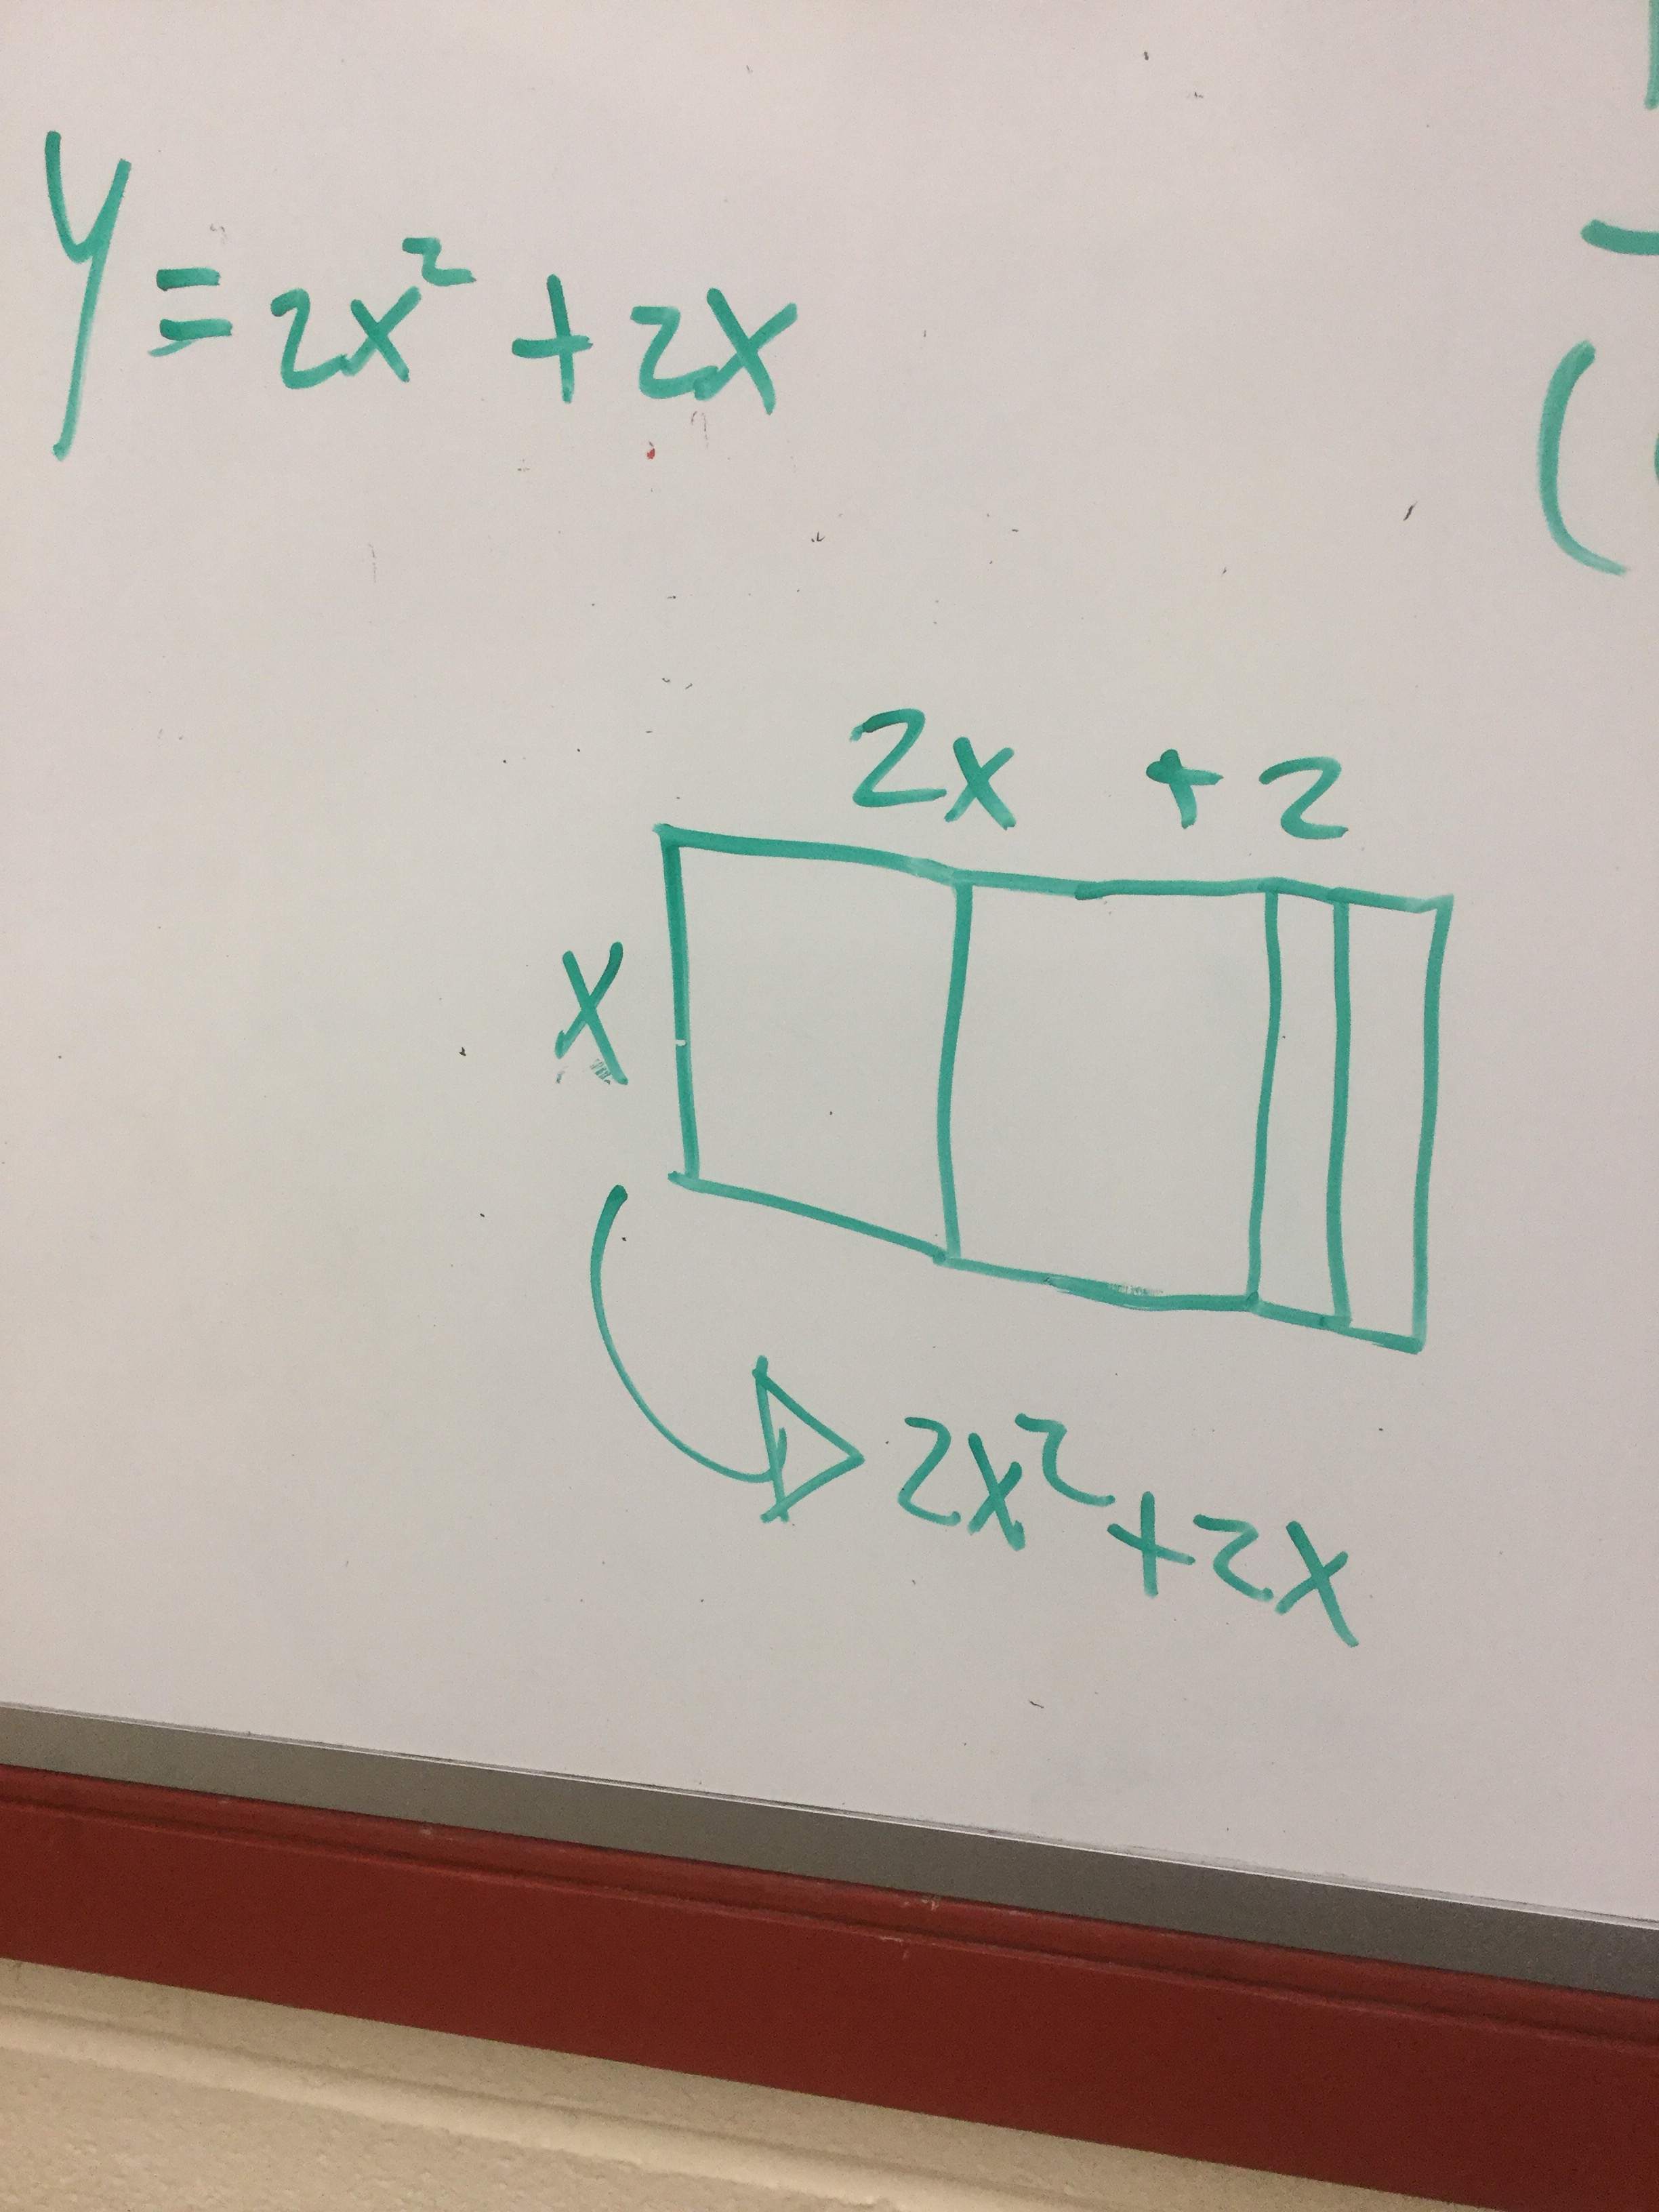
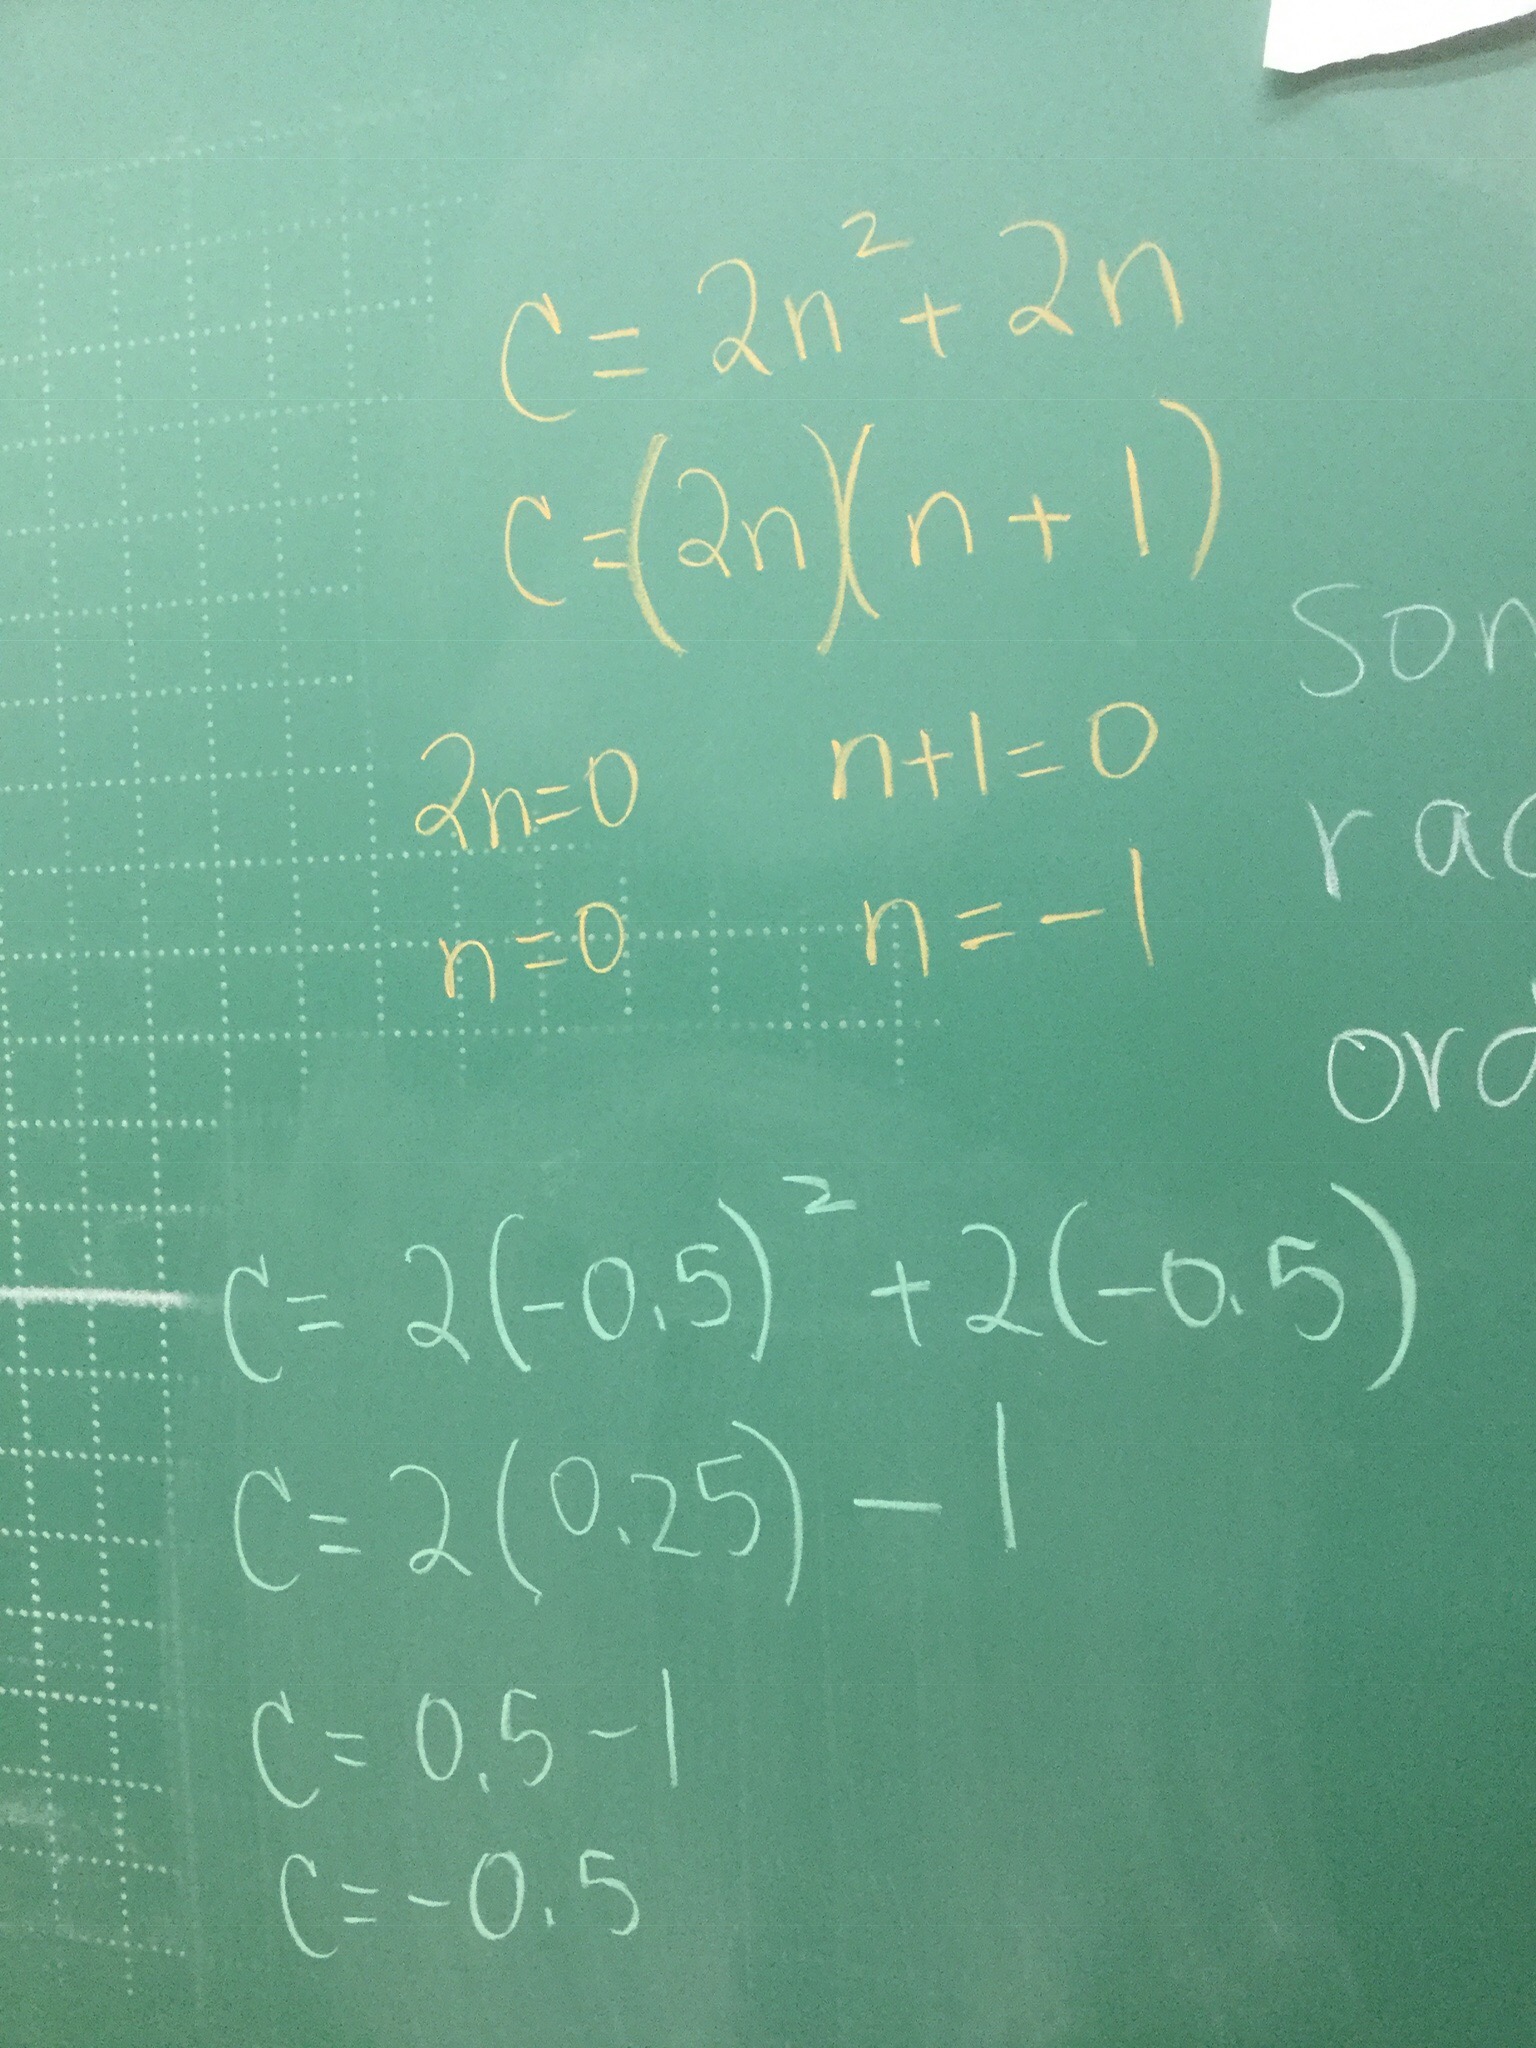
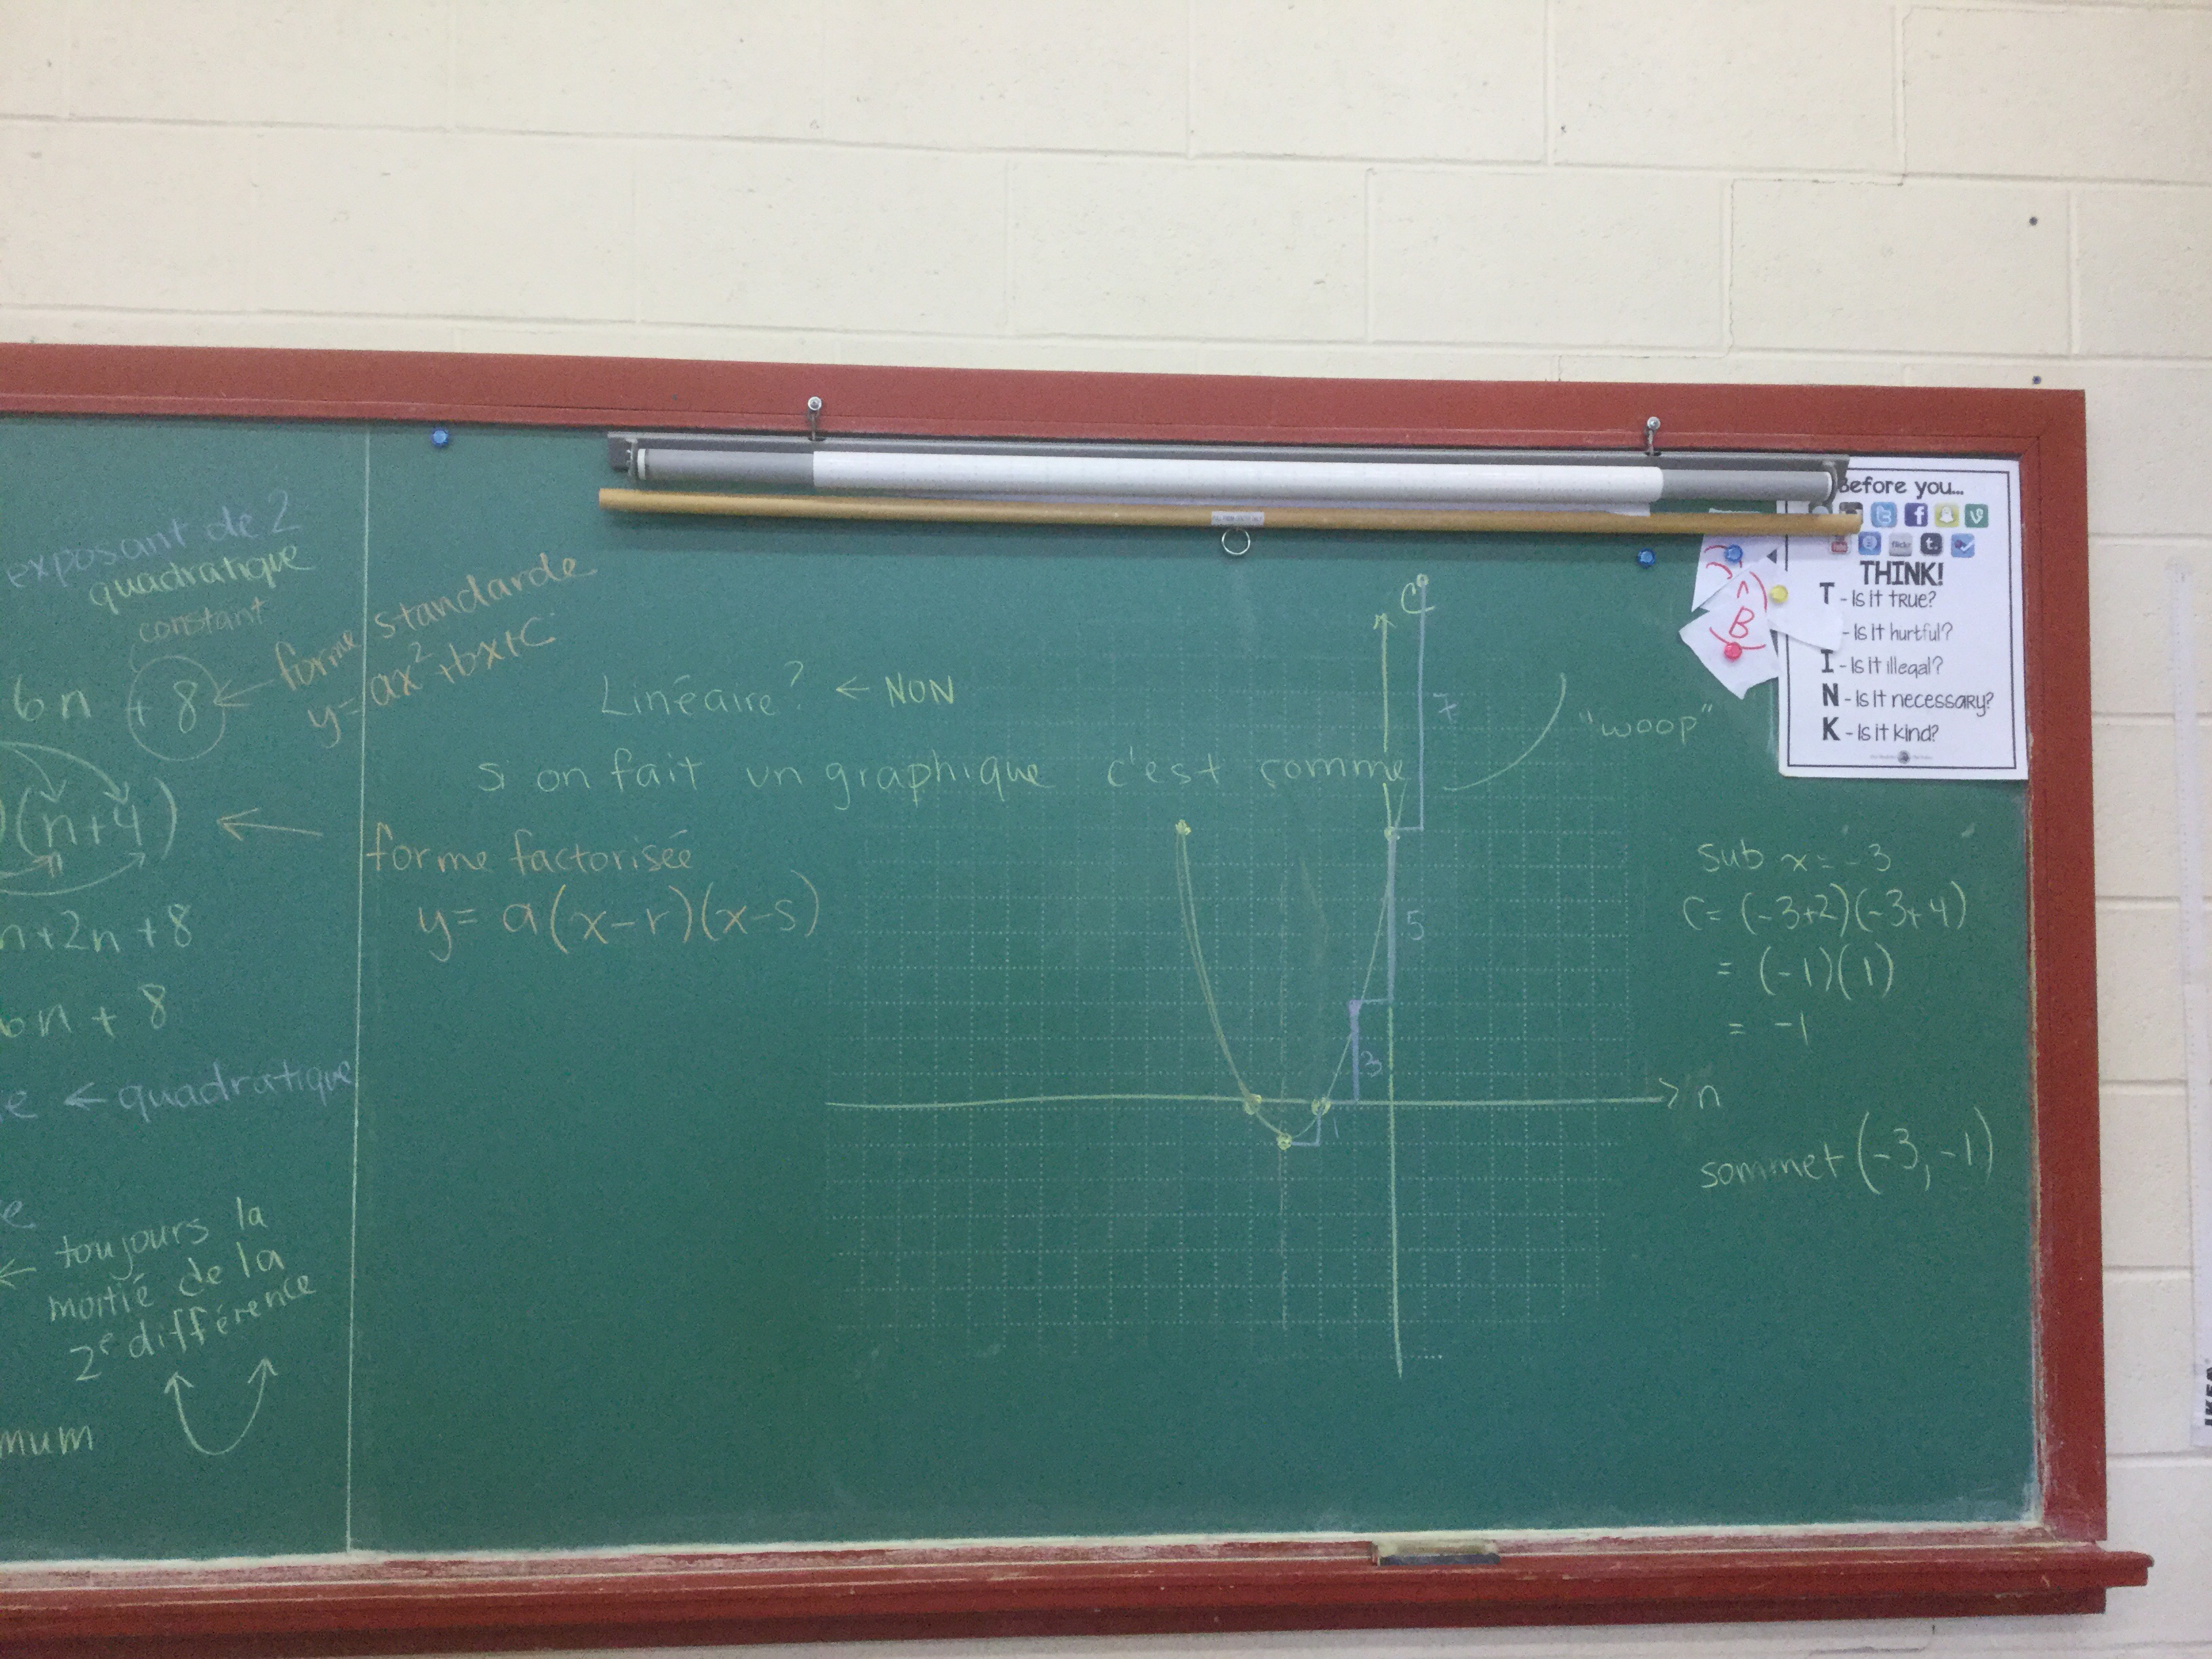
Working from our table of values we can determine the a and c values…


We can substitute any point as x and y and calculate b, and then we can factor, determine the roots, and then the vertex (sommet), and draw the graph.


This is the next one we are working on: here are figures 1-4

Taking up our work
Today grade 9s received their summative and formative from last week. We took up questions and worked on building our algebra skills.
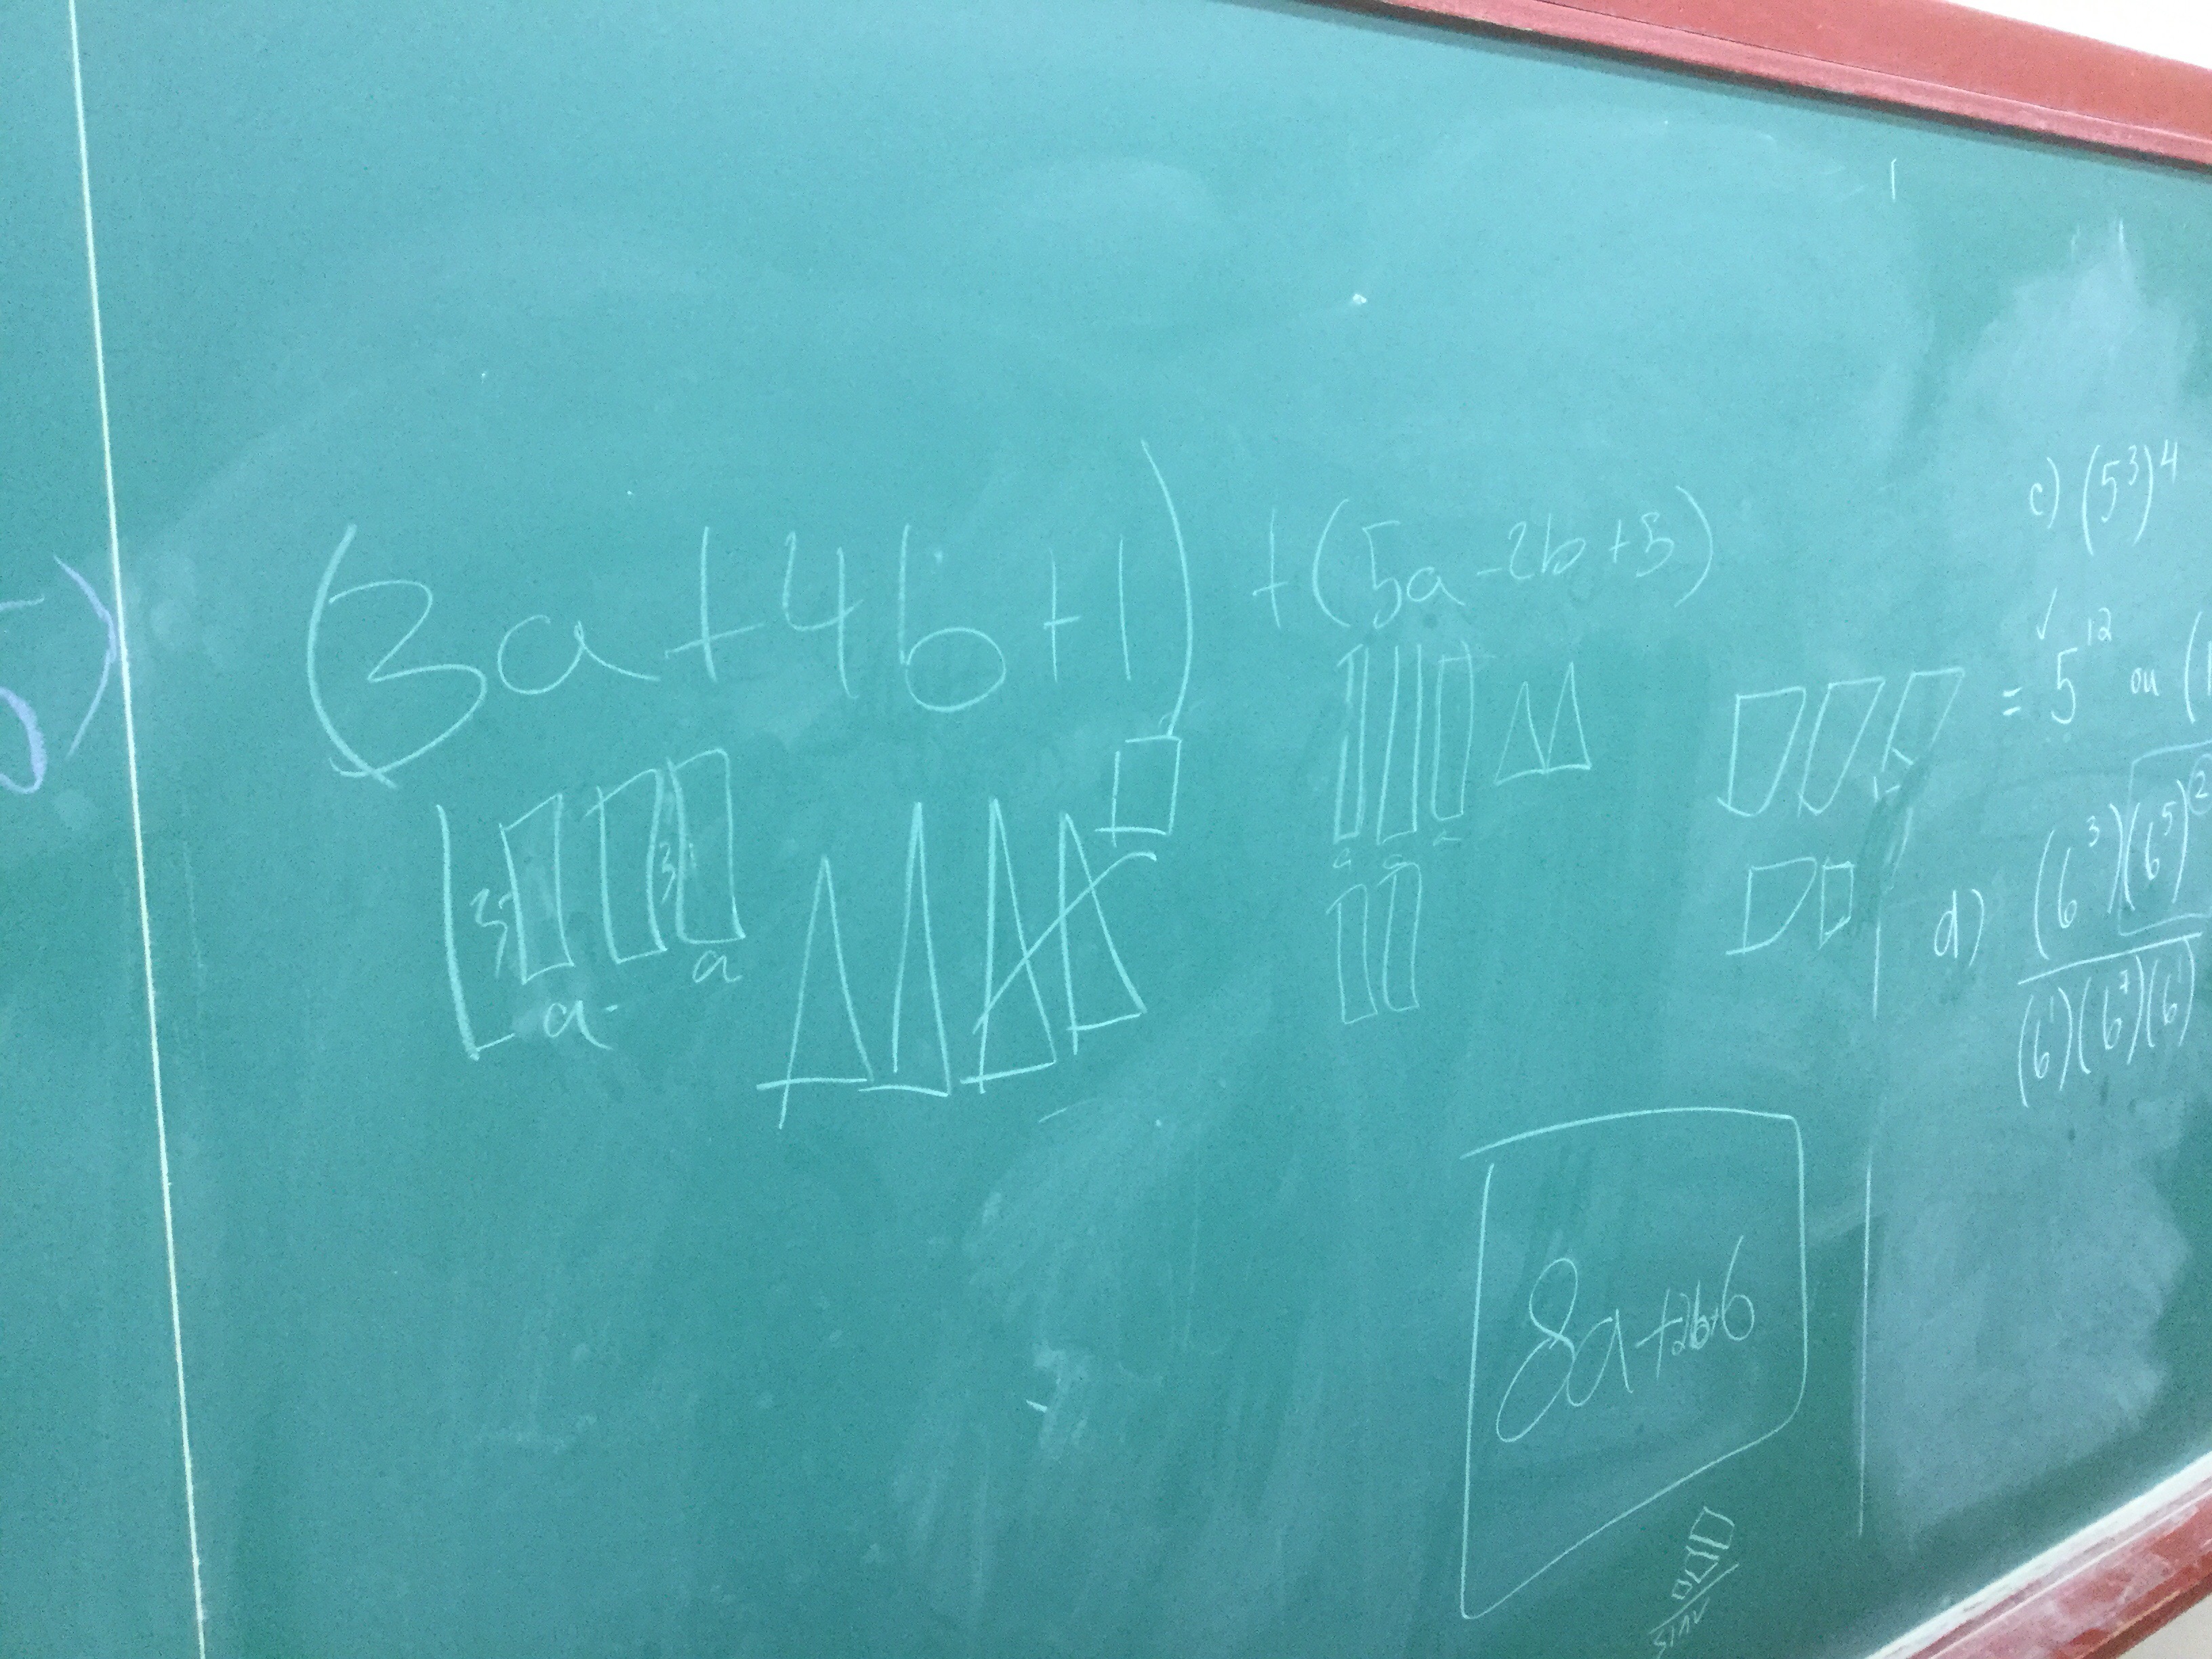
We are getting more used to working with variables and representing them visually.
Patterning to graphing
Grade 10s explored patterning and how the patterns connect to the quadratic functions we have been exploring. 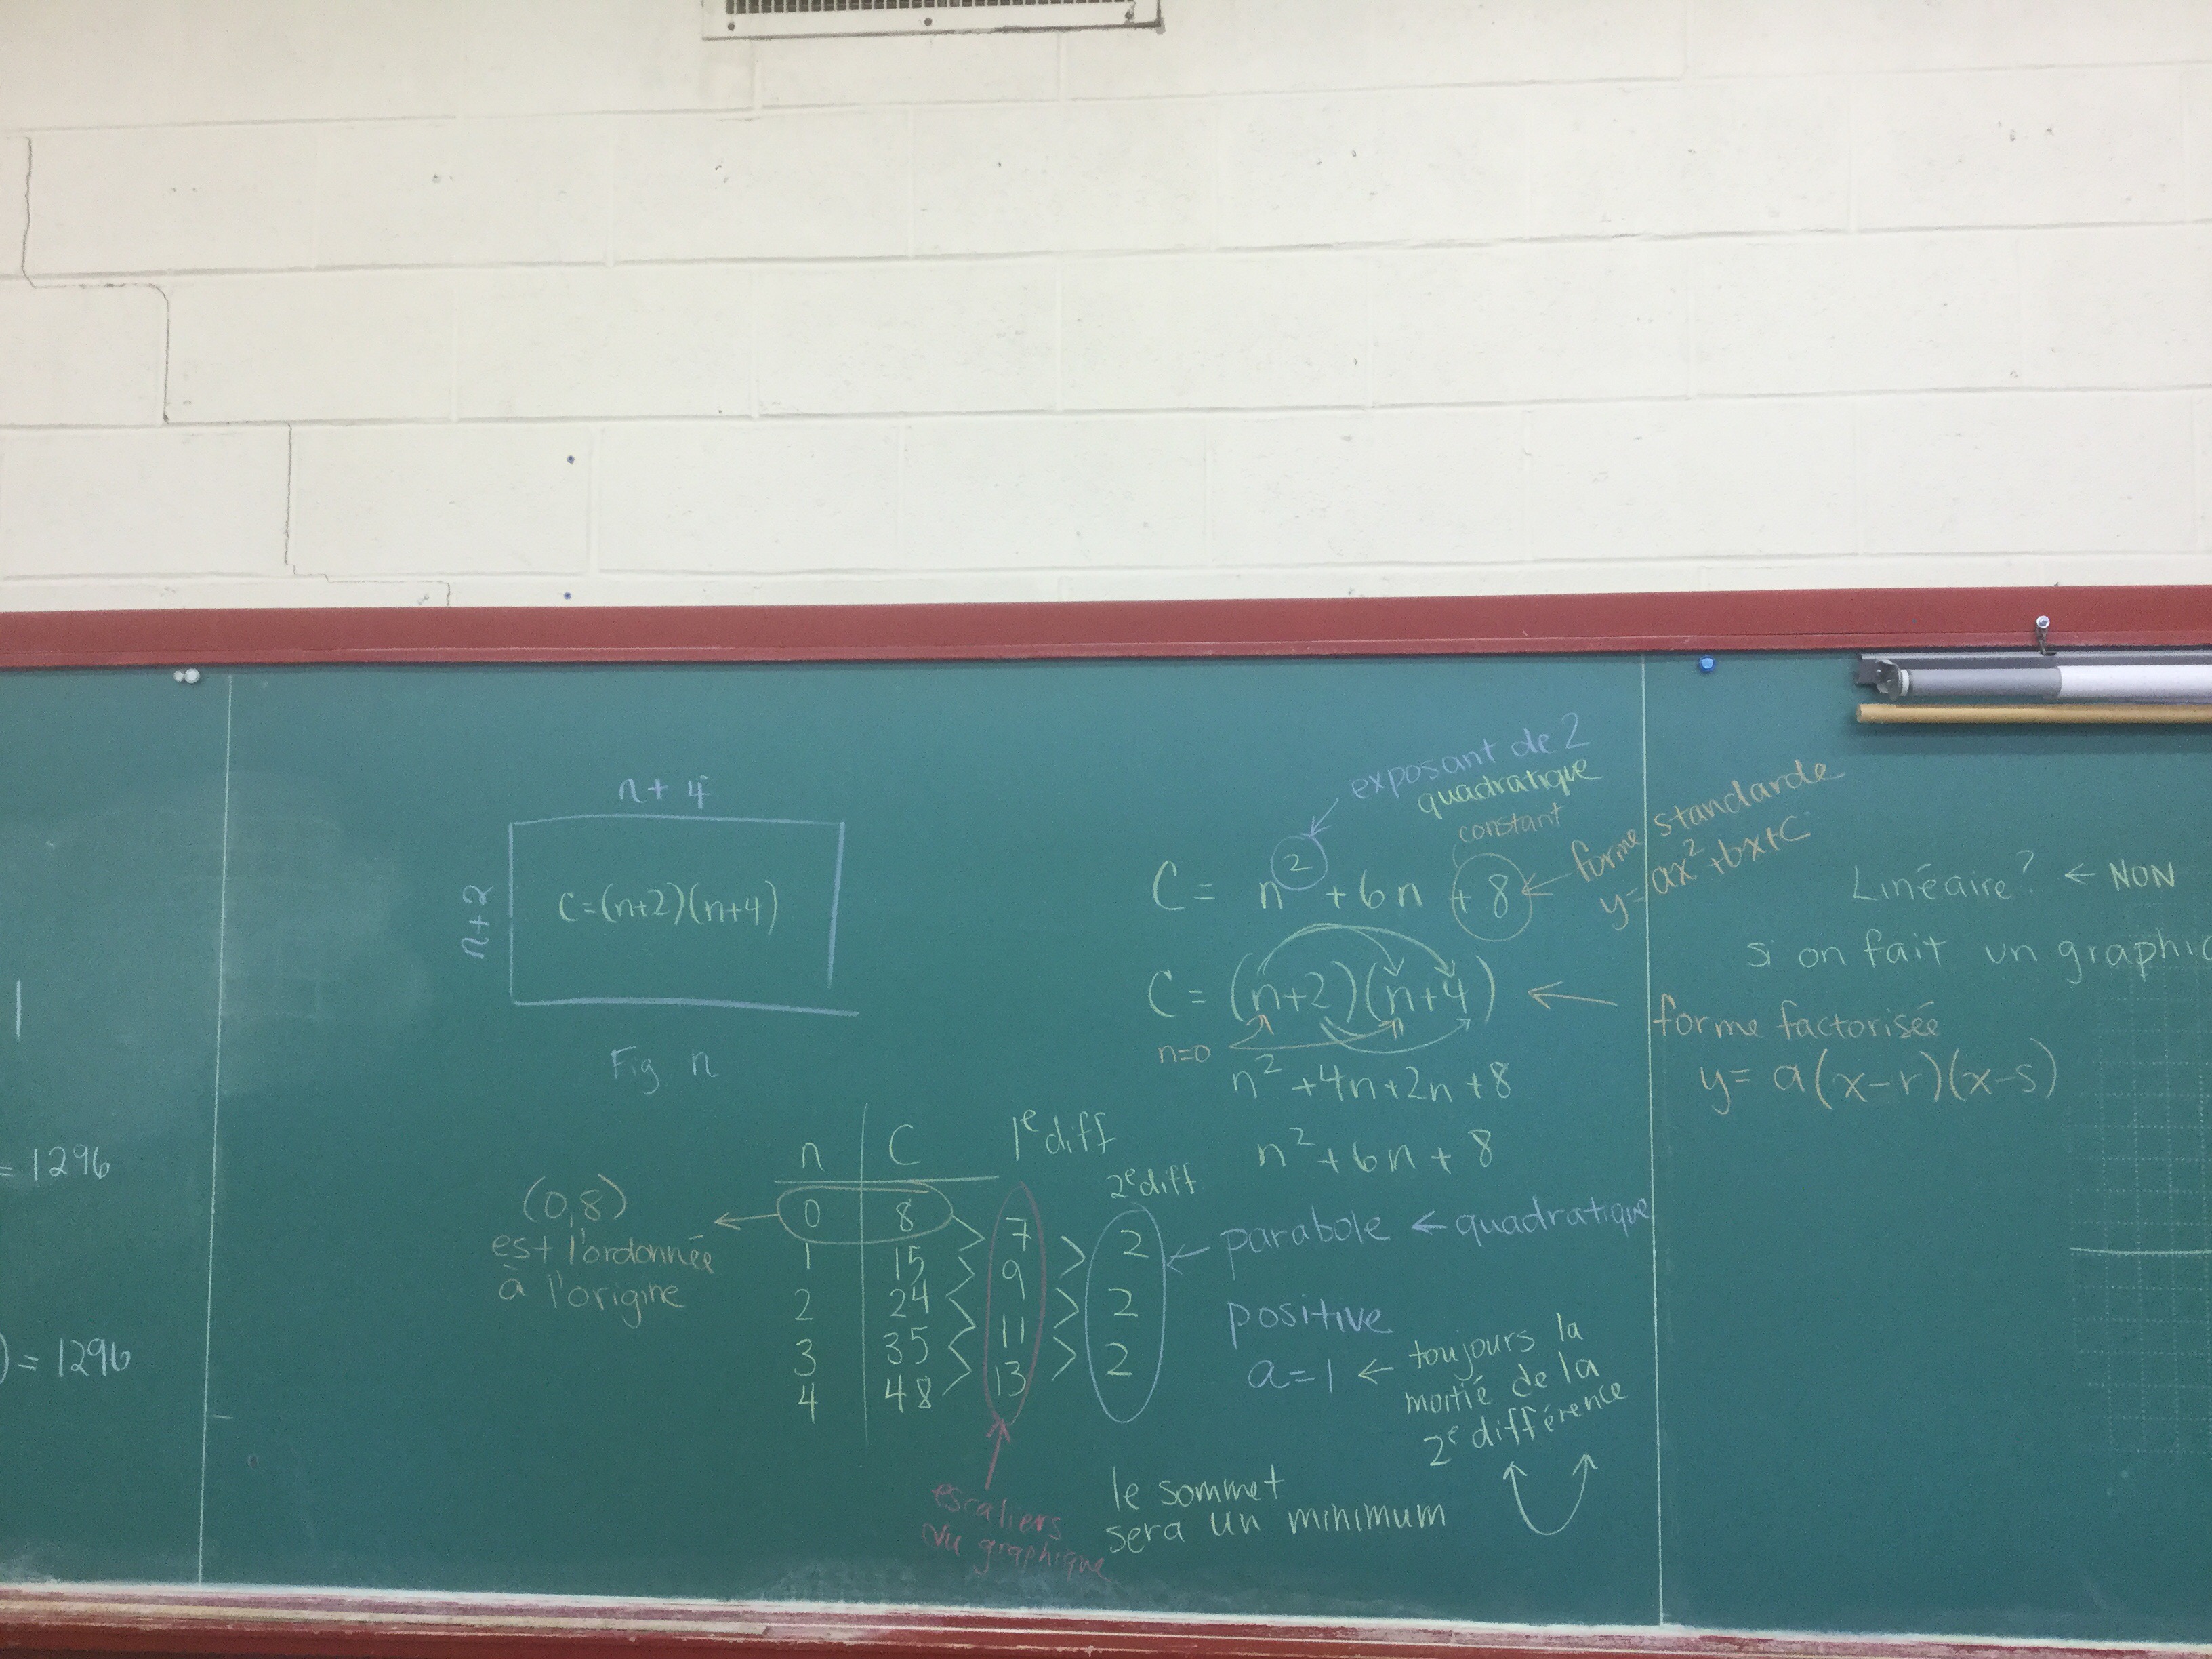
We graphed the pattern, and also represented it in an equation in 2 forms, made a table of values, and looked at the constant and 1st and 2nd differences.
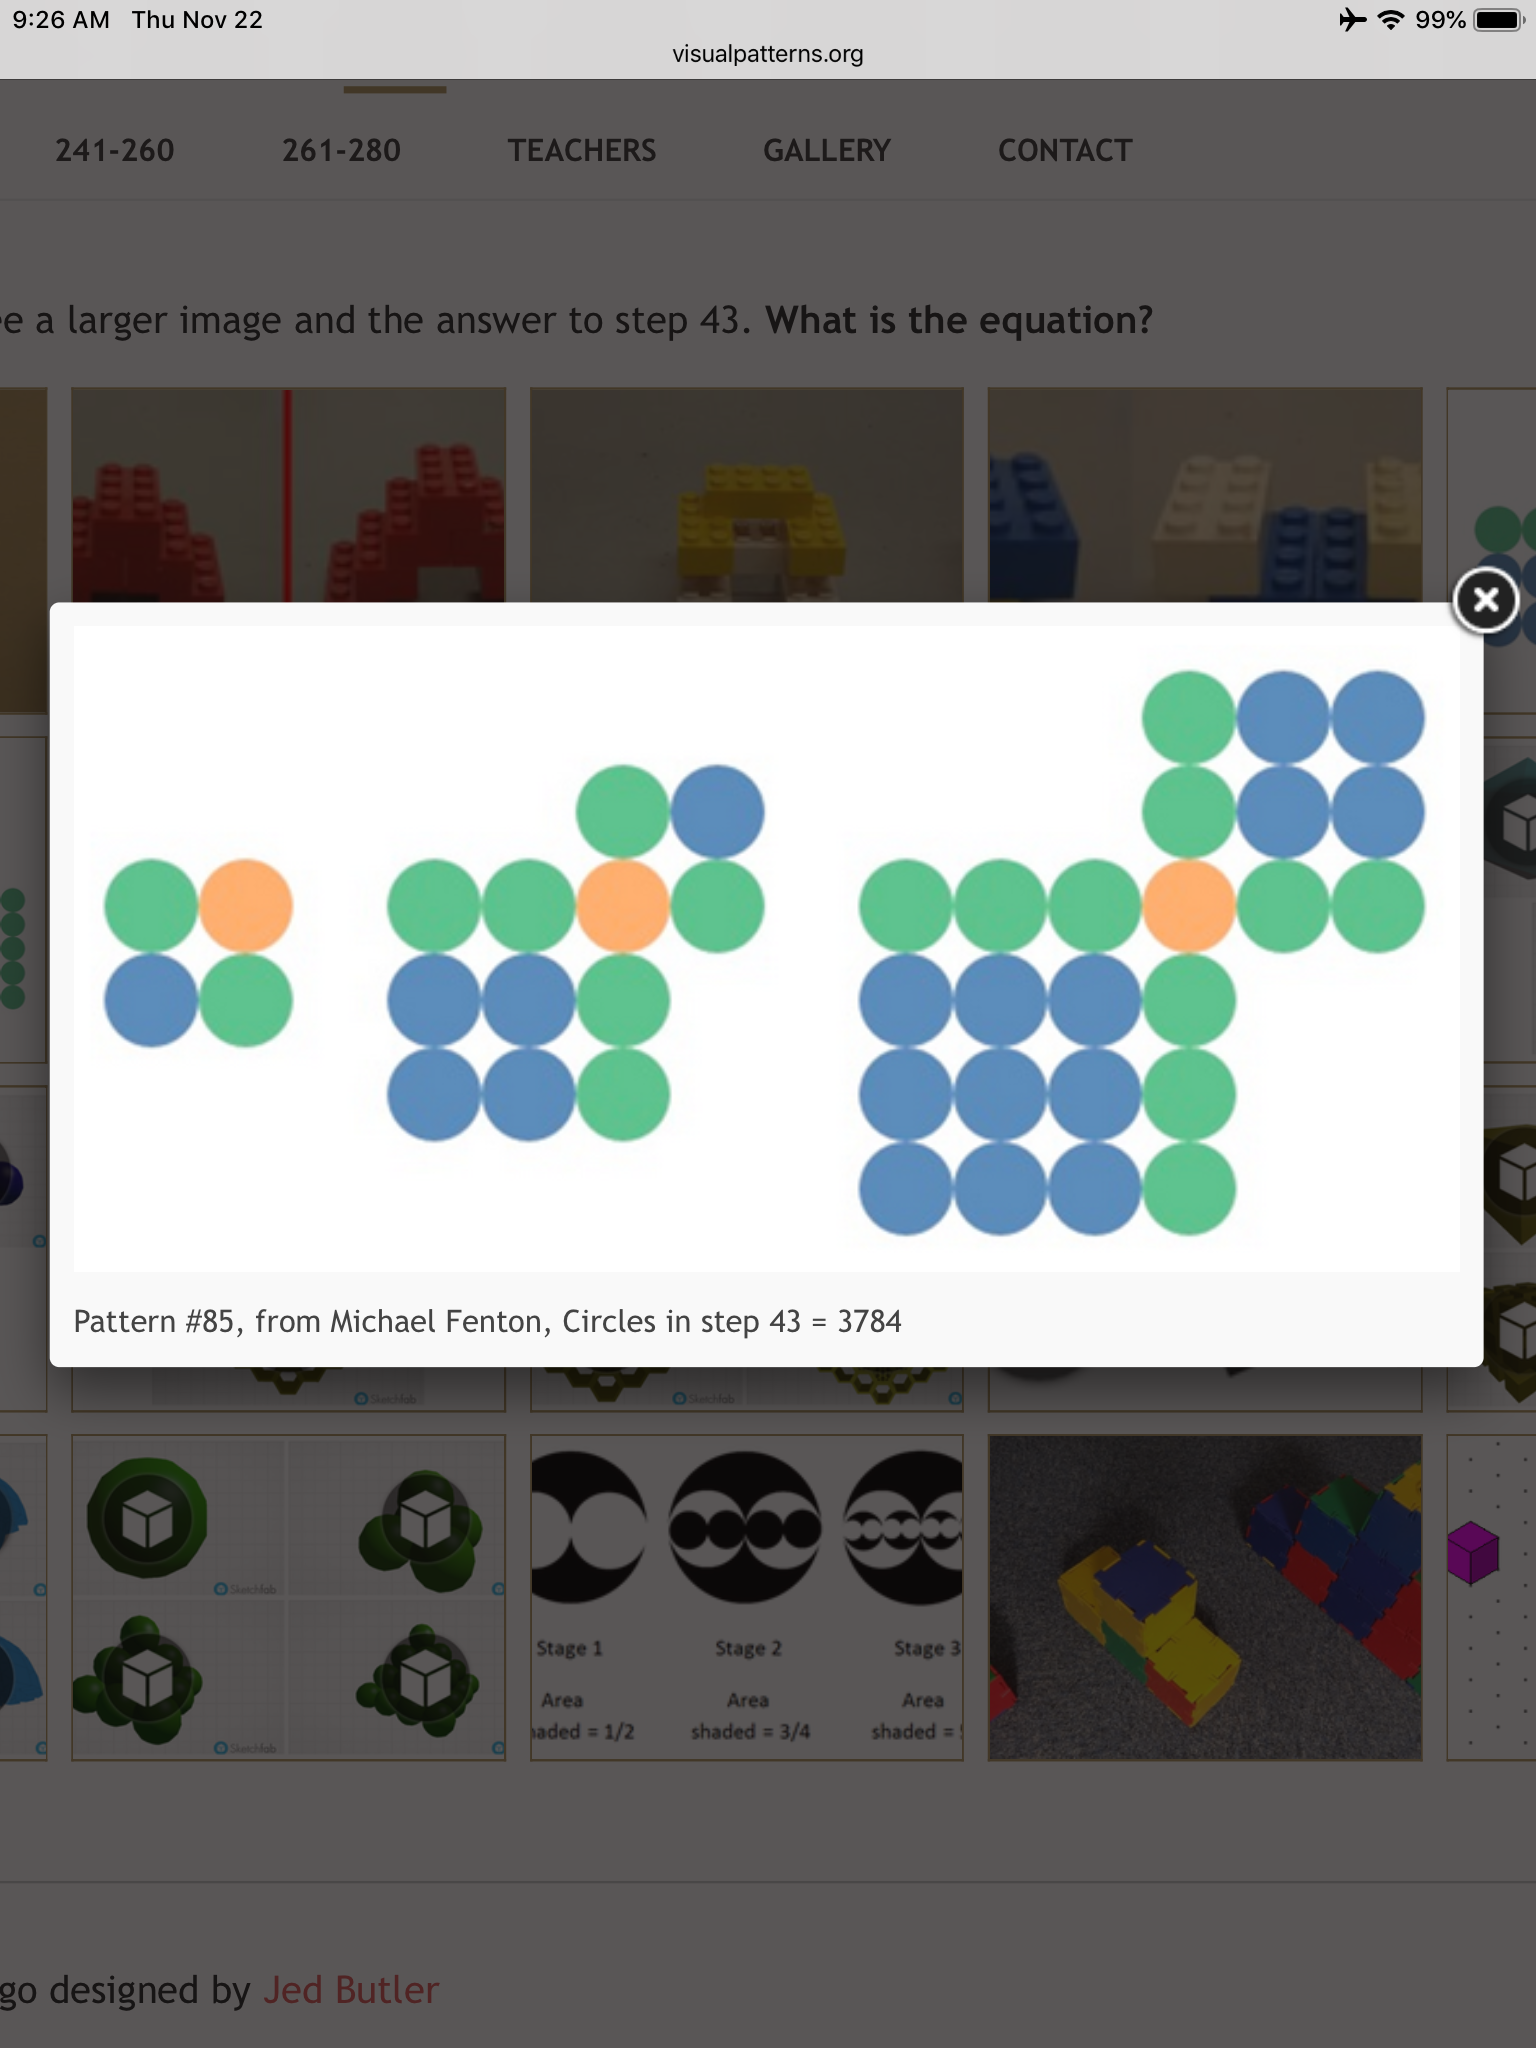
We looked at this visual pattern next and did our best to analyse it graphically.
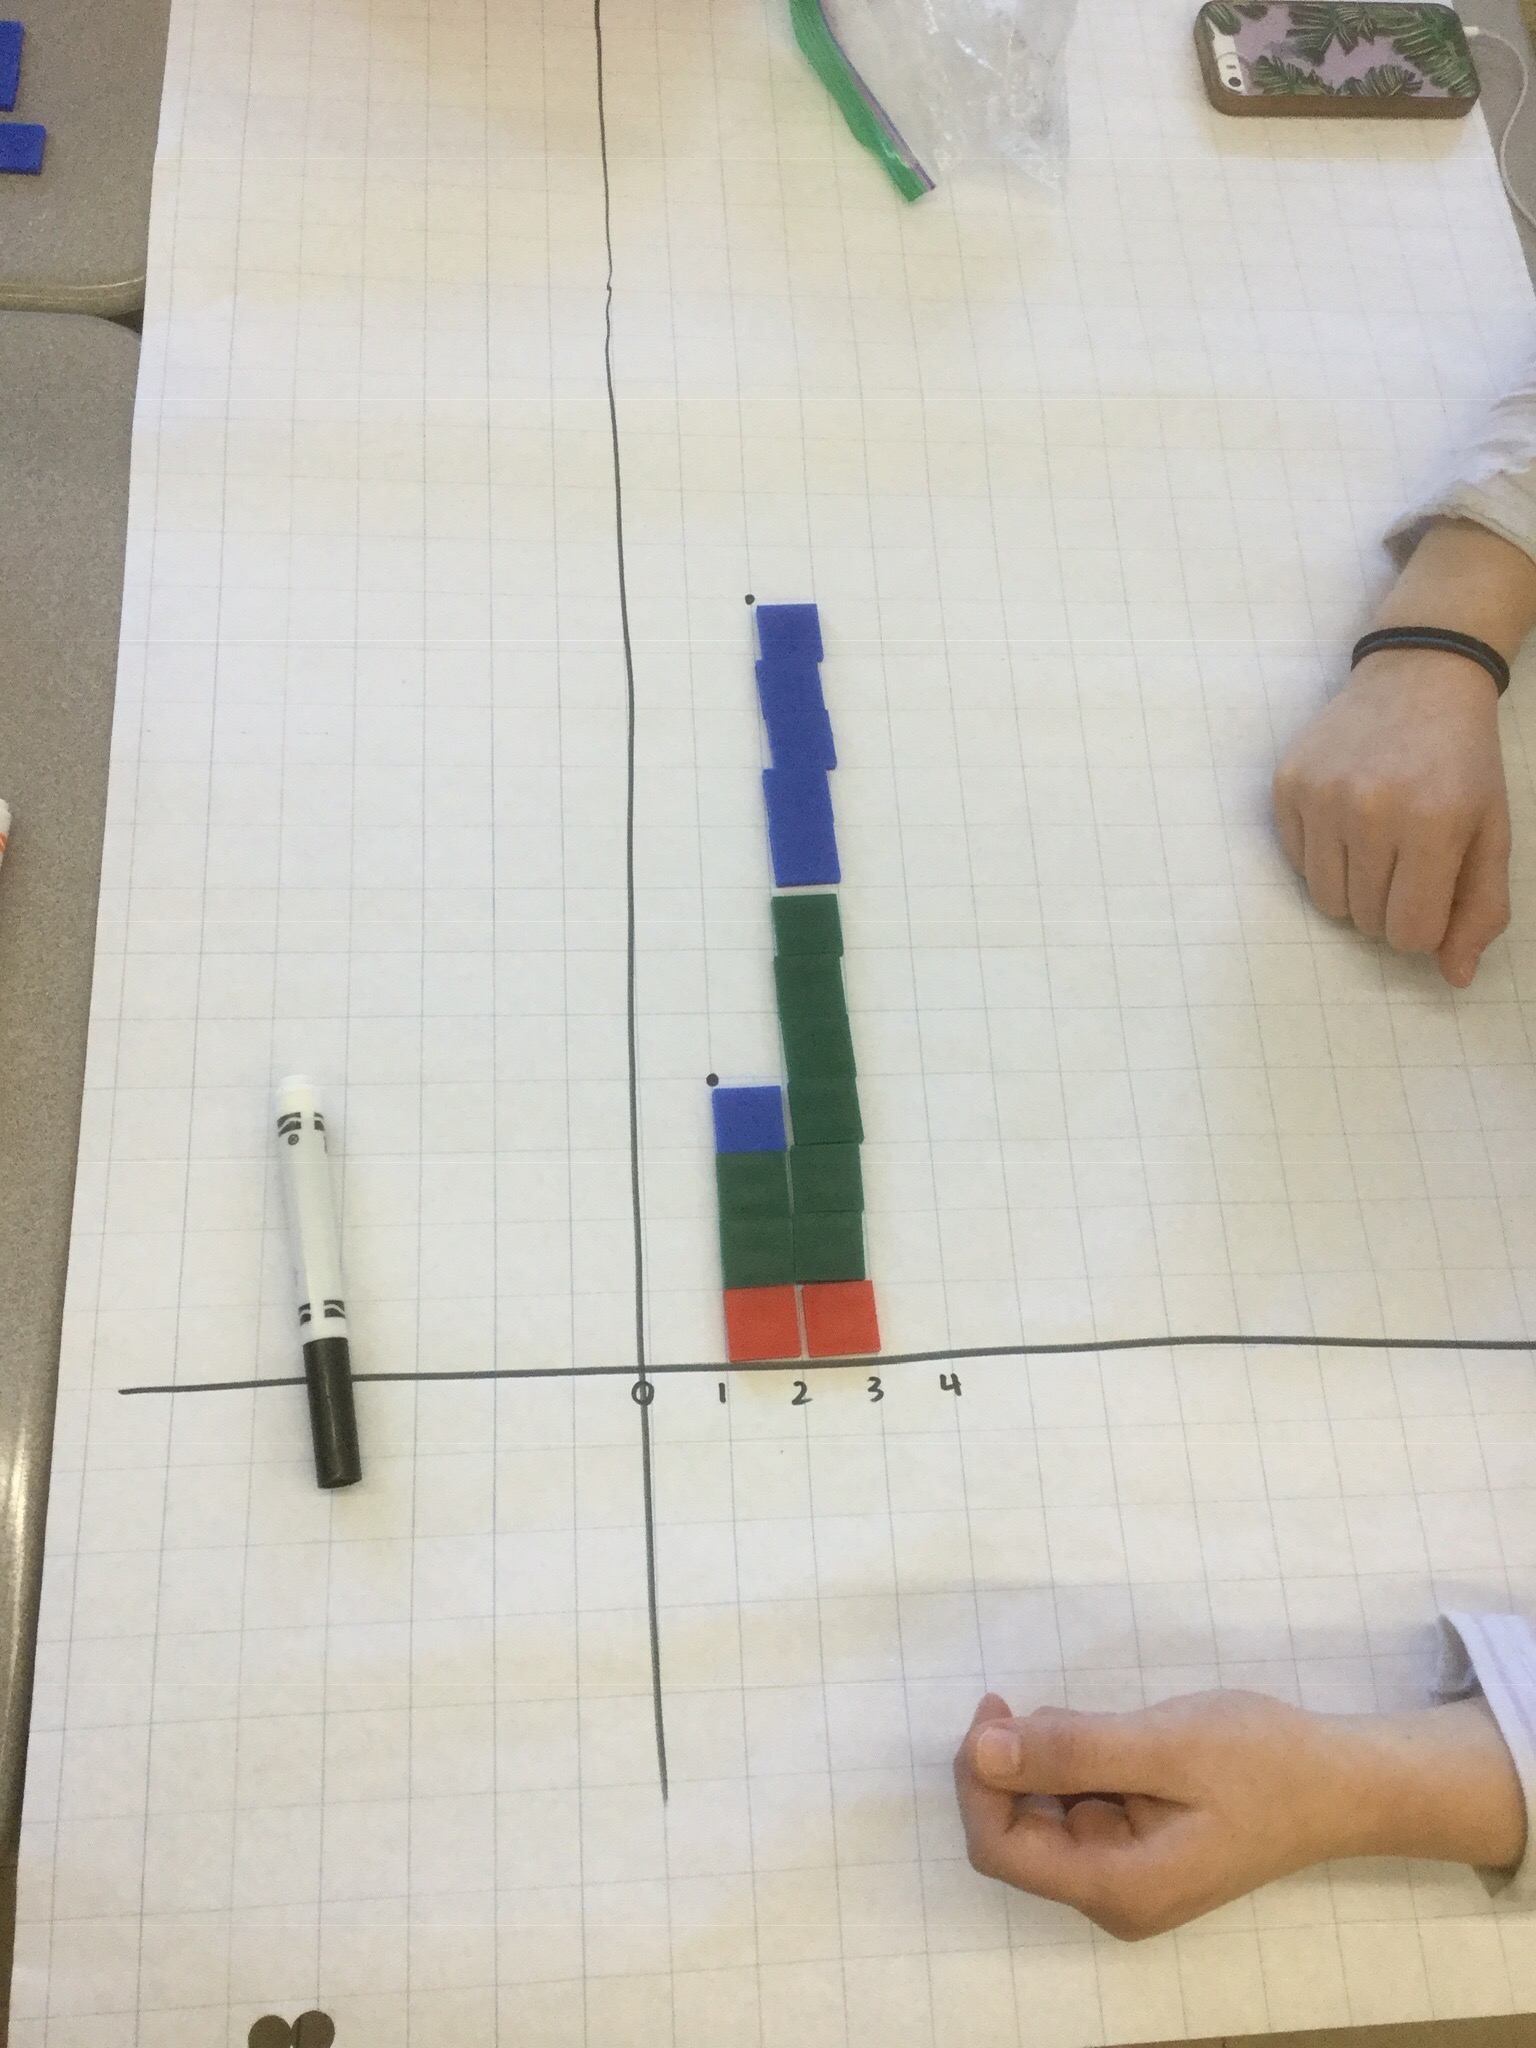
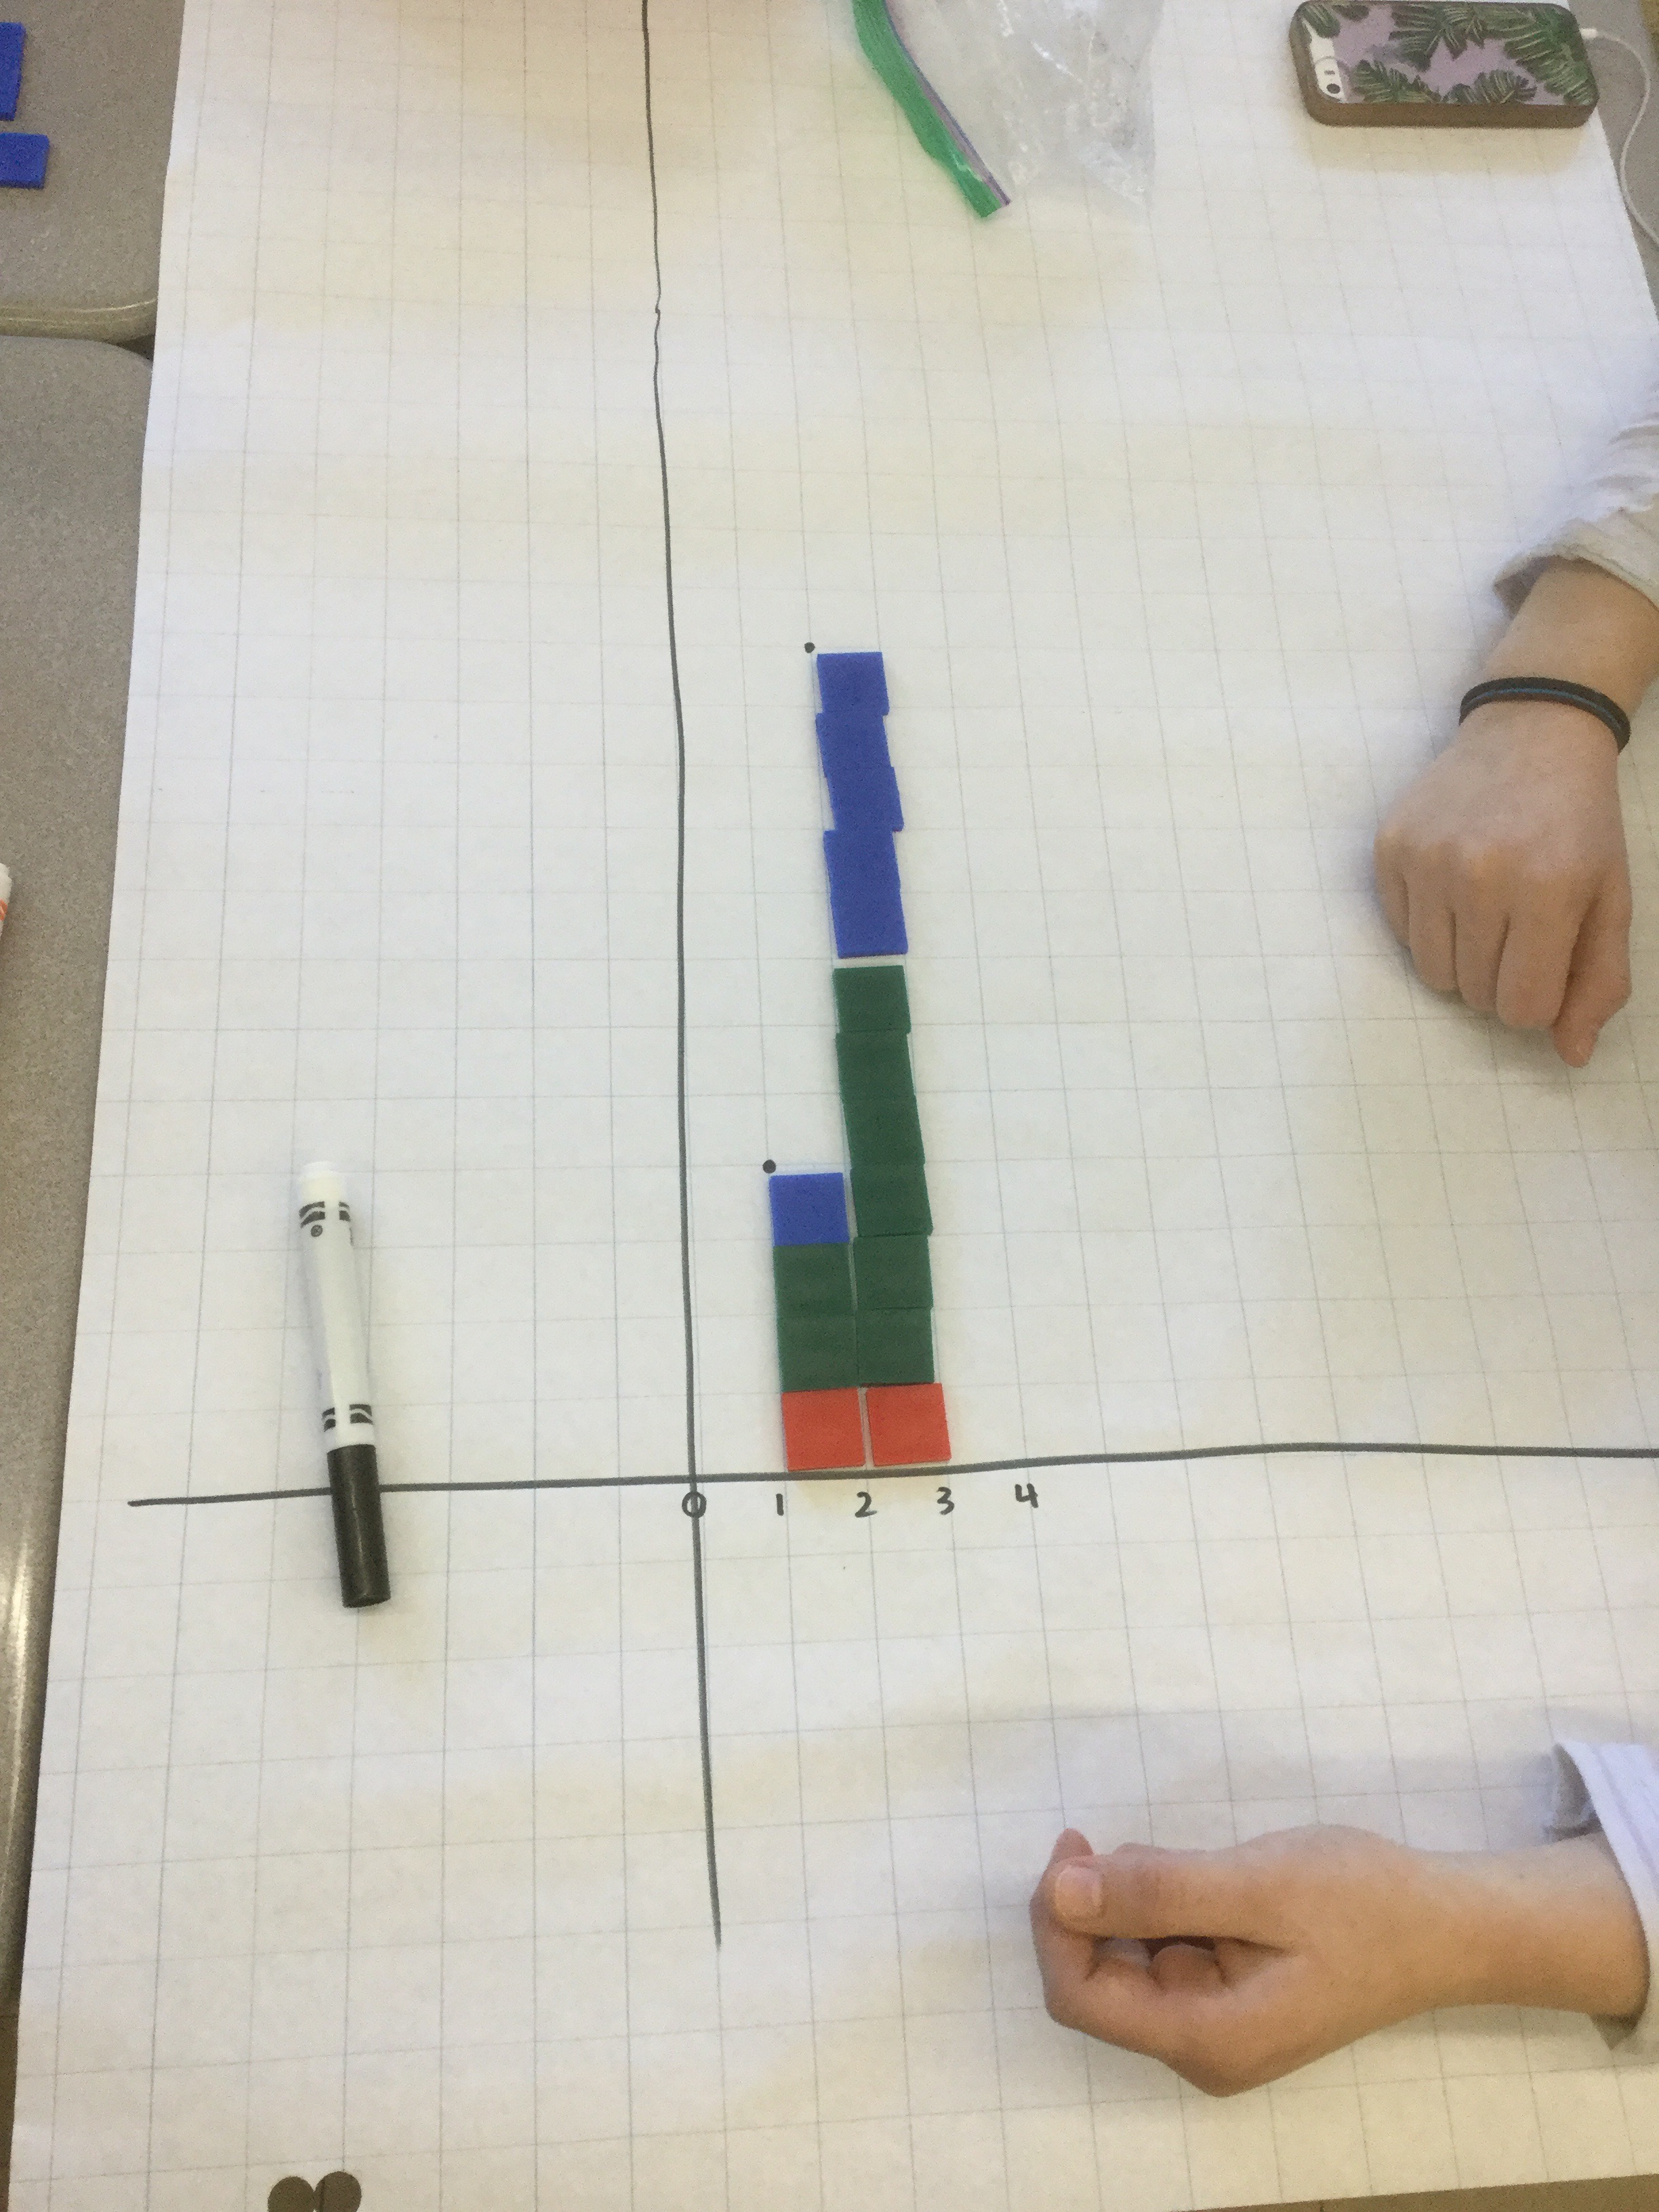
We built the figures

And reassembled each figure into a strip on our graph.
The graph was increasing rapidly, and soon was too big for our page.
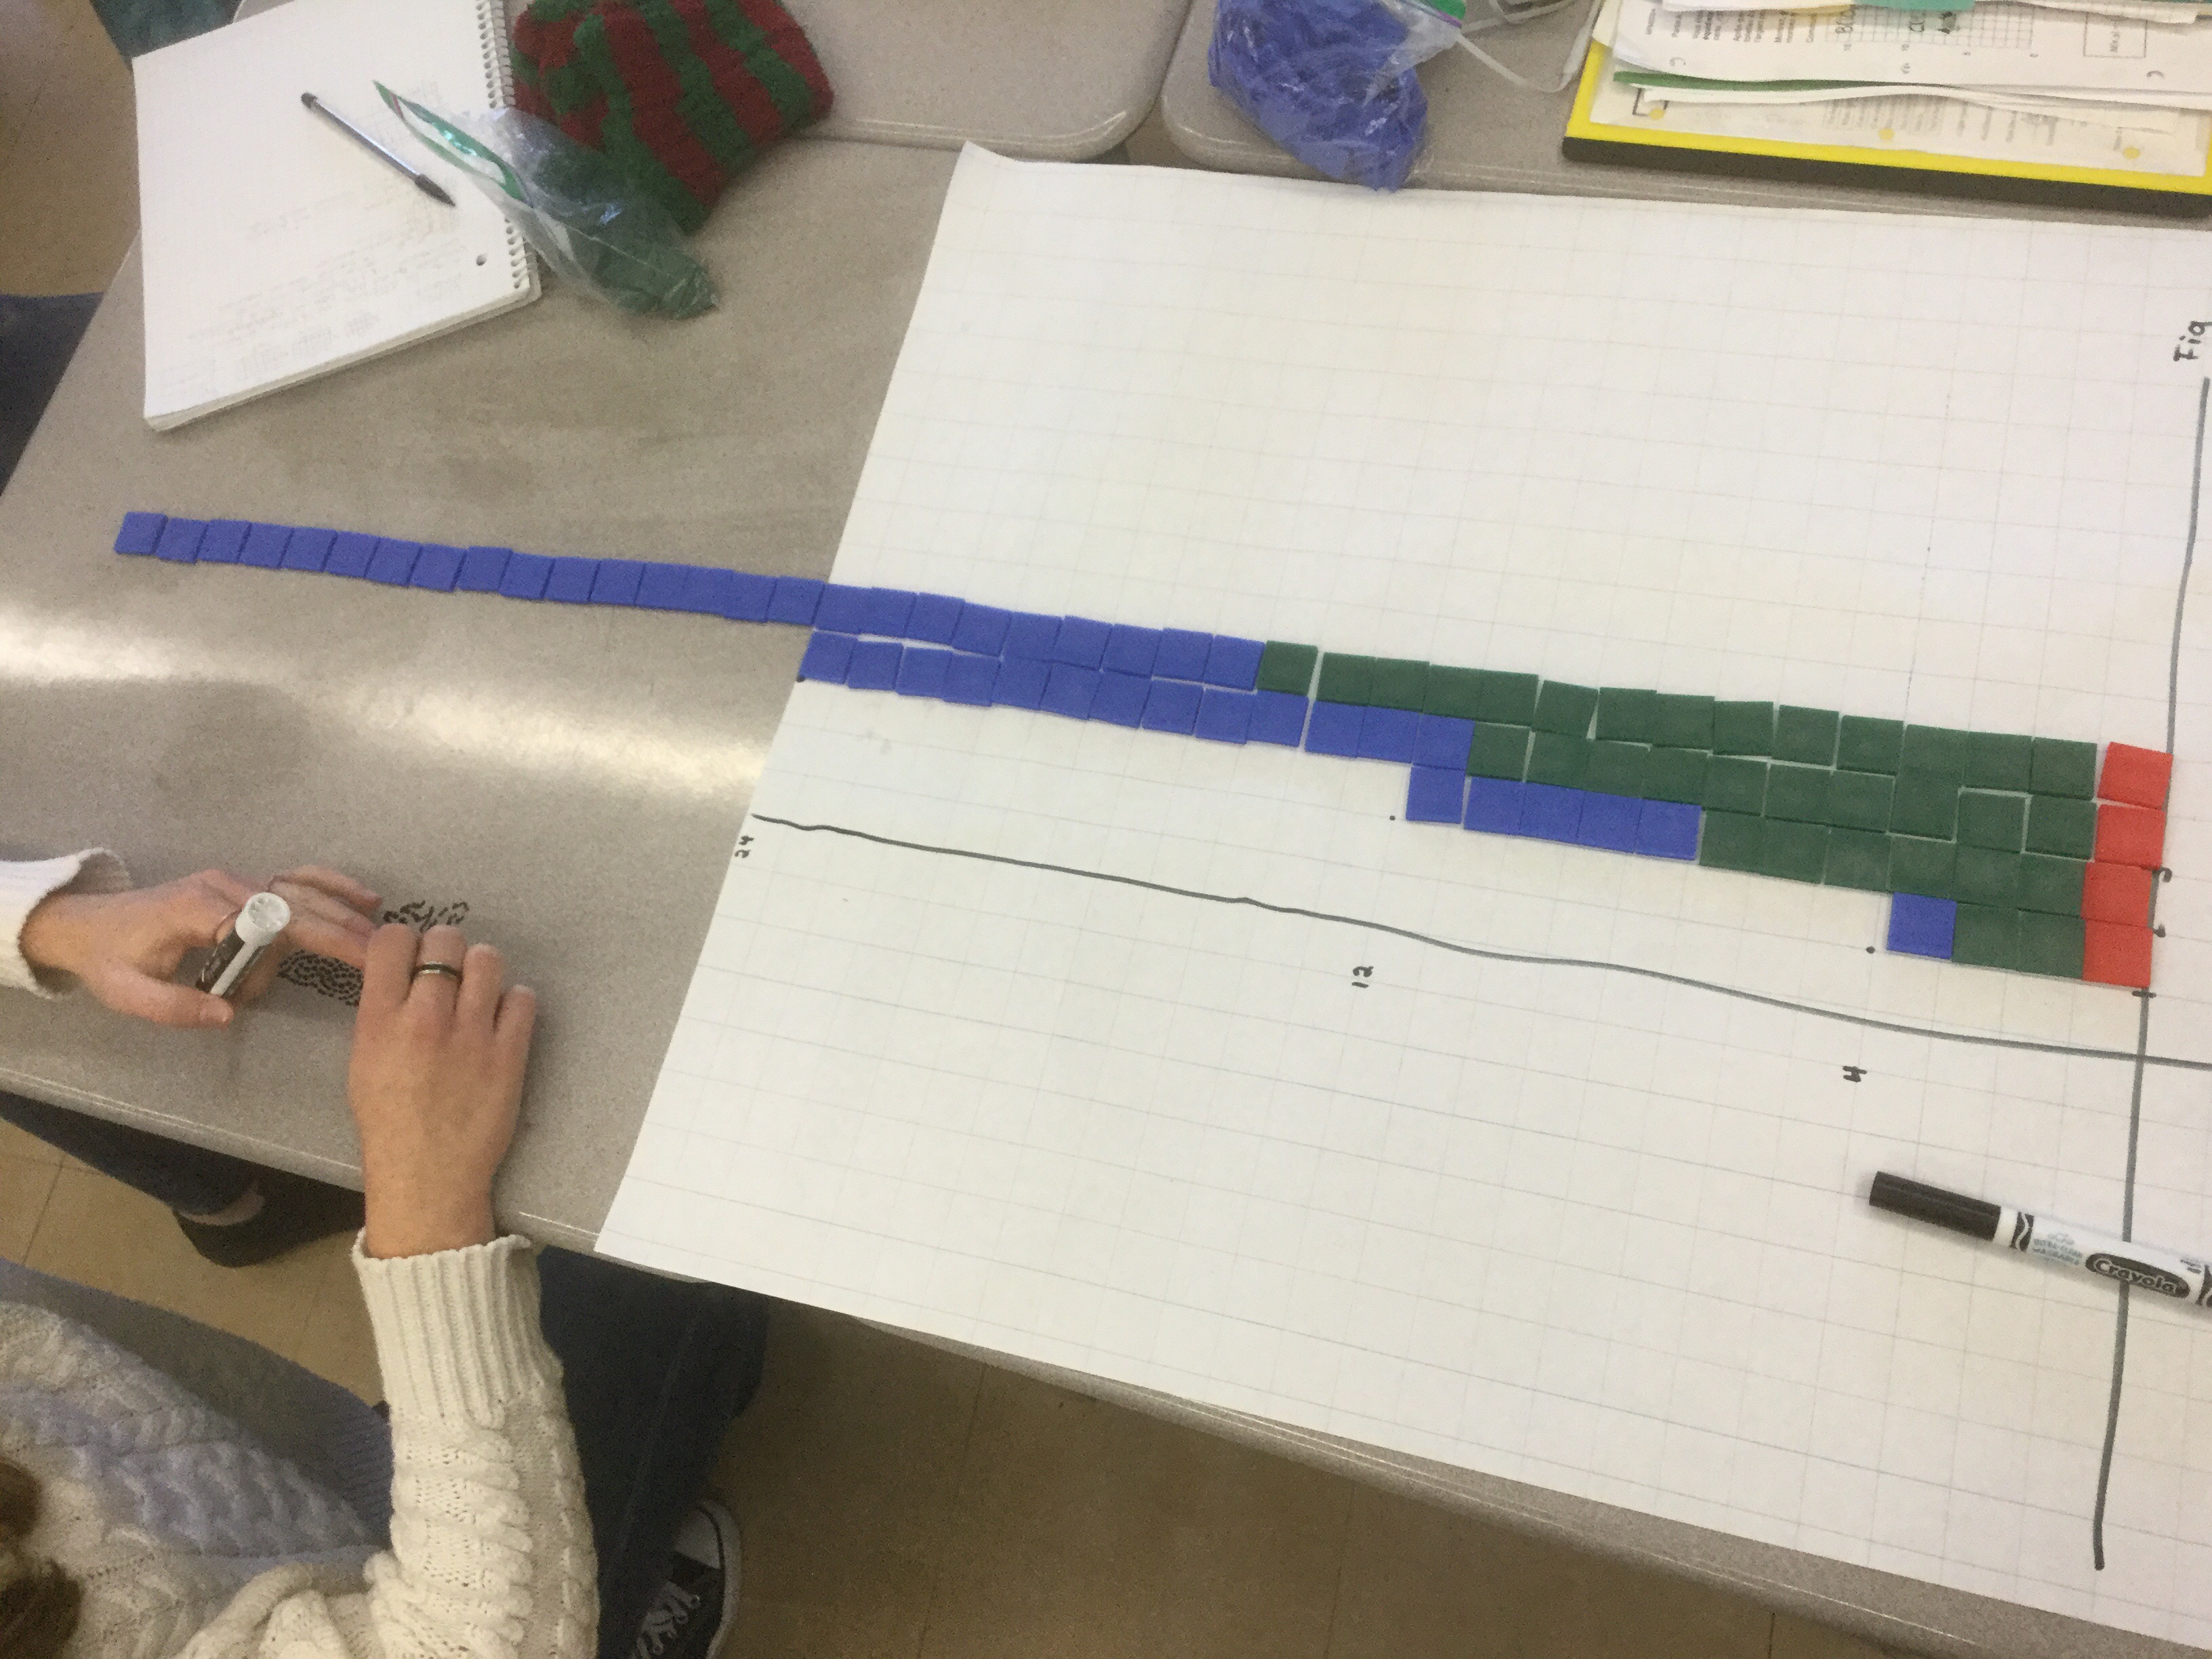
We will continue to look at the equations that some of us created, and discuss if there is a constant in the relationship or not.
Exploring exponent rules
We are exploring how to evaluate and also how to simplify expressions involving exponents.
We worked on multiplying, dividing, powers of powers and also on some complicated combinations.
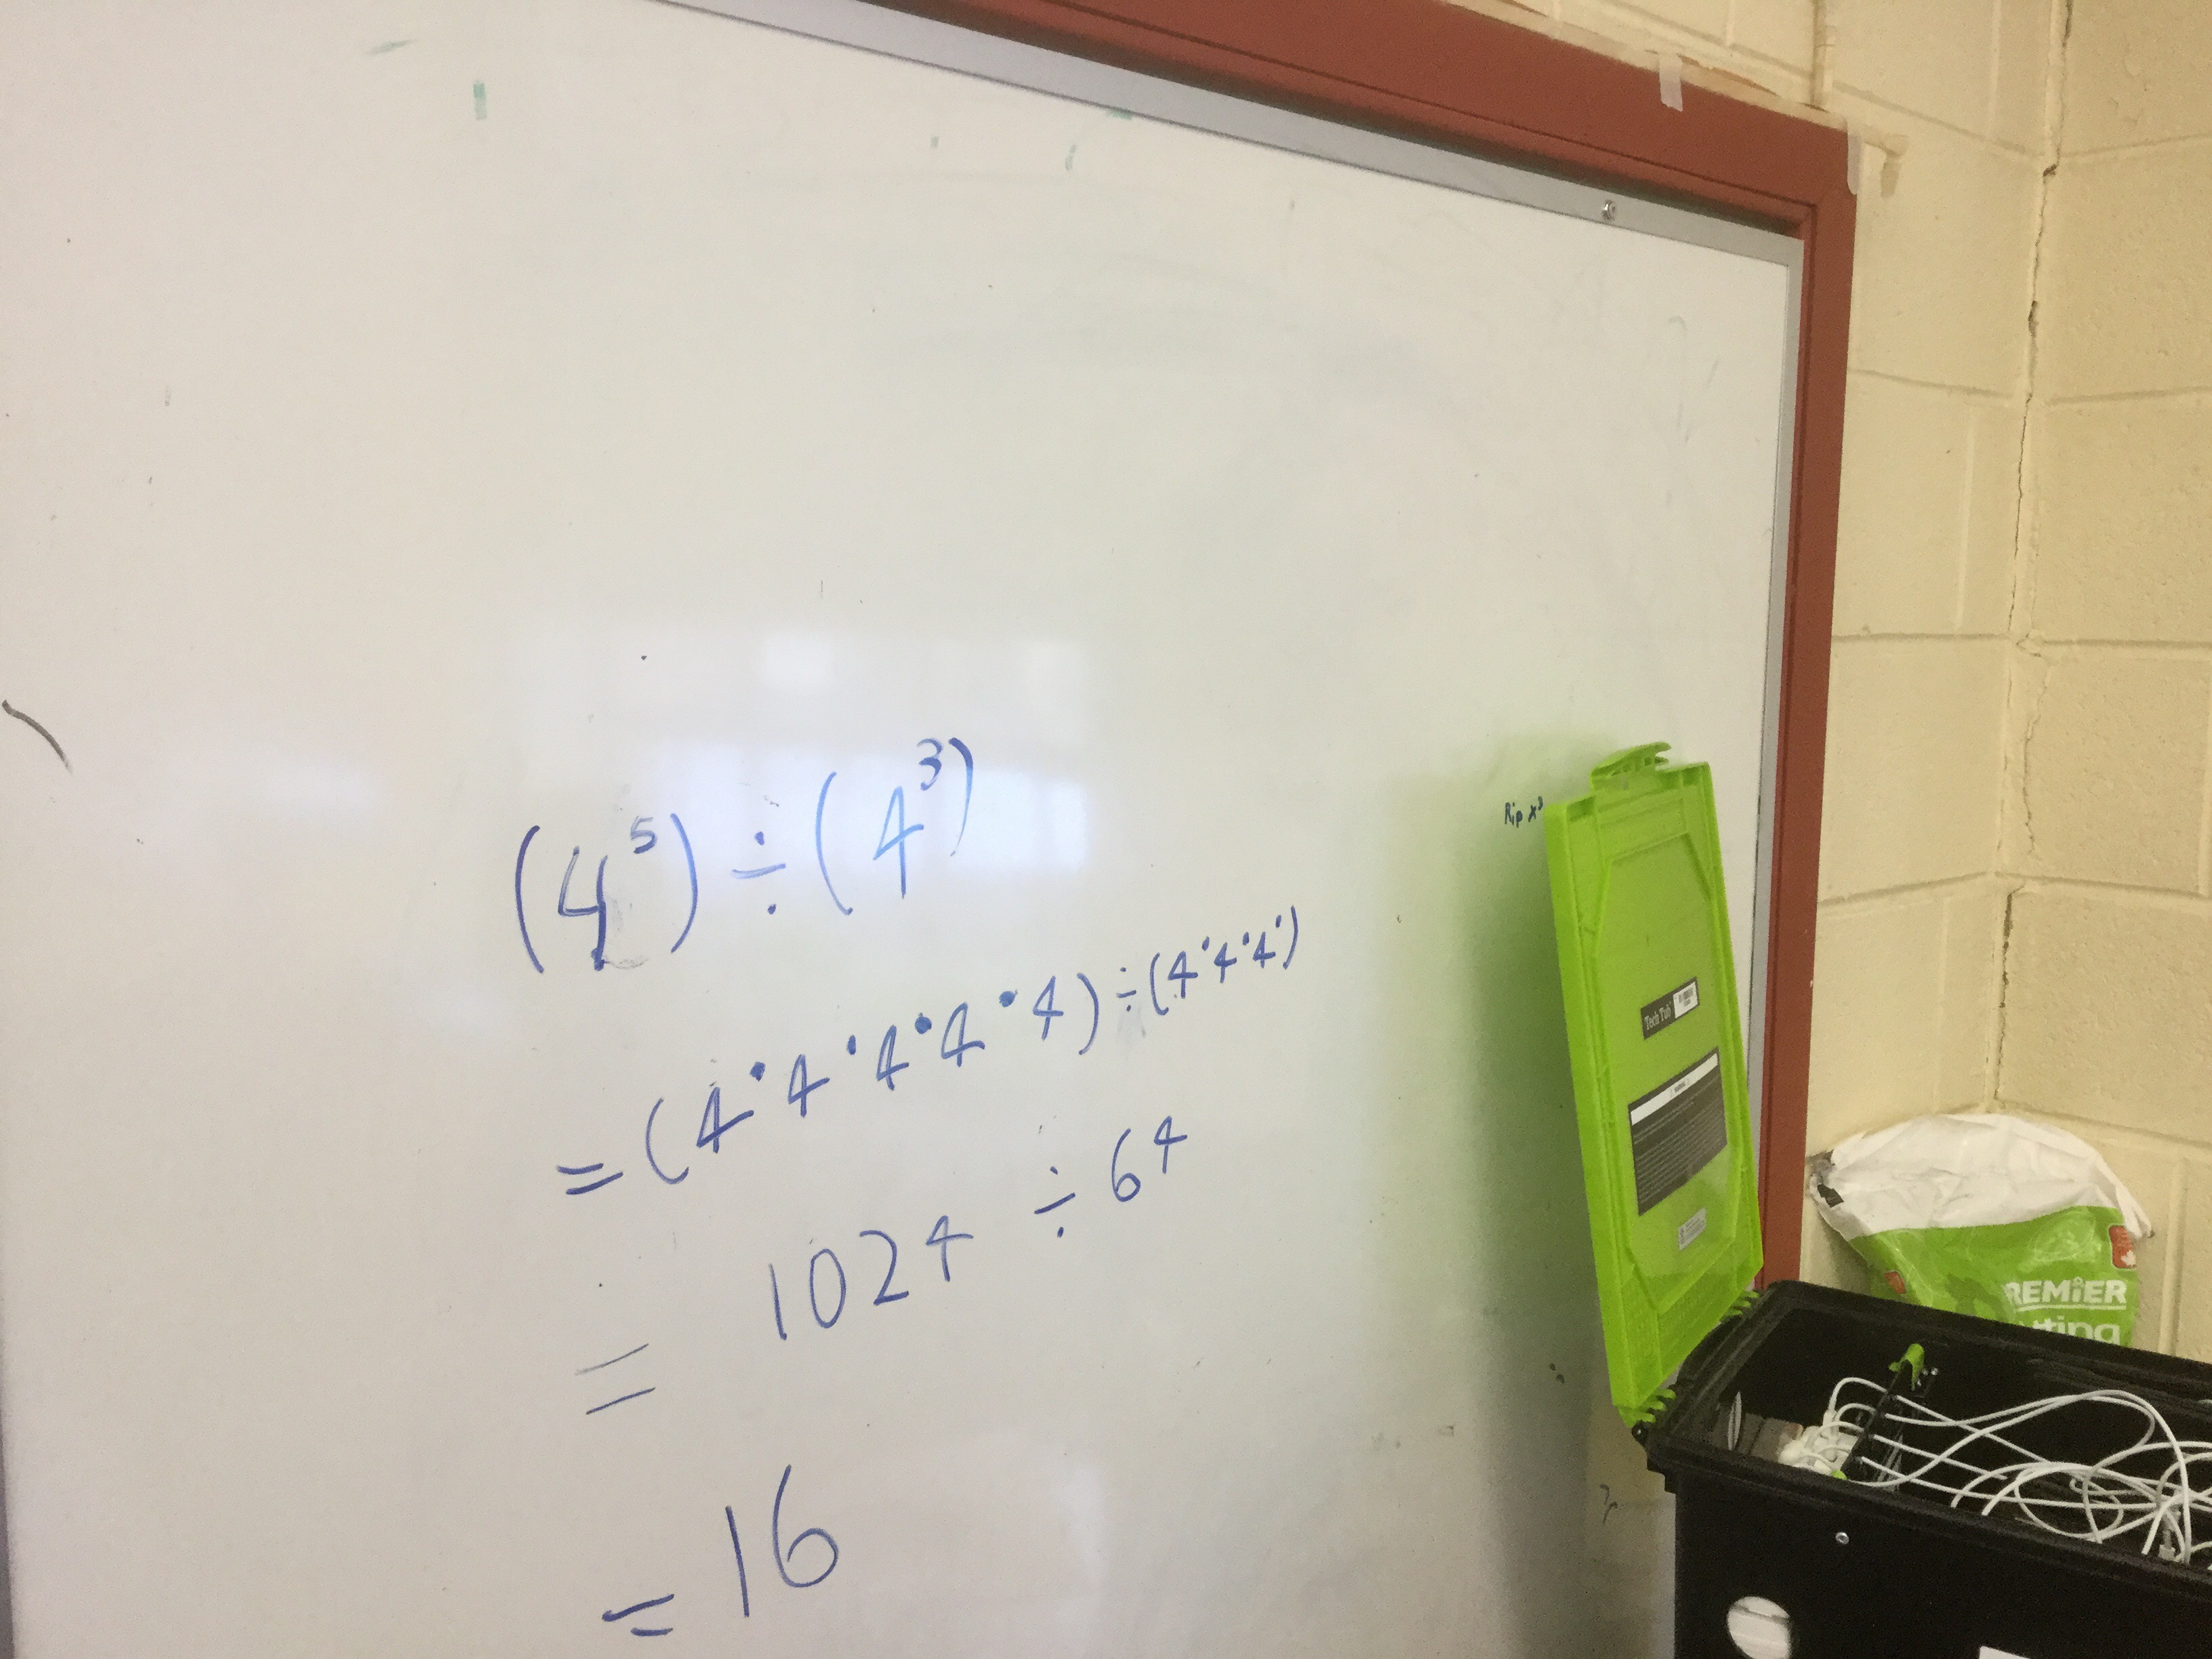
We have many ways to express the same answer.

We are doing a lot of work at the blackboards and then consolidating our thinking every so often.
We are taking pictures of our work to record our thinking.

We wrote summary notes for ourselves


and we’ll see how well we’ve built our knowledge in tomorrow’s quiz.
Representing exponents
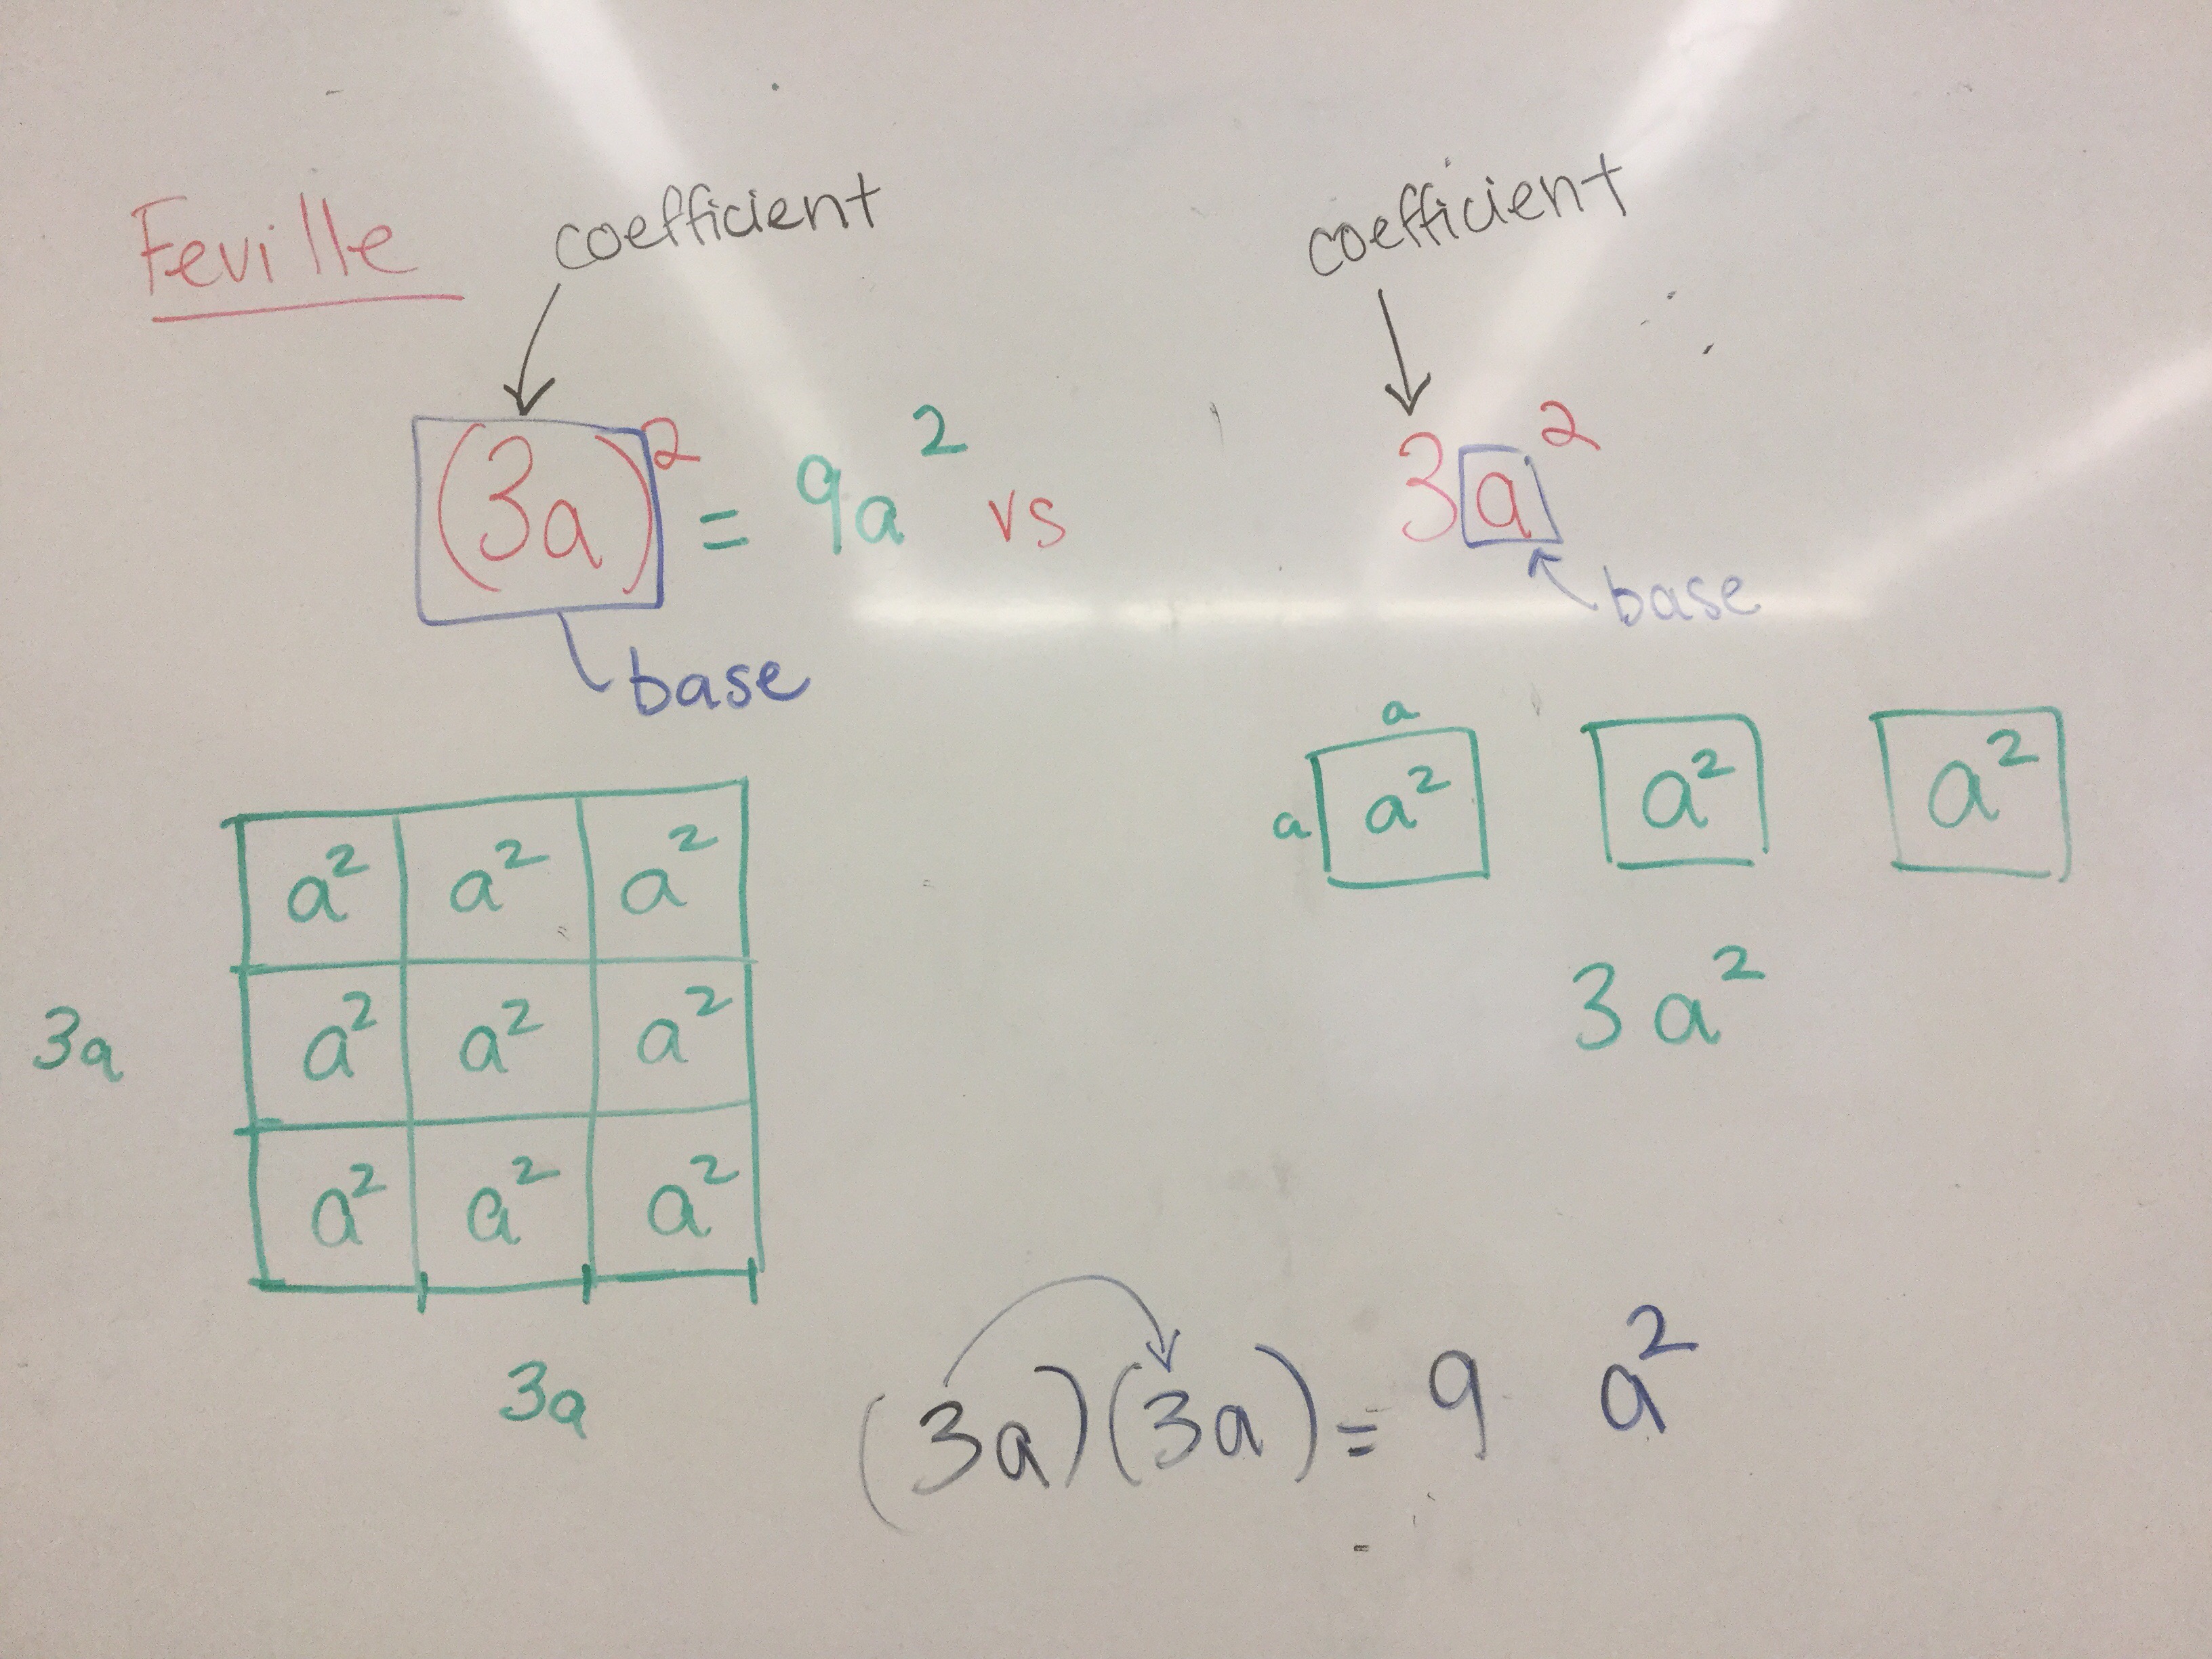
We are exploring what expressions with exponents can look like. We noticed that exponents of 2 make squares, and exponents of 3 make cubes.
The base of the exponent will be the dimension of the square or cube. If there is a coefficient and a variable in brackets with the exponent it means the coefficient and the variable together form the base. Here’s an example of 2 x cubes compared with one cube that has sides of length 2x.

We explored a variety of combinations, with coefficients of 1/2 or 2 or 3
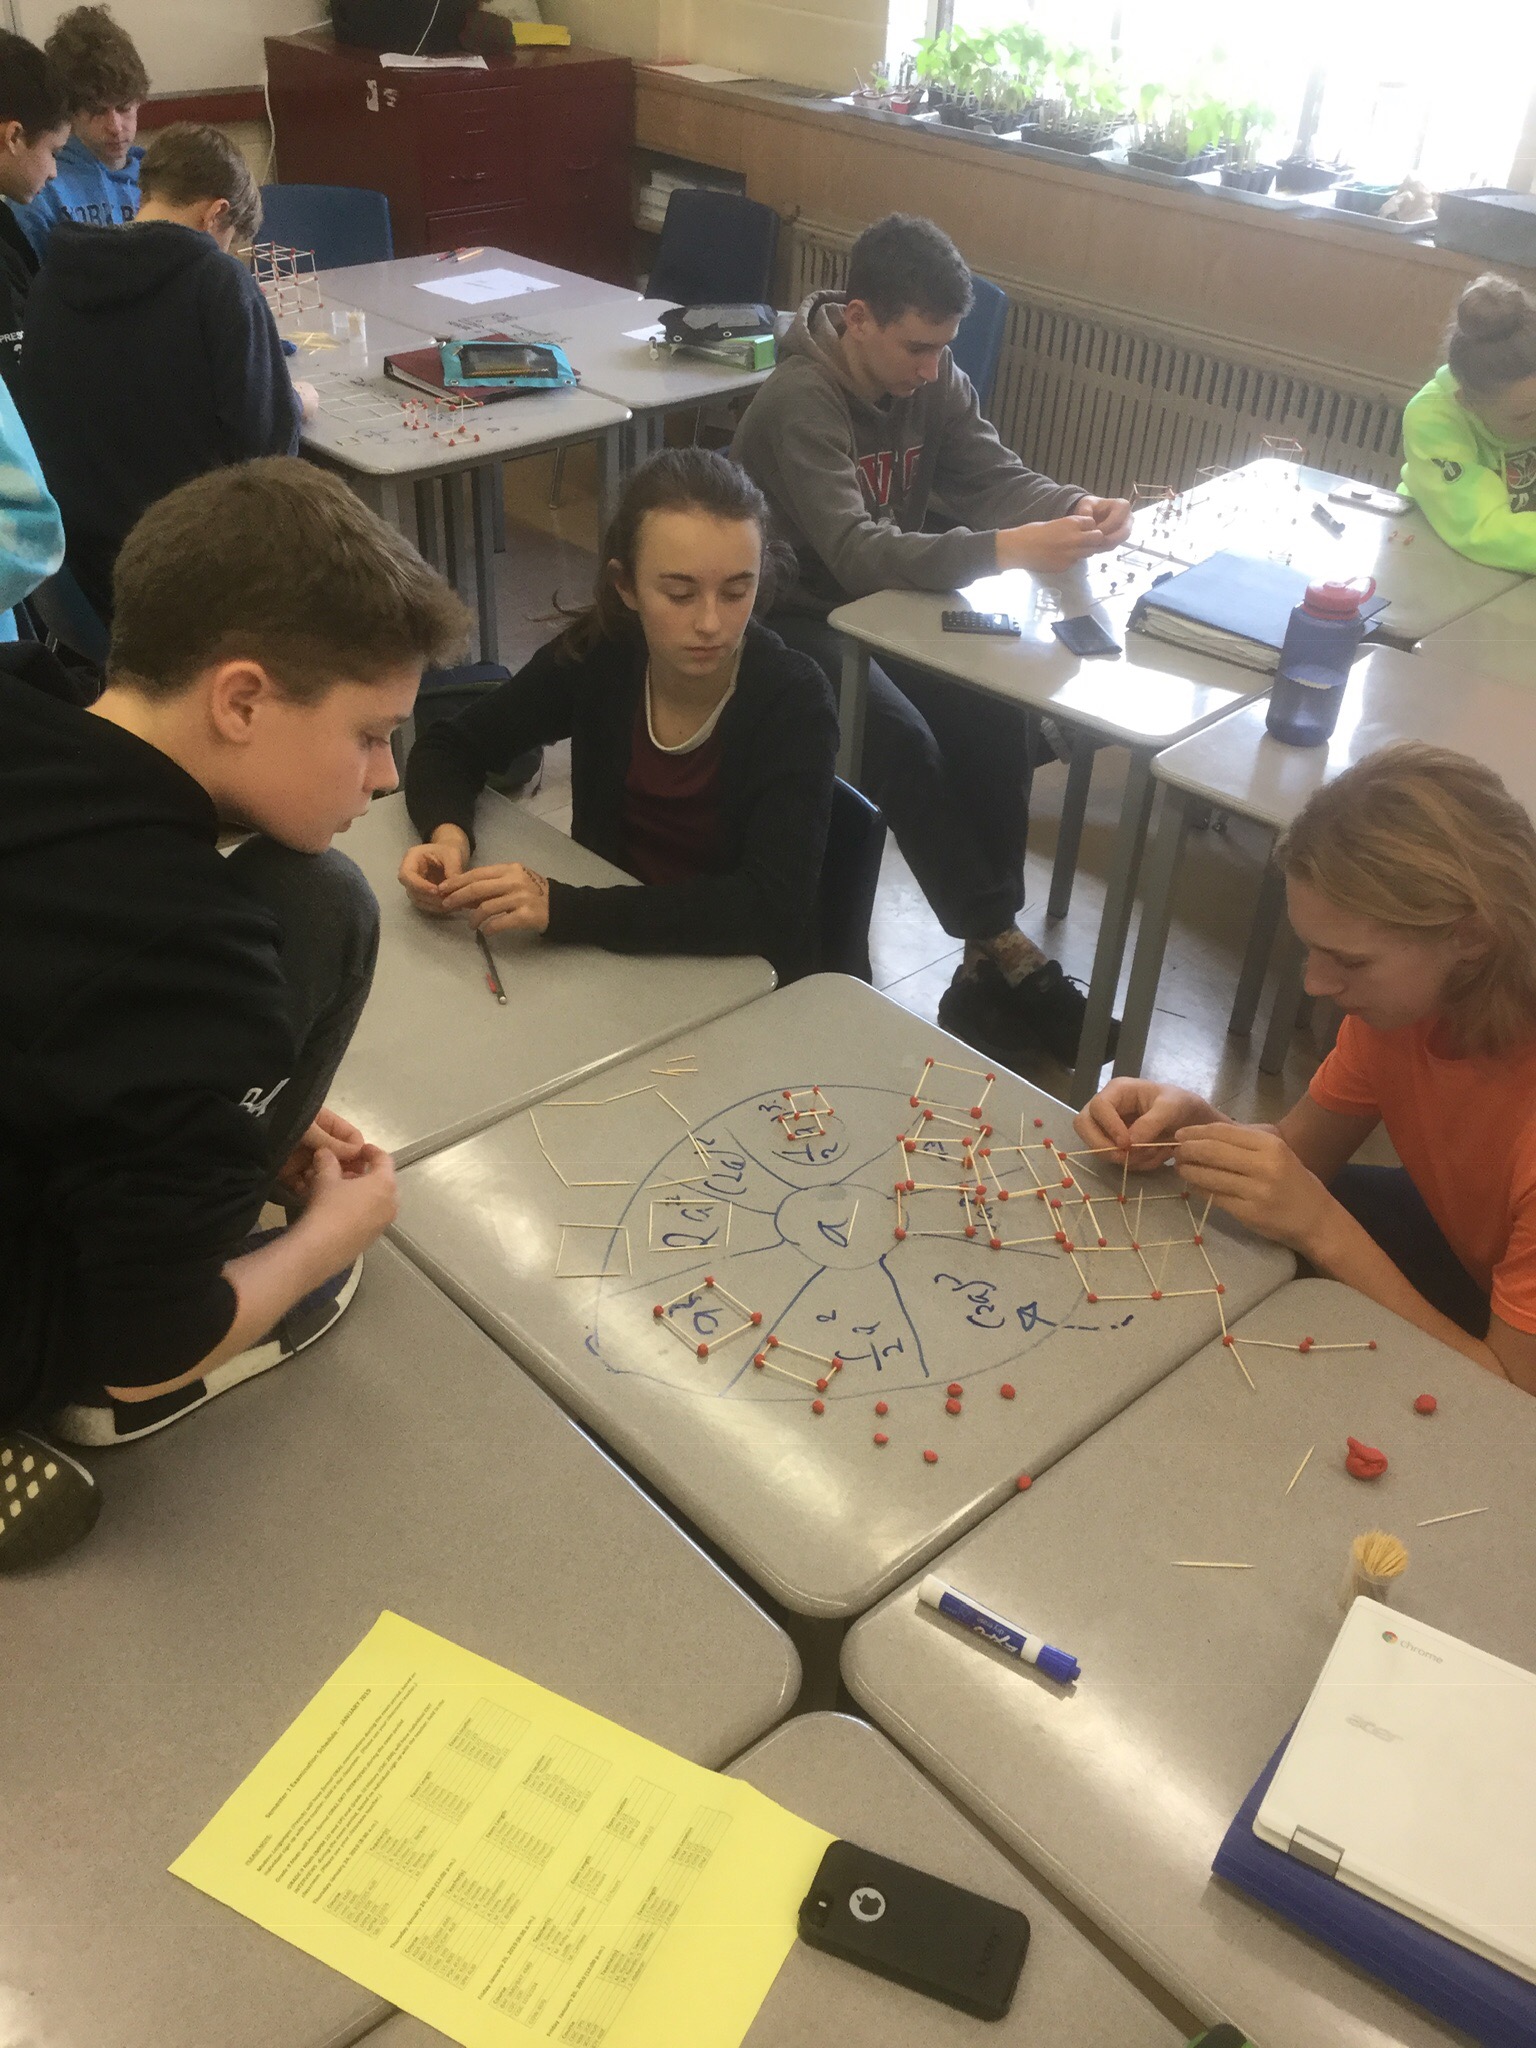
One group even made a representation of (3x)^3
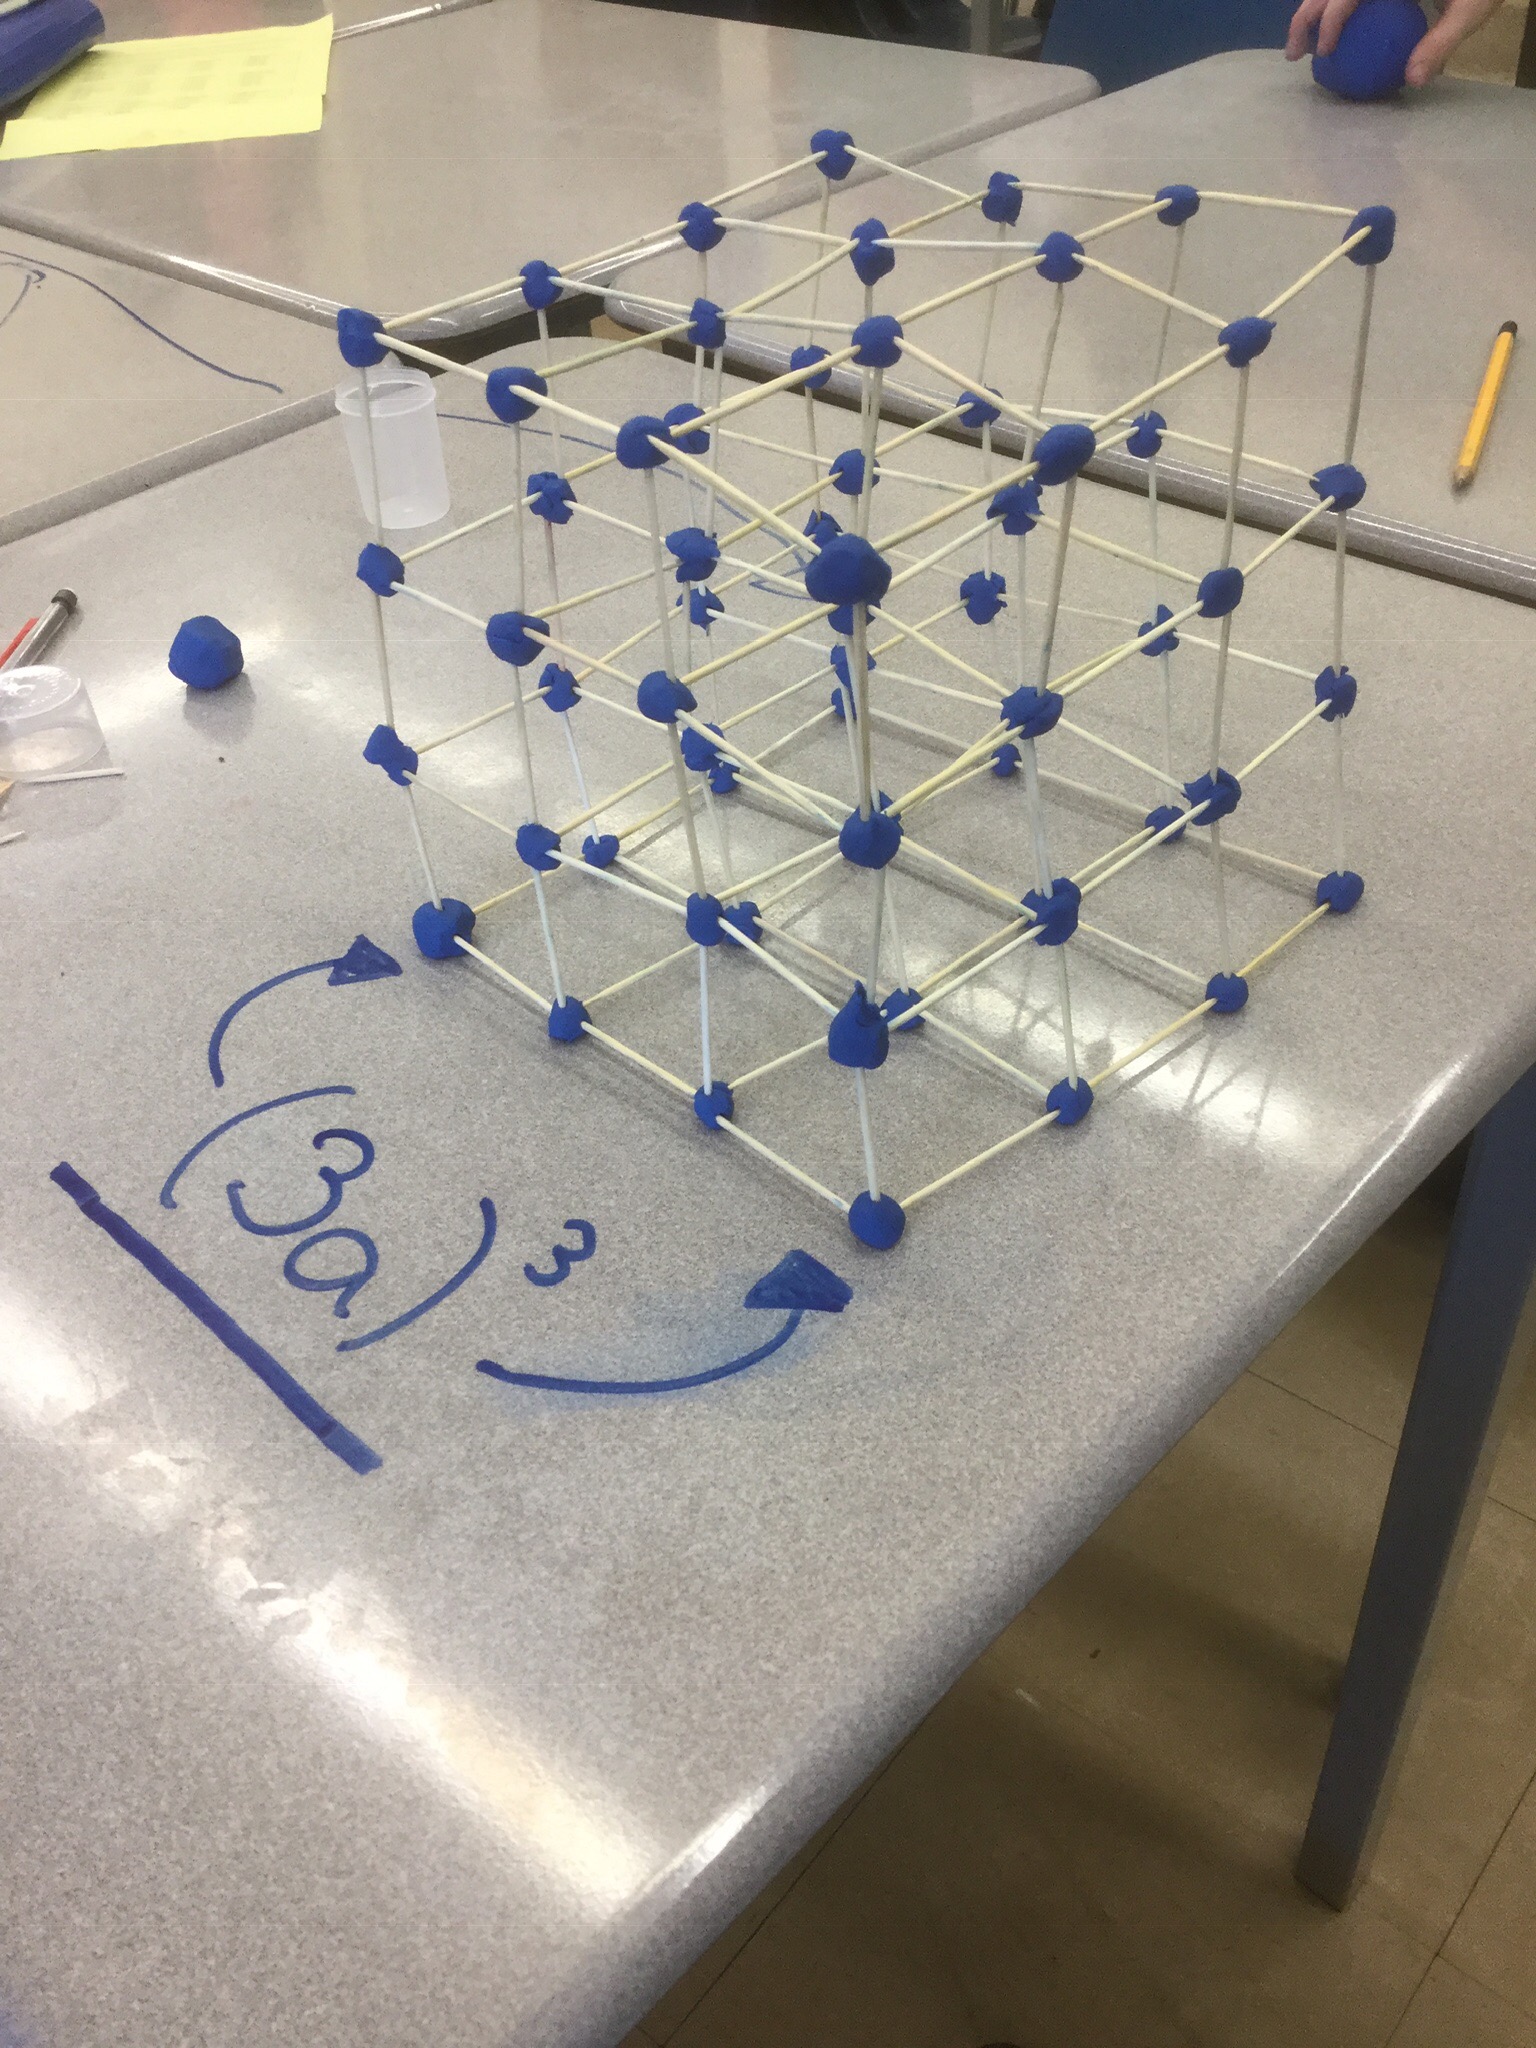
We started to explore how many little cubes (x cubes) there are inside, and look for connections with the algebra and the physical model. We will continue doing more with this in coming days.
Visual patterns in grade 10
In grade 10 we are working on quadratics. We looked at visualpatterns.org and modelled some patterns by drawing terms 4 and 5 and 0 to extend the pattern in both directions.
We made tables, and looked at differences (it’s quadratic if the 2nd difference is constant). We also looked for groups of “n” and squares of “n”.
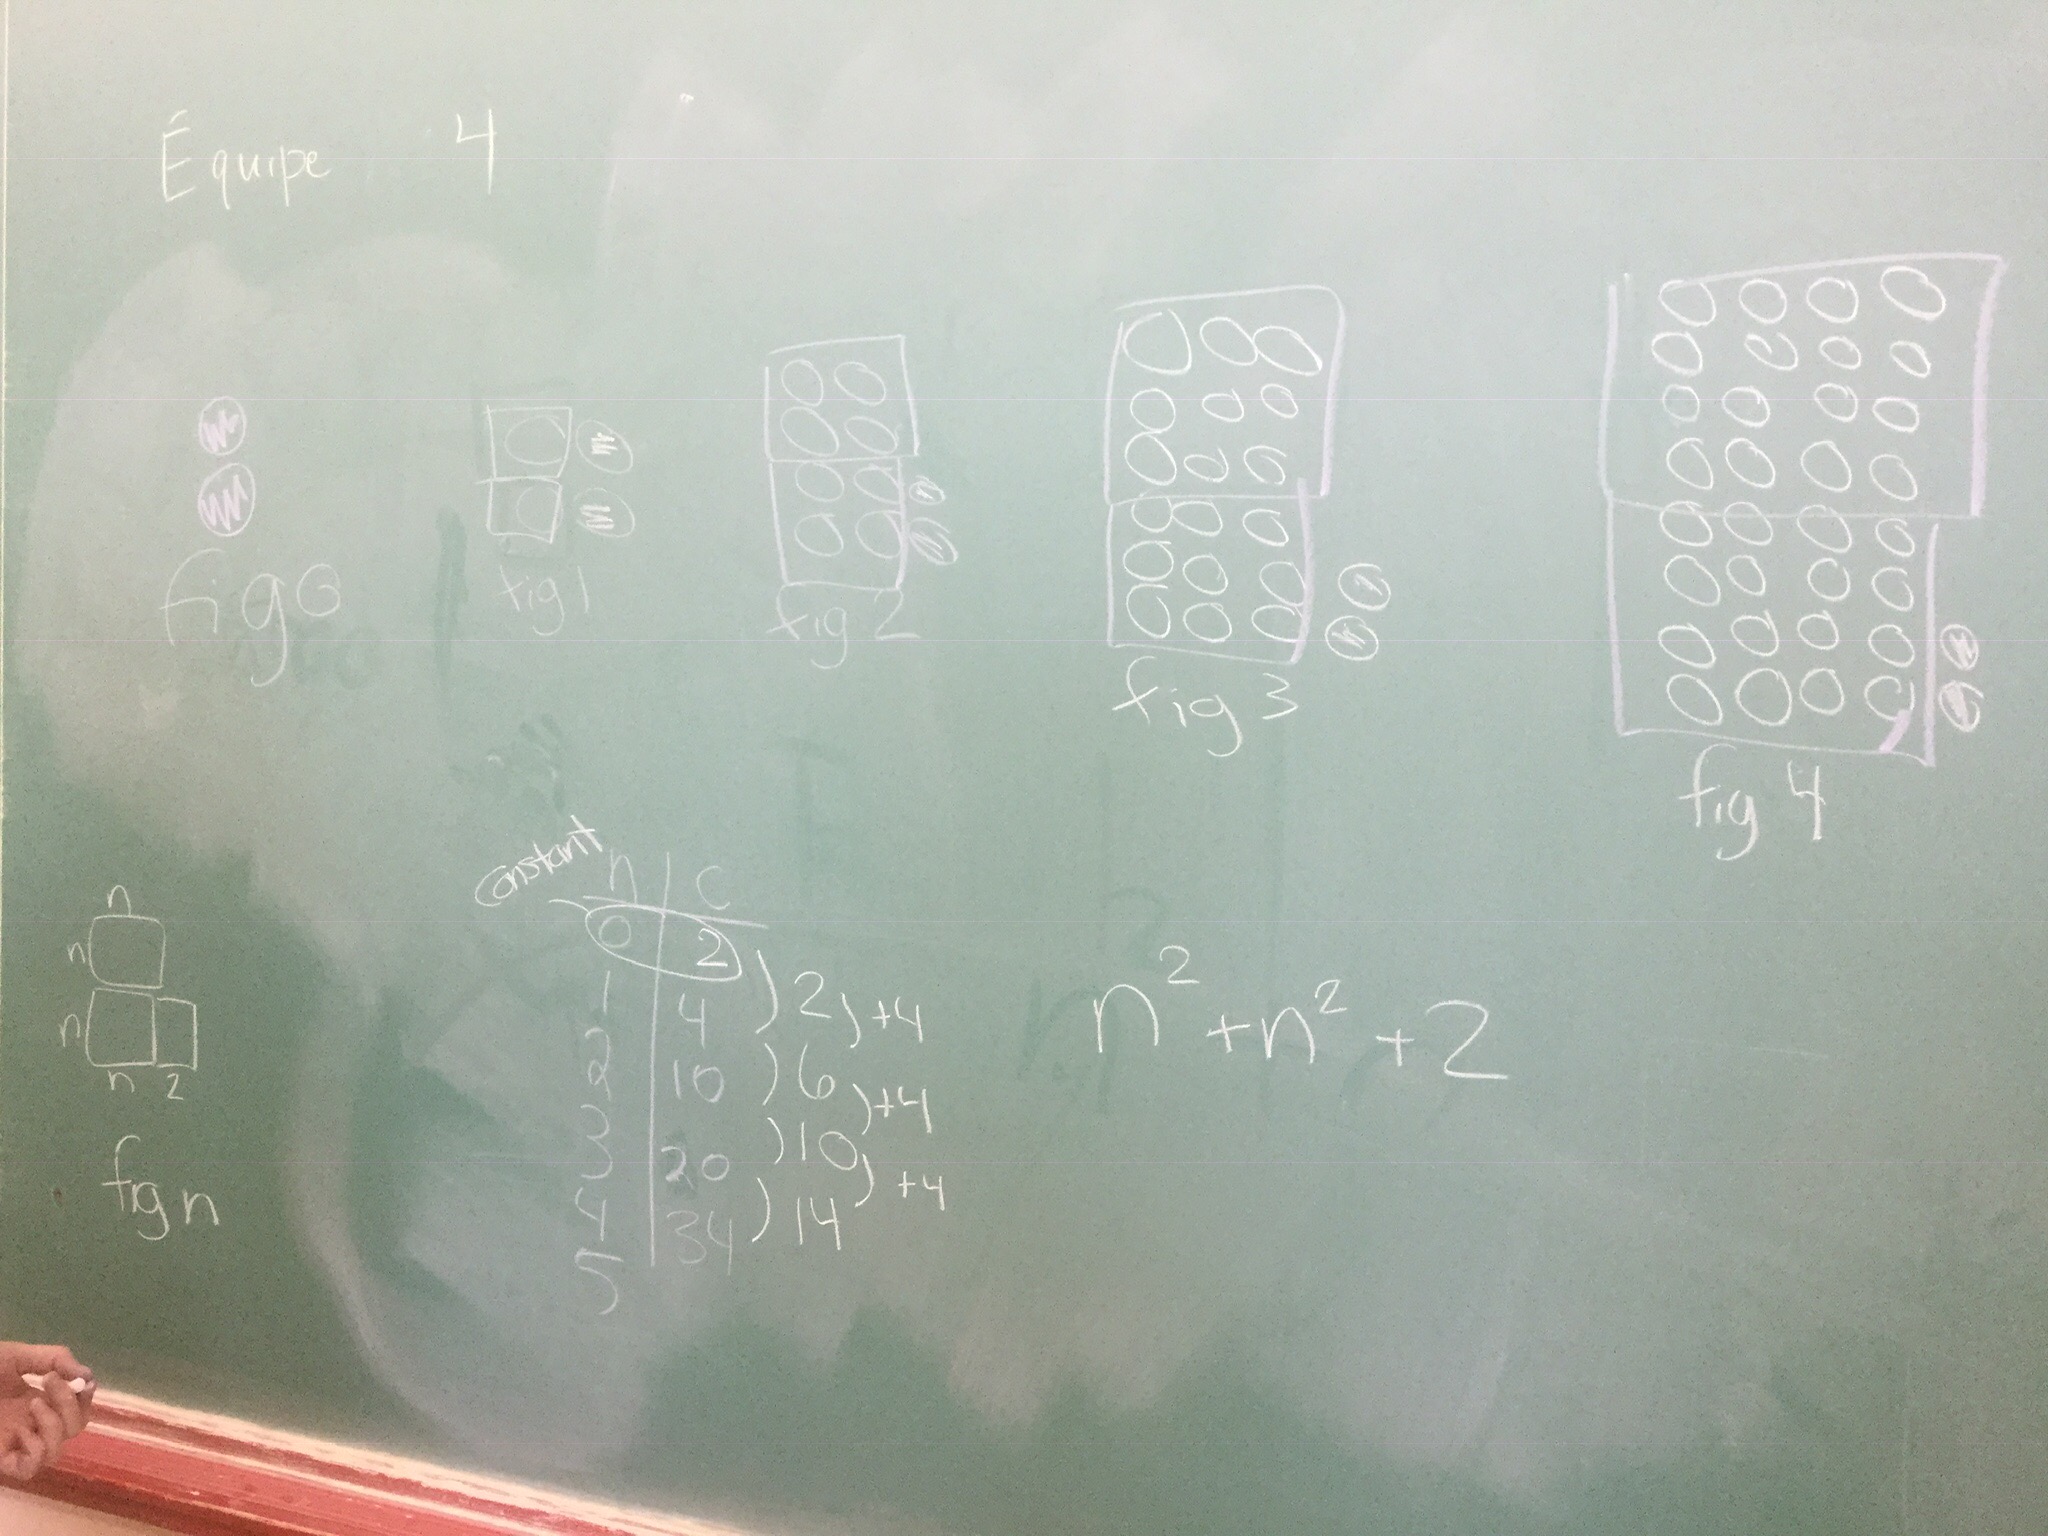
We notice the constant, and colour it so we can see it’s always there. It is also in the equation at the end (the term with no variable).
We also made our own patterns from a given expression.
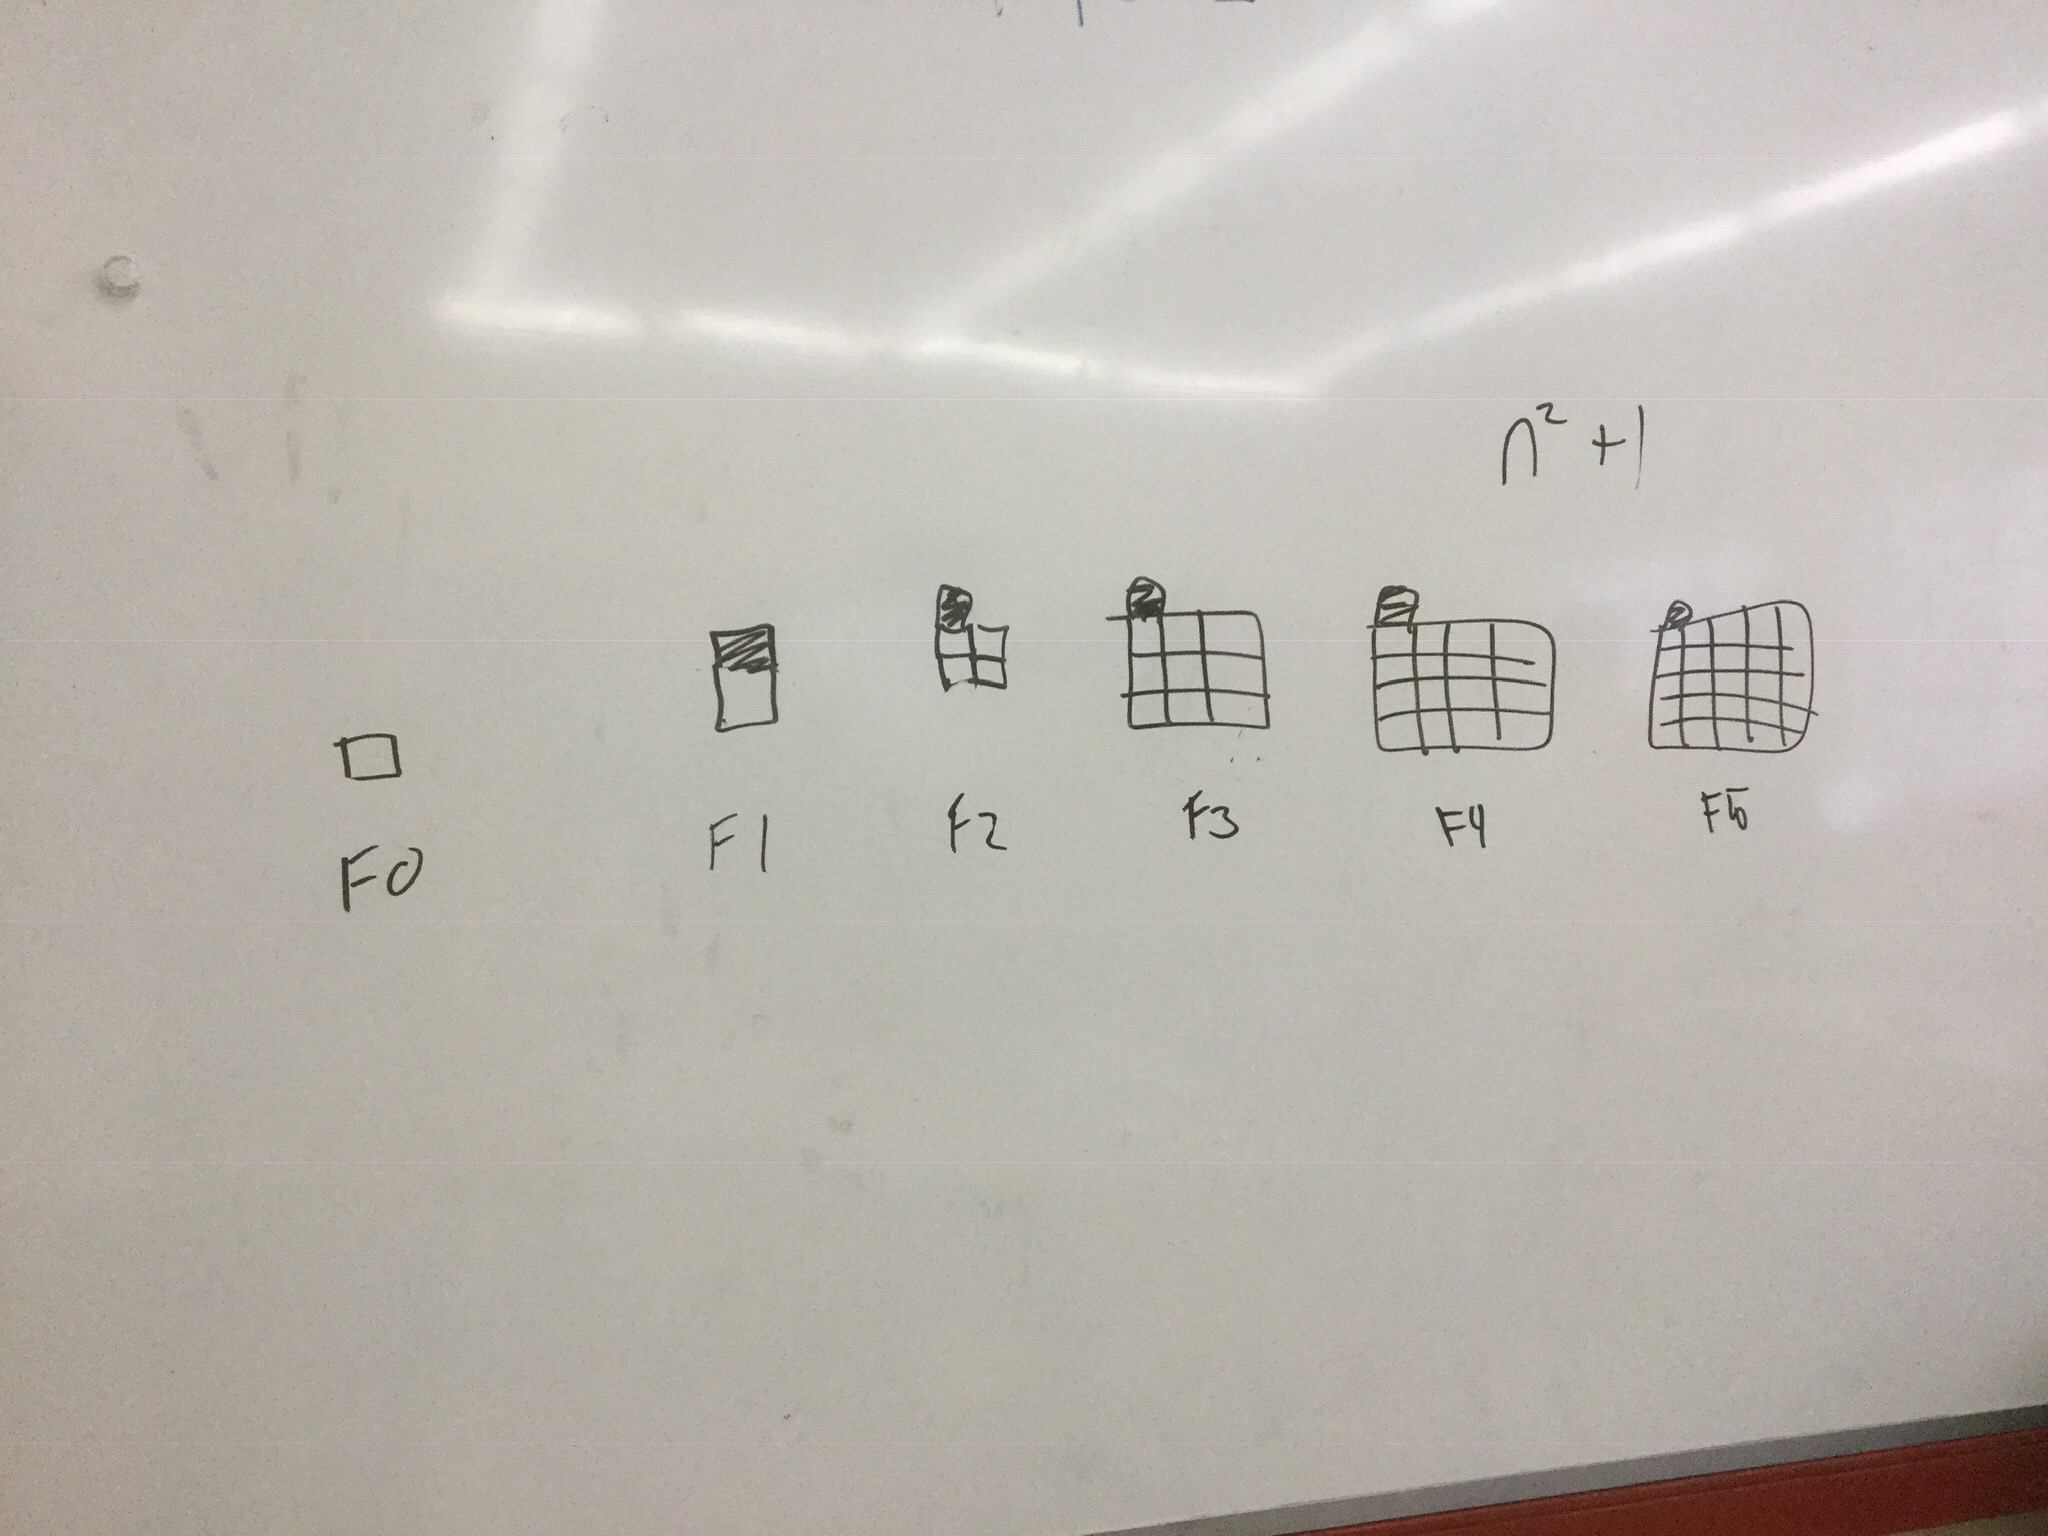
We noticed by the end of the class that the “a” value (the coefficient of the squared term) is HALF of the 2nd difference.
Algebra and concept circles
We are working on representing abstract concepts with concrete manipulatives to build conceptual understanding. Today we used a concept circle where we can change the “a” (what is in the center of the circle) and we can represent all the other expressions in terms of “a”
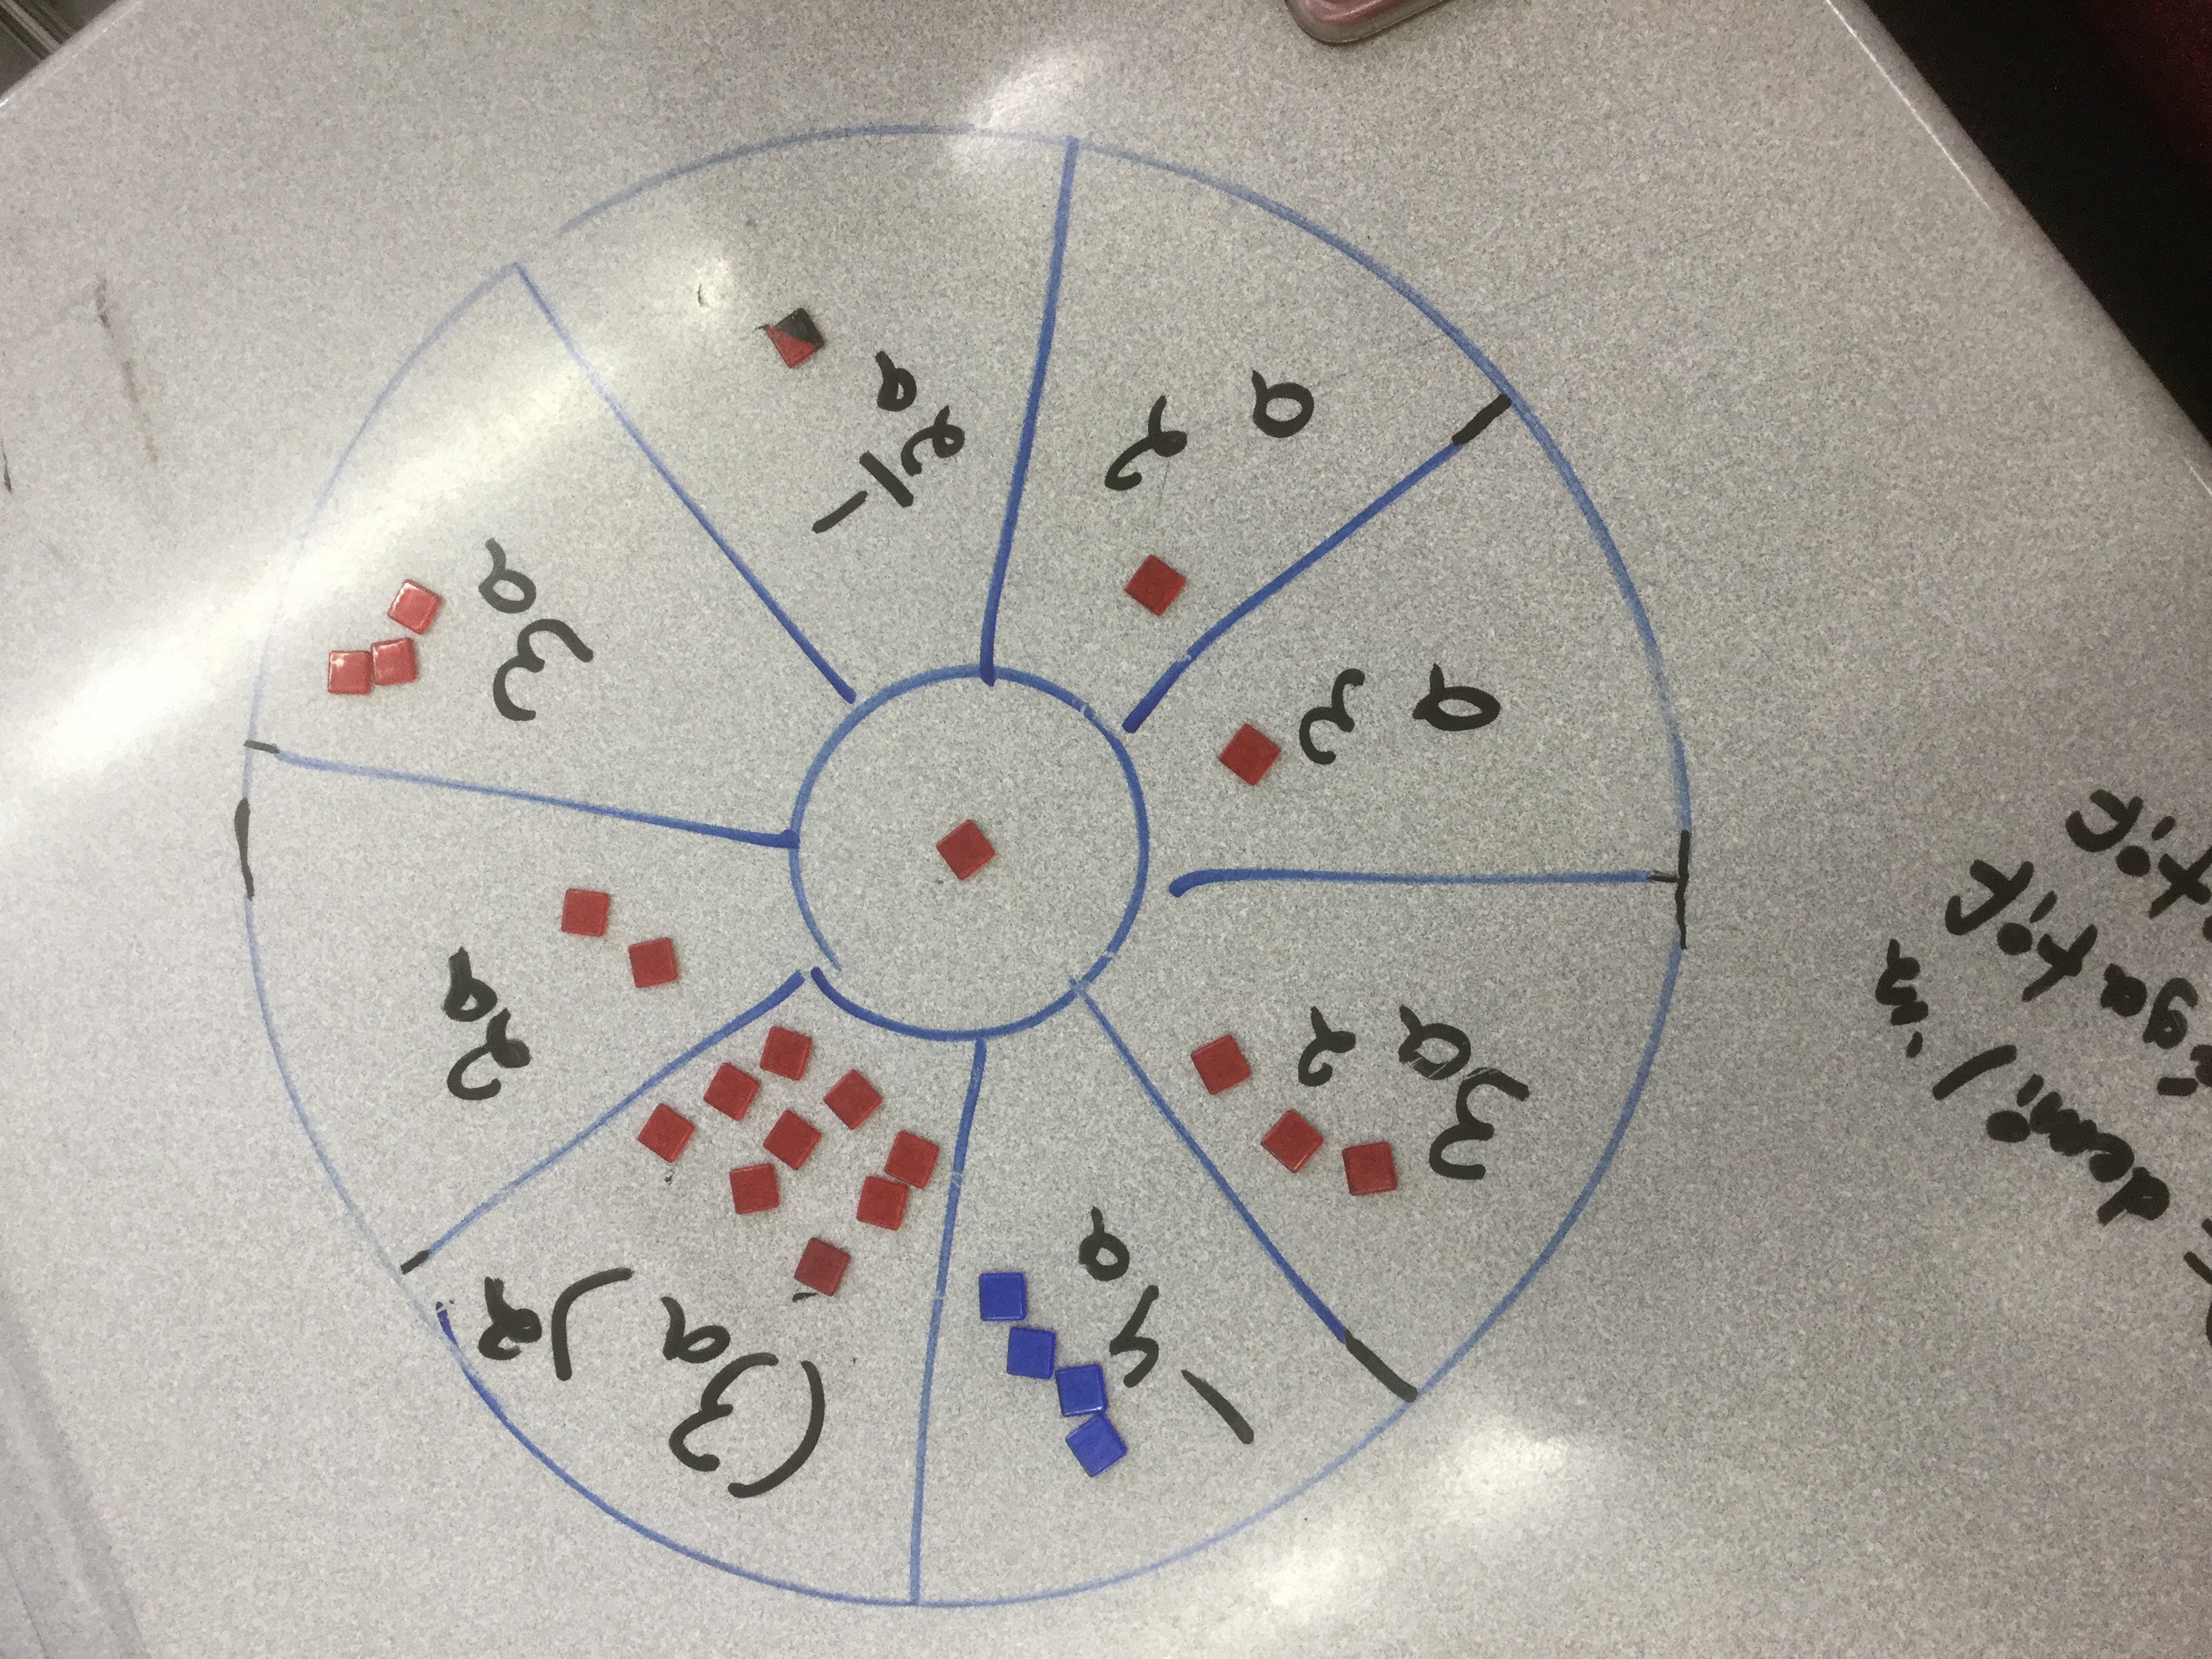 We called this tile “1” to do some of our figuring. We needed to do a bit more thinking when the tile in the center was the rectangular tile, representing “x”.
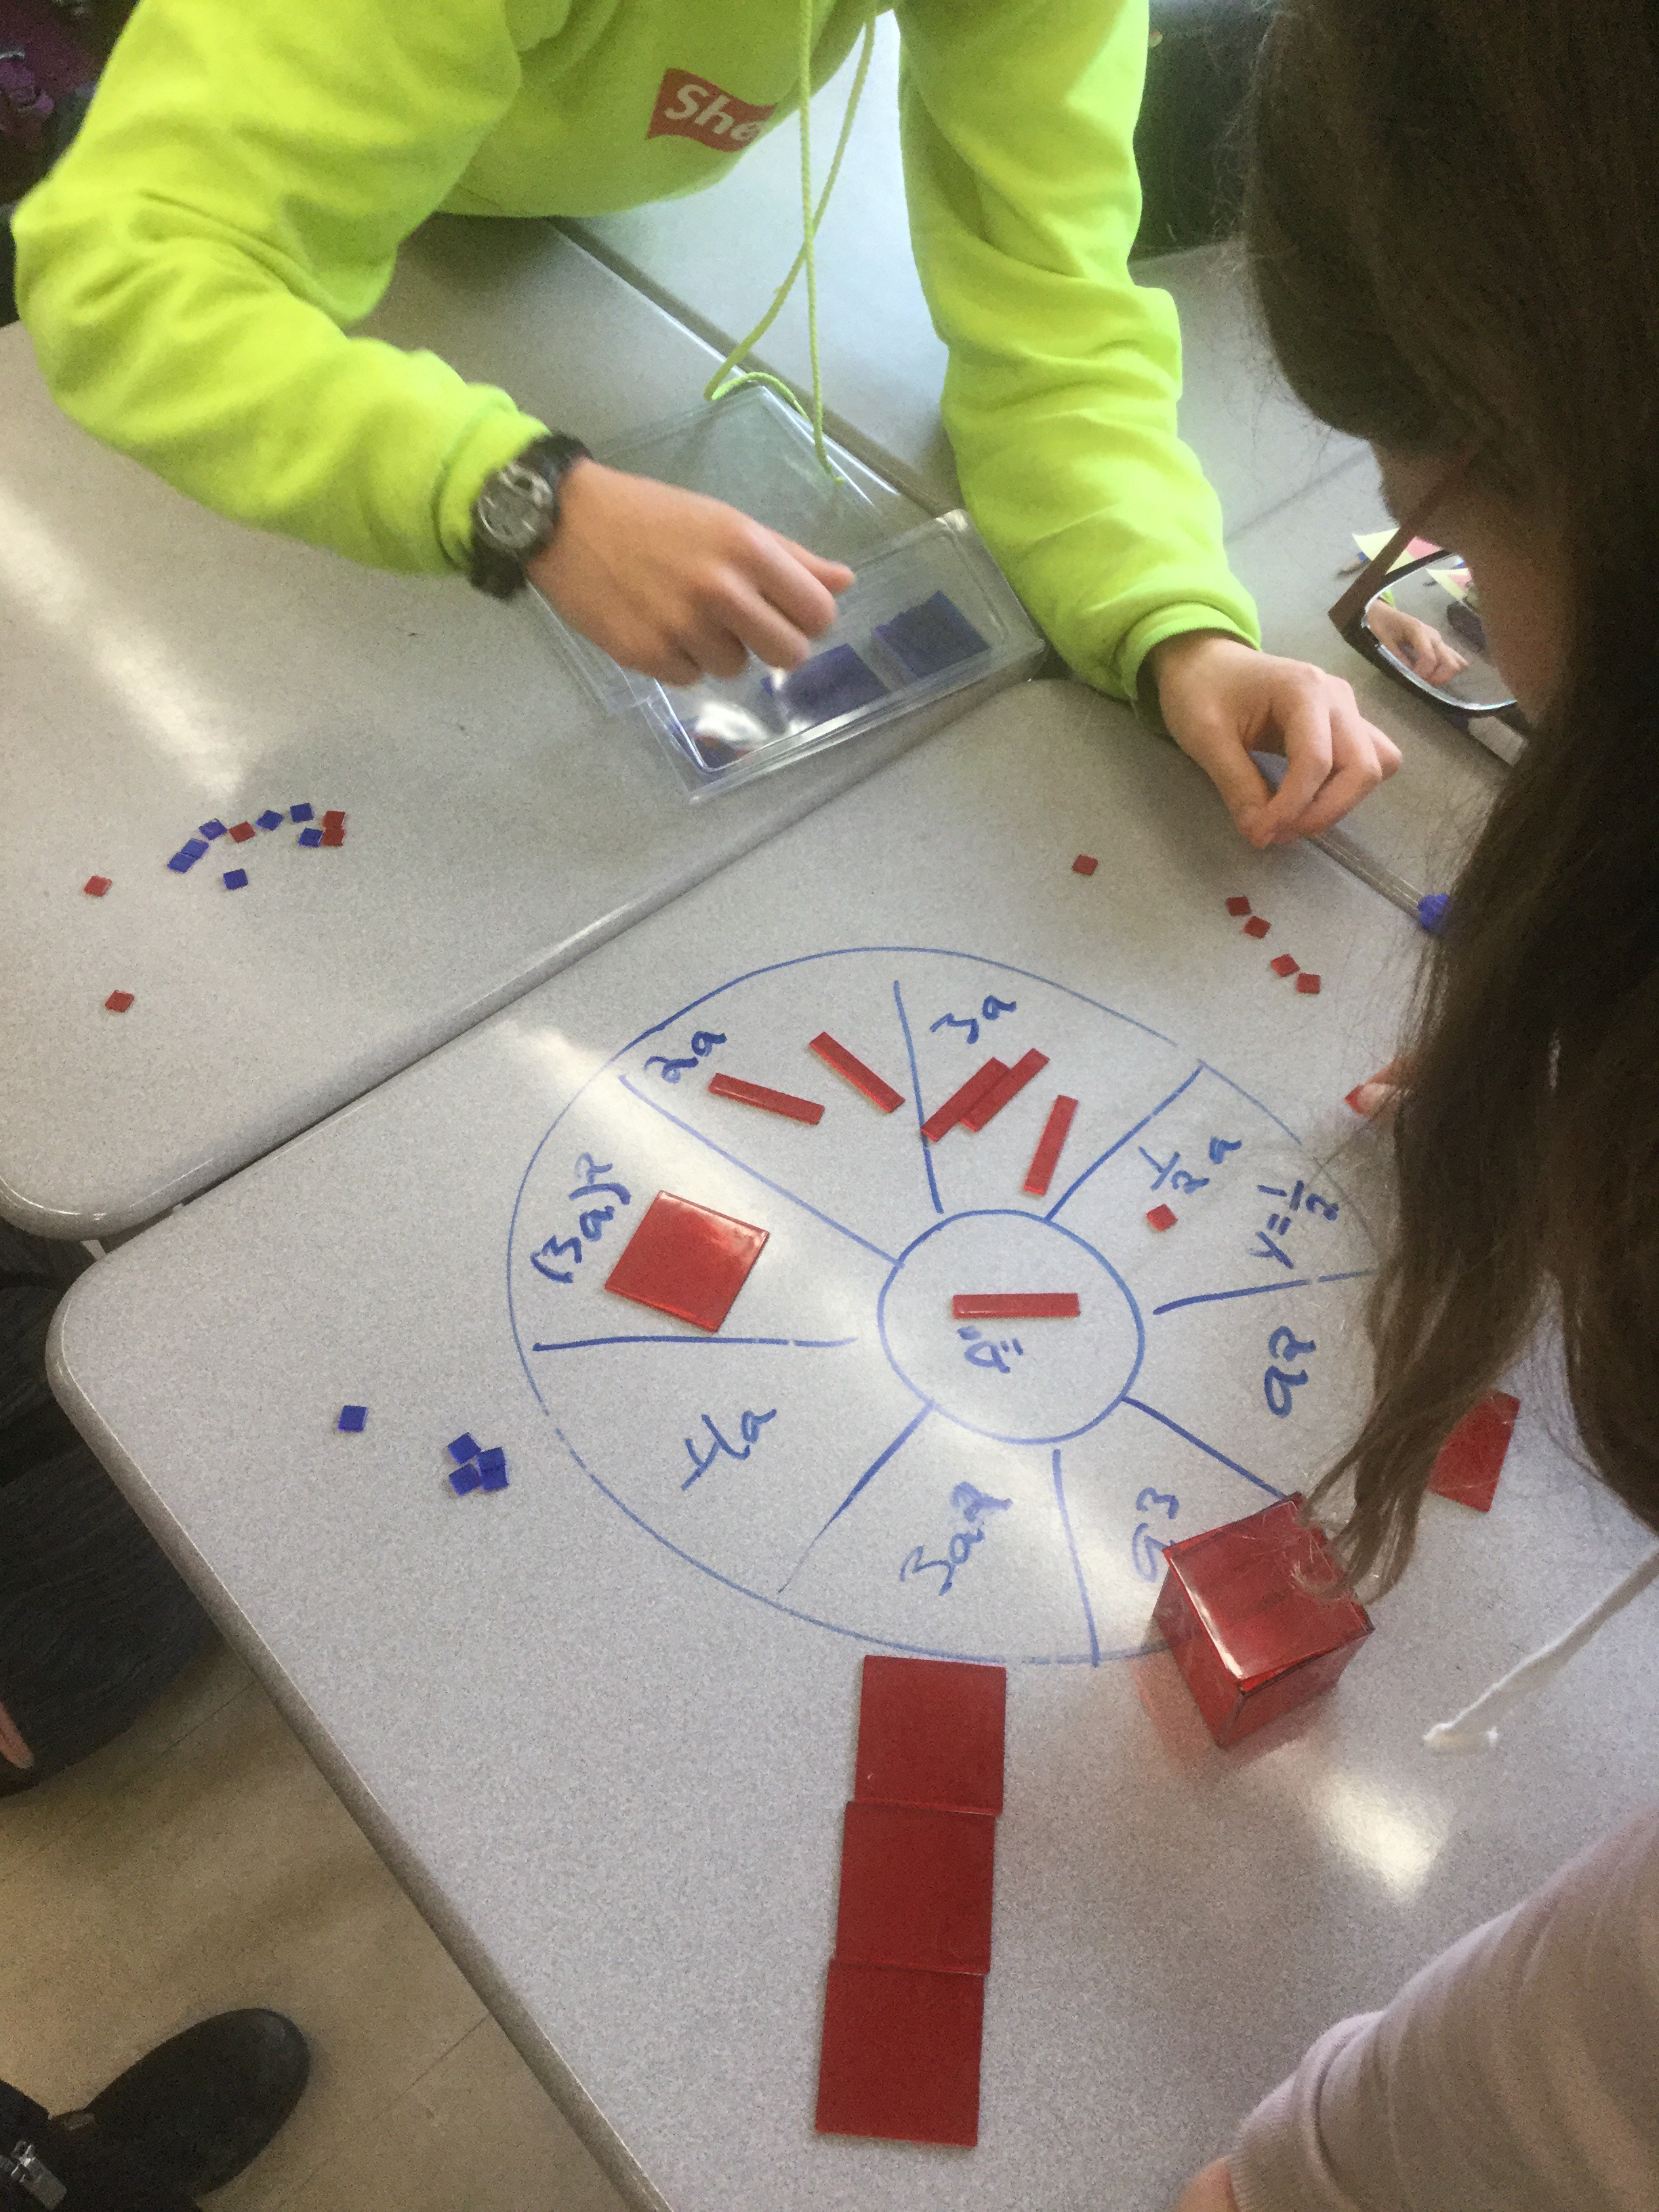
We saw that the rectangular tile is a variable, and so to show a variable squared we need the big square tile, and a variable cubed can be actually a cube!
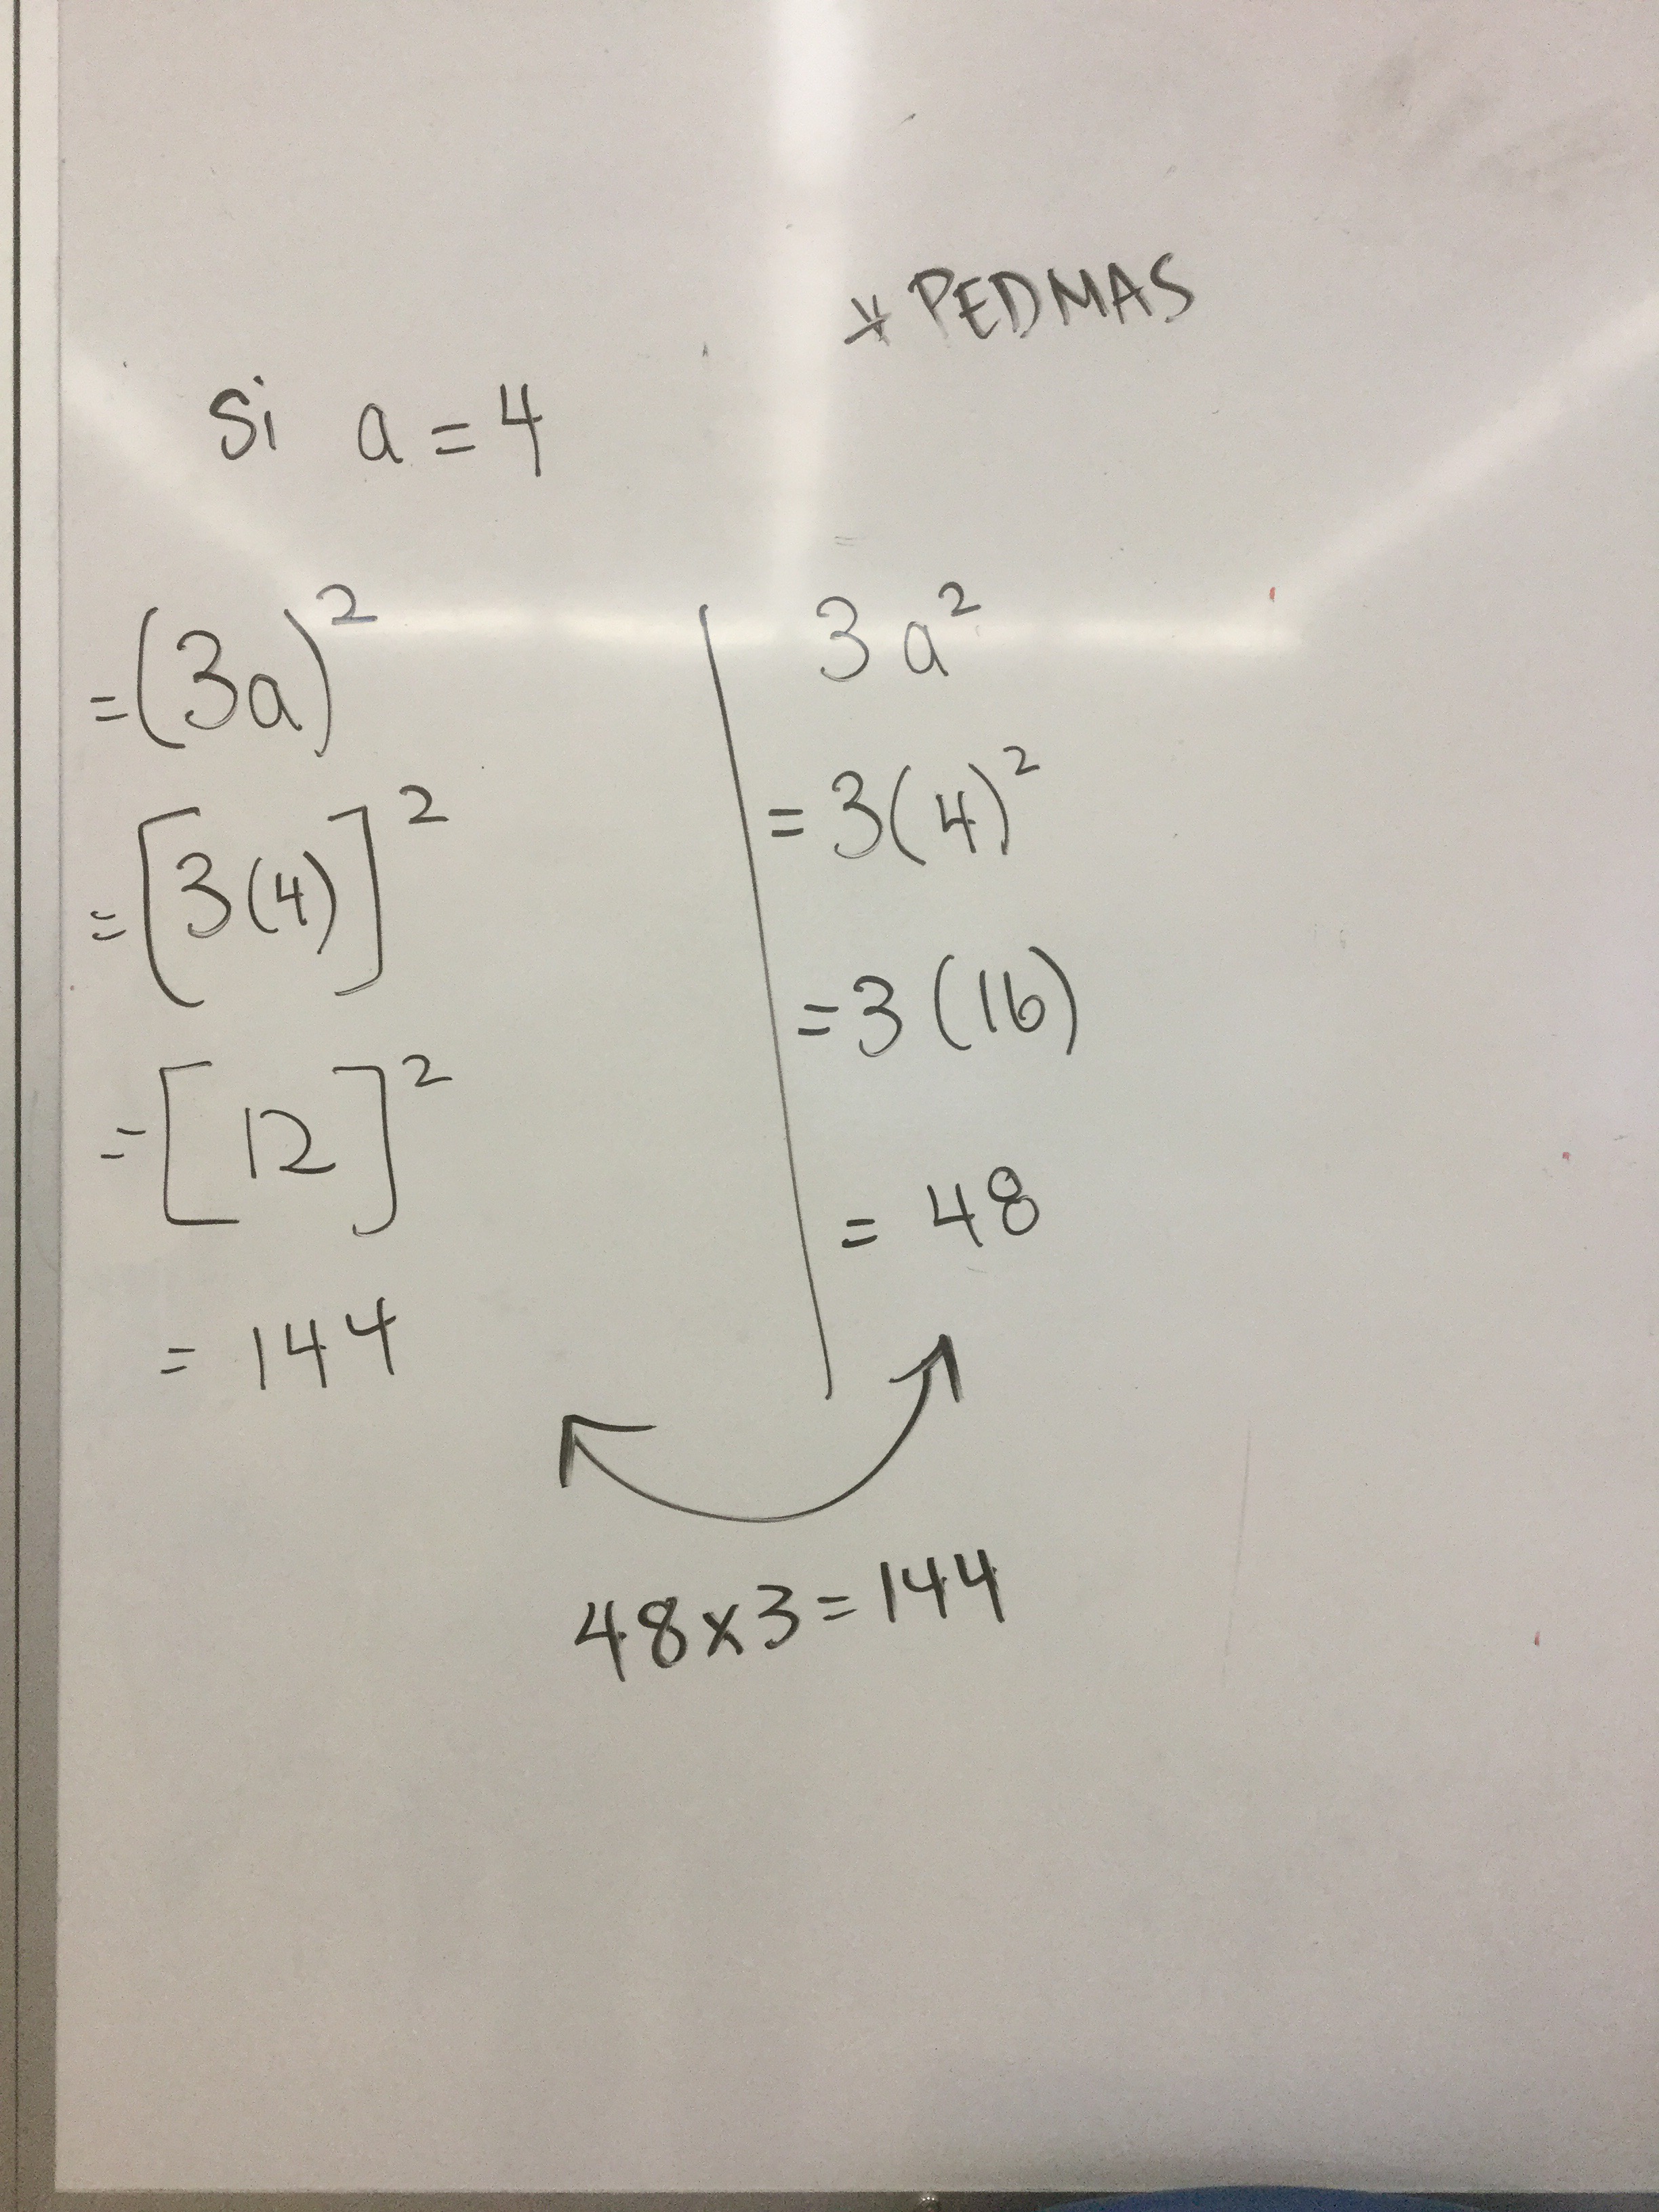
We took a summary note which covers the importance of noticing the brackets and following PEDMAS
Snow day
Today the school buses are not running due to the snow. This means our summatives are postponed to MONDAY. Stay safe. Schools are open. Teachers will arrive to school as it is safe for them. You can come to the school and get extra help, or work in the library, but there are often very few people at school, so classes don’t usually happen on inclement weather days.
We had a good math review session this morning….
We went from this…
To this…

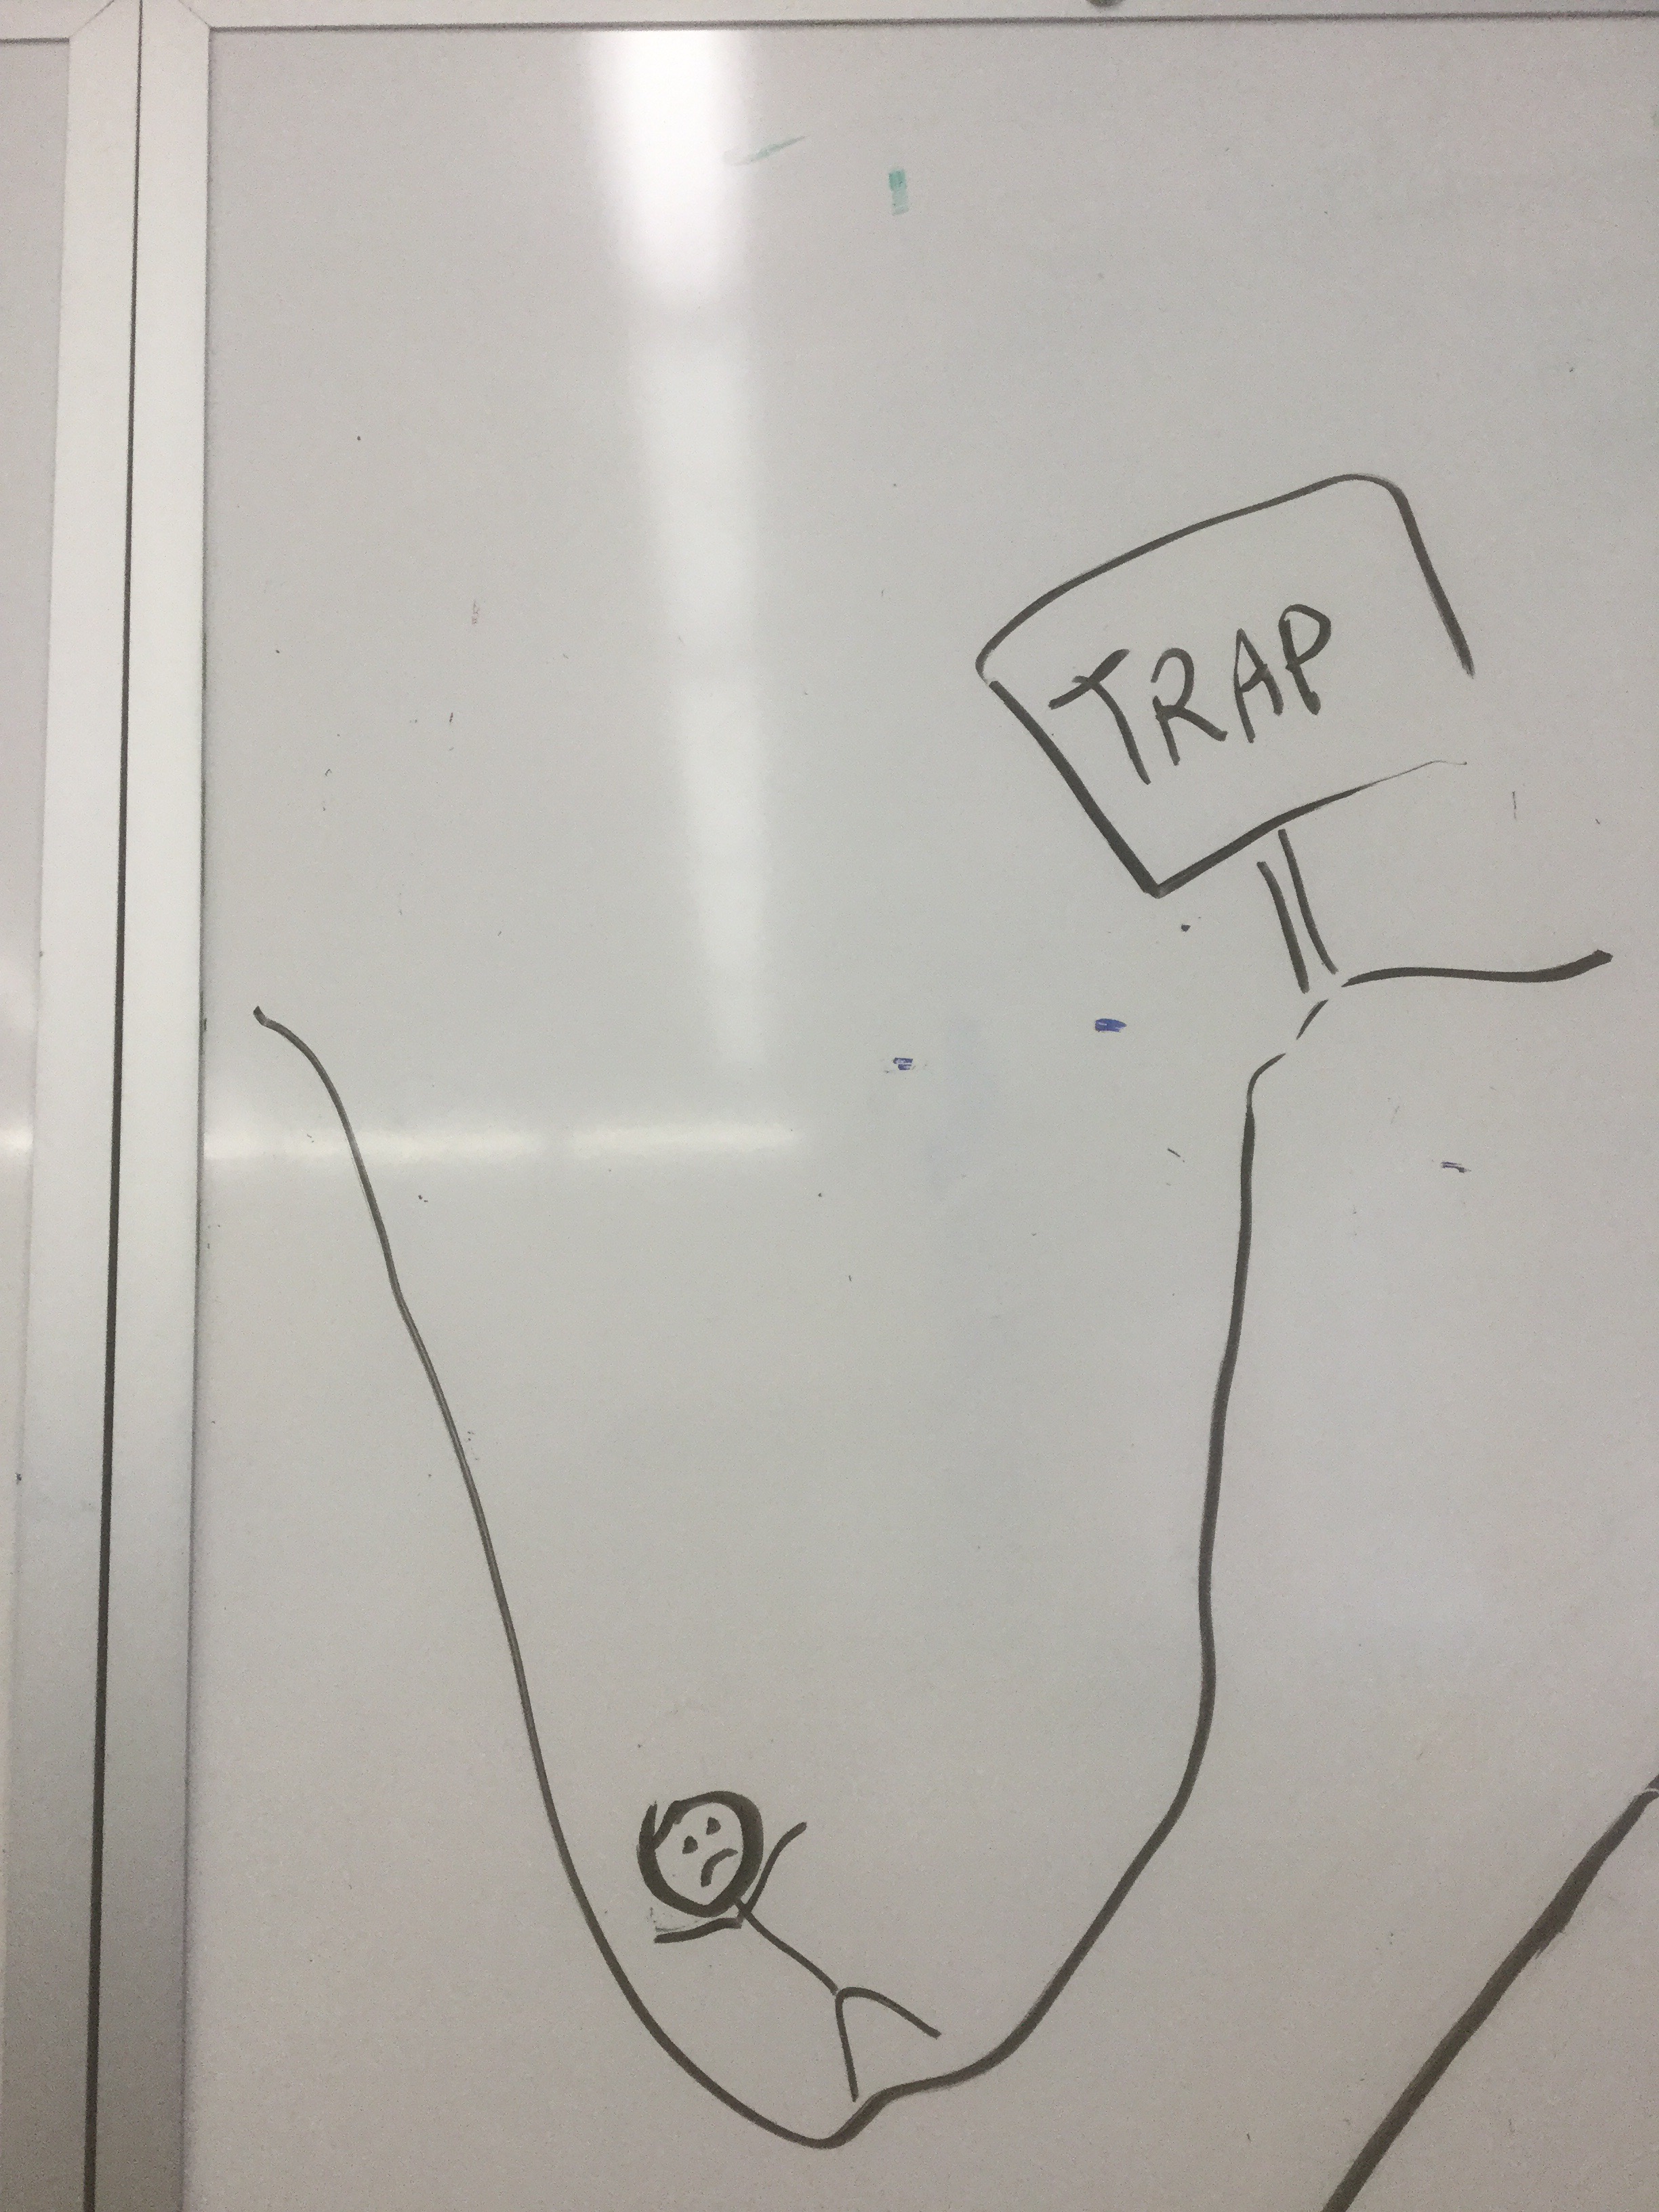
With enough practice we start to see potential pitfalls and traps, and have enough strategies to work through problems, avoiding errors, or at least noticing them and correcting them when they happen.
Algebra tiles!
Grade 9s worked today with algebra tiles. We learned about what each type of tile means, and what a trinomial, binomial, and monomial are.
We learned how to add polynomials, and even made our own problems to meet criteria, like 2 trinomials that add to make a binomial.

The big key is realizing that a red and blue tile of the same shape will cancel out and make zero.