Graphing Lines using Visual Patterns
Today in grade 9 we started graphing lines. We used our skills in visual patterns to help us out. Each group got a pattern rule and 1 inch square tiles to build the pattern. We needed figure 0, figure 1, figure 2, figure 3, figure 4 at least.
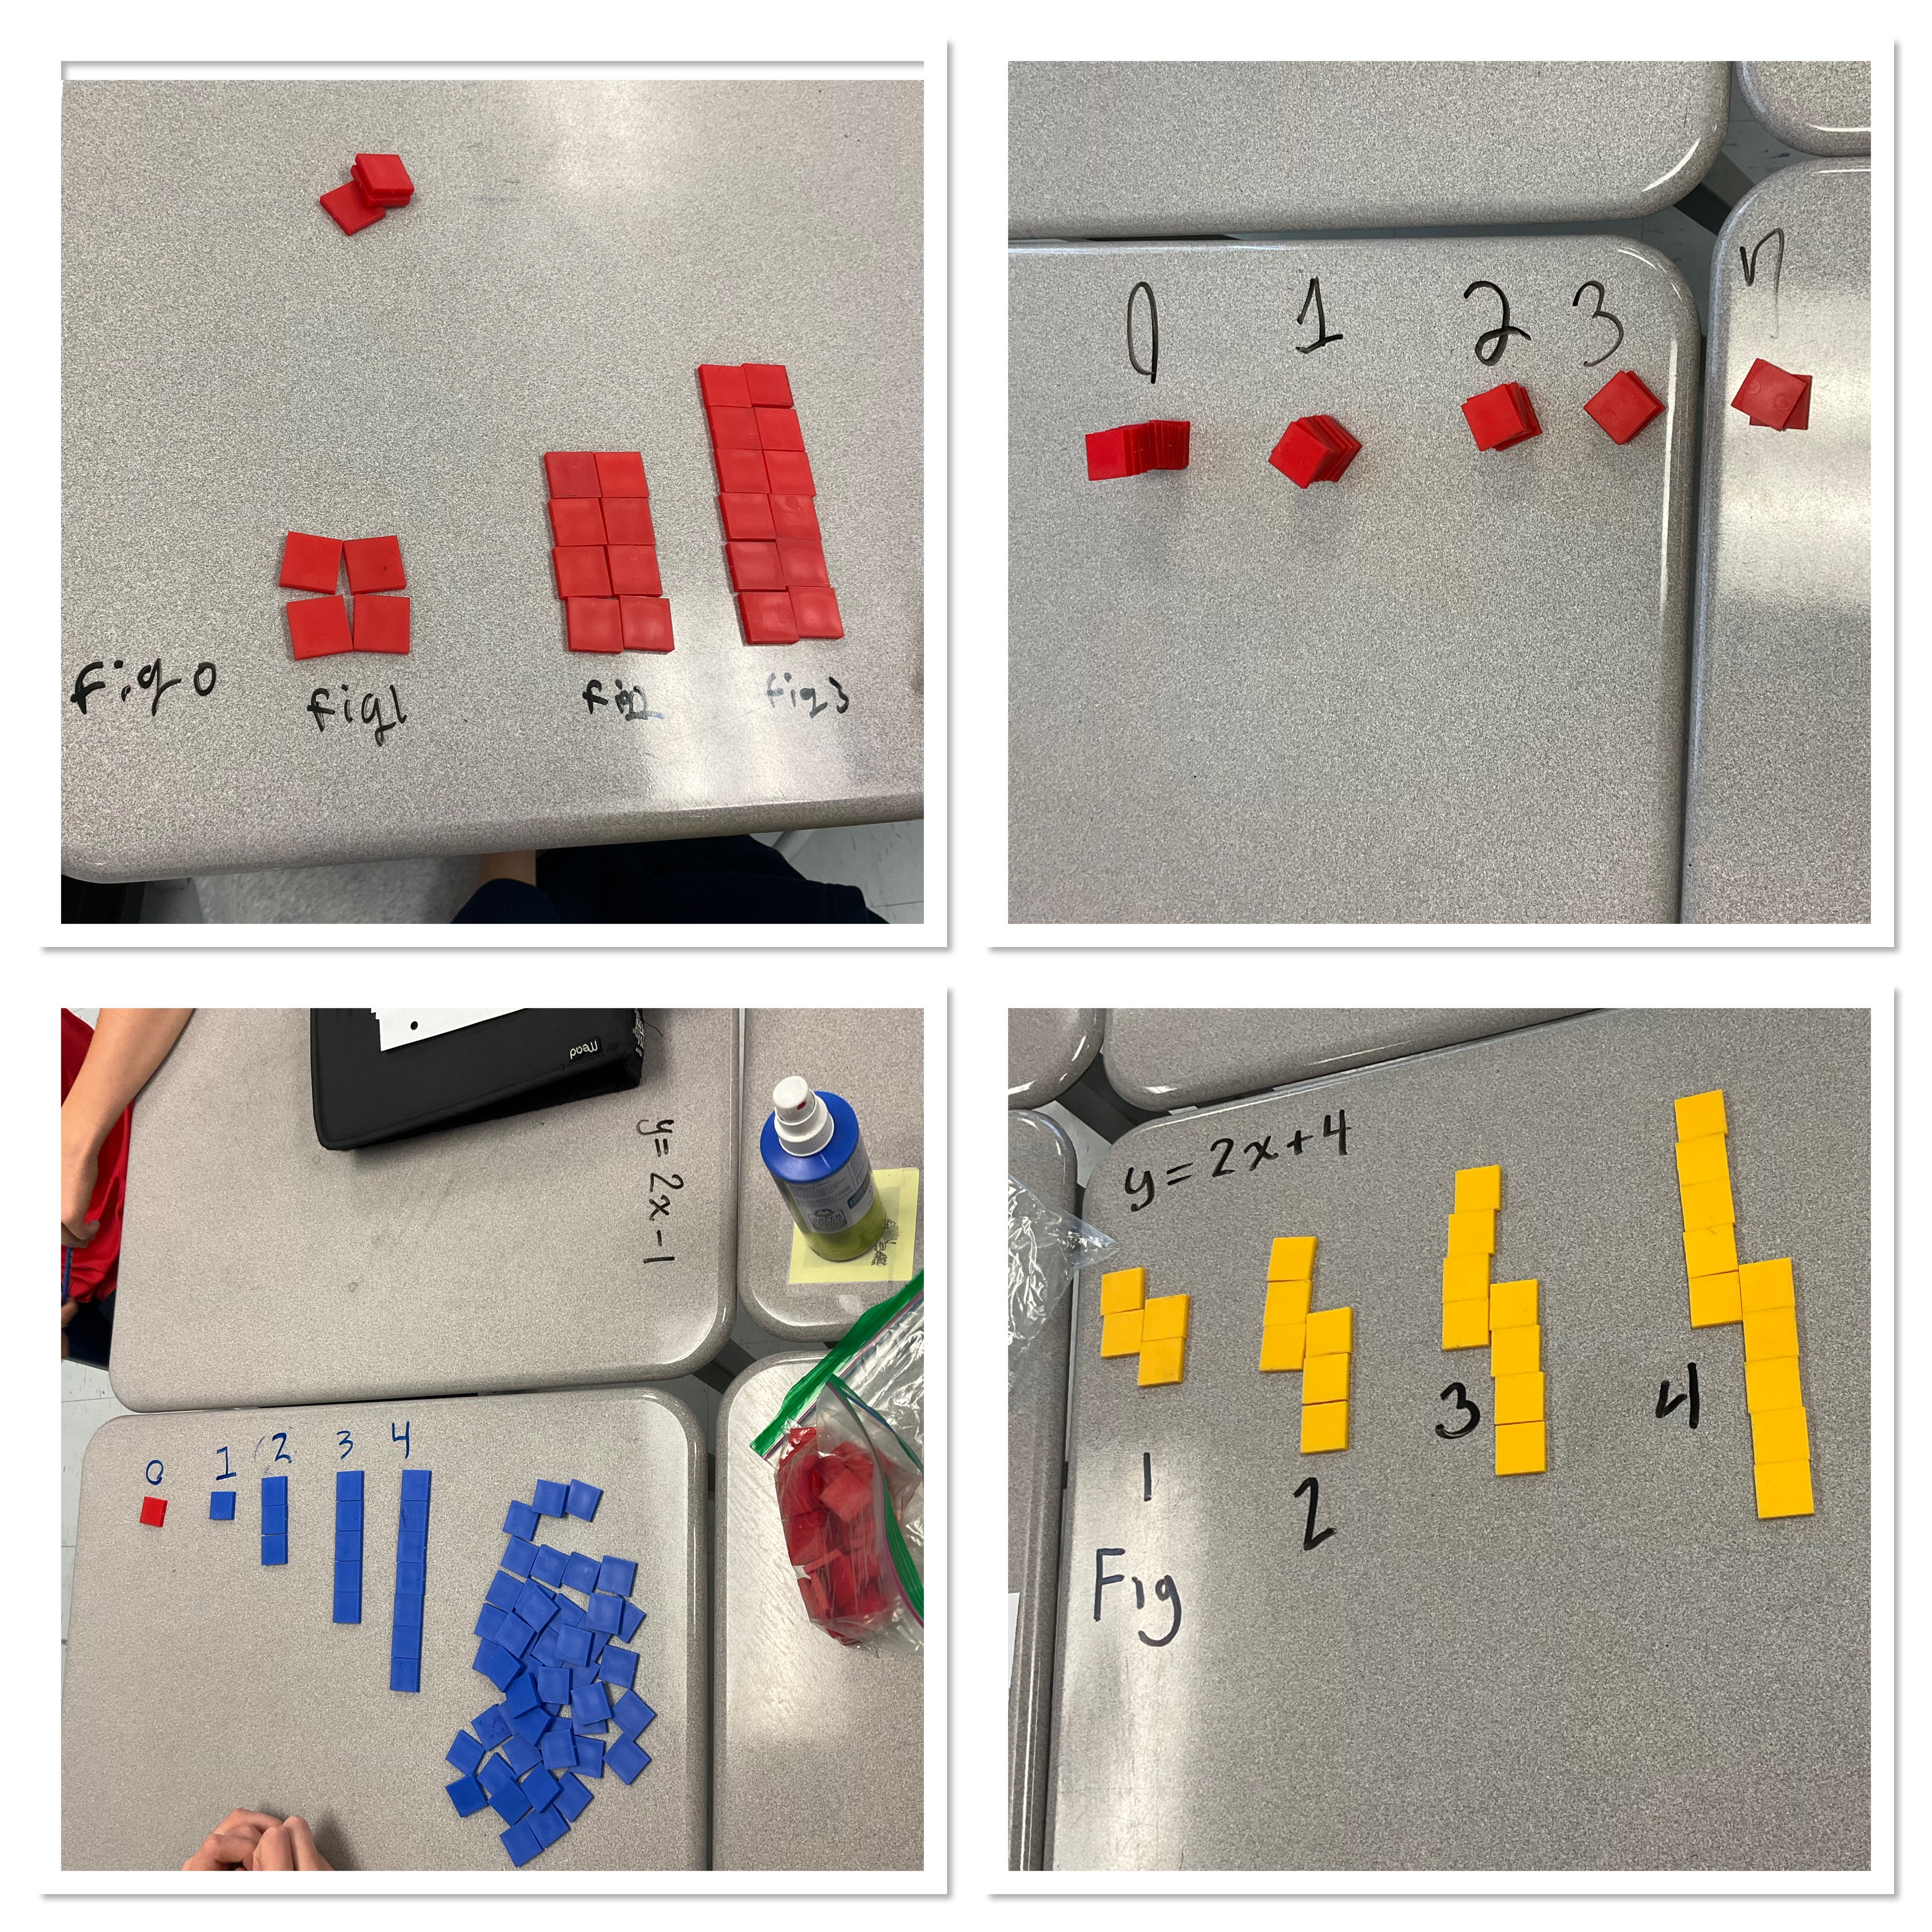
Next groups used 1” grid chart paper with x ans y axes drawn on it. They carefully moved all the tiles from figure 0 into a column on the graph paper that lined up with the y axis. They drew a dot at the top left of their column. The next figure was then dismantled and rebuilt into a column beside figure 0. A dot was placed at the top left. This was repeated until all of their figures had been moved and traced.
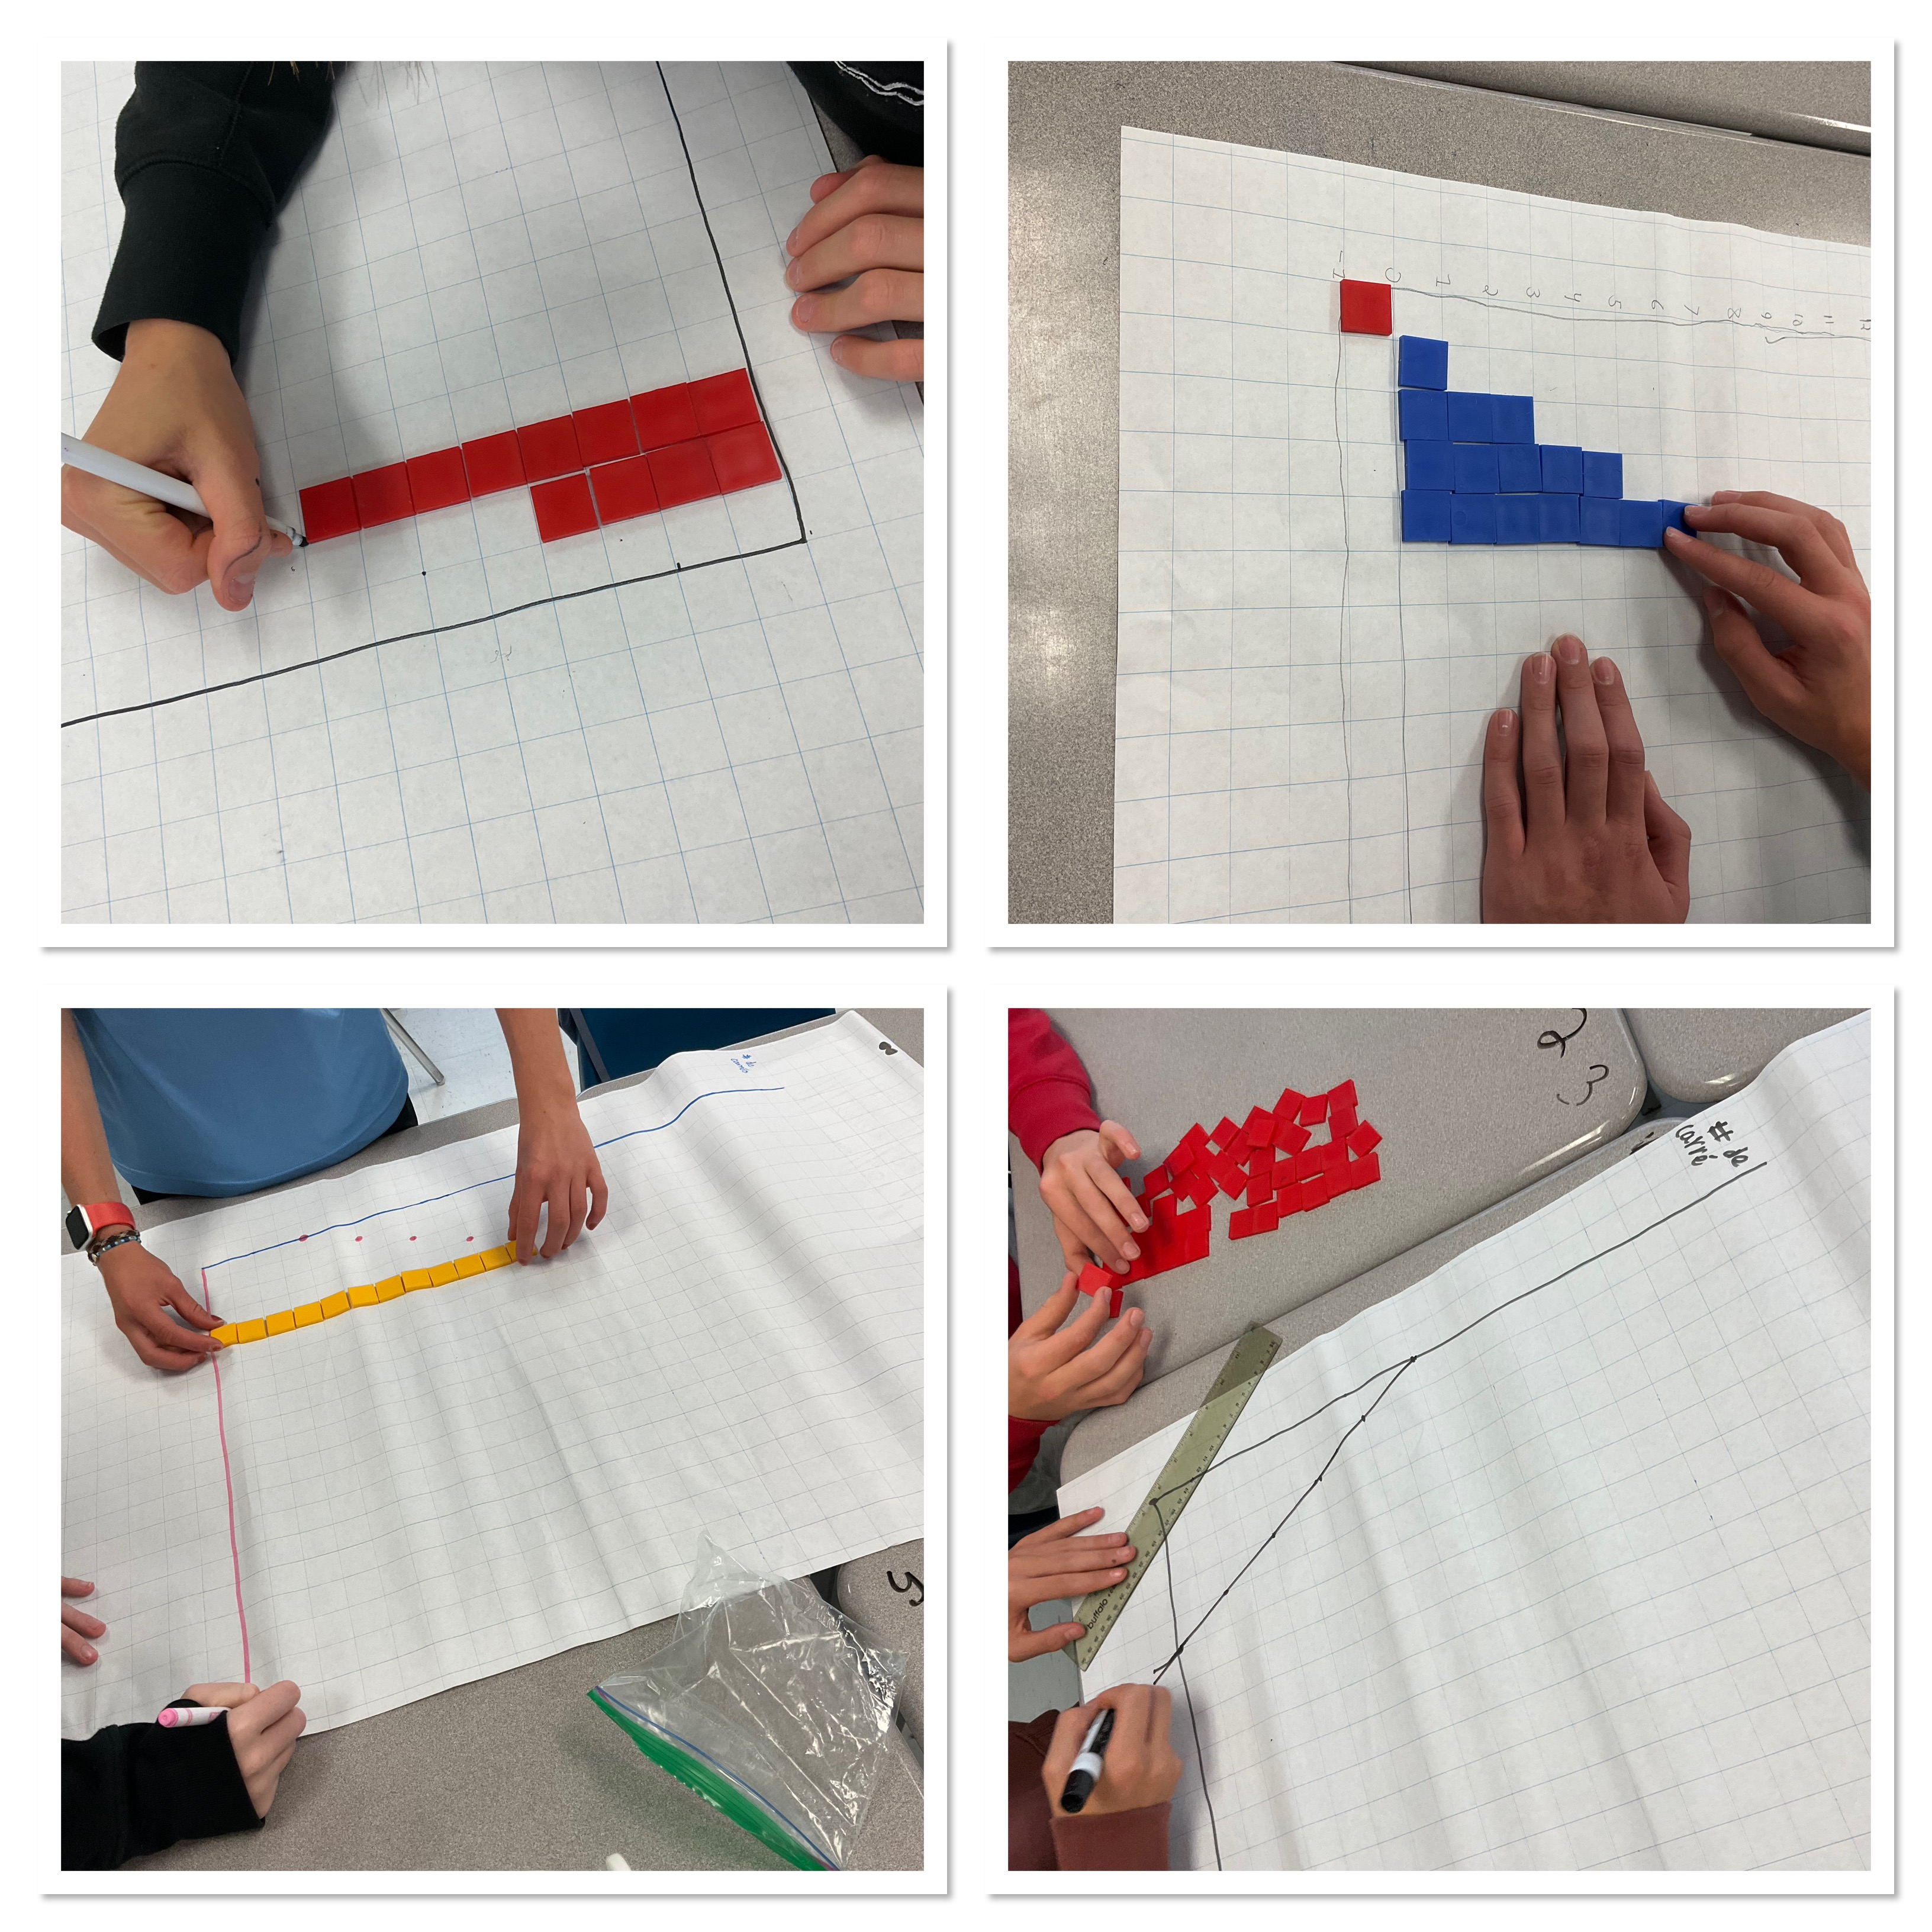
Next the dots were connected to form the line. Groups were given a different pattern rule and we did the same steps making a second graph superimposed on the first.

Finally we put them on the wall and then did some consolidation from our examples.
We identified parallel lines, how they have the same slope and will never intersect. We noticed that the slope is the number in front of the x, that multiplies the x. That’s also the rate of change. In French, le taux, la pente. We noticed that the constant will give us the y intercept on our graph.

We looked at slopes that were steeper and less steep. We noticed that the bigger the value for the slope, the more the line increases each time. We saw that if the equation was just y=4x that the constant is 0, and the line crosses the y axis at the origine (0,0). Here there is an intersection point at (1,4).

This graph shows a line with a positive slope of 2, and a line with a negative slope of -1. We noticed that the equation can be written like y=2x-1 or y=4-x, the constant could come first or last. We noticed that the constant represents where the graph crosses the y axis, even when it’s a negative number, so we needed to extend the axis down to accommodate it. We estimated the intersection point here. There’s a way to calculate it, but we’re not there yet.

Here we have 2 negative slopes, representing decreasing patterns. There is an intersection point, which is also called the solution. We can draw slope triangles to see the rise and run and visualize the slope.

We noted that it’s possible for a system of equations to intersect 0 times if the lines are parallel and distinct, 1 time if the slopes are different, and infinite times if the two lines are the same exact lines.
We finished off the class watching some excellent videos
Hopefully this summary helps those who were away at leadership camp get caught up!
Non-linear patterning
In grade 9 we were exploring linear and non-linear patterns. We had to decide if this pattern is linear or non-linear.

Students knew that the patten works by adding one each time, so the pattern rule is y=1x+3.
There was a lot of discussion about this next pattern. Some saw it as linear, where we’d add 7 each time.
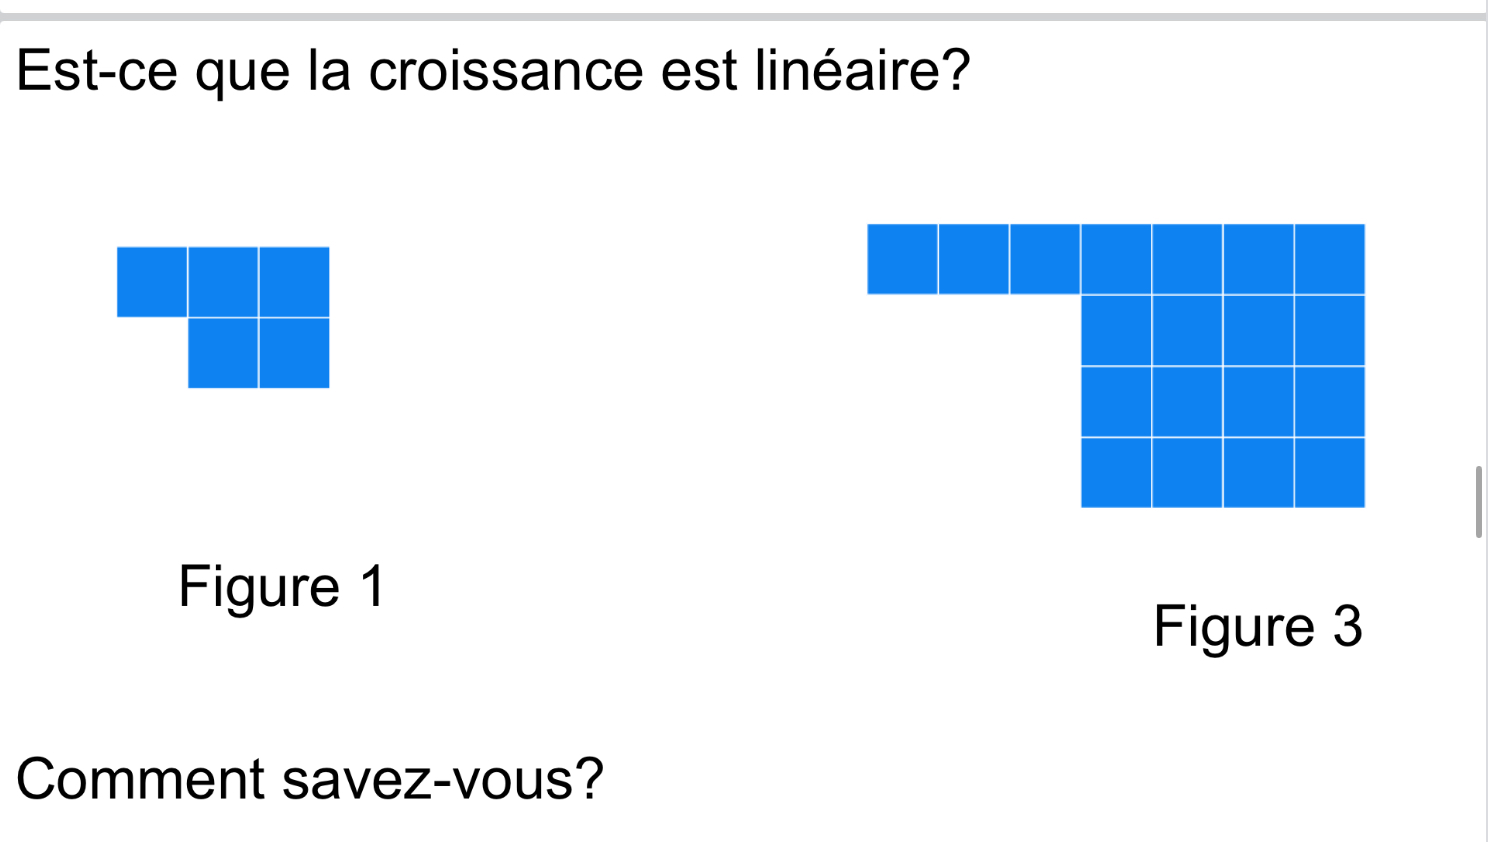

This would continue as follows, adding 7 each time…but with a few more figures people decided that the vibes were off, and the visual pattern didn’t look right.

so maybe it’s not linear.
we explored the growth in a few ways. We can see it as a big square (the green square) which is always one bigger than the figure number…or (x+1)^2. Plus we need one group of the figure number. Y=(x+1)^2+x.

We could also see a yellow x^2 and 3 groups of x and 1. Y=x^2+3x+1
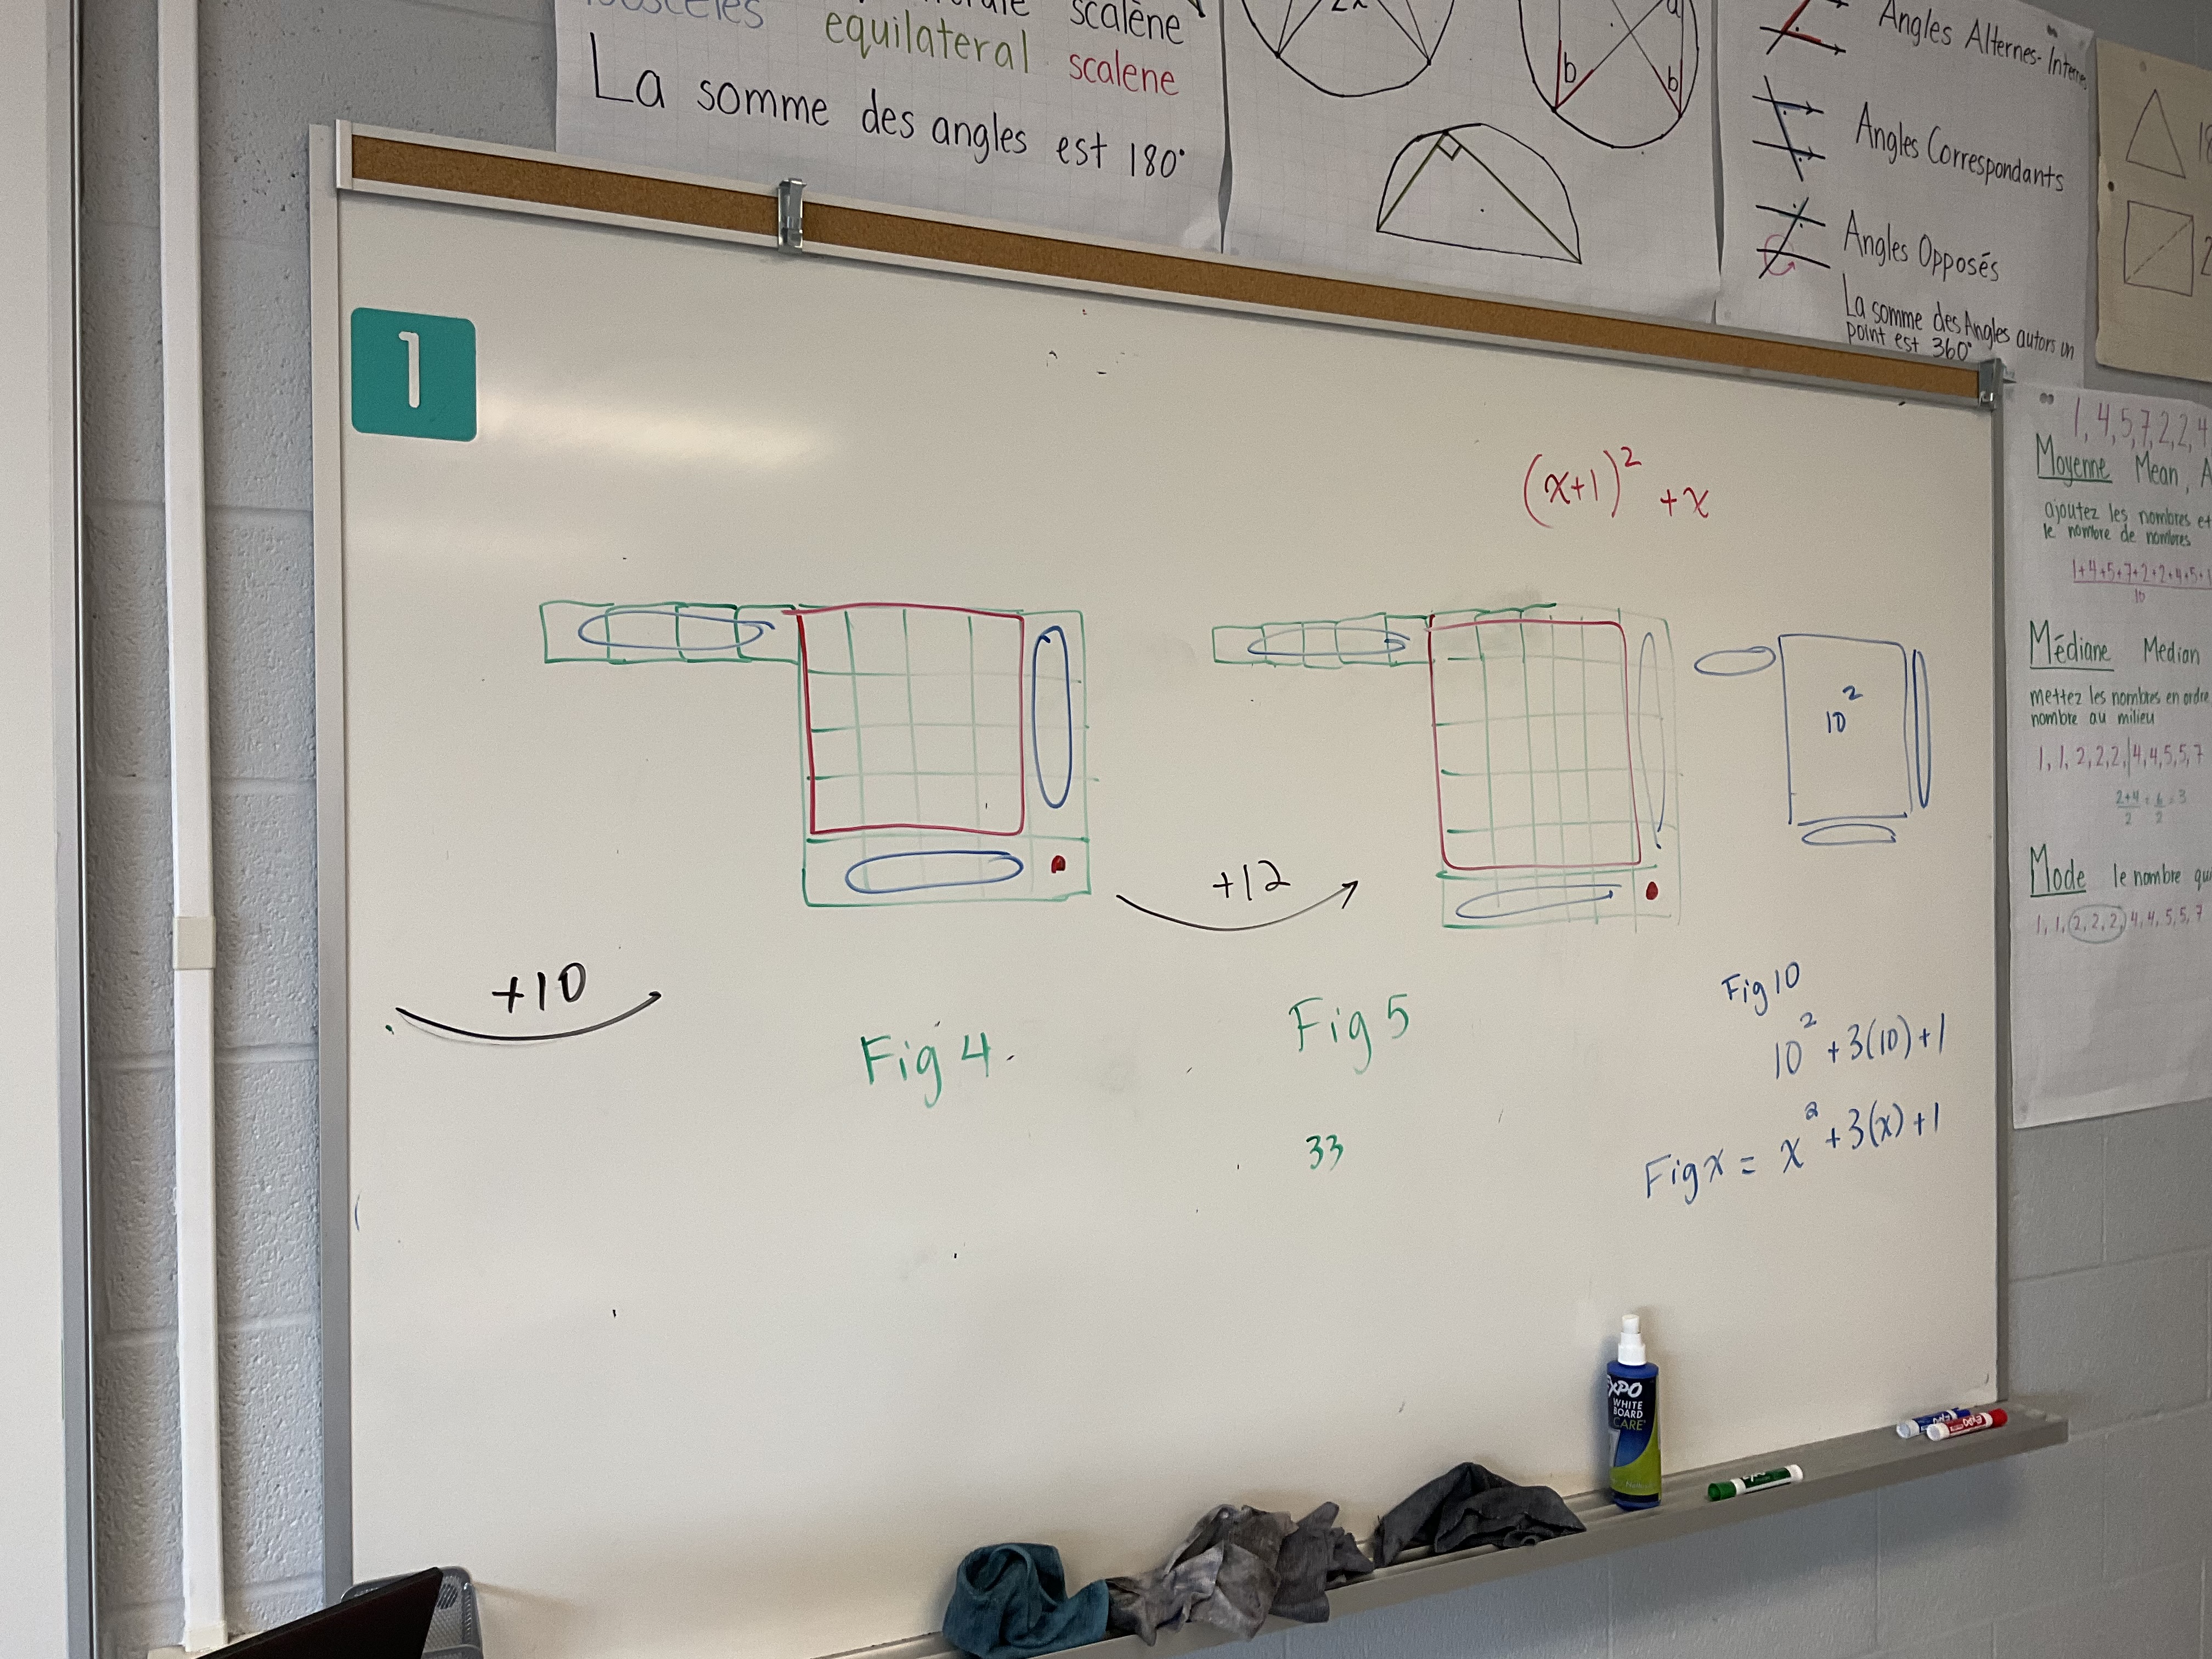
This pattern works much better in the long run! We know it’s not linear because we add a different amount each time.
Knot Tying Task
I was invited to join a grade 10 class today to try out the knot tying task I had done a few weeks ago. This time through it was with an academic class, so we added more algebraic aspects to the investigation.

Each group chose 2 ropes. There were longer thicker ropes and shorter thinner ropes and shortest thinnest ropes. They measured the ropes to start with, then tied a knot, then measured, then tied a knot then measured until 10 knots were tied.
They made graphs of their data, made lines of best fit for their data and then made the equations for the lines of best fit.
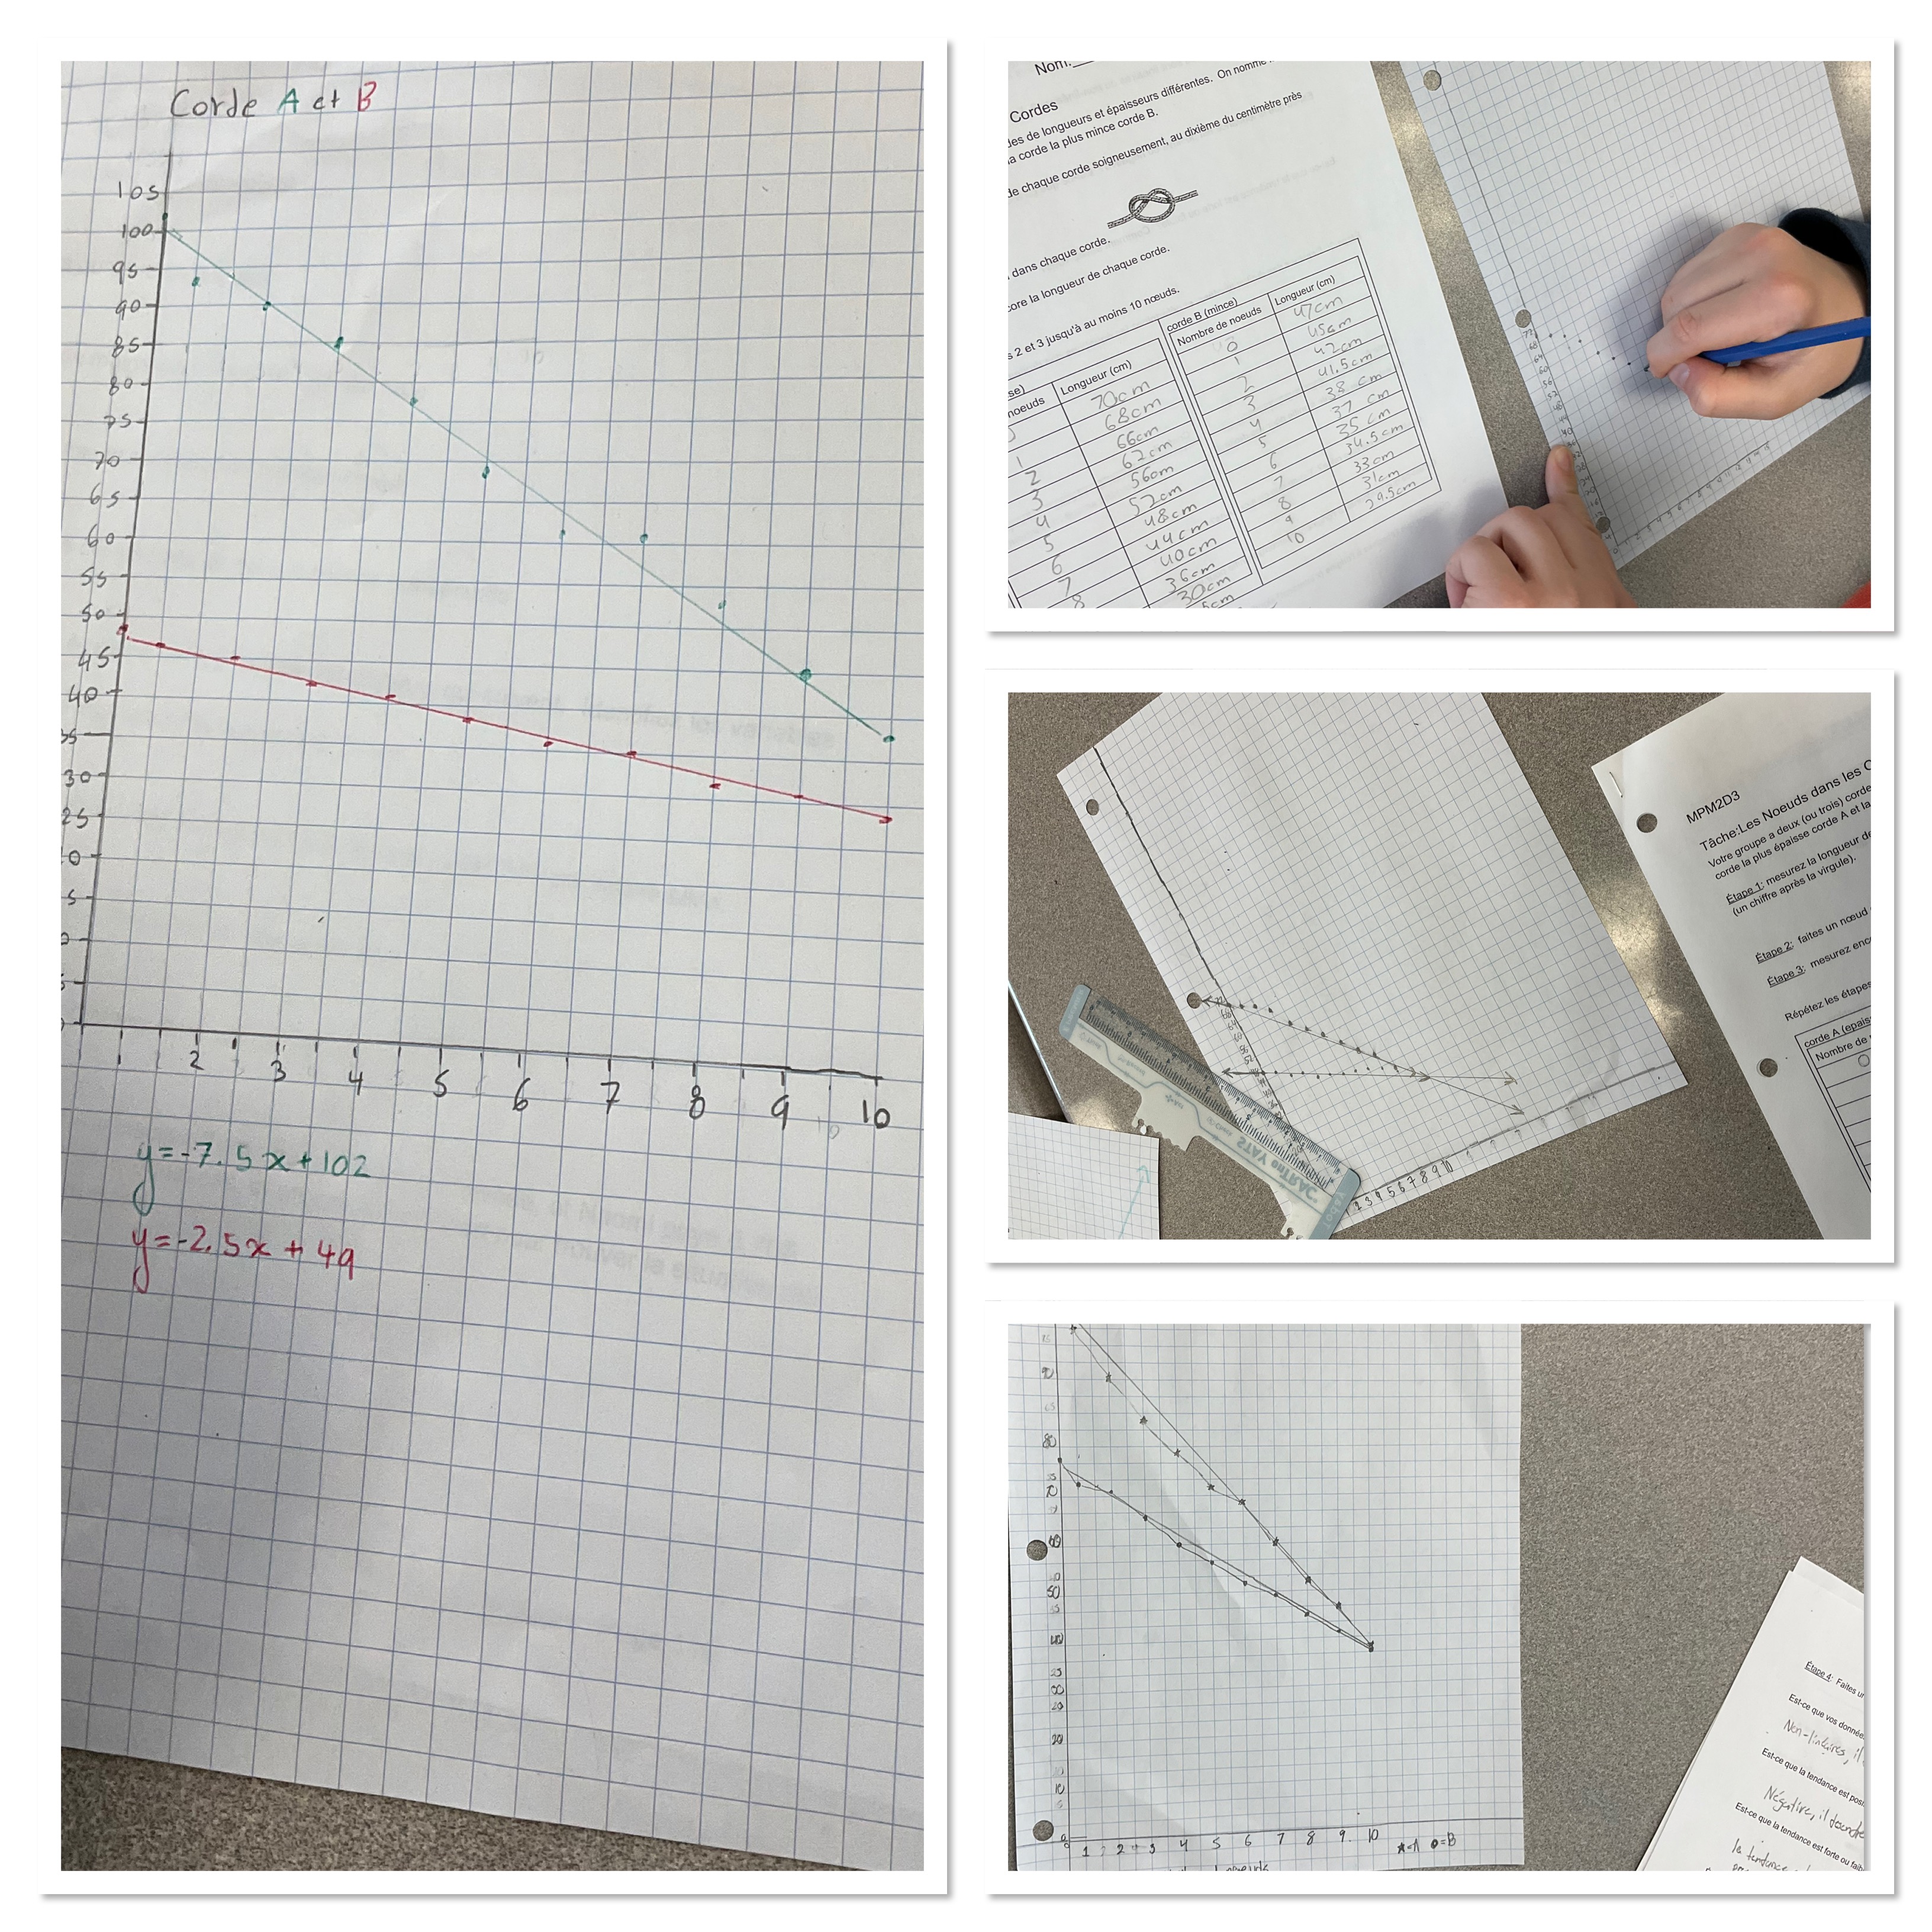
They needed to determine if there was a number of knots that would make both ropes the same length. This could be solved graphically, but we wanted them to practice their new skill of substitution, so they substituted to solve for the intersection point.
We consolidated in the middle about how to draw a line of best fit, then again a bit later we consolidated how to find the slope and y intercept of this line.
At the end the consolidation mostly focused on what the solution to the system meant, and why it made sense to do substitution. We know that the x represents the number of knots and the y represents the rope length. If we want to know when the ropes are the same length we set the y values equal. That means that the mx+b parts of the equations are also equal. We can solve for the x that makes this true (which represents the number of knots associated with the intersection point). Then we figure out the length of rope associated with that many knots by substituting back into the rope length equation.
It was neat to see lightbulbs go off when students recognized that each knot was shrinking the ropes by approximately the same amount each time, and that the rate of change of the rope length per knot was the slope, and the initial rope length was the y intercept. Having a context to connect the ideas to was really helpful for many students. I look forward to trying this task with another group.
Intro to Patterning
We started looking at patterning today and how to determine pattern rules and make graphs and tables of values from visual patterns.
we can extend a pattern in both directions to find figure 4 and also figure 0
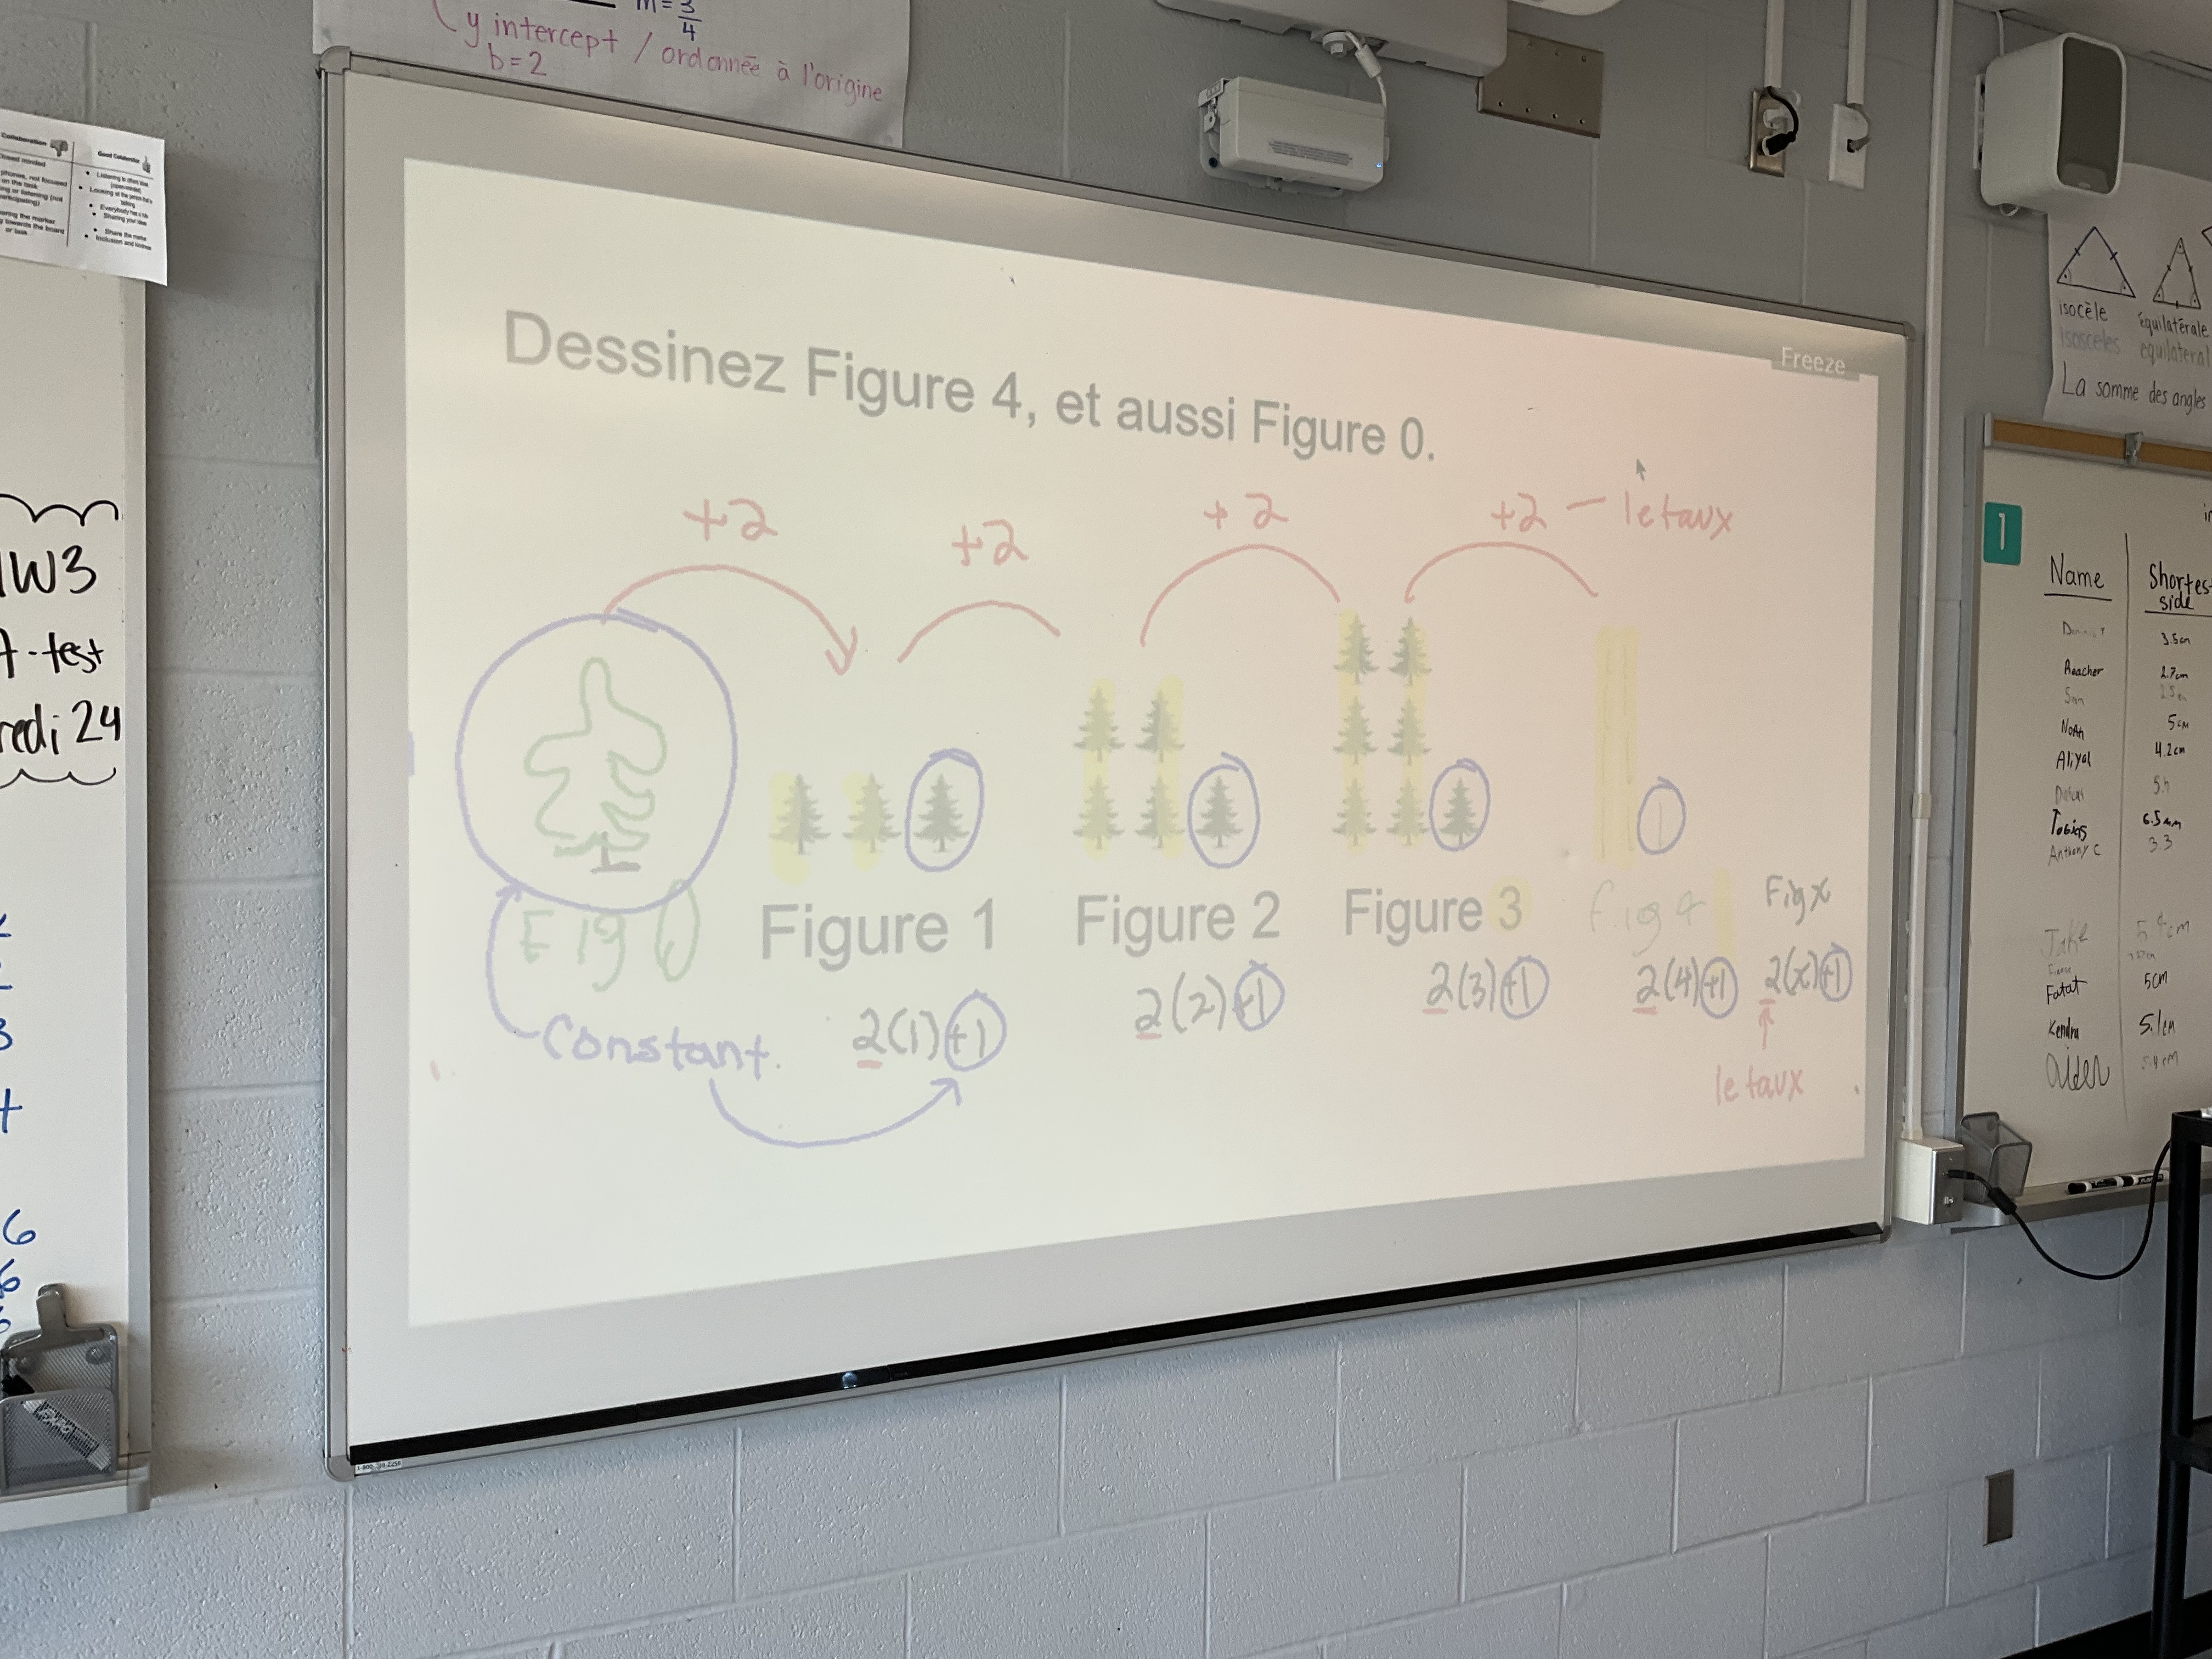
We noticed that the pattern increase is +2 each time. That can also be seen as 2 groups of the figure number in this pattern (the vertical columns of trees). We noticed that figure 0 is 1 tree. That’s the solitary tree that is alone on the left of each (circled in blue).
We thought about how to figure out how many trees are in figure 10. We know that we’d add 2 10 times, or that we’d have 2 columns of 10 trees, and then we’d have the 1 extra tree on the side. We could do that for figure 100 as well…
figure 100=2(100)+1
we can go from here to make the equation for figure x (this would be a neat time to introduce function notation…I didn’t think of it at the time though)
figure x=2(x)+1
we just replace the 100 with x and get the equation!

We put the data in a table and noticed the rate/slope and the constant (figure 0) in the table. We then put the points on the graph and noticed the slope (rise and run) and the constant (y intercept) on the graph.
We next had a challenge to build a pattern around the “figure 2” that was given
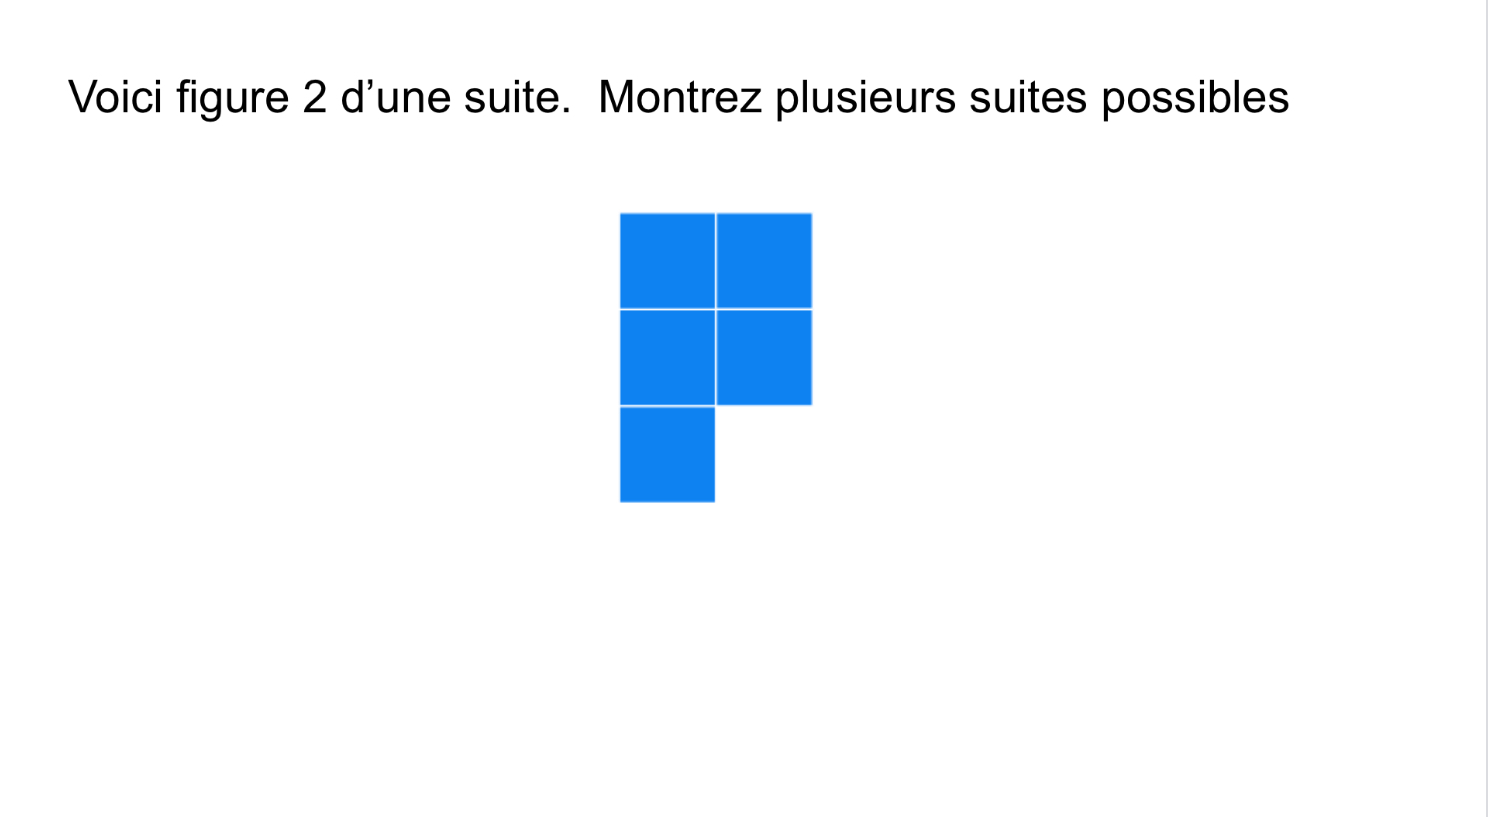
Here are some of the patterns and the analysis we did. We made the pattern rules for our classmates work. This one is y=3x-1
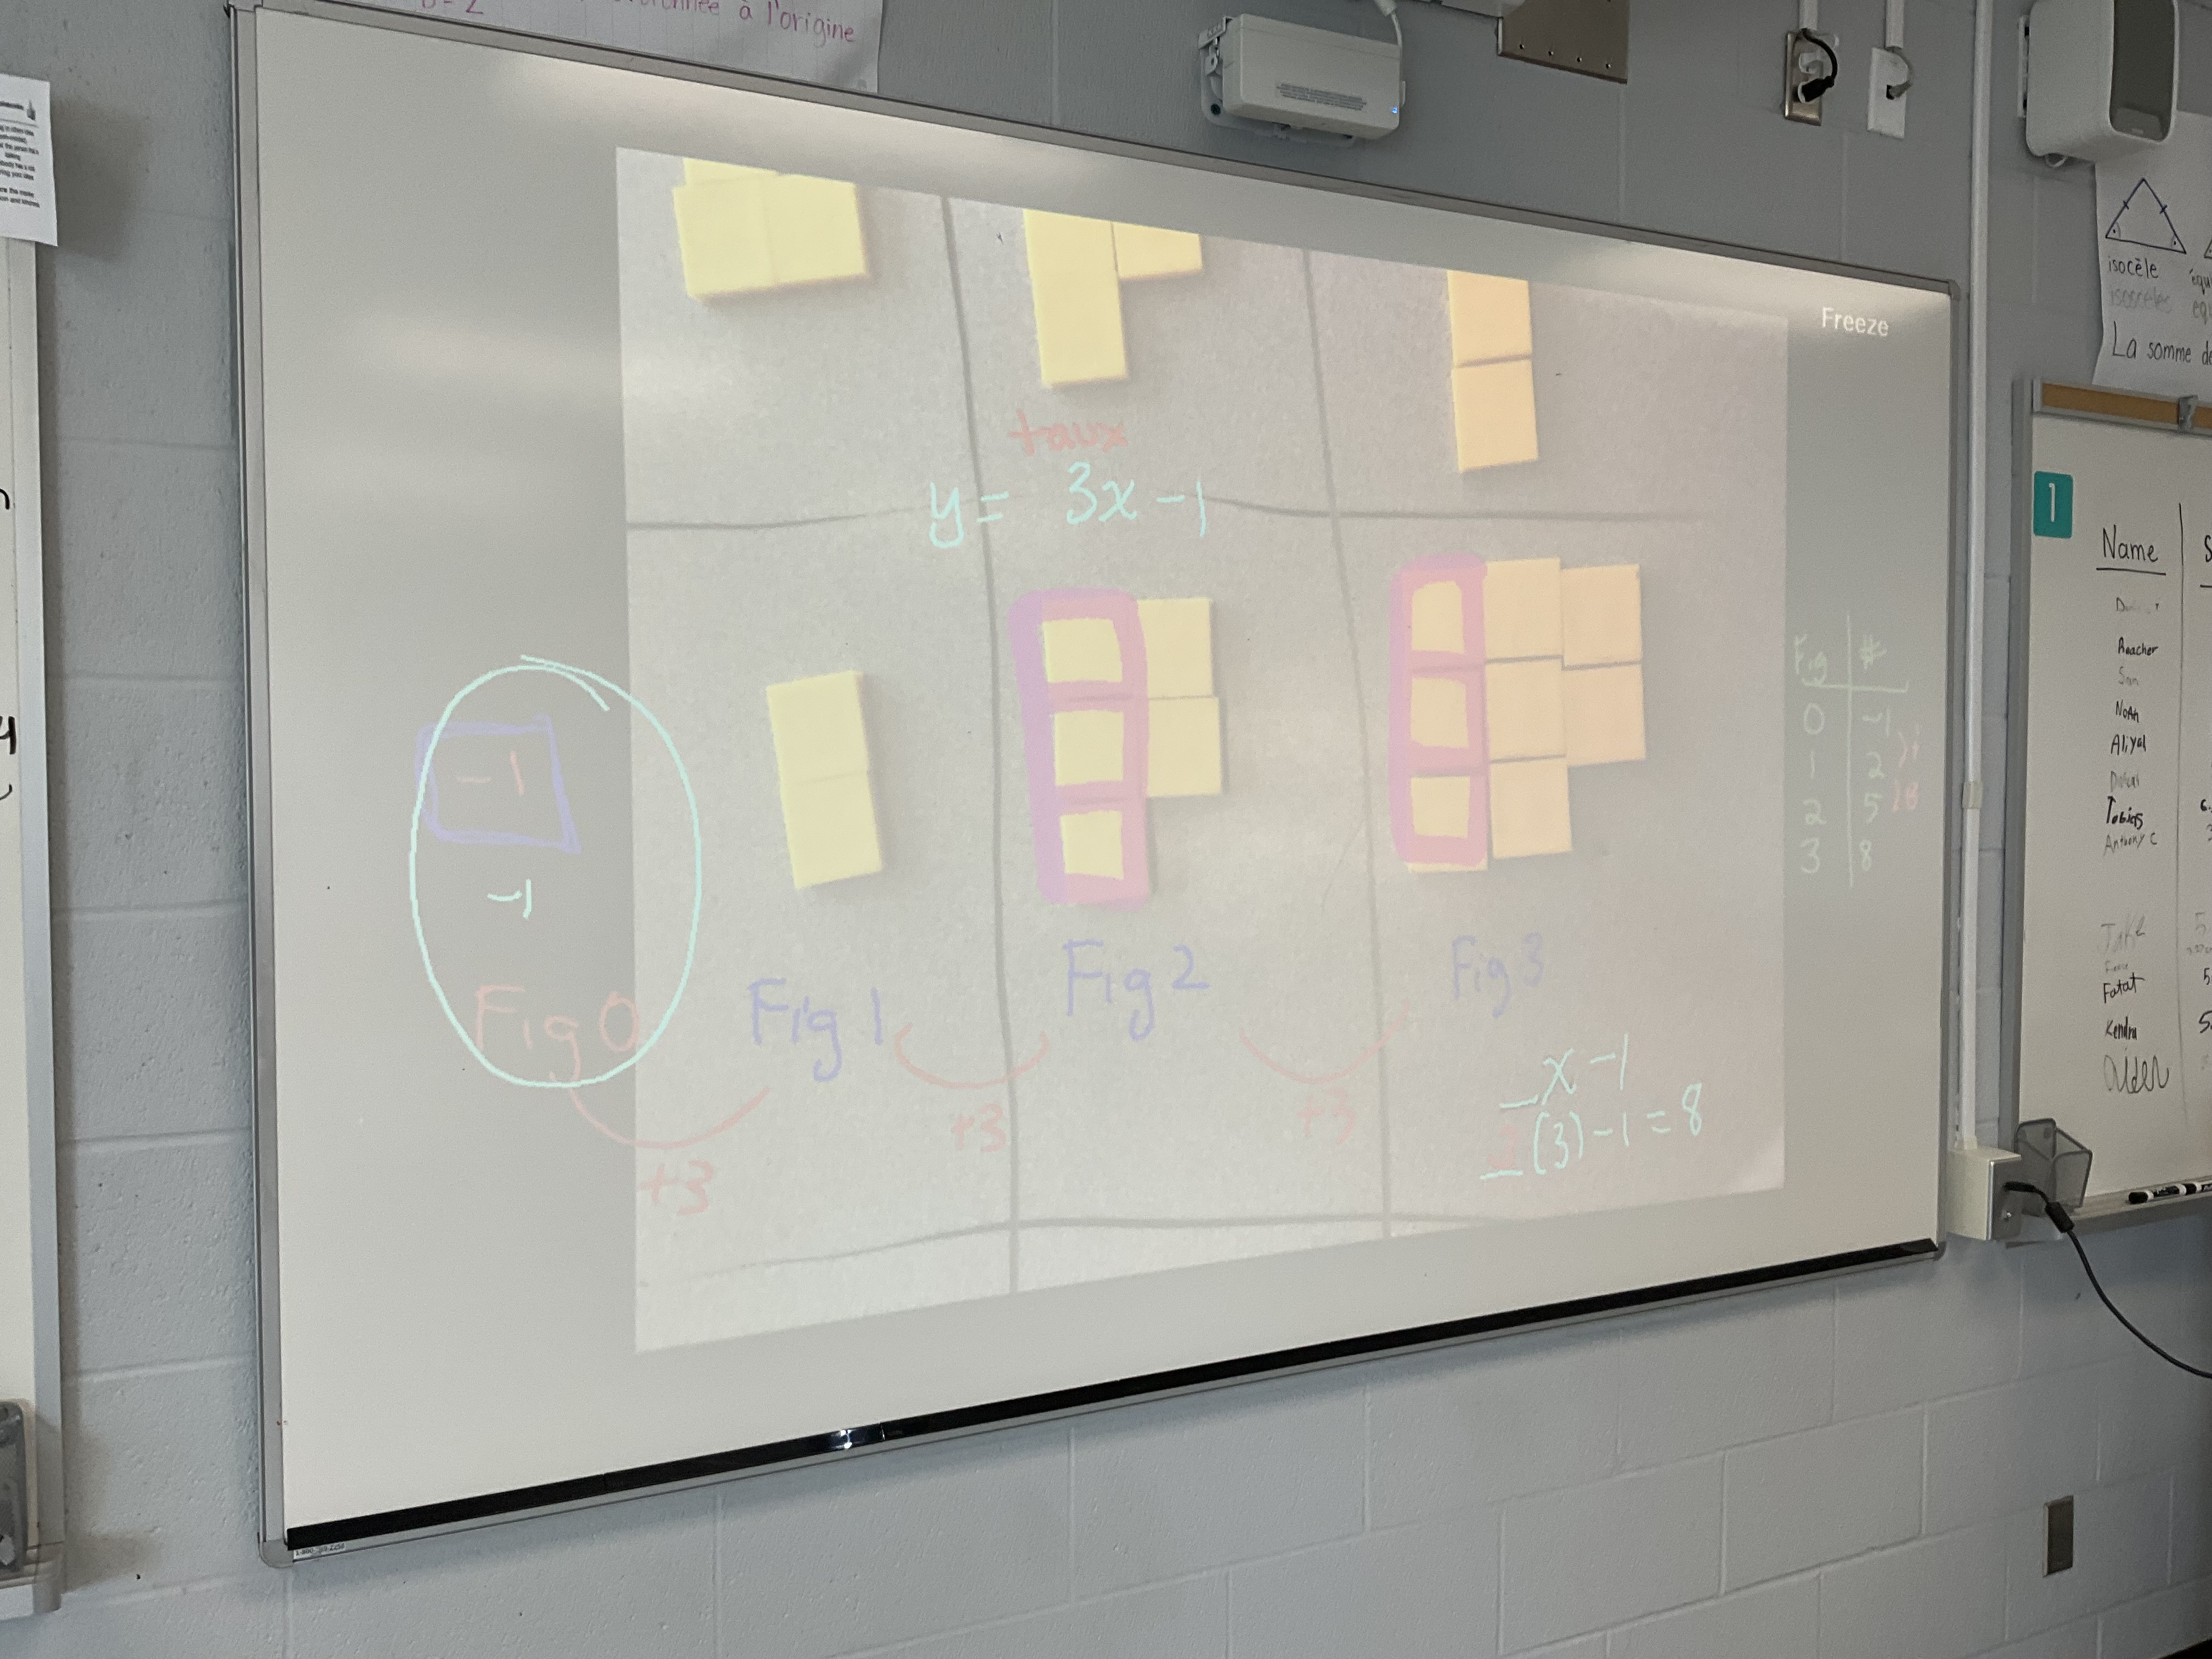
This one had an oopsie in figure -1, which we corrected, but for this one we see that the rule is y=2(x)+1

It was great to see the creativity that the class had in creating different patterns.
We had some time to try to analyse patterns on our own, and we made good progress with our new skills. We’ll keep practicing tomorrow and maybe see some non-linear patterns too.
Similar Triangles
Today in MFM2P we started learning about triangles. We reviewed how to use protractors and rulers, and the students were tasked with creating a right angle triangle that had a 30 degree angle in it.
we needed quite a refresher about how to use a protractor to design our triangle, and how to measure angles.
The next challenge was to use a ruler and carefully measure the length of each side to the nearest tenth of a centimeter.

We talked about triangle vocabulary. We know that angles can be acute obtuse or right, and that these triangles that we made were all scalene. They are also all similar since they have the same angles. Since they have the same angles their sides will be proportionate.
We checked that theory by calculating the ratio of sides. We noticed that the small side divided by the long side was always about 0.5, the middle side divided by the long side was about 0.87 and the small side divided by the middle side was about 0.57. It didn’t matter what size our triangles were, the sides were all scaled up (or down) proportionally.
We’ll keep working on ratios and proportions and use that to solve problems moving forward in triangles and other contexts.
Catching up
Grade 9s have been working hard, and busy with lots of activities outside of class, and during class time. We took today as a day to catch up and complete some of our unfinished tasks.
Some worked hard to get their beading completed. We are almost fully off the looms, which is good because another class will soon be using them.

We also had time to finish up questions and graphs from our bottle task, and from our 5 minute frenzy multiplications earlier this term.

We wrote our 6th email update home, and also did a quiz to see how much algebra we remember.
Tomorrow we continue on with new learning, but sometimes it feels good to work hard and catch up all the loose ends.
Expanding and Common Factoring
Today in my 2P math class we were working on expanding and common factoring using the area model. We did a warm-up where we needed to fill in the blanks to understand how we can multiply with the area model.

We then connected the idea to multiplying with algebra and the area model. We looked at how to fill in the blanks inside the box, or outside the box.
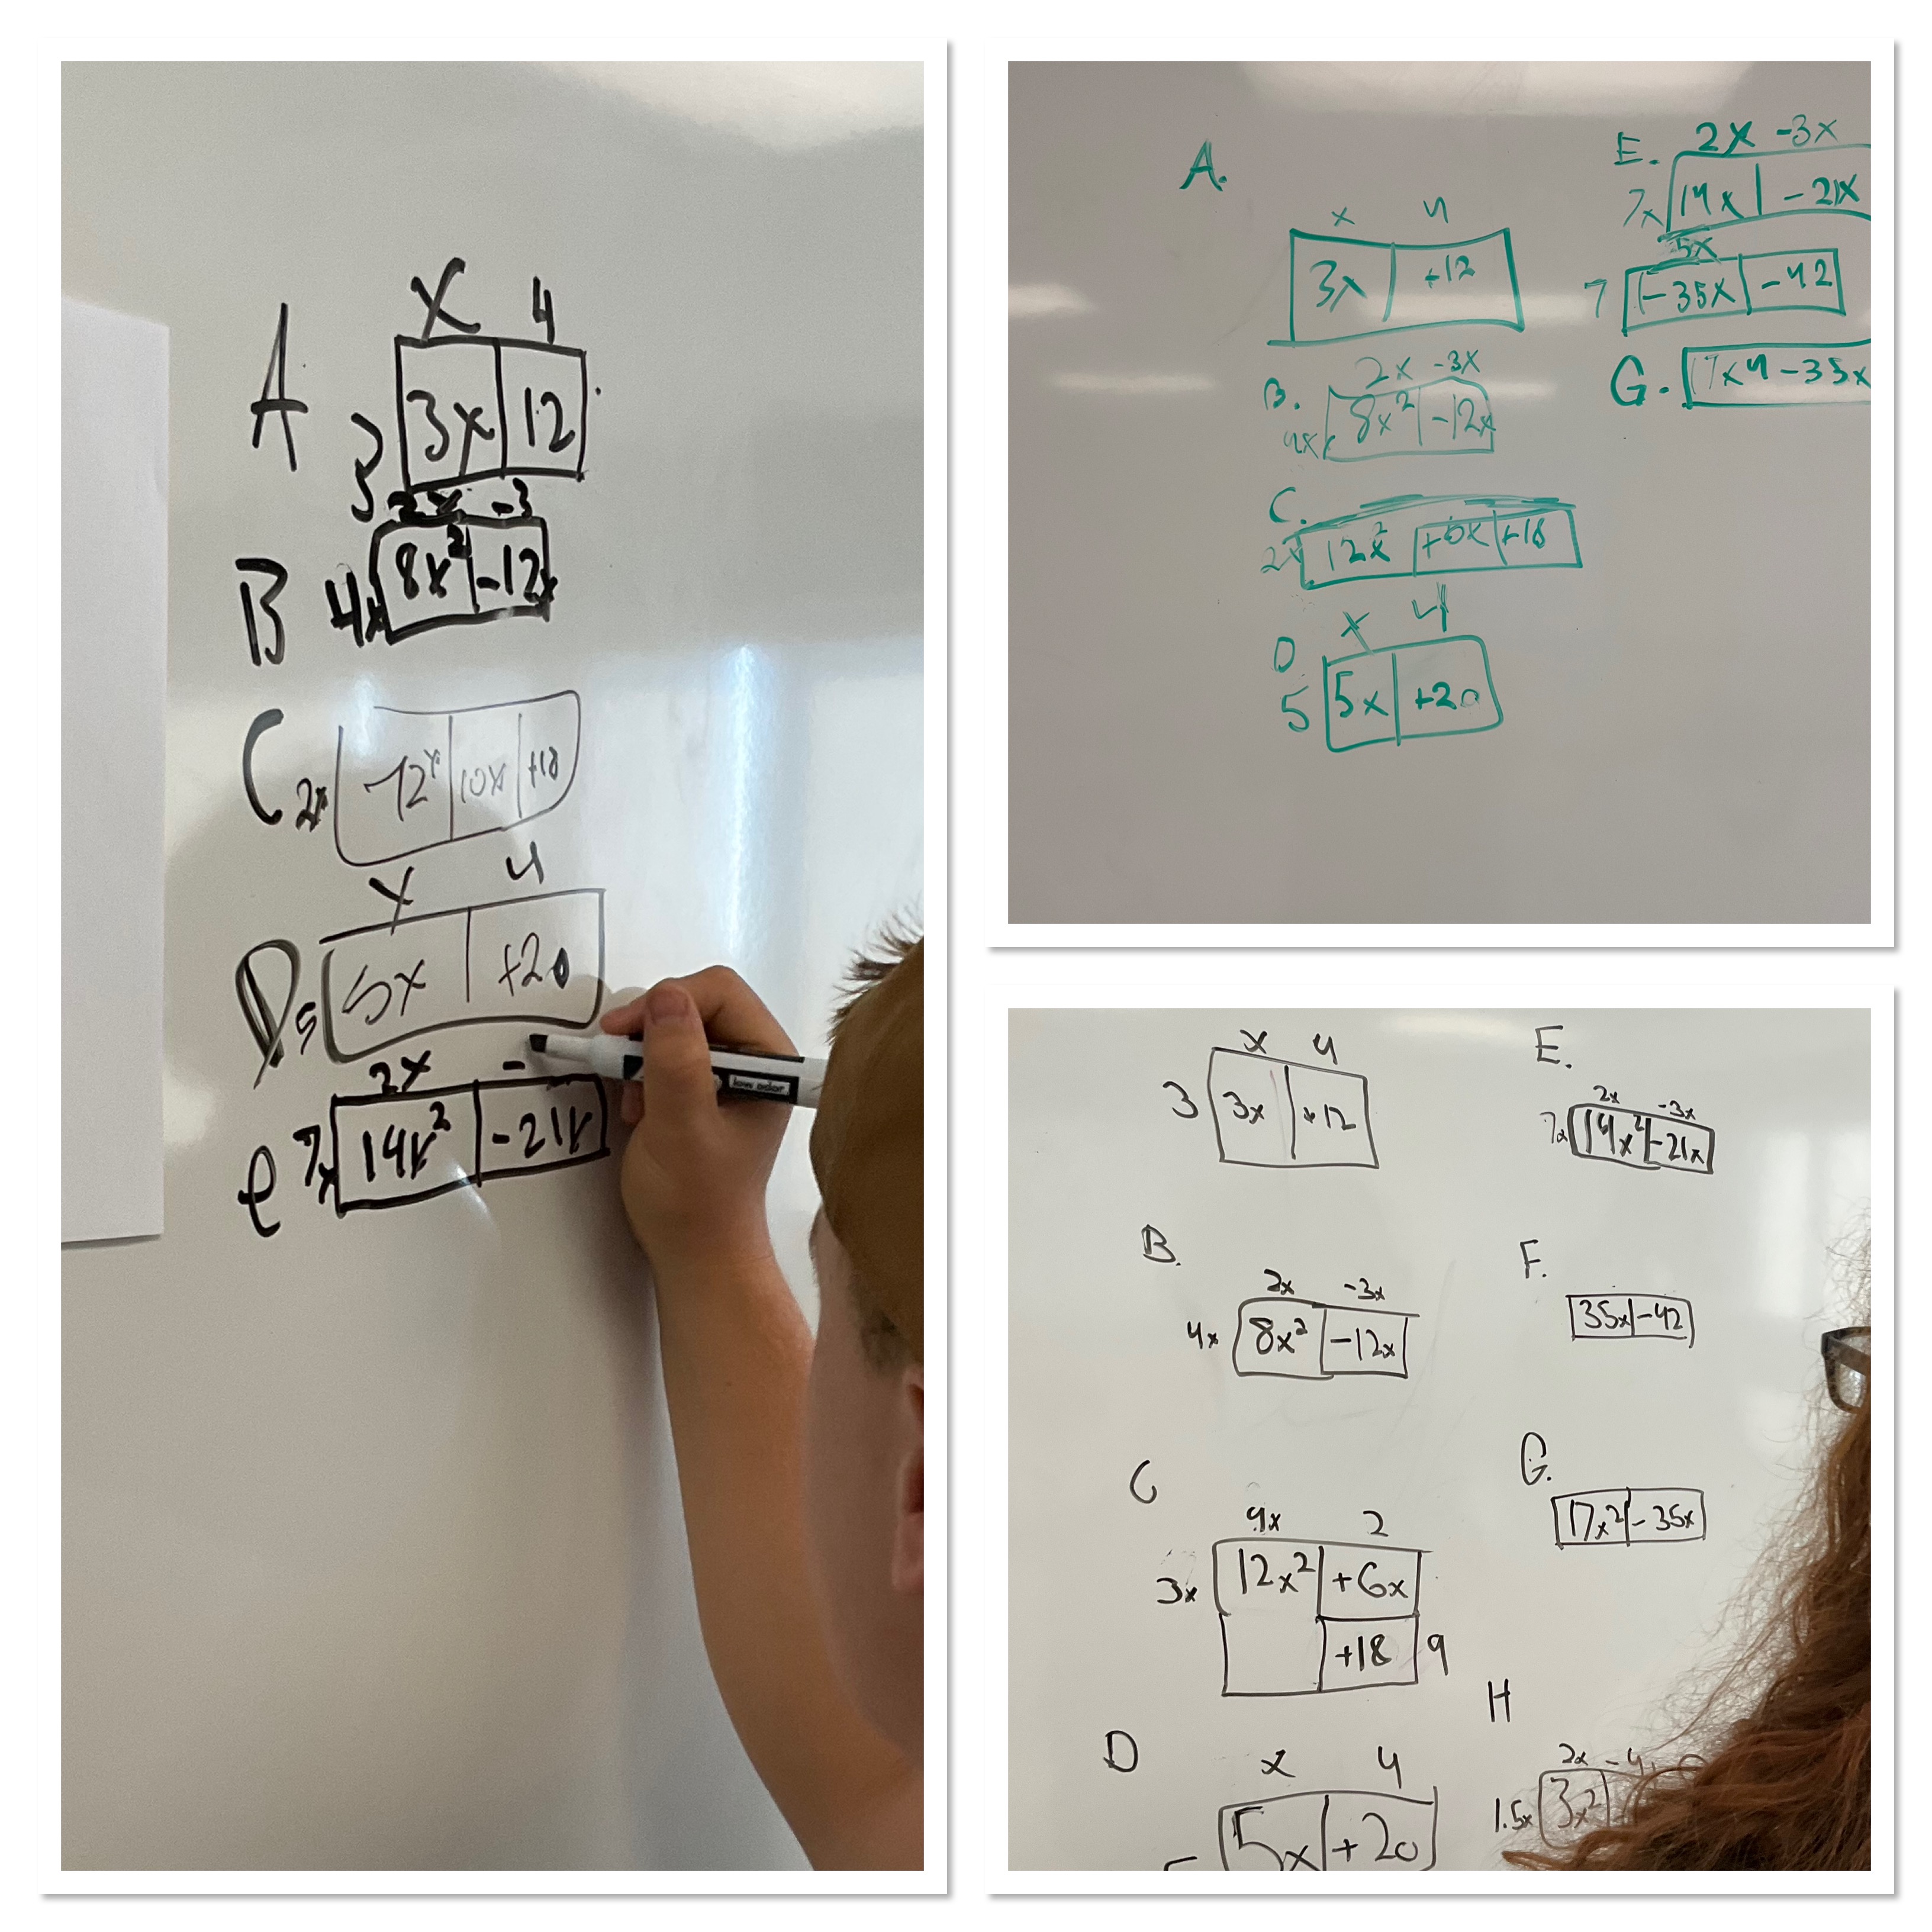
Class was cut short due to a pep rally, but we’ll keep working on this tomorrow as well.
What’s My Rule?
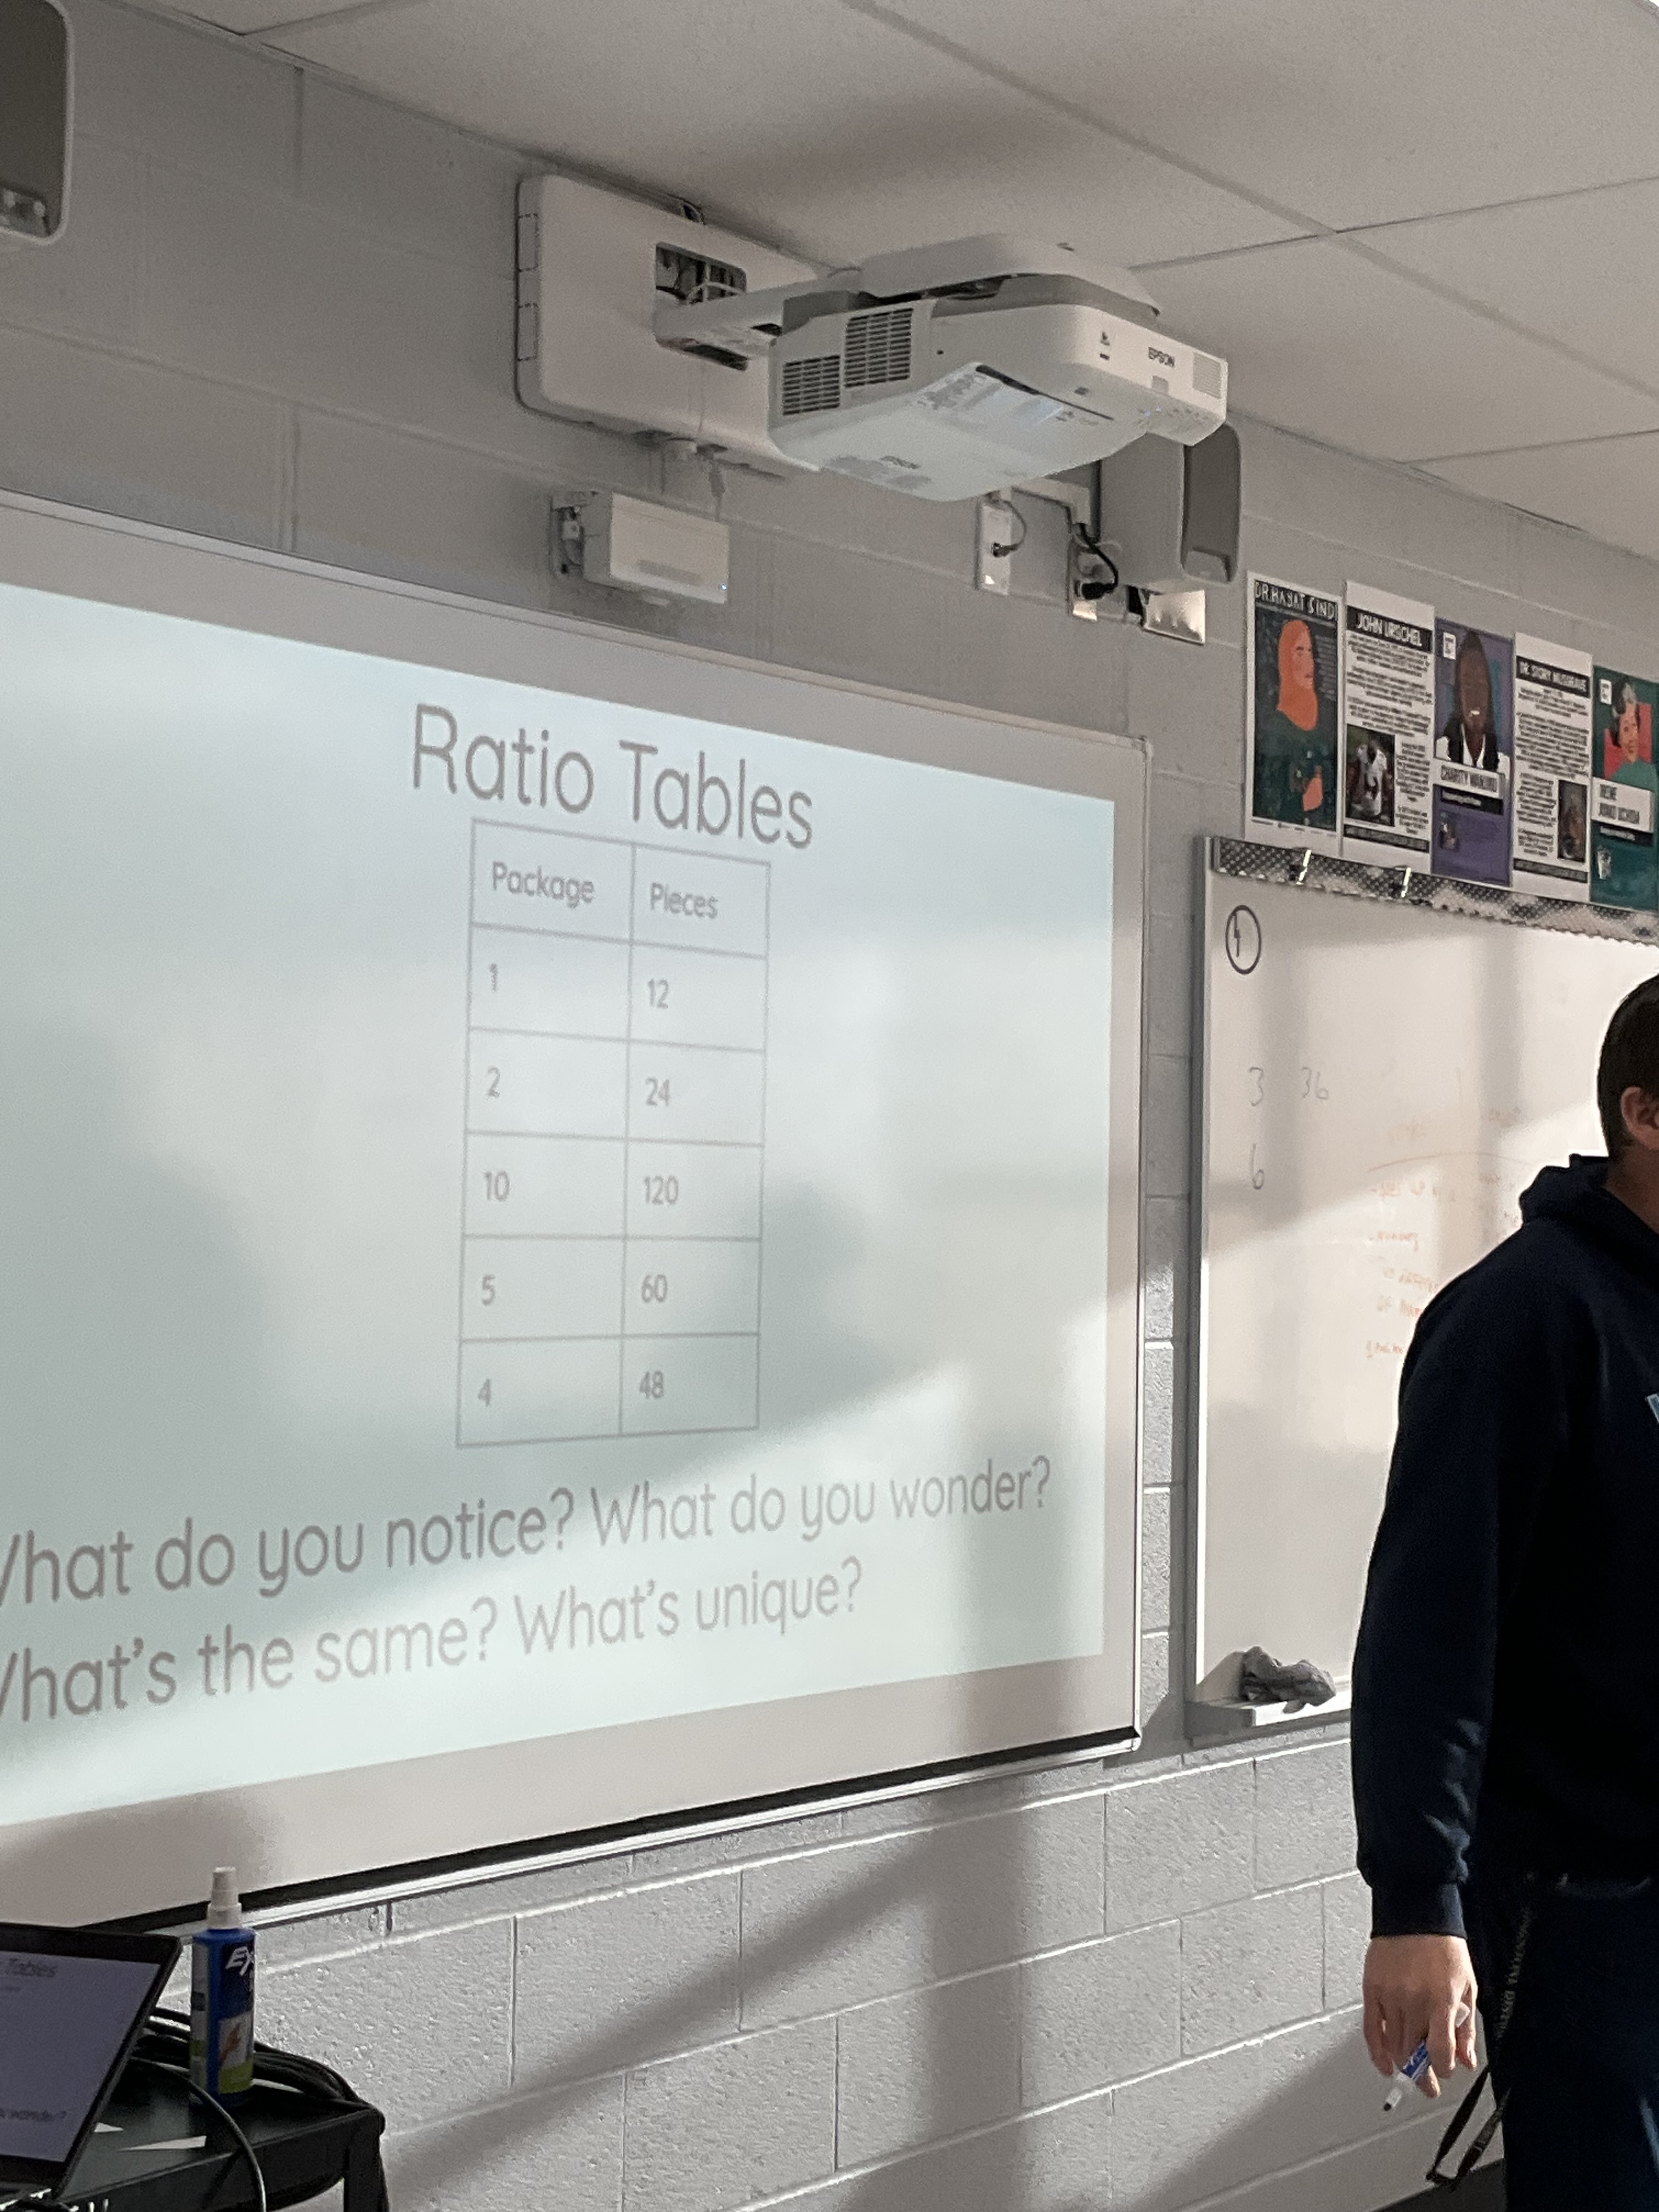
Today I was in a MTH1W class that was working on ratio tables and understanding the pattern rule being shown.
Starting with a fully complete ratio table, the class looked for patterns: some noted that the right side has even numbers, others noted that one package was 12 pieces and 2 packages had 24 pieces, you’d double one to get two, and double 12 to get 24. The “double double” became a refrain for lots of observations. We can double the 2 to get 4, and double the 24 to get 48. We can double the 5 to get 10 and double the 60 to get 120.
The class then tackled a partly filled in ratio table, completing it and looking for patterns.
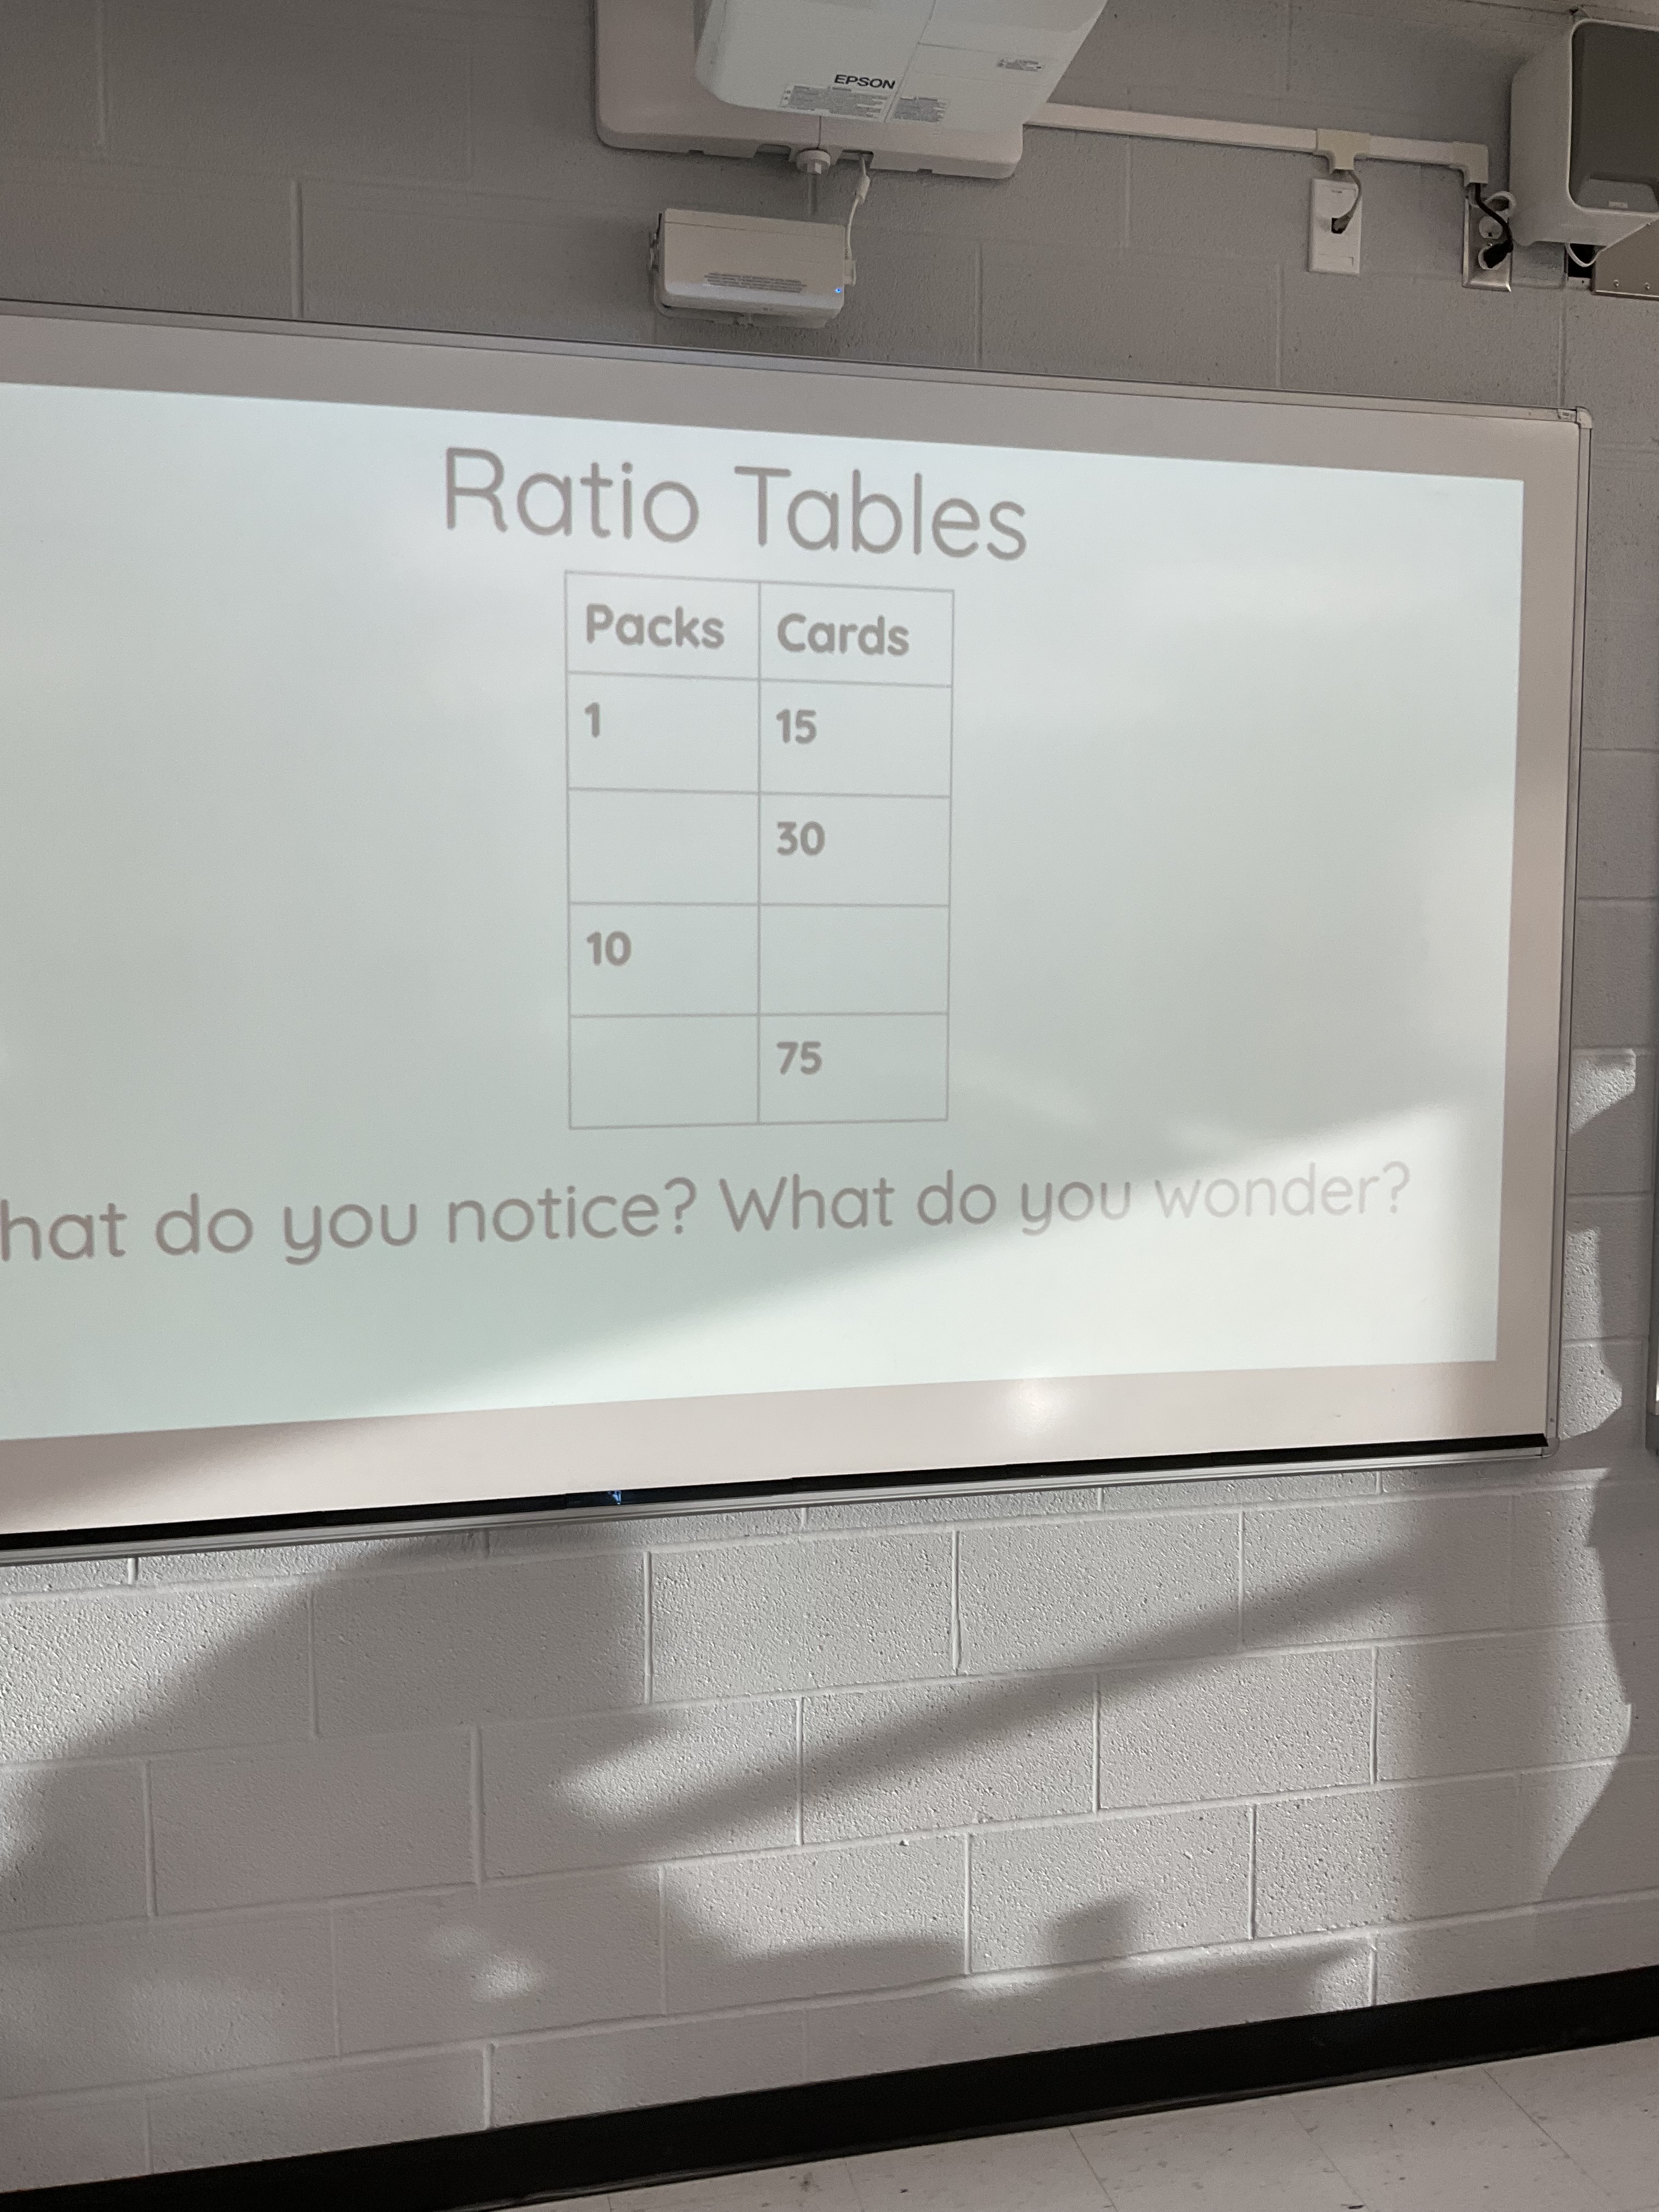
Students filled in the charts and even continued them farther using their patterning skills.

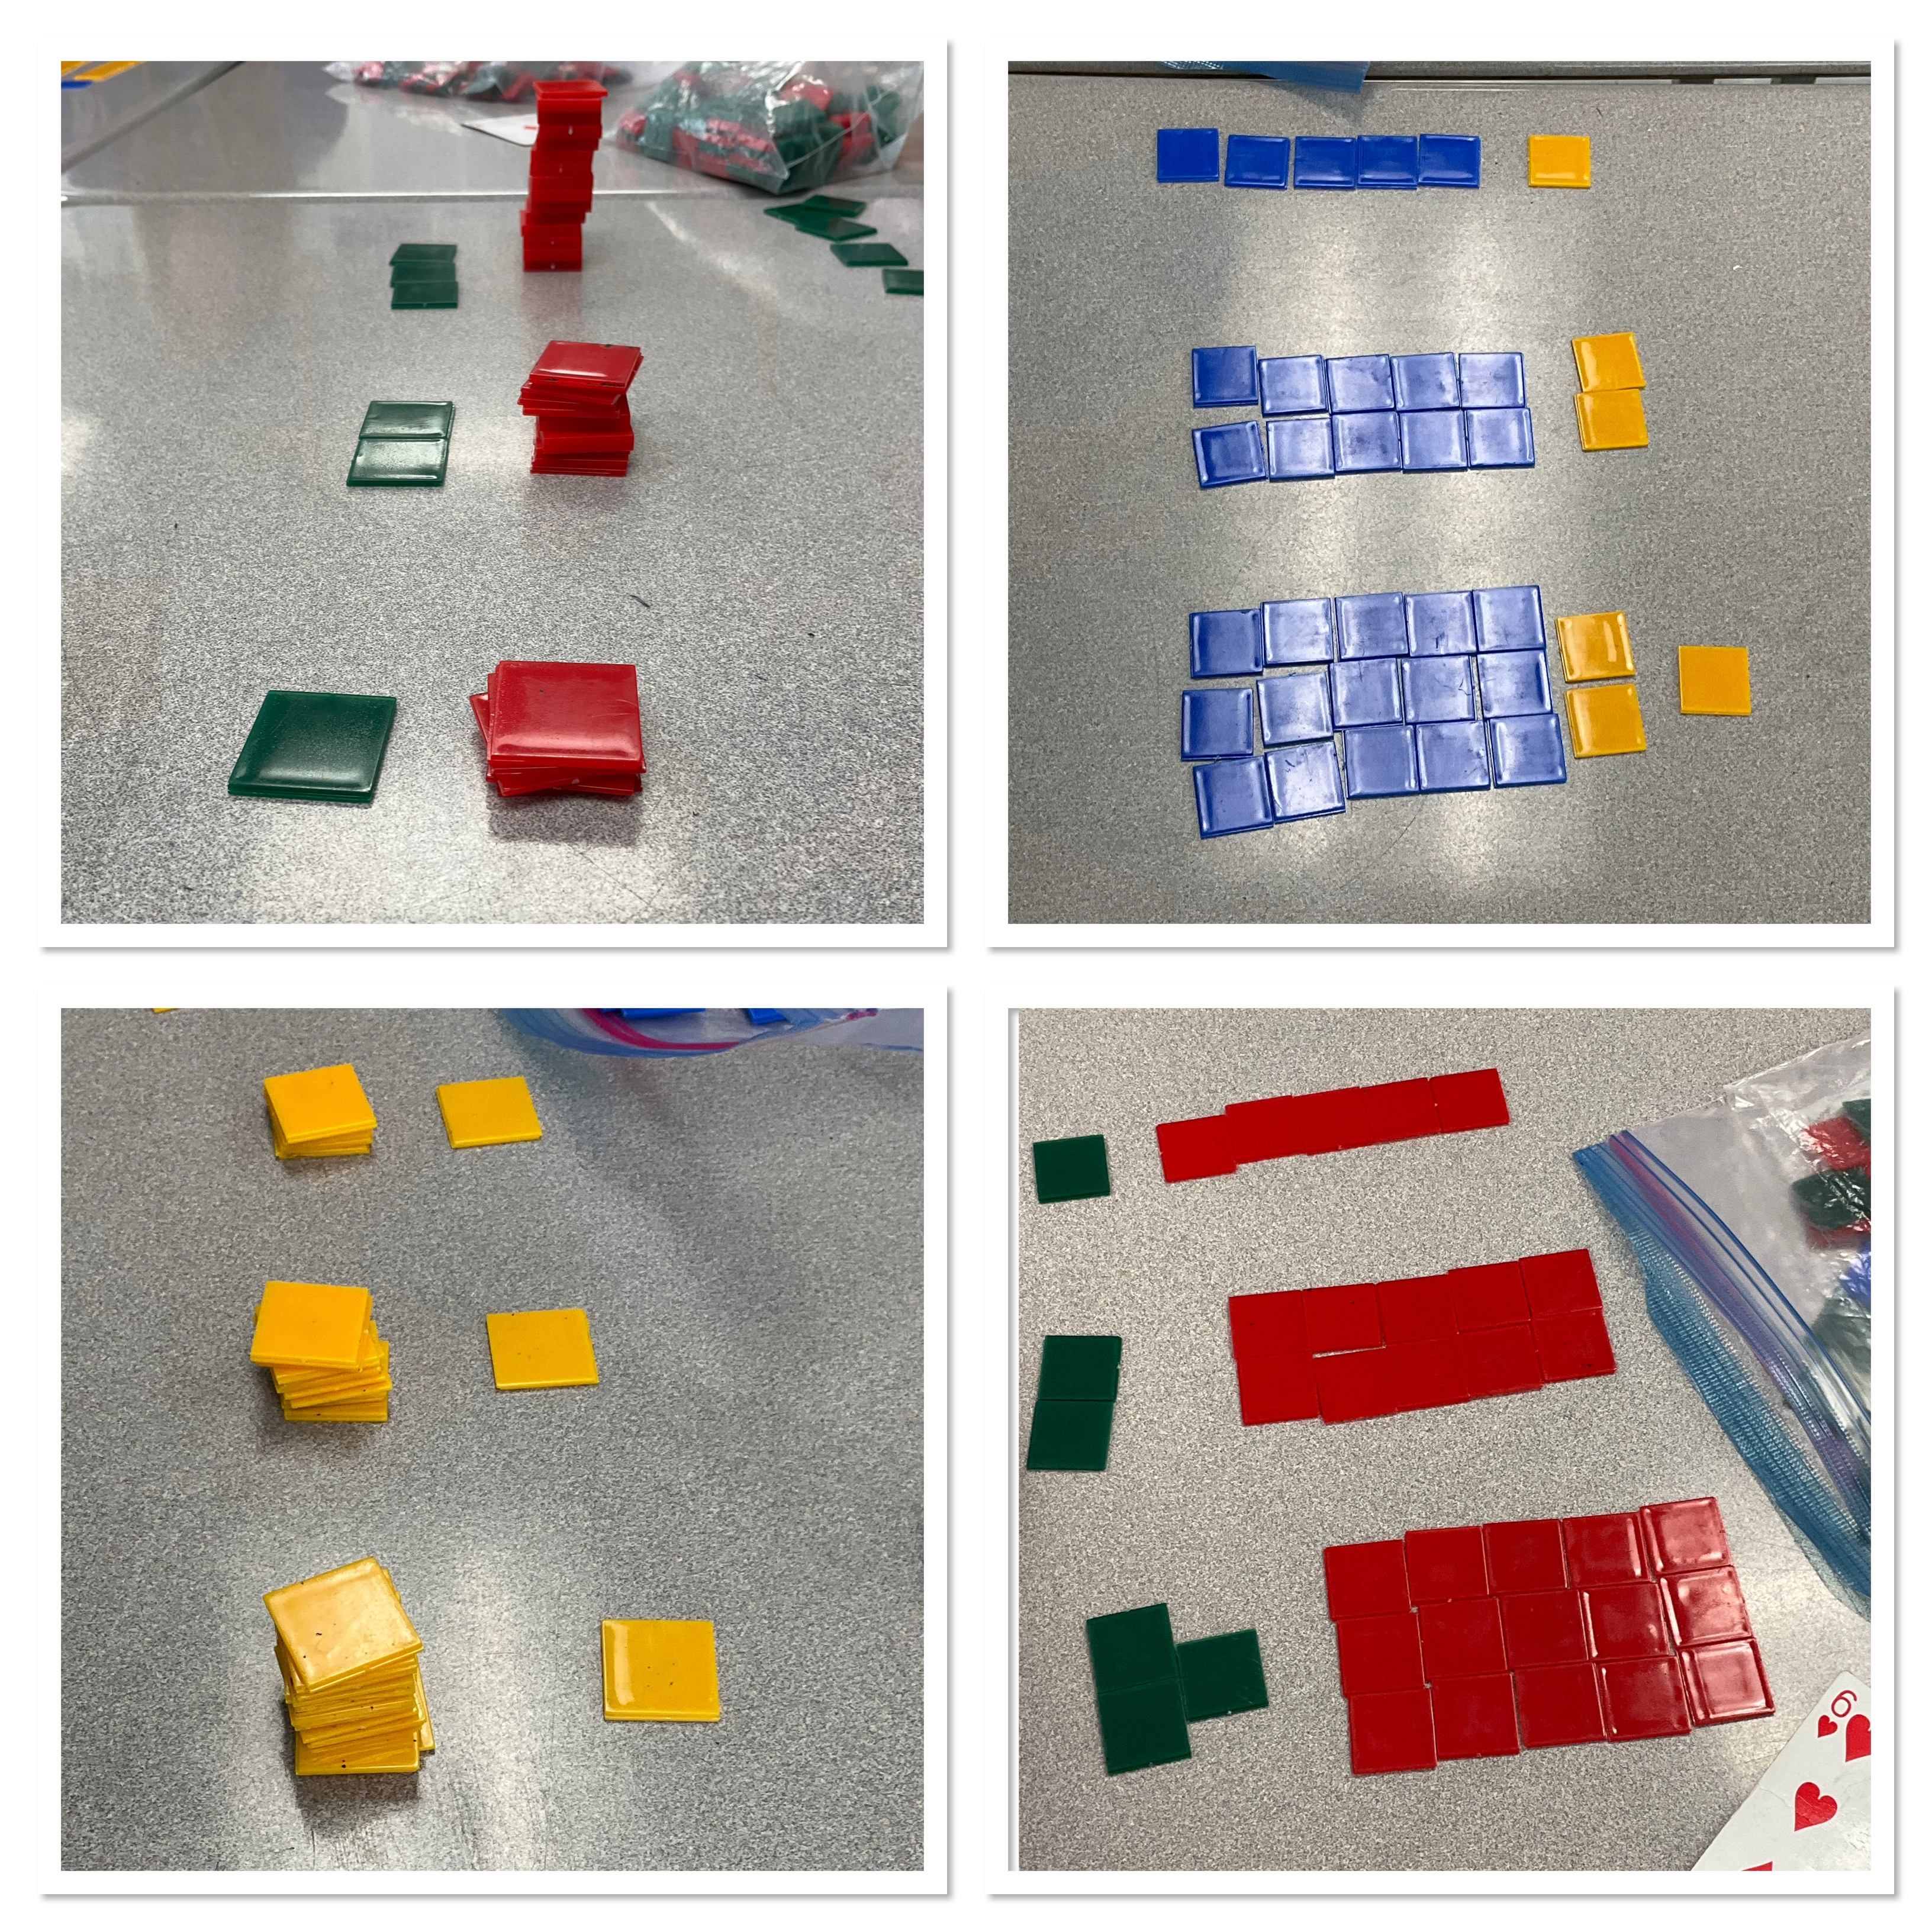
Next students were walked through an input-output table and were guessing the rule. The rule was that the input was tripled to get to the output. I didn’t get any photos of that process. The students then were tasked with building step 1,2,3 of a pattern where the figure number is multiplied by 5.
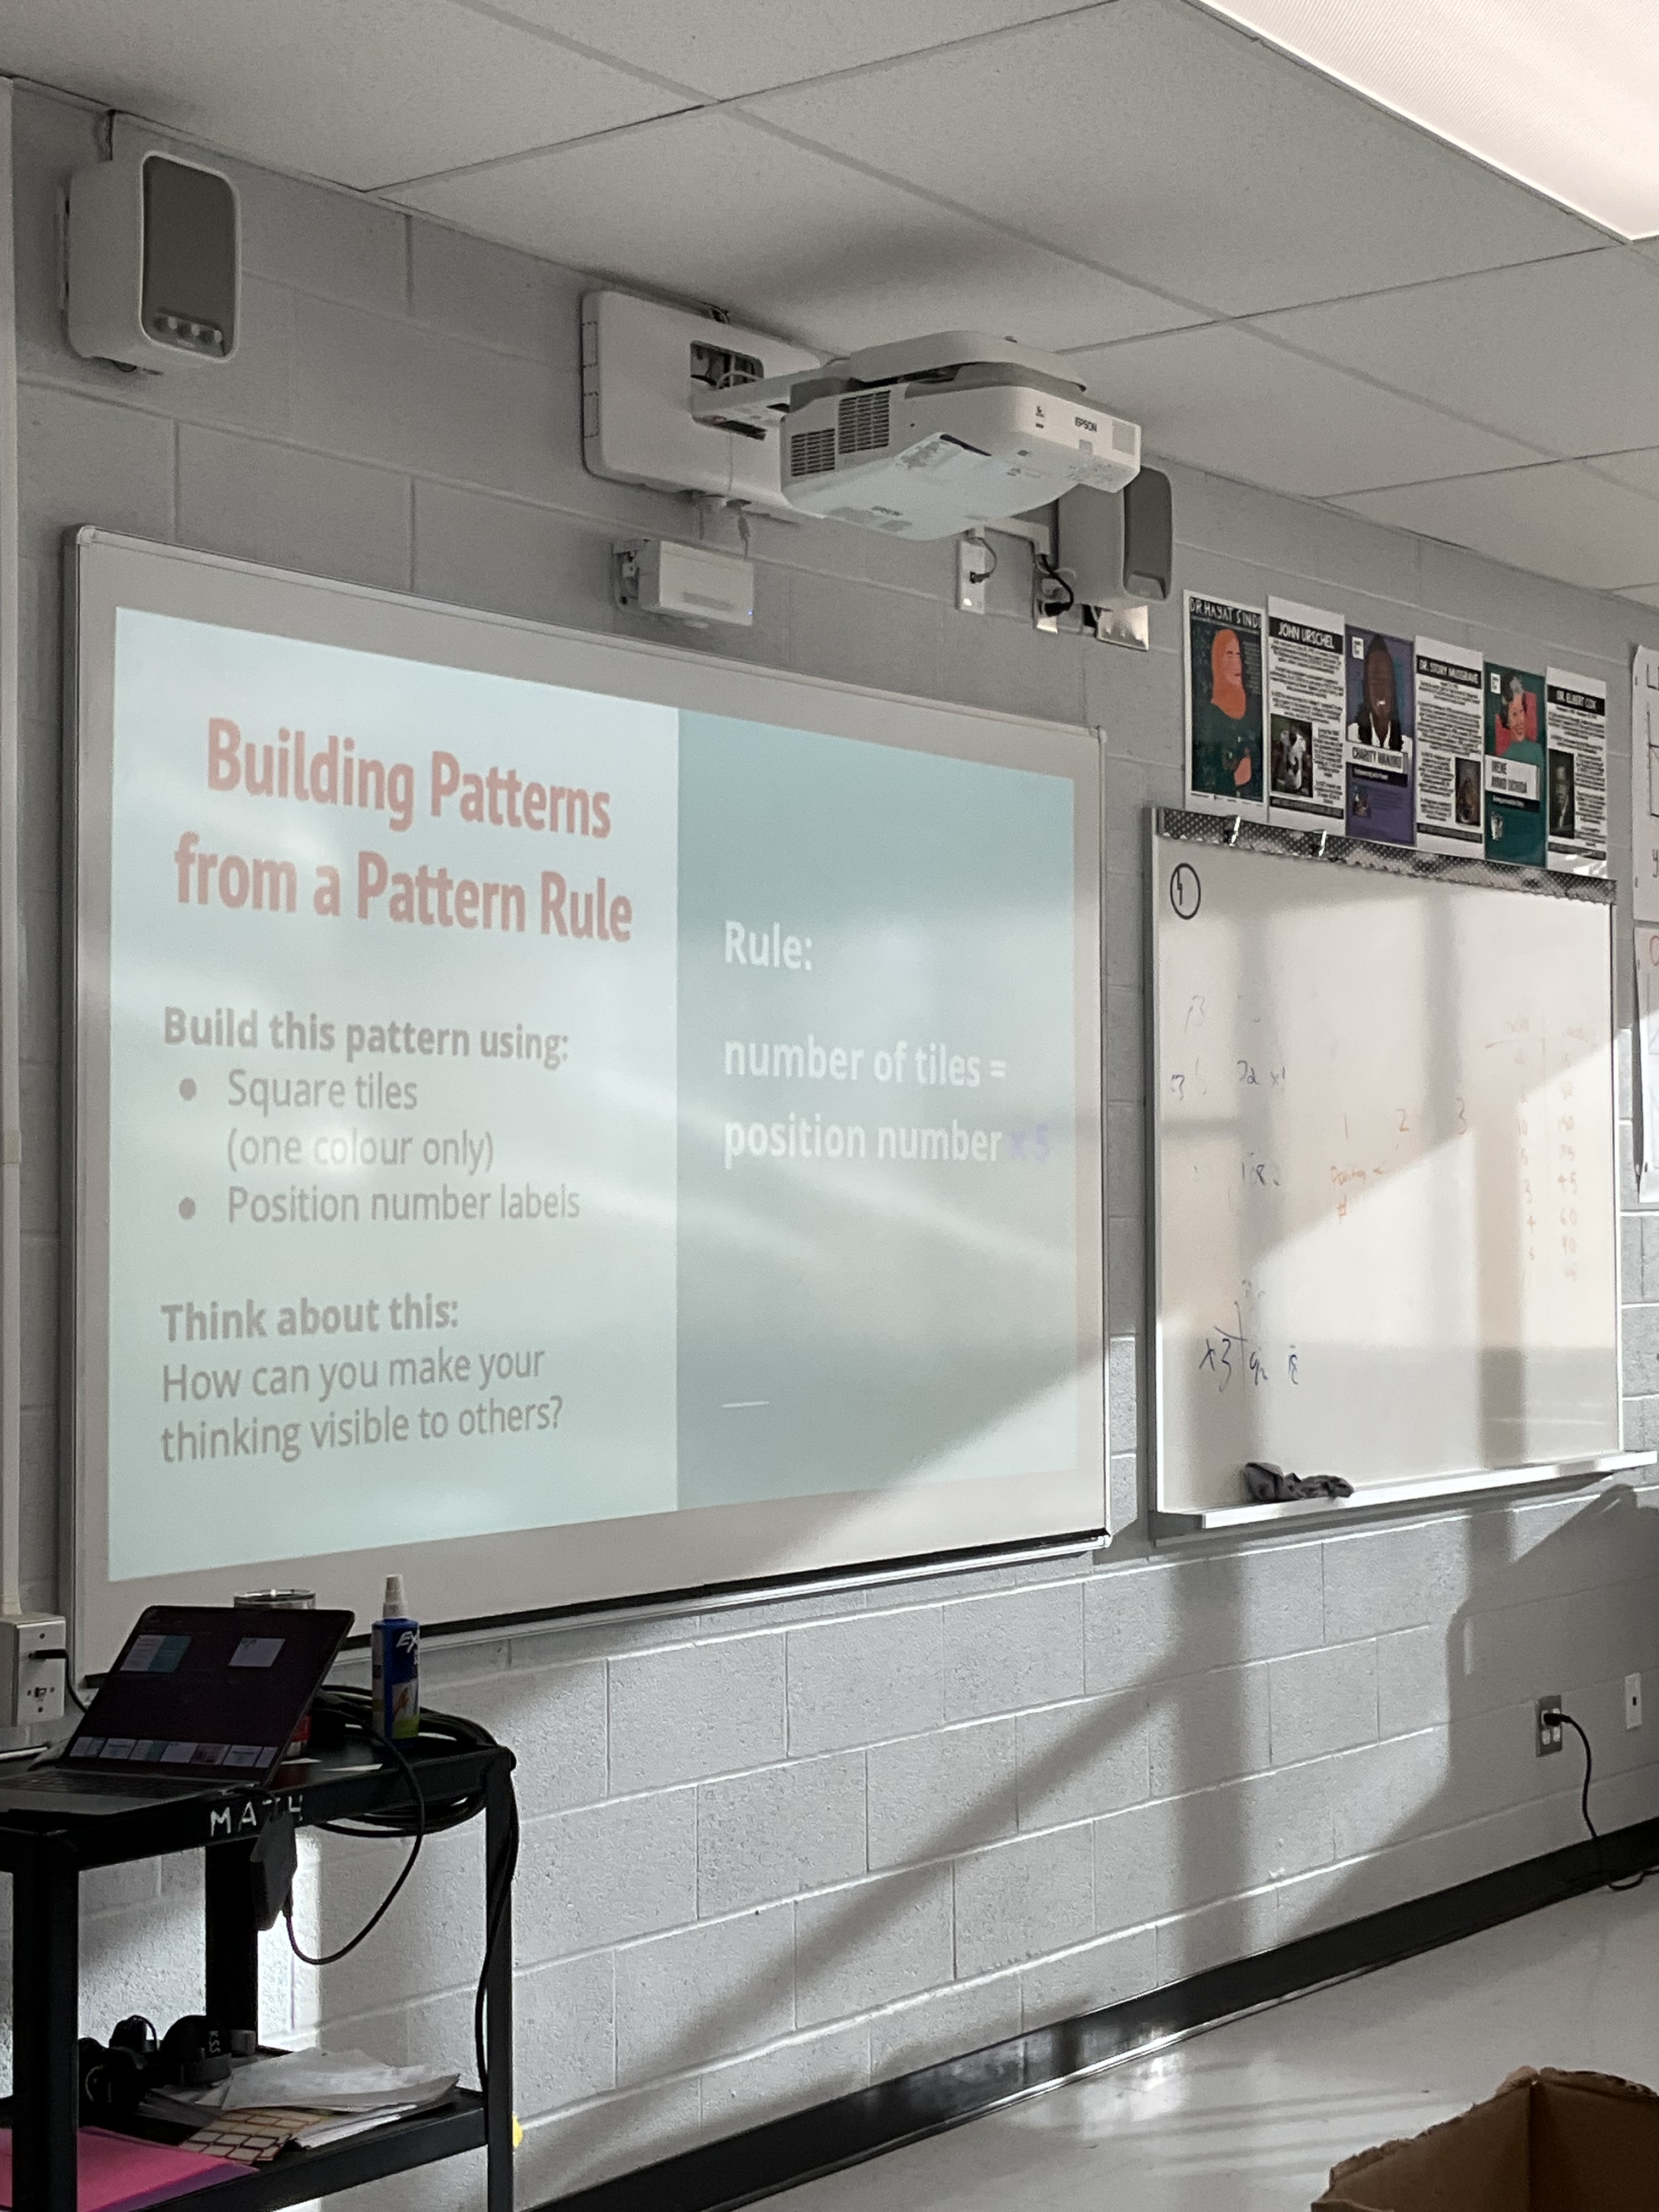
Students used the square tiles ro build each figure number. Some showed the thinking in an array, others made piles.
The next step in the sequence was to do another input-output table, to guess the rule.

Students guessed that we’d be multiplying by 5.5 to get from 4 to 22. There was a conversation about how to do distributive property, and how we’d multiply 4 by 5.5 by multiplying 4 by 5, and then 4 by 0.5 then adding them up.

The next reveal showed us we needed some rethinking.

We needed a bit more…we needed to multiply and add this time. Students were able to figure it out after seeing a few inputs and outputs.

The next challenge was to create their own input output tables to see if others could guess the rules. Some of the rules were pretty creative, using multiple operations, and some even used exponents. One was extra tricky because one of the tables had a calculation mistake! (Ooopsie).

The class went around trying to guess the other groups rules. Some of them were pretty tricky!

It was great to see the participation, first thing in the morning. Students are engaged, and working hard, and sharing their thinking with the class. They are taking challenges and running with them, often pushing the learning into new and unexpected areas.
Fraction Fluency
Today in Grade 10 applied math we went back in time to around grade 5, when these students had the covid shut downs and online classes. This meant that their learning and understanding of fractions was limited.
We spent some time using strips of paper to fold equal parts, and explore what the fractions are.

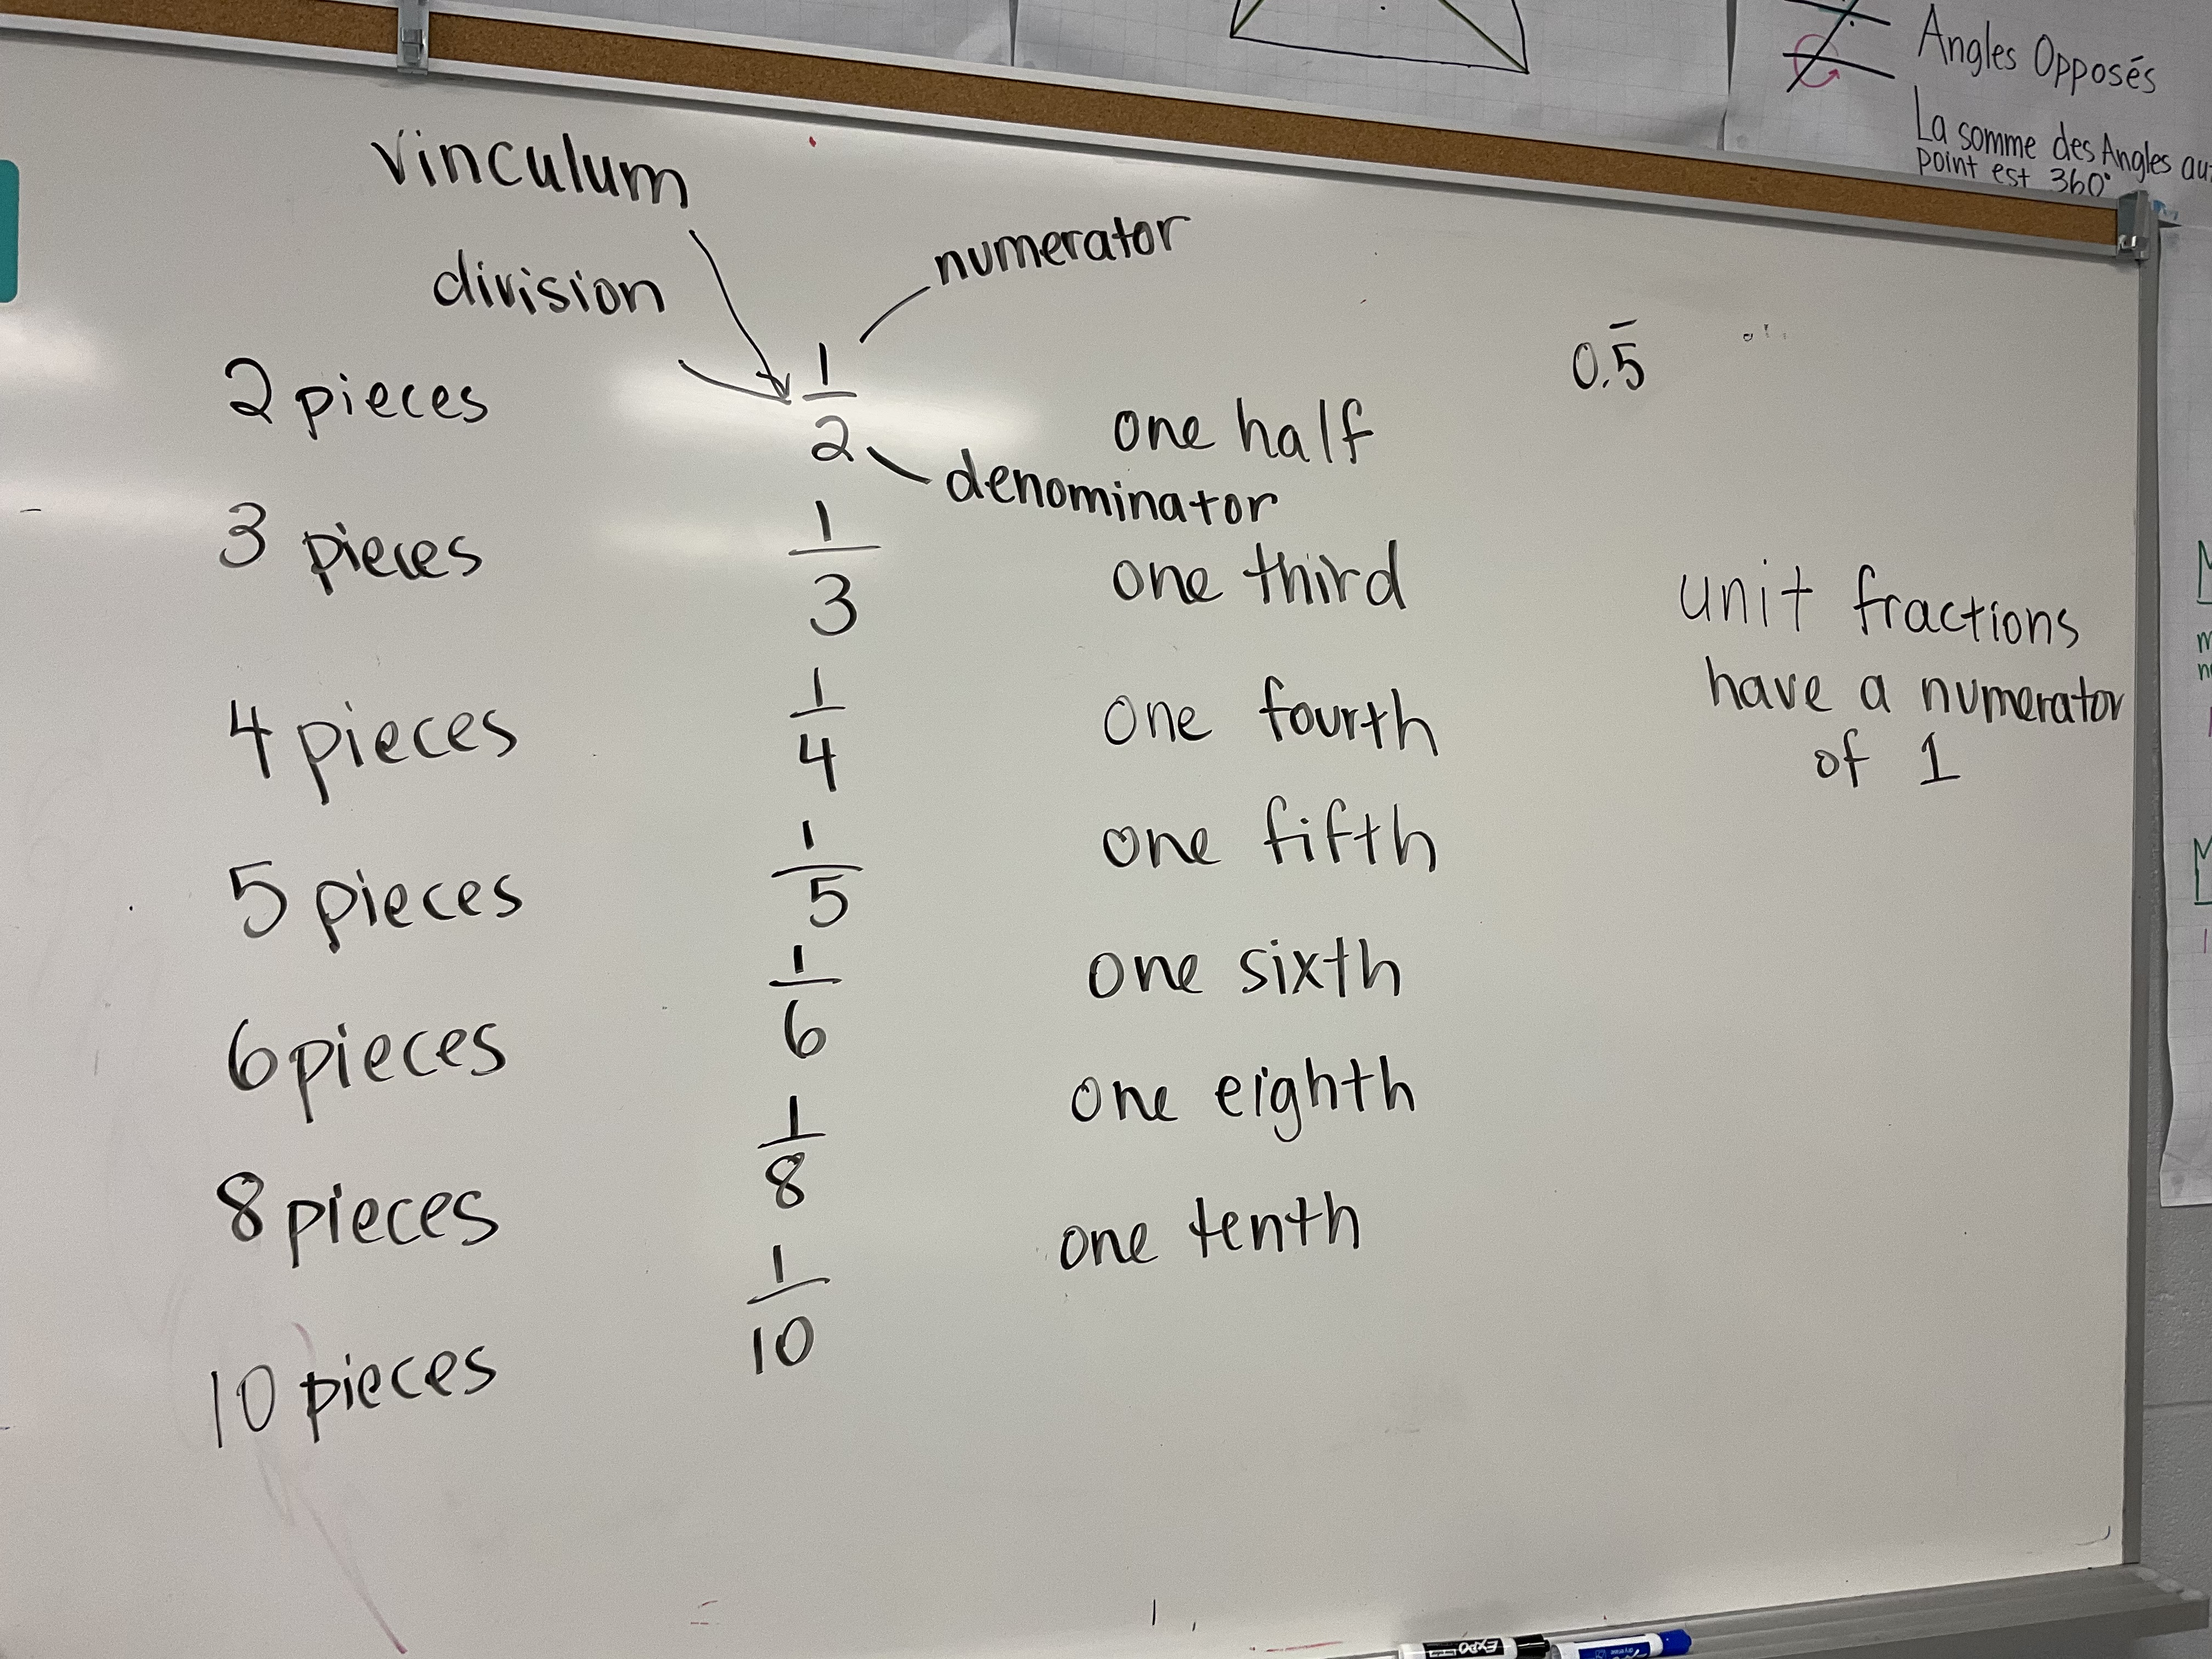
The first few were easy, but there were challenges folding fifths and tenths. We drew and identified each unit fraction as we went.

We noticed that as the number of pieces got bigger the denominator got bigger, and the pieces got smaller.

We looked at vocabulary related to fractions and remembered words like numerator and denominator. We remembered that fractions are like division. We also learned a new word that the line between numerator and denominator is called a vinculum. A vinculum is also the little line used over a repeating decimal.
We looked at how we could make equivalent fractions. We noticed that even numbered denominators work nicely to make equivalents to one half.

we noticed that these fractions that are equivalent to one half have numerators that are half of the denominator, or denominators that are double the numerator. We even made some equivalent fractions that used really big numbers like 500/1000=1/2.

Guest Post
This is a post about an activity that I didn’t get to witness, but I heard about in the planning stages, and saw pictures of the fun. The grade 10 class was introducing the equation of a circle.
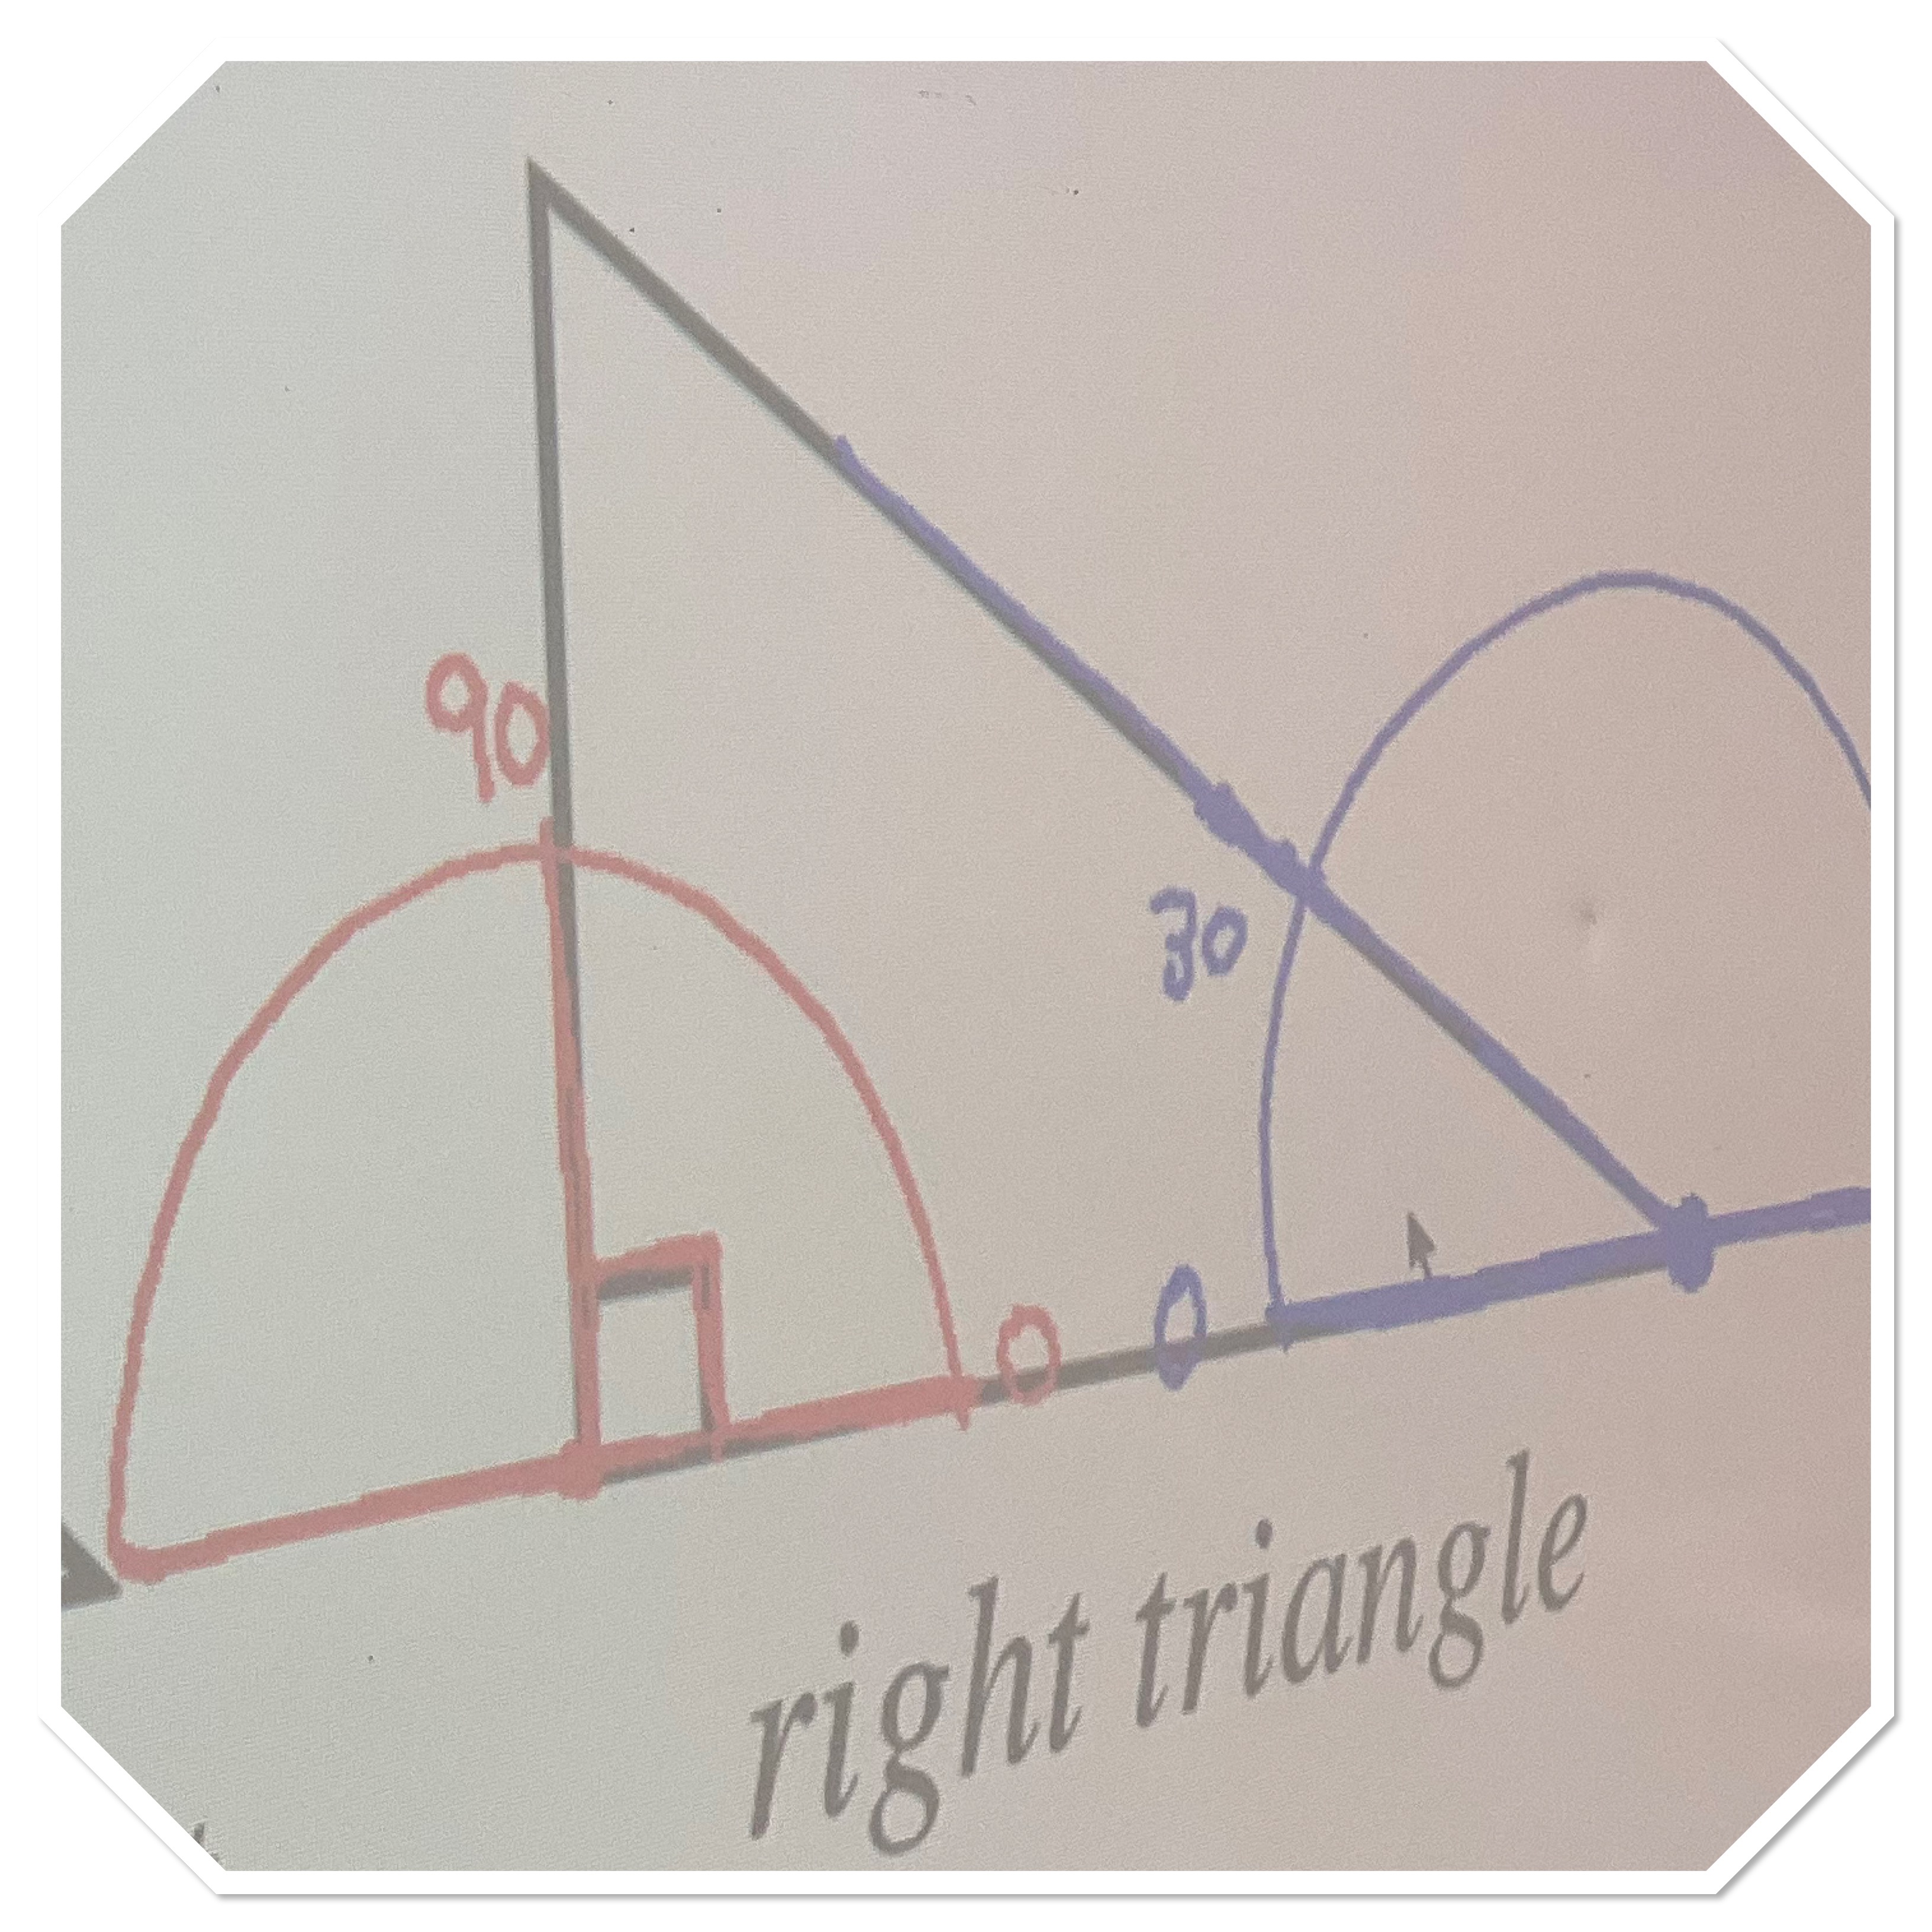
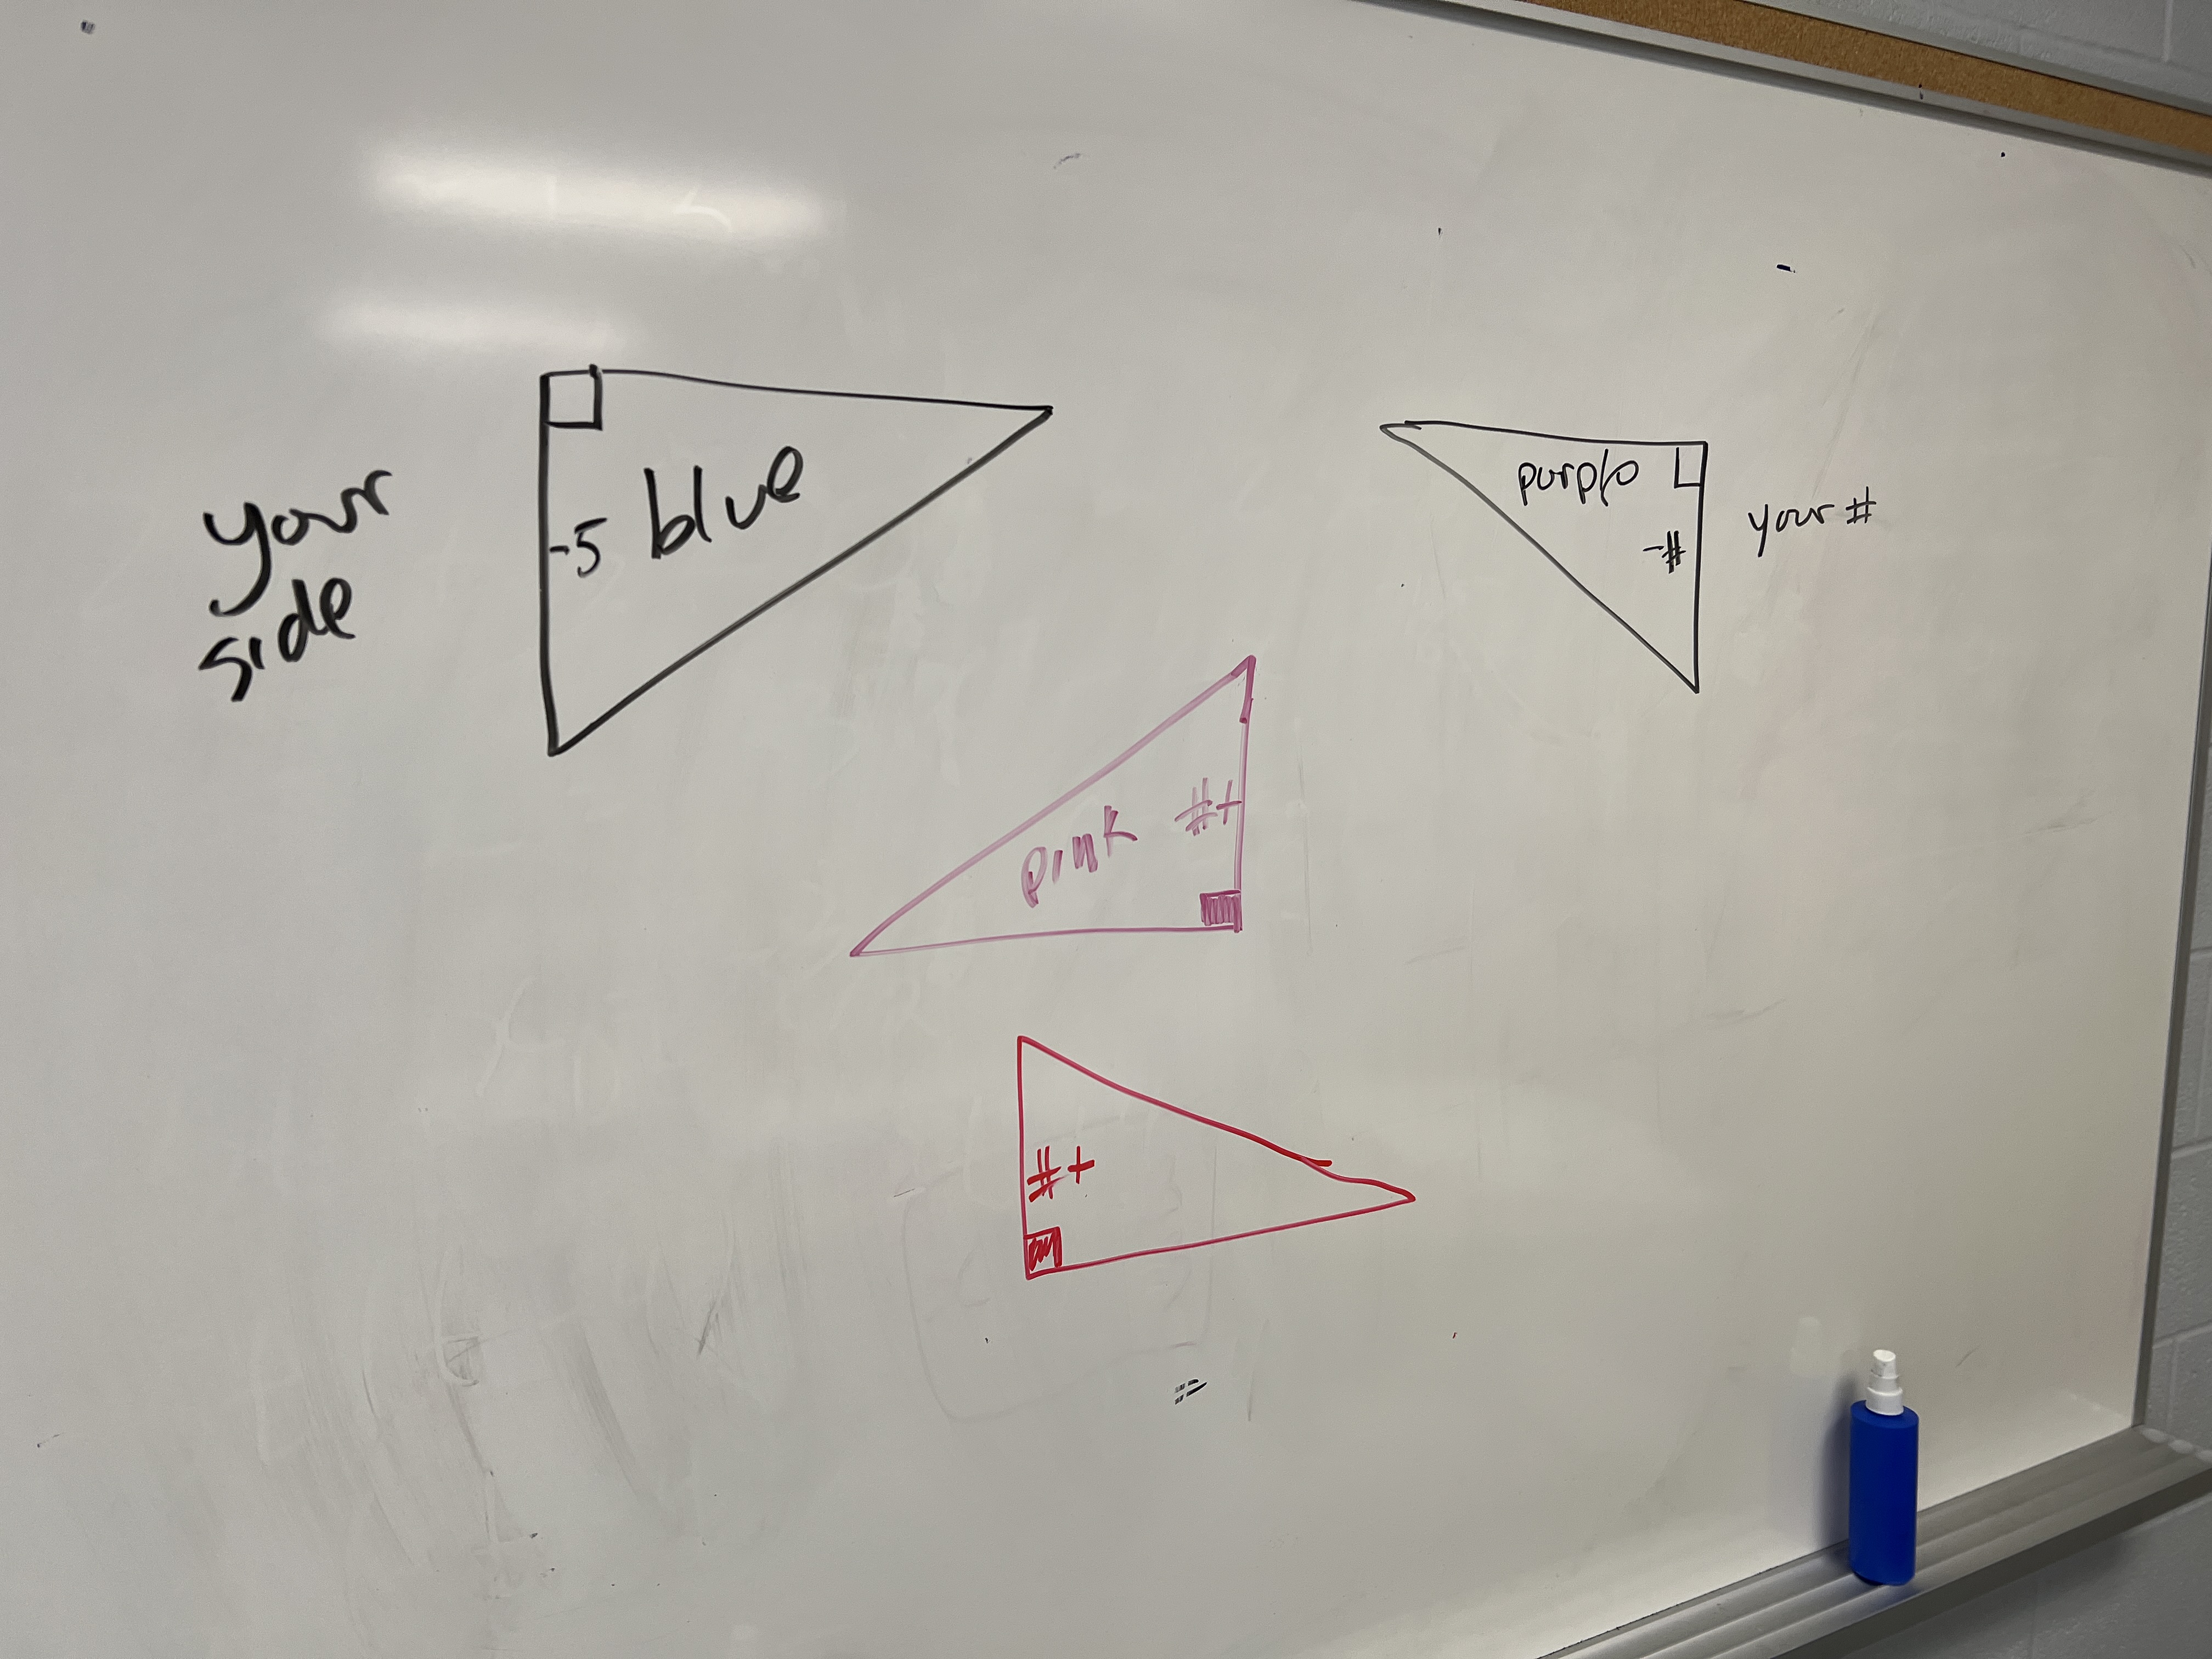
They started by building right angle triangles with a hypotenuse of 20cm, and a uniquely specified side length. Some worked in red, others pink, others blue, and others purple.
The triangles were all put up into one big picture on the board. One acute angle was on the origin, and one of the legs of the triangle was on the x axis. Blue and purple went into the negatives, and red and pink were positive values.
When placed, together there began to be some patterns emerging.
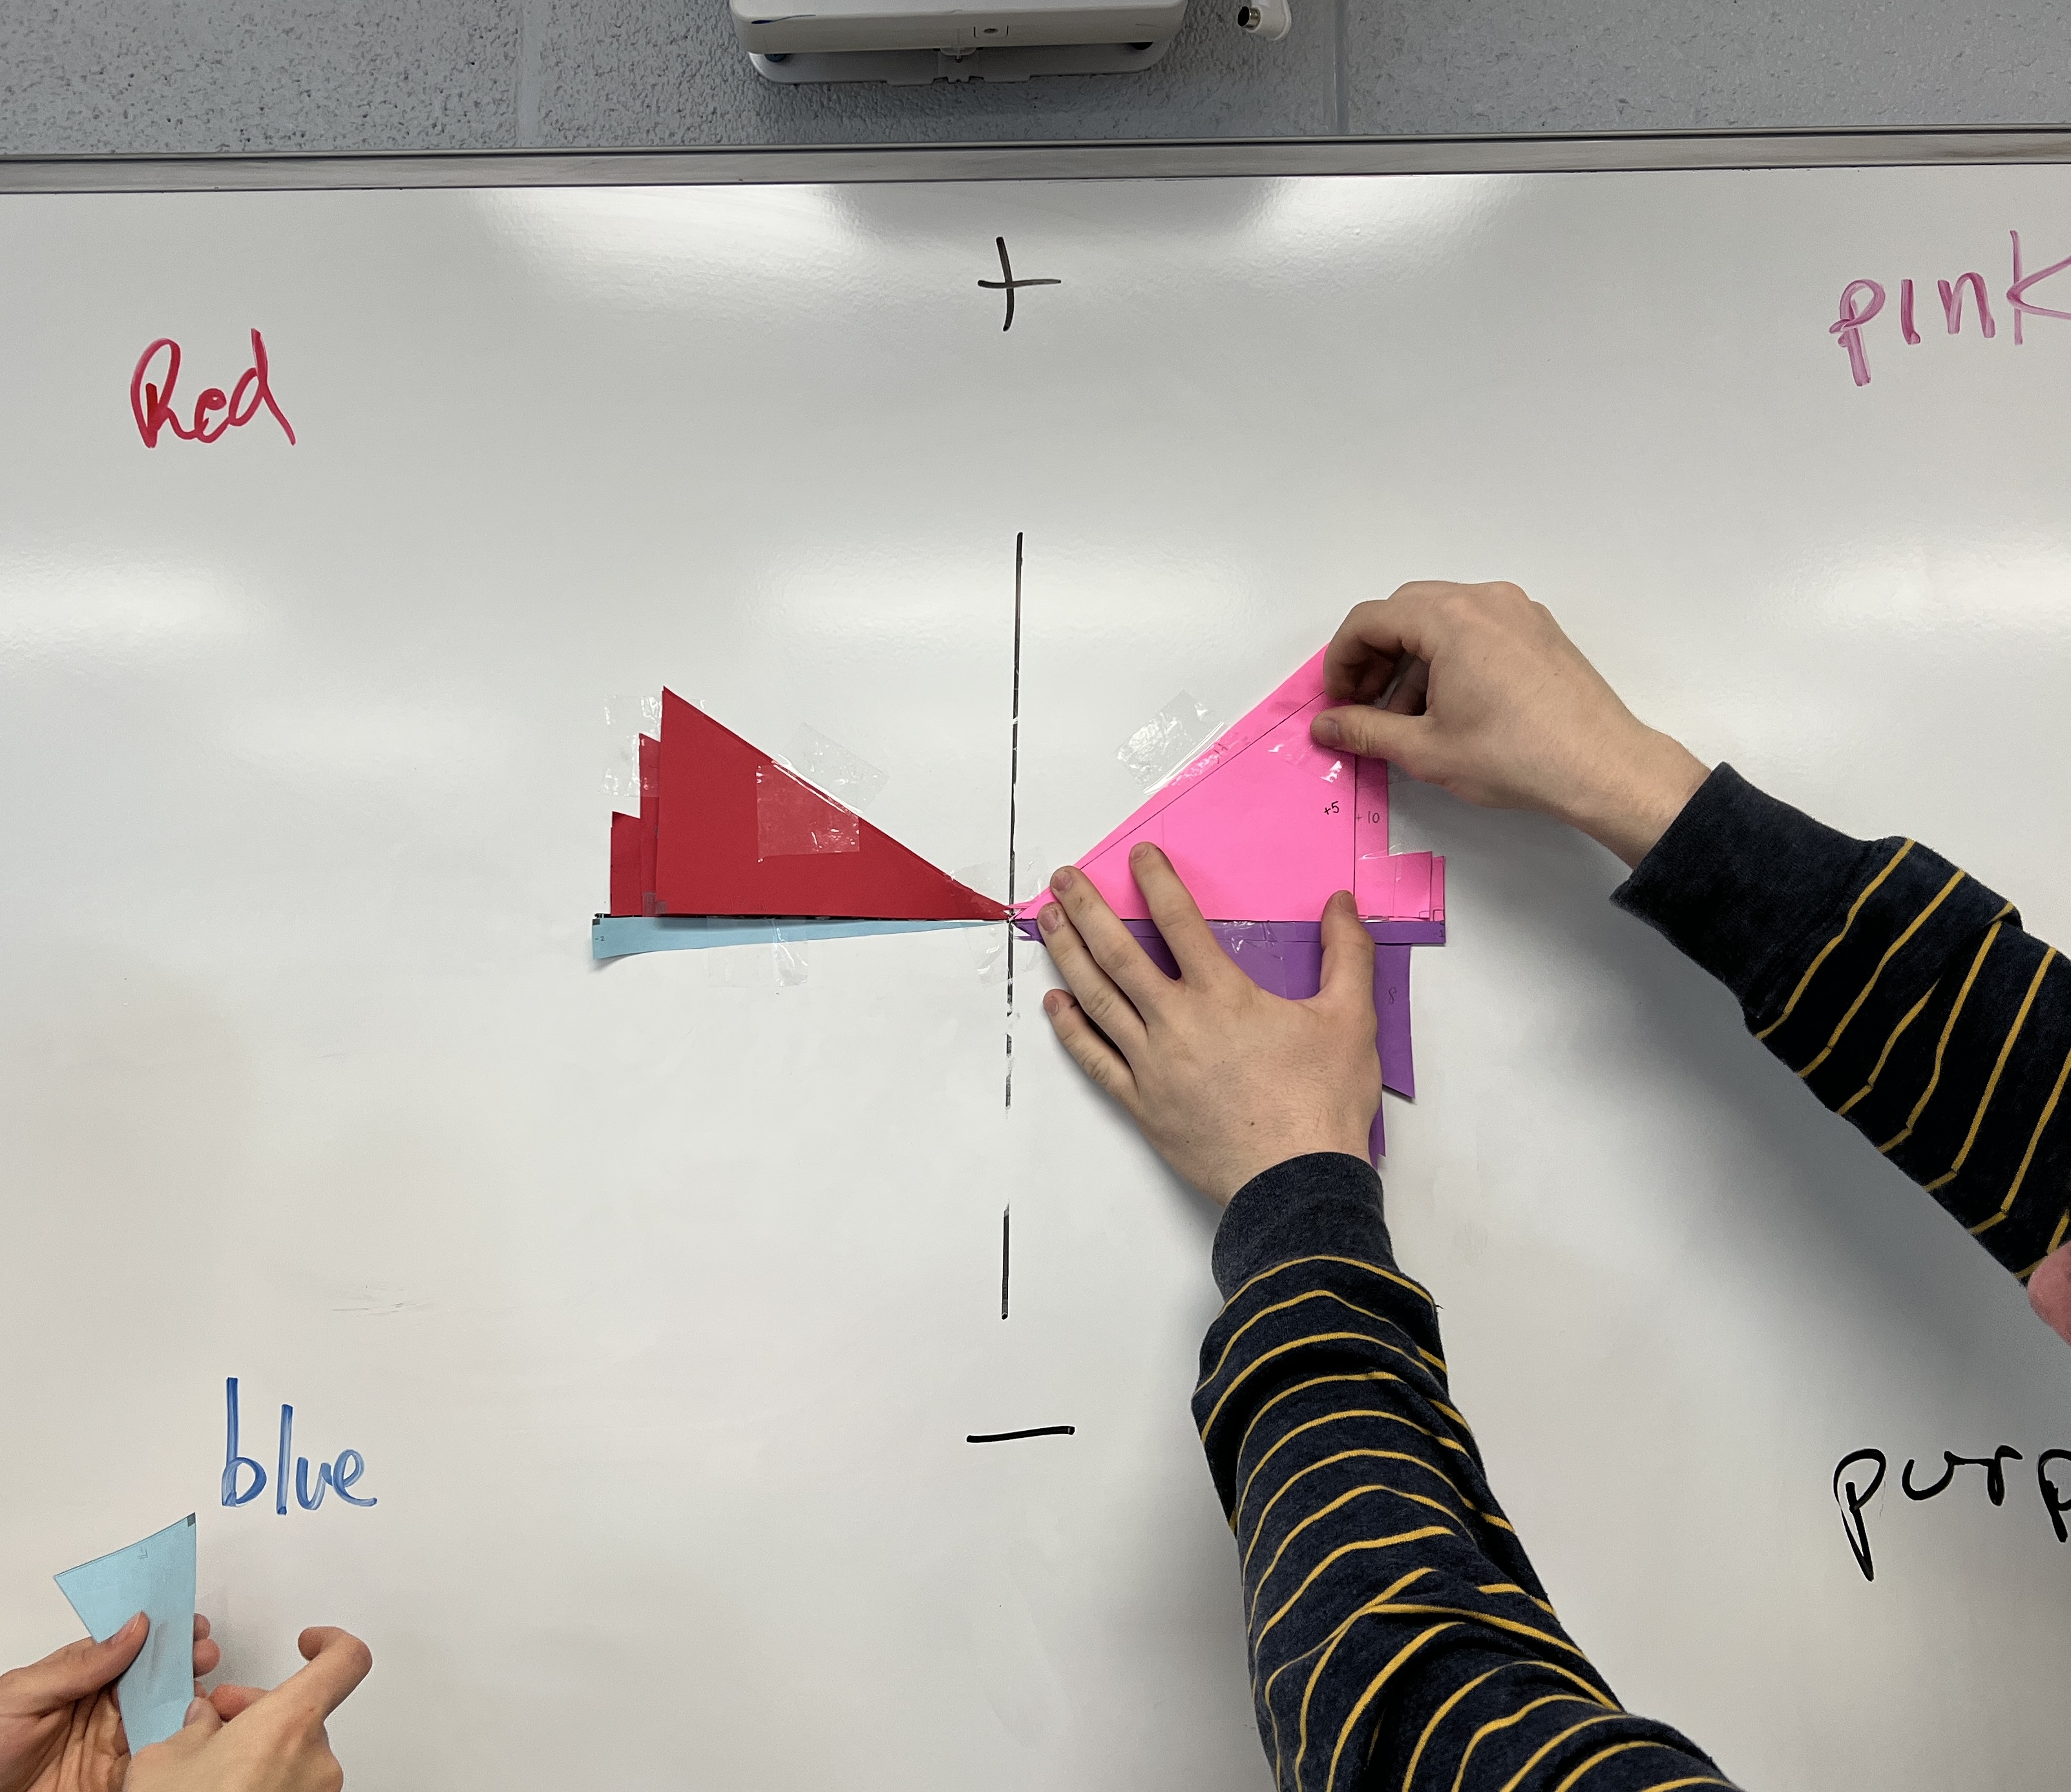
Not only did they see that each of the quadrants had triangles, they noticed that some were longer, and some were taller. More triangles were made to fill in the gaps, and to see the shape that emerged.

There’s a circle that forms. The coordinates of the point on the circle come from the side lengths (x and y) of the perpendicular sides of the right triangle. The radius is the hypotenuse of the right triangle.
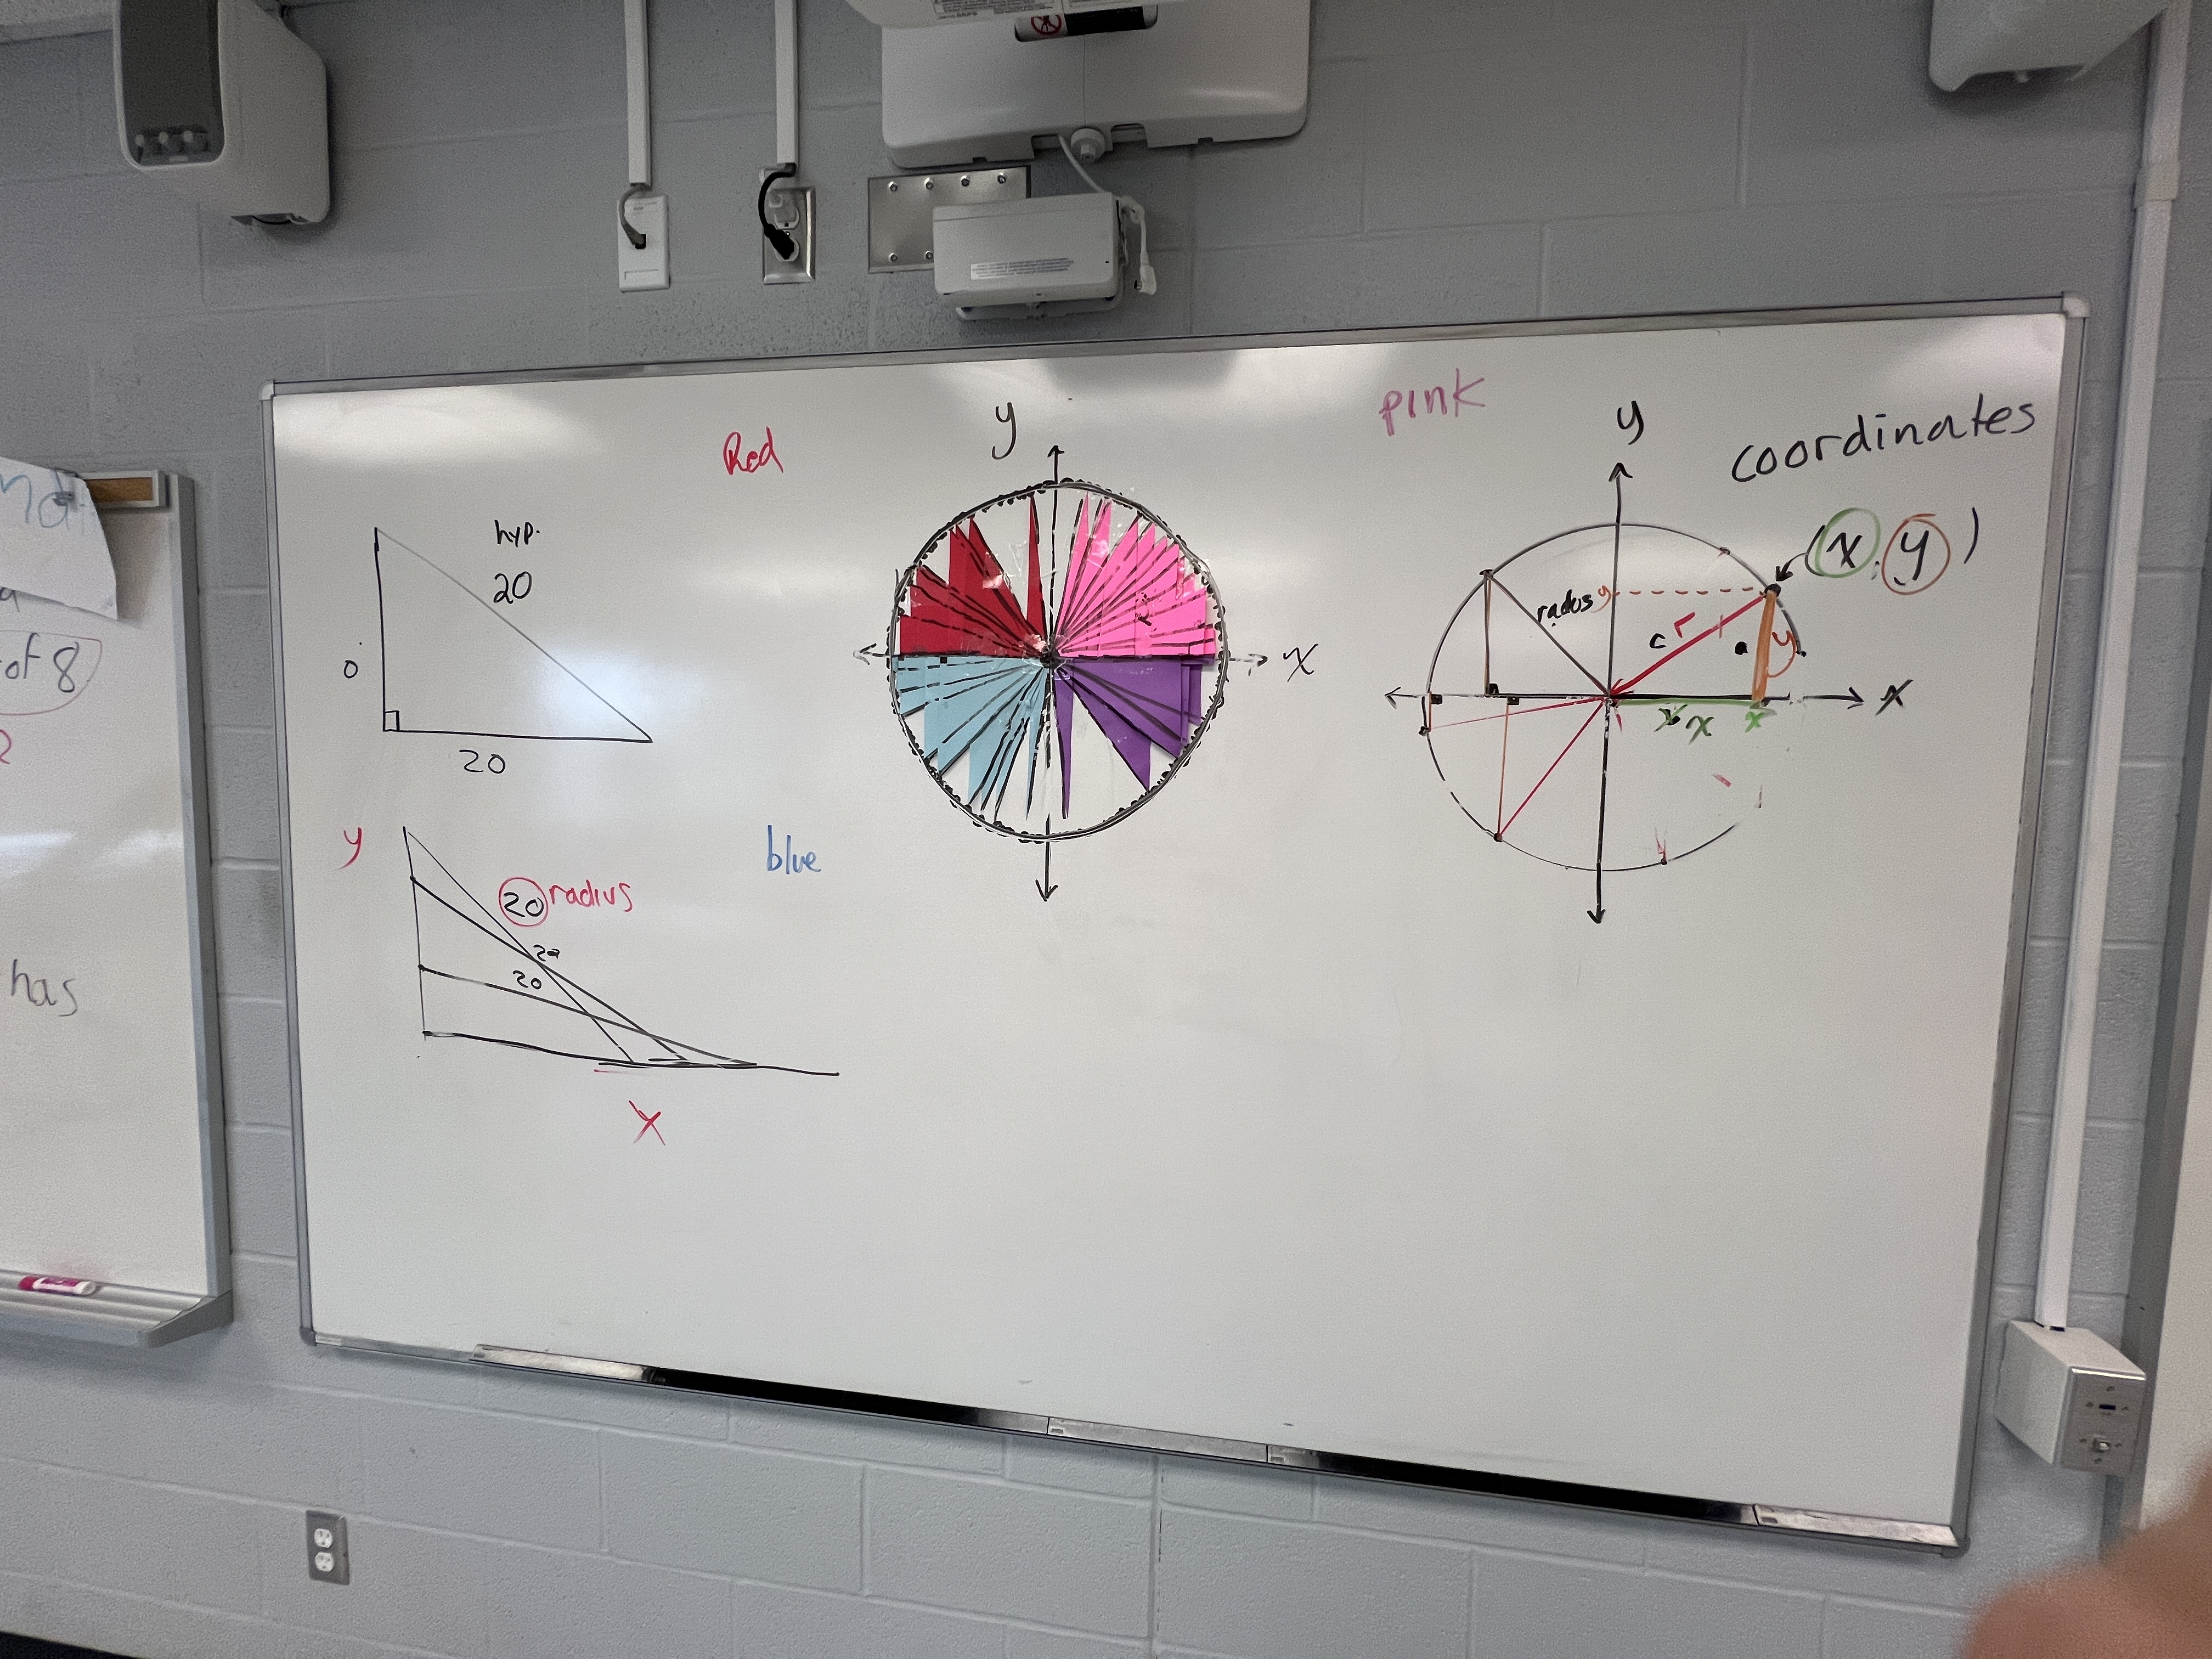
This was a neat way to connect ideas about right triangles and access some of that prior knowledge, and connect it to new learning about circles. By working hands-on everyone was participating and contributing to building the over-all picture.
I’m looking forward to trying this when I teach 2D again.
