Desmos
Here is a desmos graph of a banana.
I can’t embed the desmos screen which is too bad, because the interactivity would be nice, but you can open it up in a different browser.
We can see if we can model the shape of the banana with a parabola. Desmos has a lovely experimental approach, where you can write an equation and then manipulate sliders and watch how the graph changes.
See if you can find the perfect values for a, r, and s, and then see if you can figure out what those values do to the graph.
Here is a desmos graph of the water fountain. To add the equation of the parabola, use the “+” button at the top left, and add an expression. y=a(x-r)(x-s) and then you should see the slider option. Select ALL and then slide them around to see if you can match the water fountain too.
What other parabolas do you see in your daily life?
Someone in the class determined the parabola that could best model their chin.
Math Conference
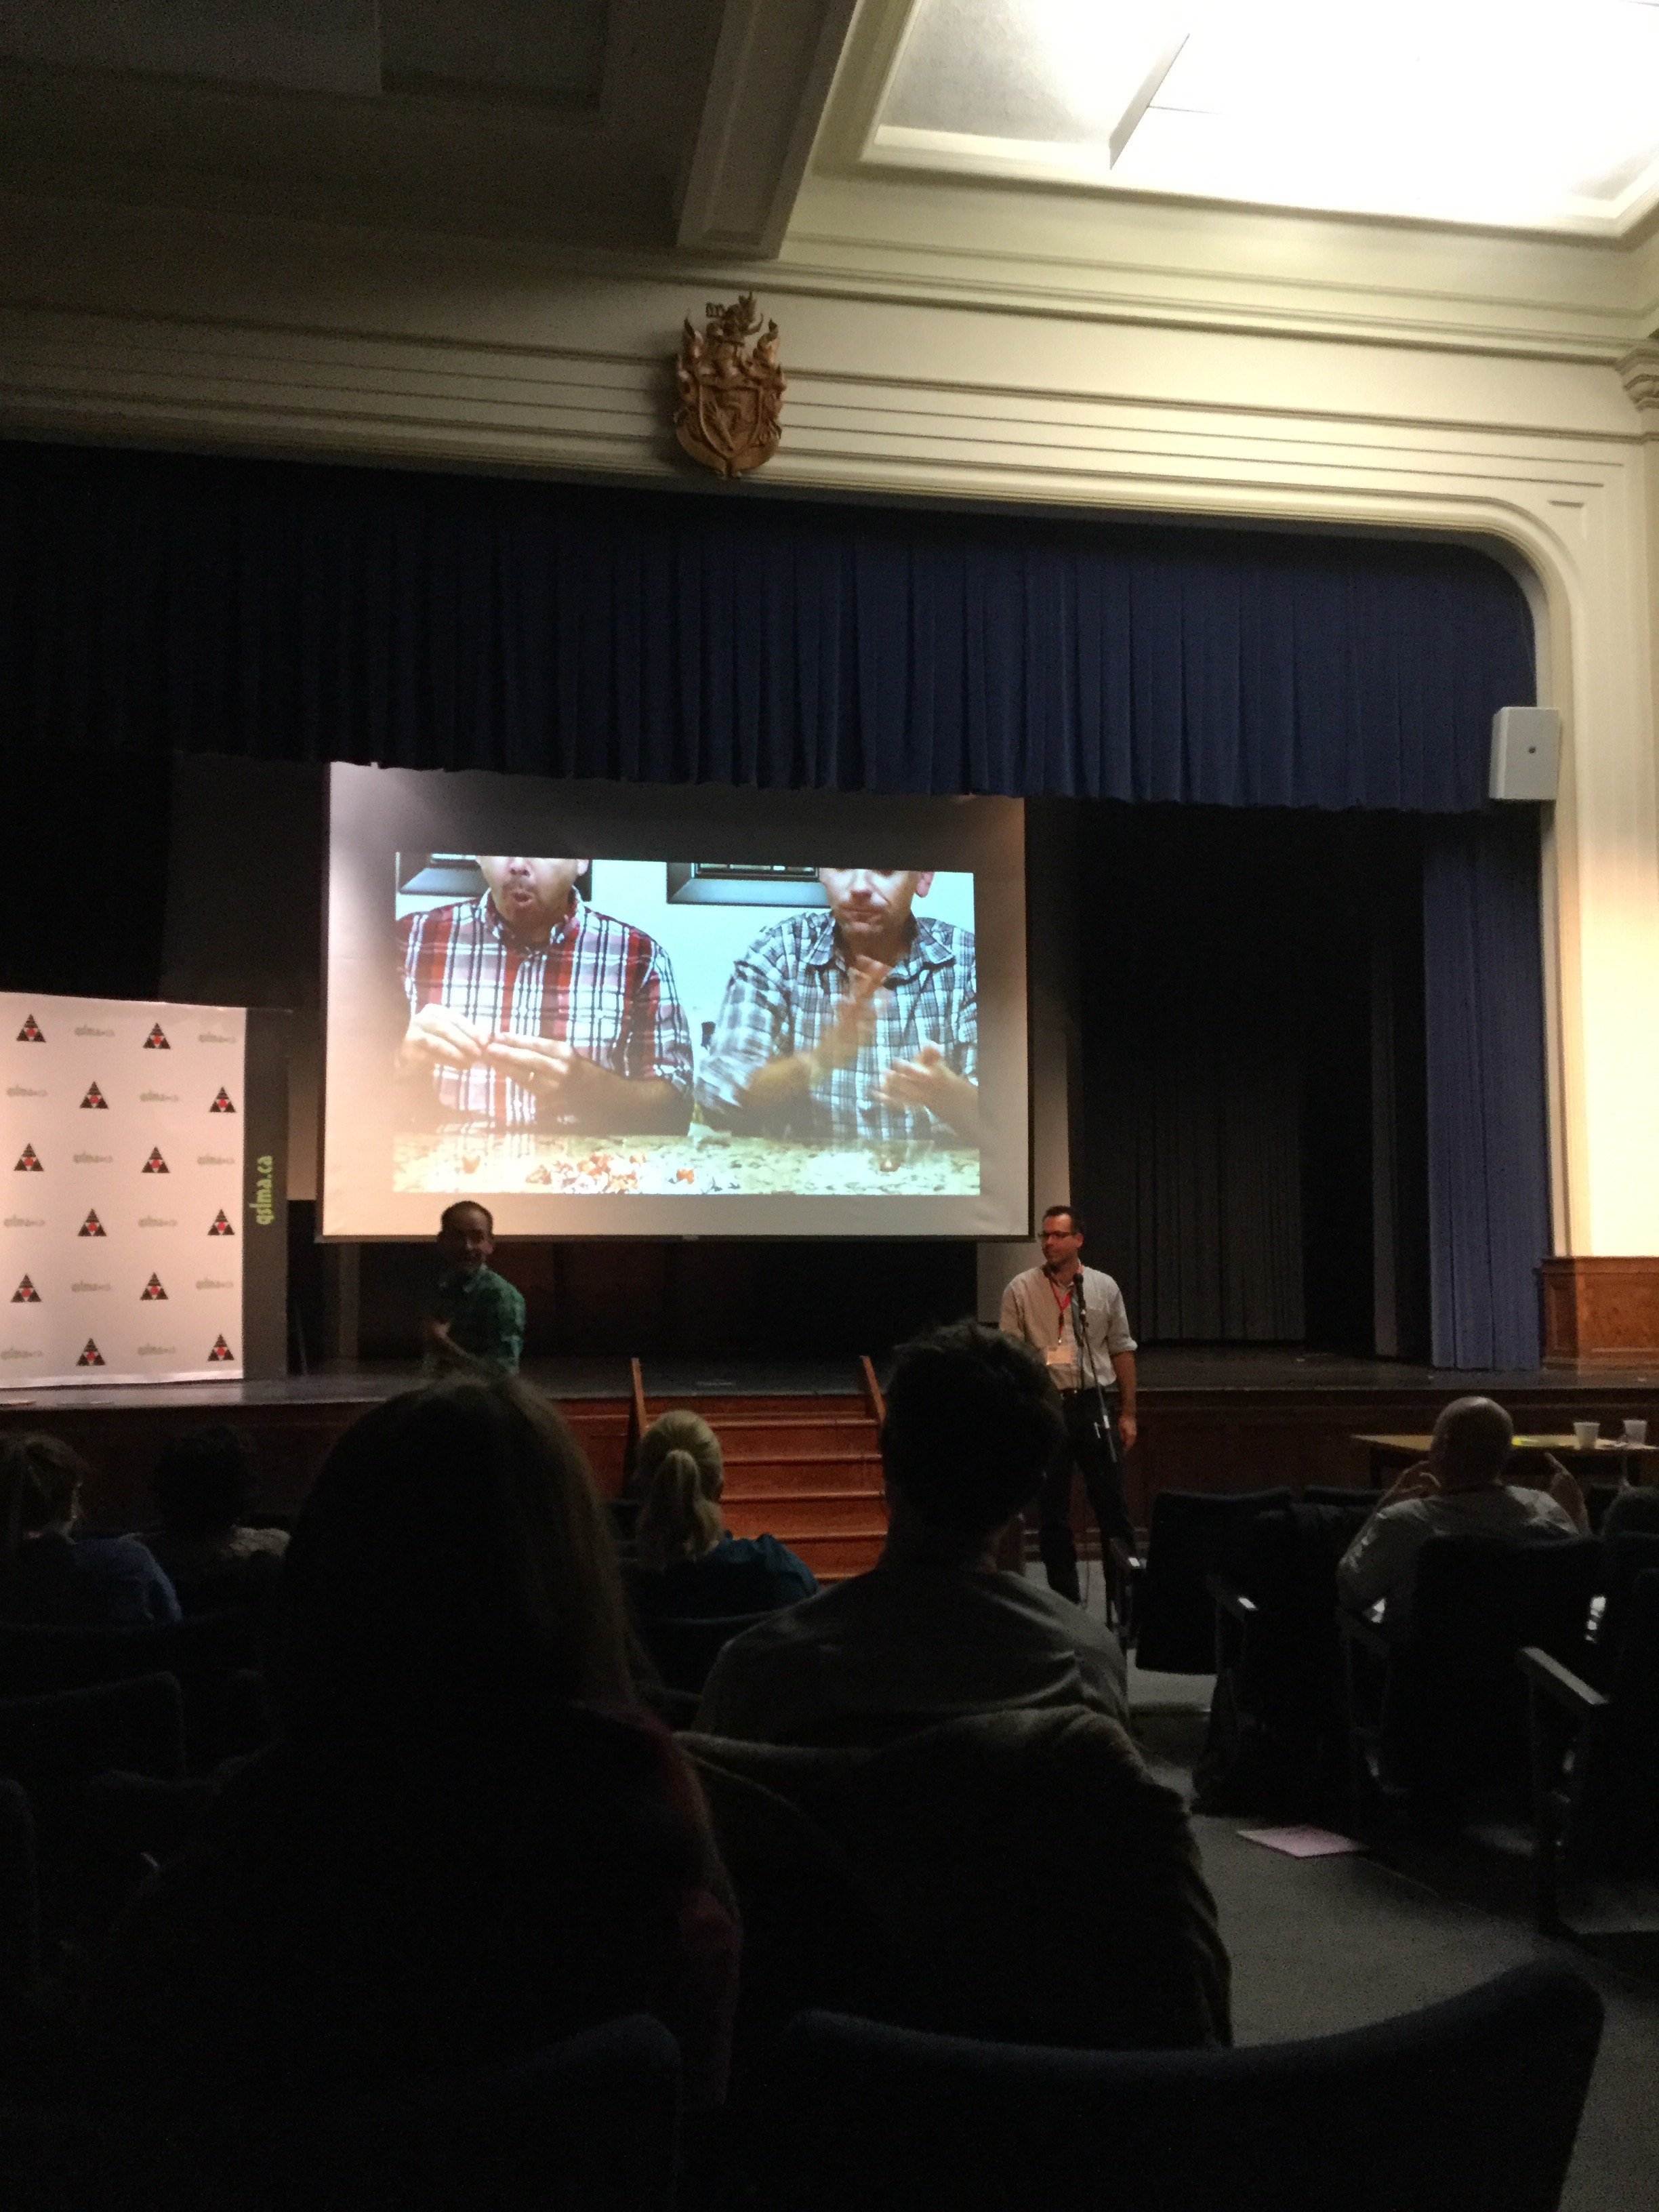 You know the people who film all those math videos? Two of those guys came here today and spoke with a lot of math teachers at KC tonight. Mr. Orr and Mr. Pearce are sharing some of their ideas about math education.
Candle Question
We watched the following video
Act 1 video
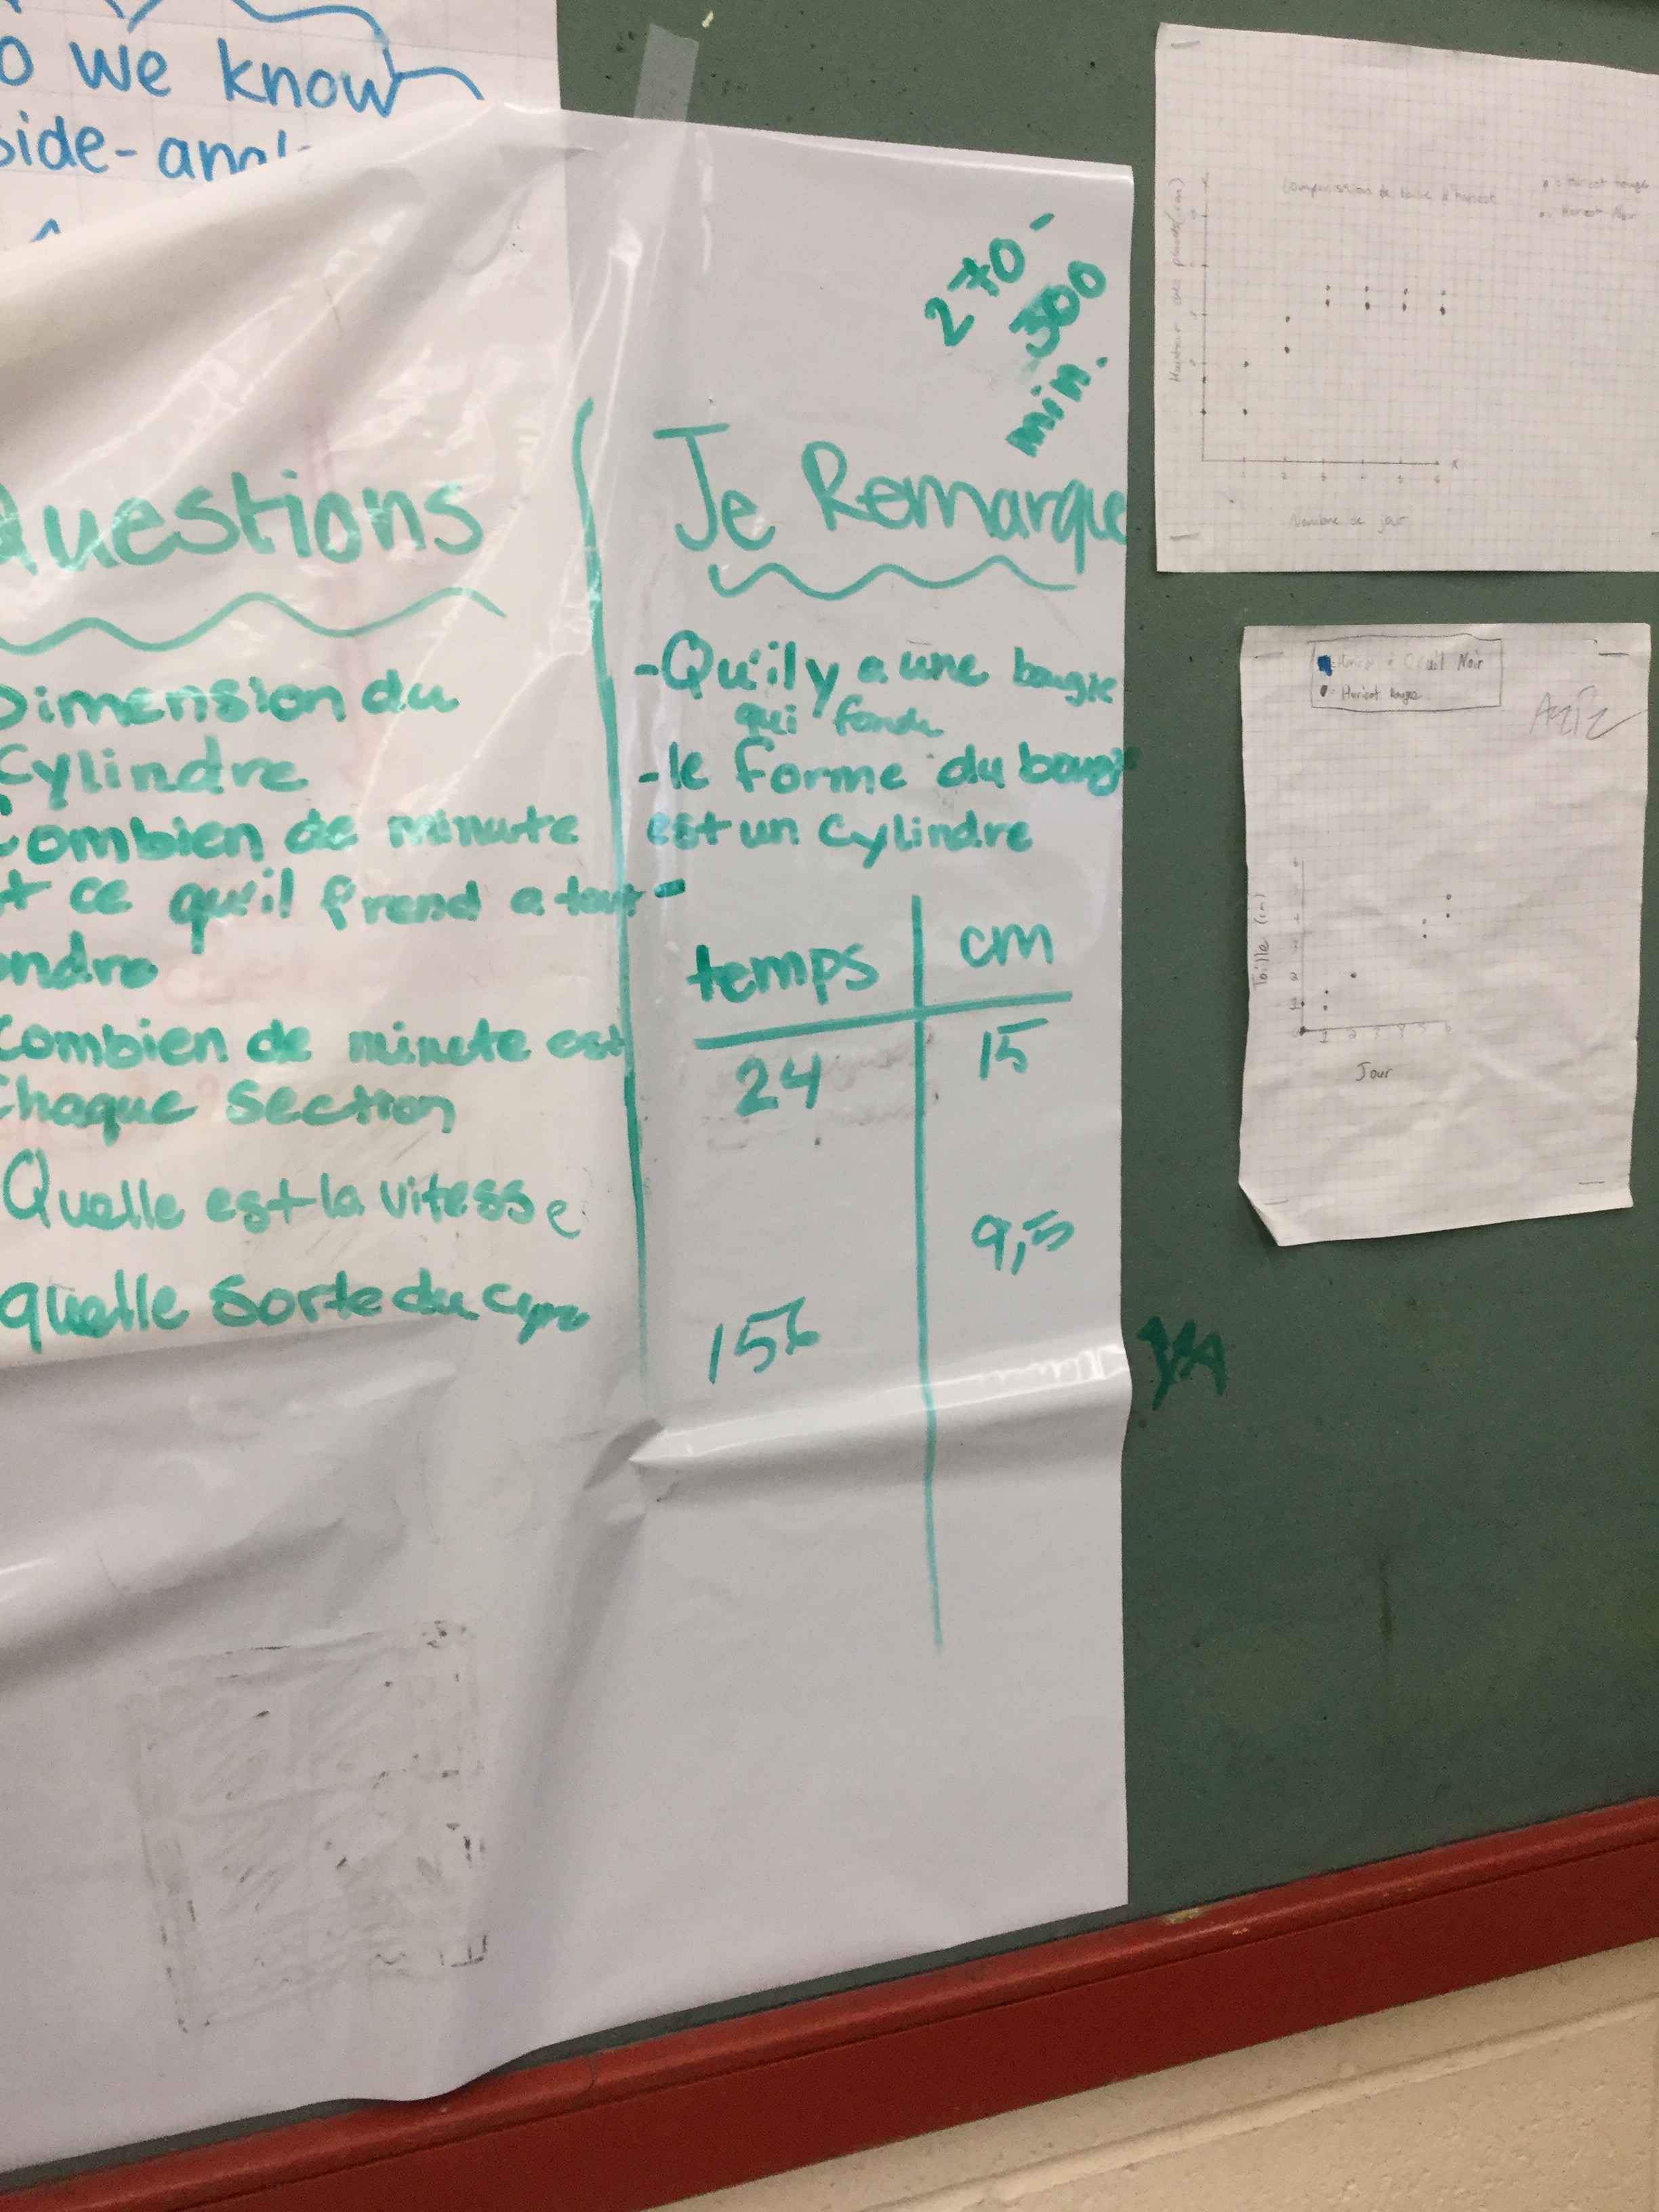
And then we noticed and wondered some things.
We looked at the next part of the video
Act 2 video
And then we estimated and calculated how long it would take for the candle to burn down.
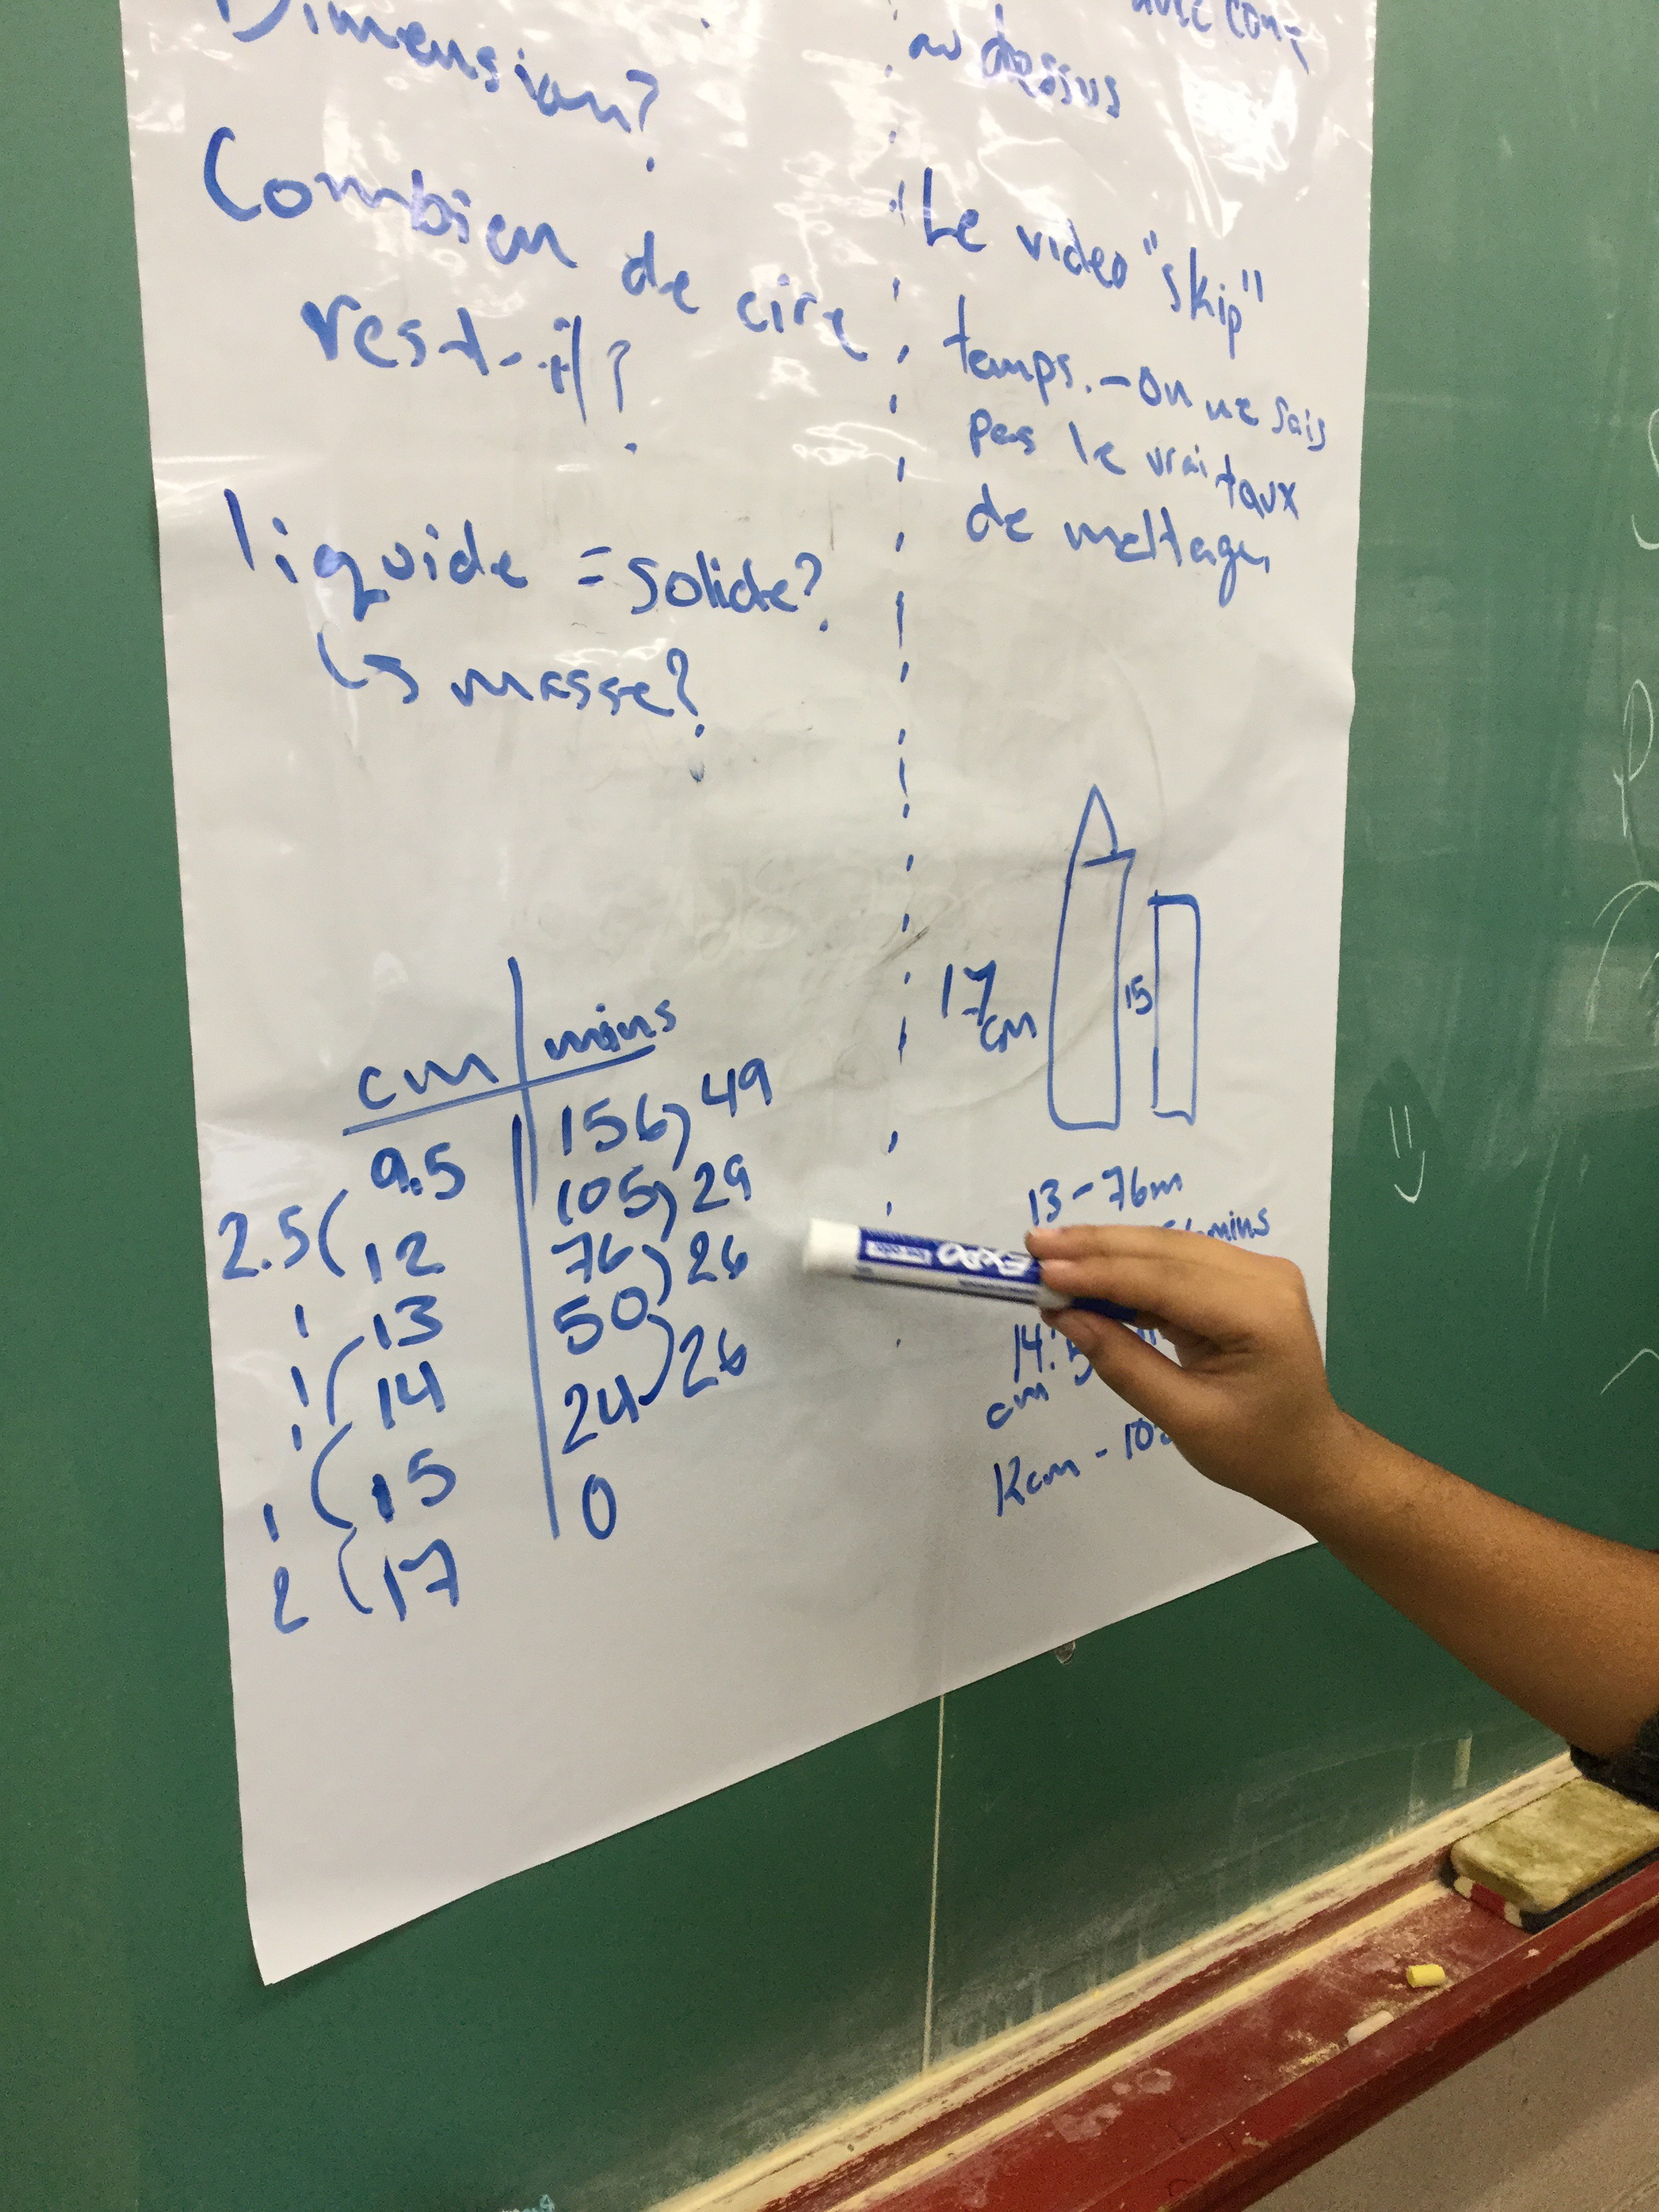

The next step is to look at the video and see how long it really took.
Act 3 video
We noticed that some of our estimations were pretty good. We also noticed how a graph would be a good tool to use.
Differences of squares
Grade 10s started off today multiplying binomials, and headed towards multiplying a special sort of binomials (ax+b)(ax-b). Some of us use a box multiplying method, others use a distributive property model with arrows, and others build a model with algebra tiles.
Here’s an example of (2x+3)(2x-3) which simplifies to 4x^2-9. The -6x and +6x terms cancel out.

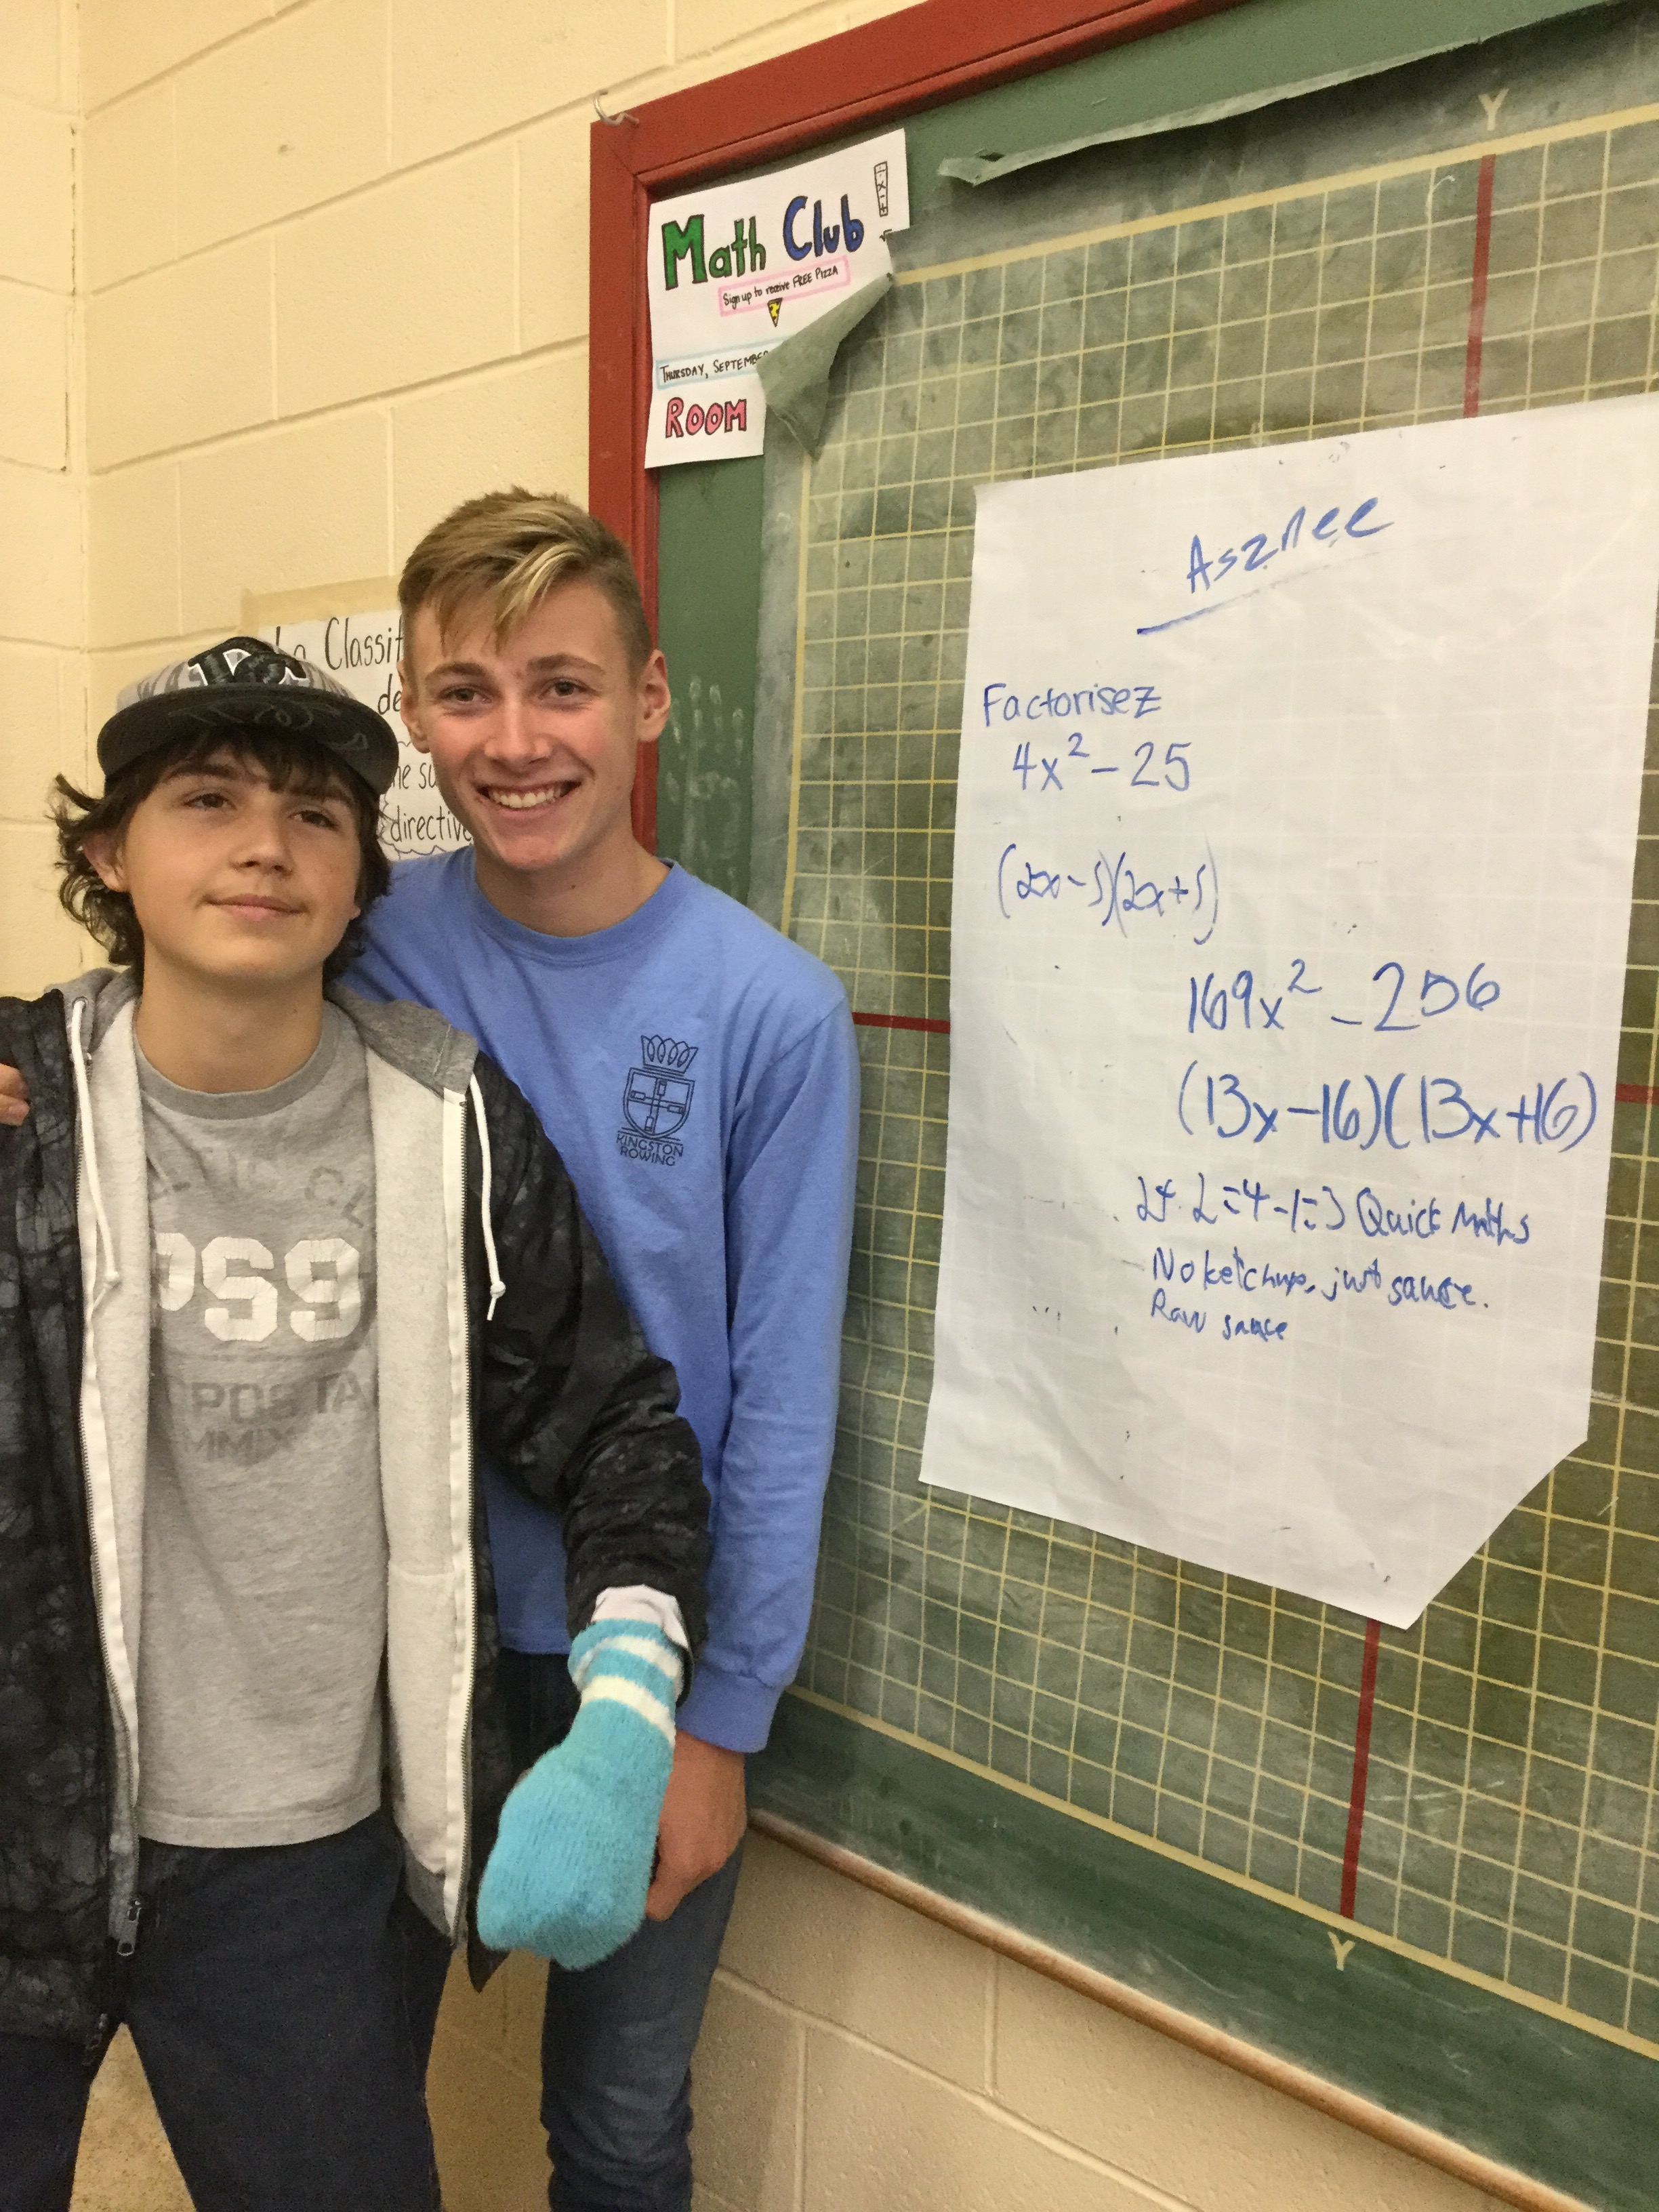
We played around with making questions that have only big red squares and small red squares in the expression, (spoiler alert: it isn’t possible, the colours have to be opposite) then we moved to working backwards, and factoring expressions that are made of different coloured squares.
Here’s an example:

We noticed that when the terms are both square numbers, and the signs on the terms are opposite that they can be factored in a special way. The binomials in the brackets are all the same except one sign will be different.
-36x^2+25=(-6x+5)(6x+5)
A different way to work
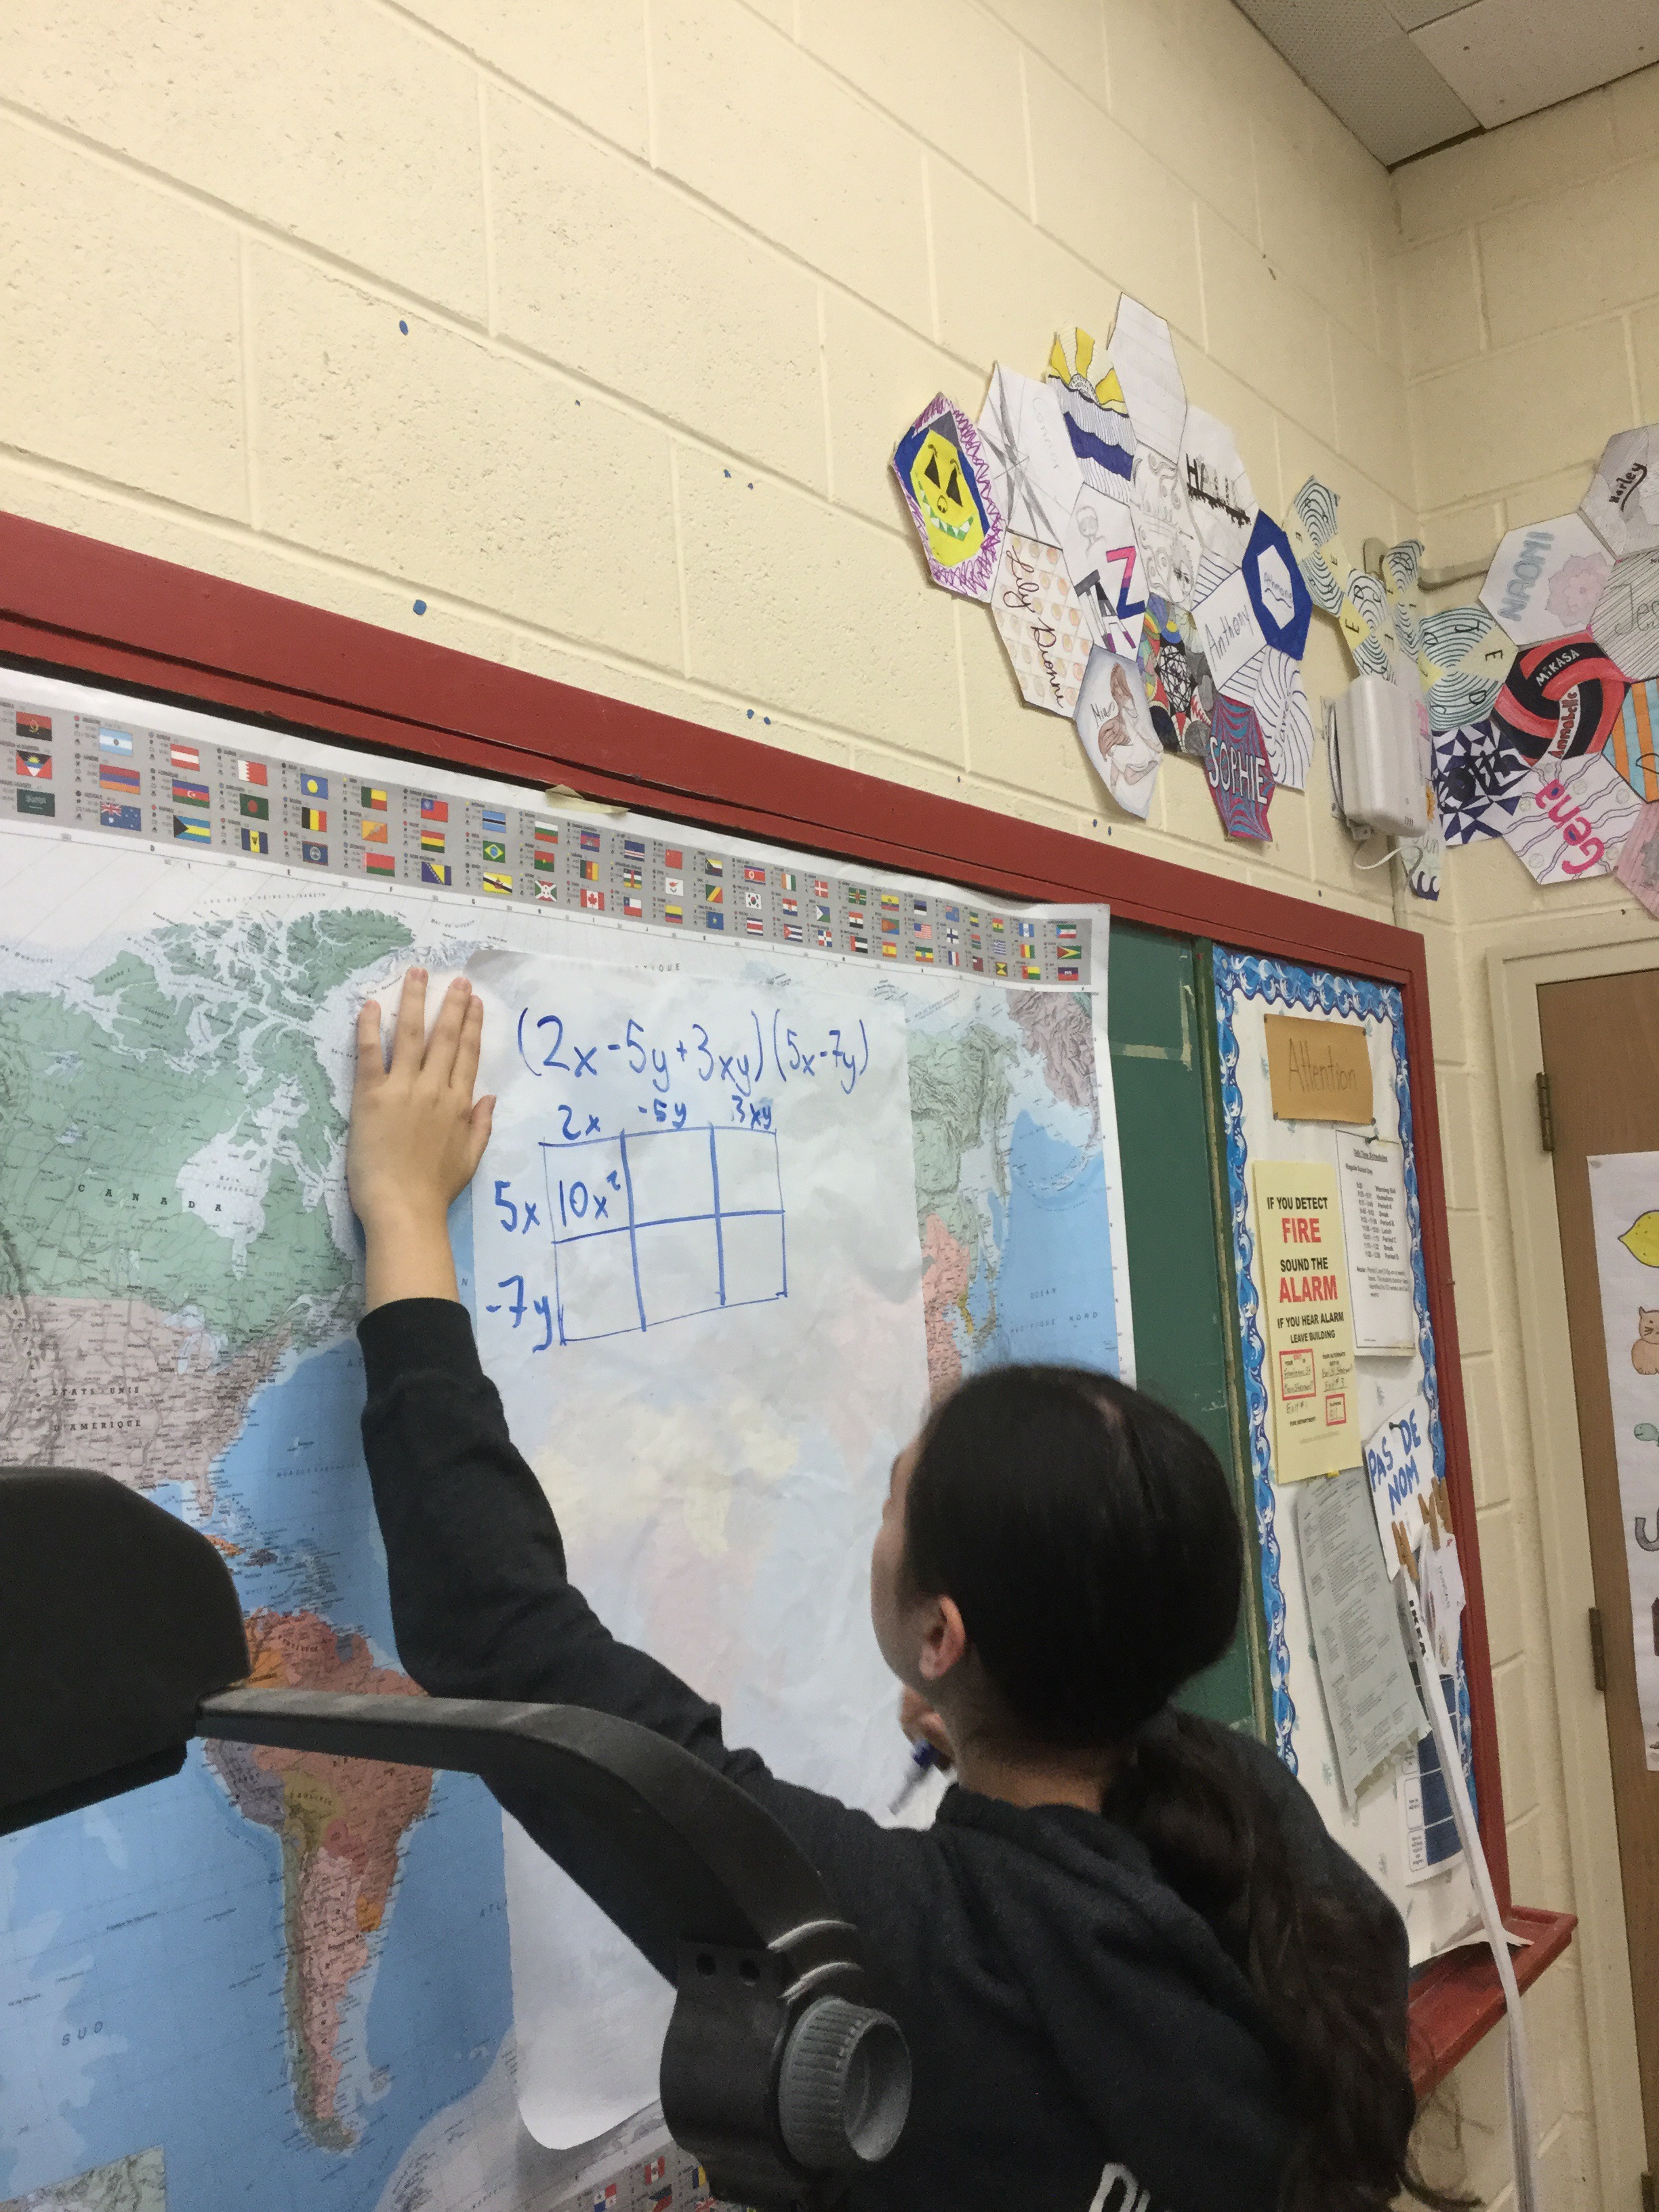
Today we’re trying something new. We’re flipping things around, and standing up at the boards, working on vertical surfaces in groups. The groups are randomly chosen by drawing cards from a deck.


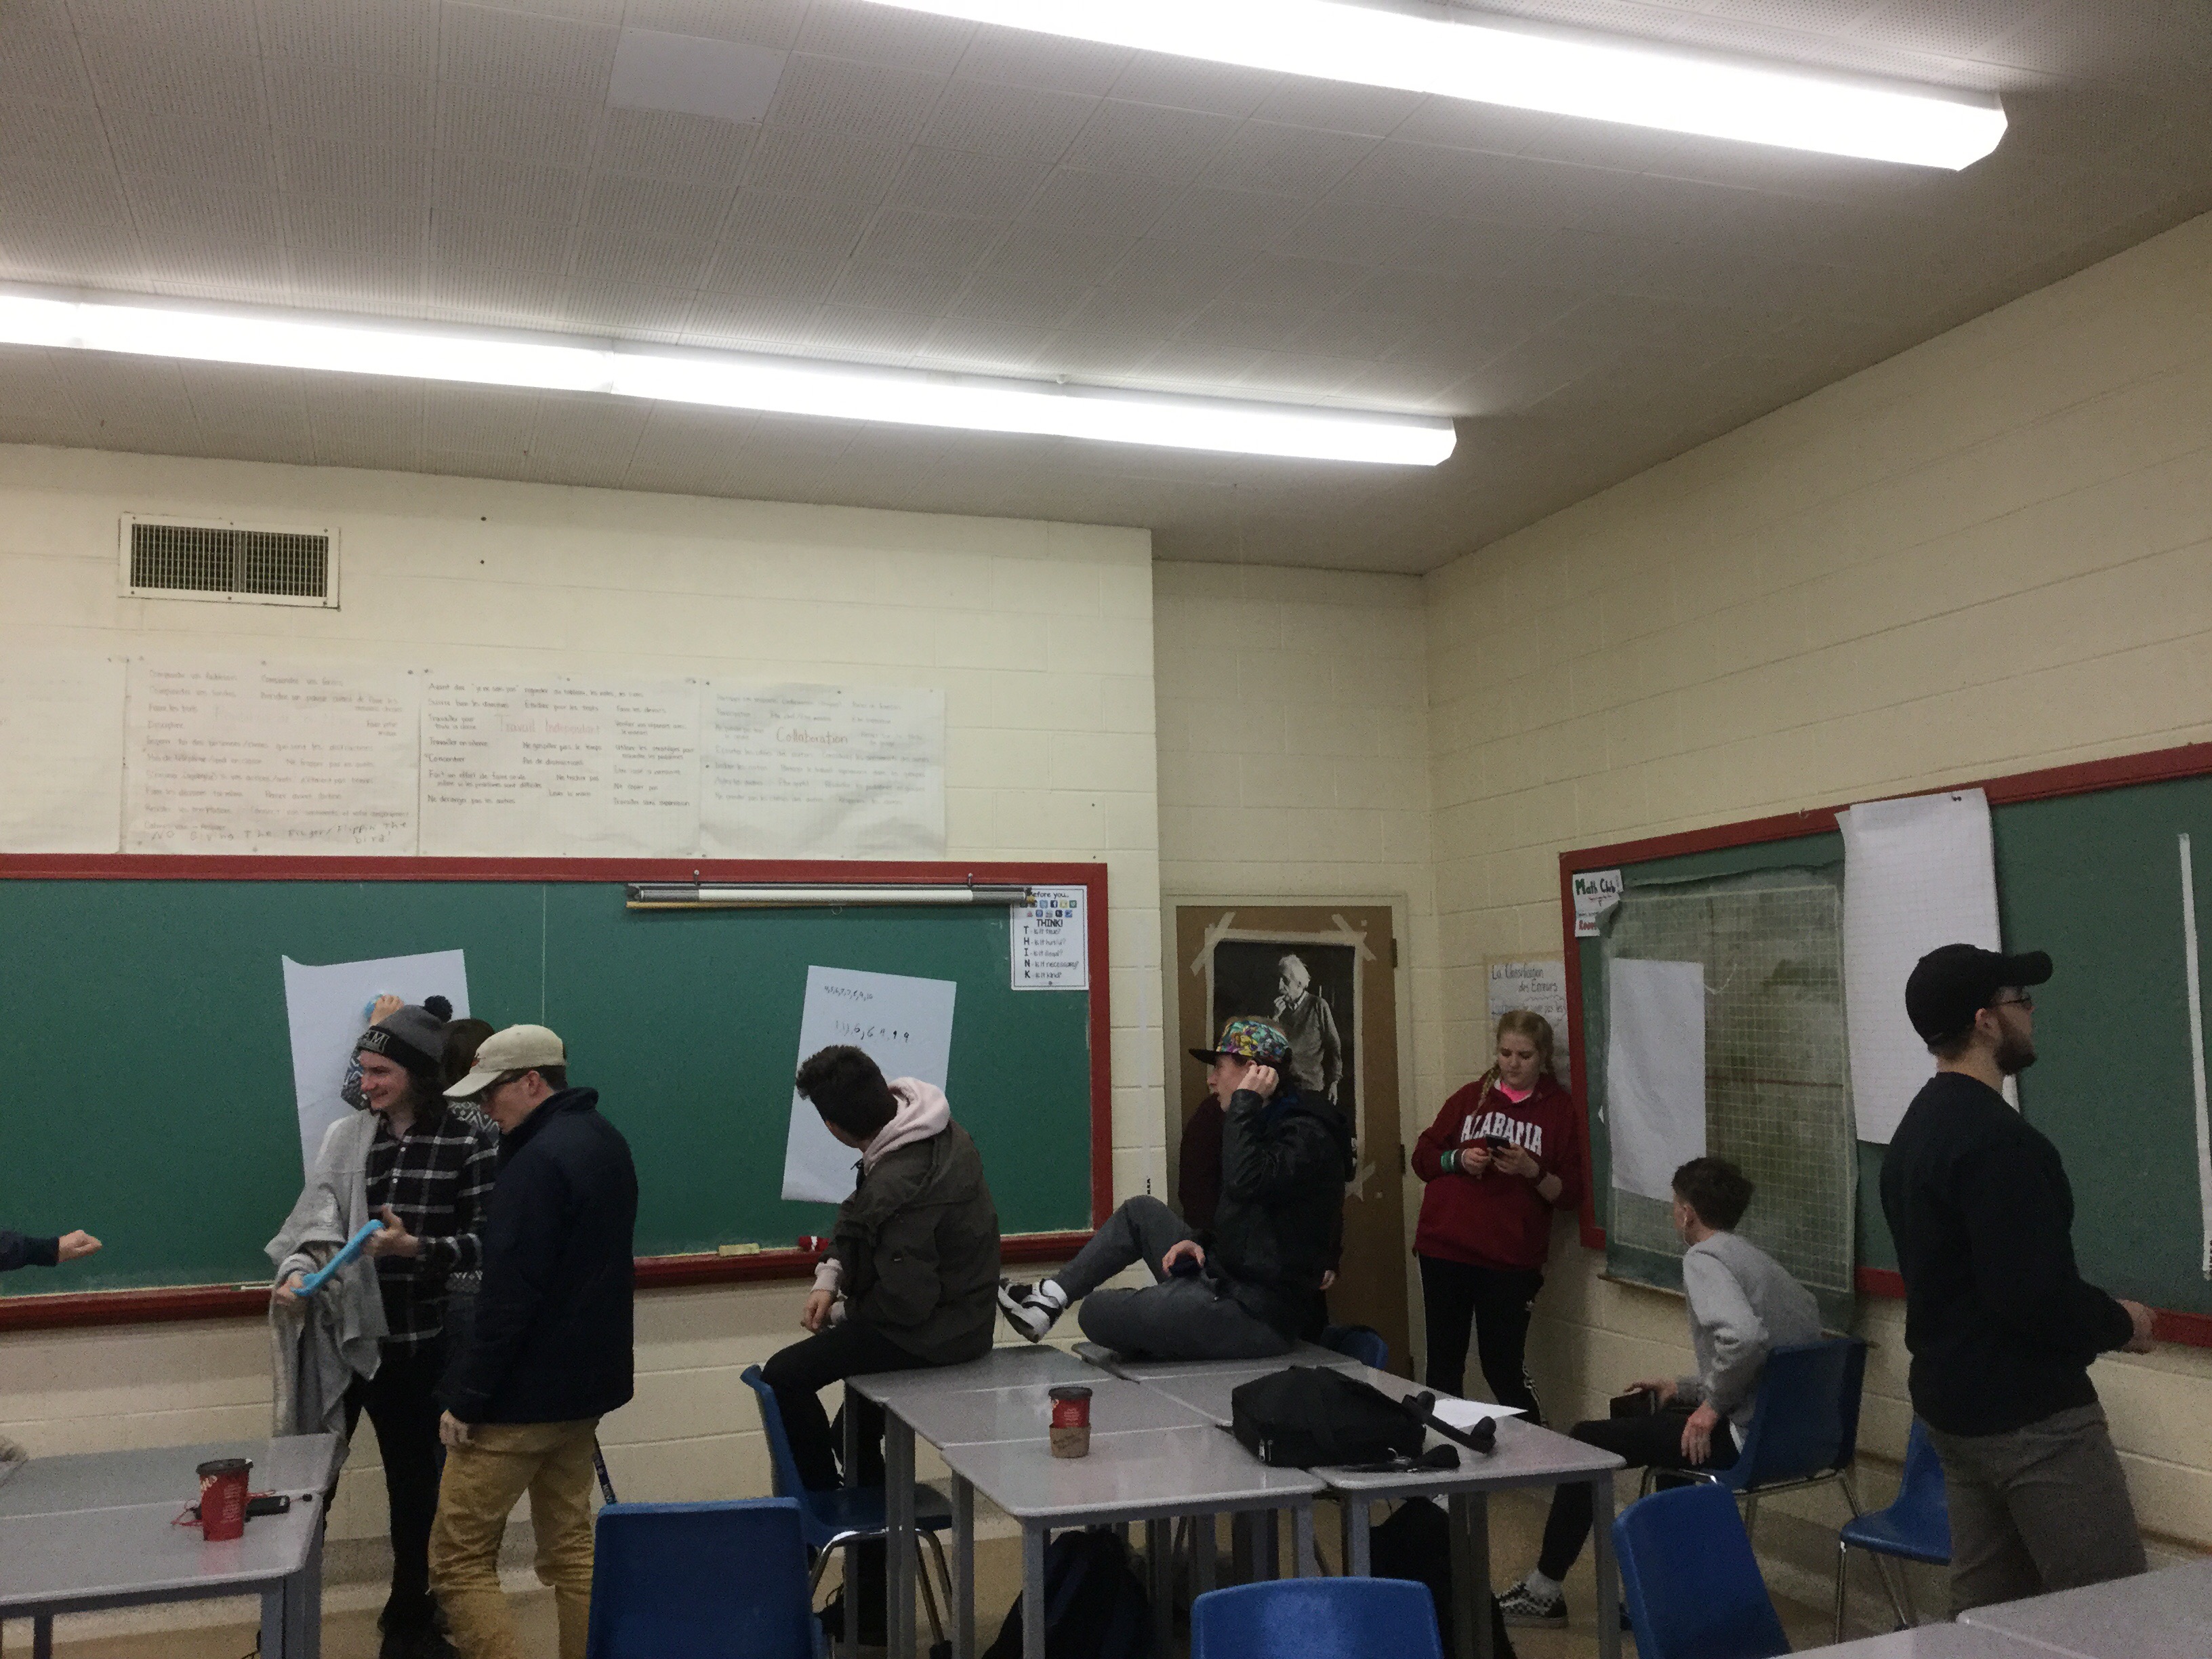
We sometimes are helping other groups, and we can get inspiration and hints by looking around the room.
Grade 11s are working on creating data sets with different restrictions on mean median and mode. Grade 10s are working on factoring differences of squares, and grade 9s are solving equations.
We’re even making up our own more challenging problems to extend our thinking.
Multiple representations
We’ve been working on factoring trinomials and multiplying binomials a lot this past week in grade 10. We can do it with the distributive property, and decomposition and with algebra tiles.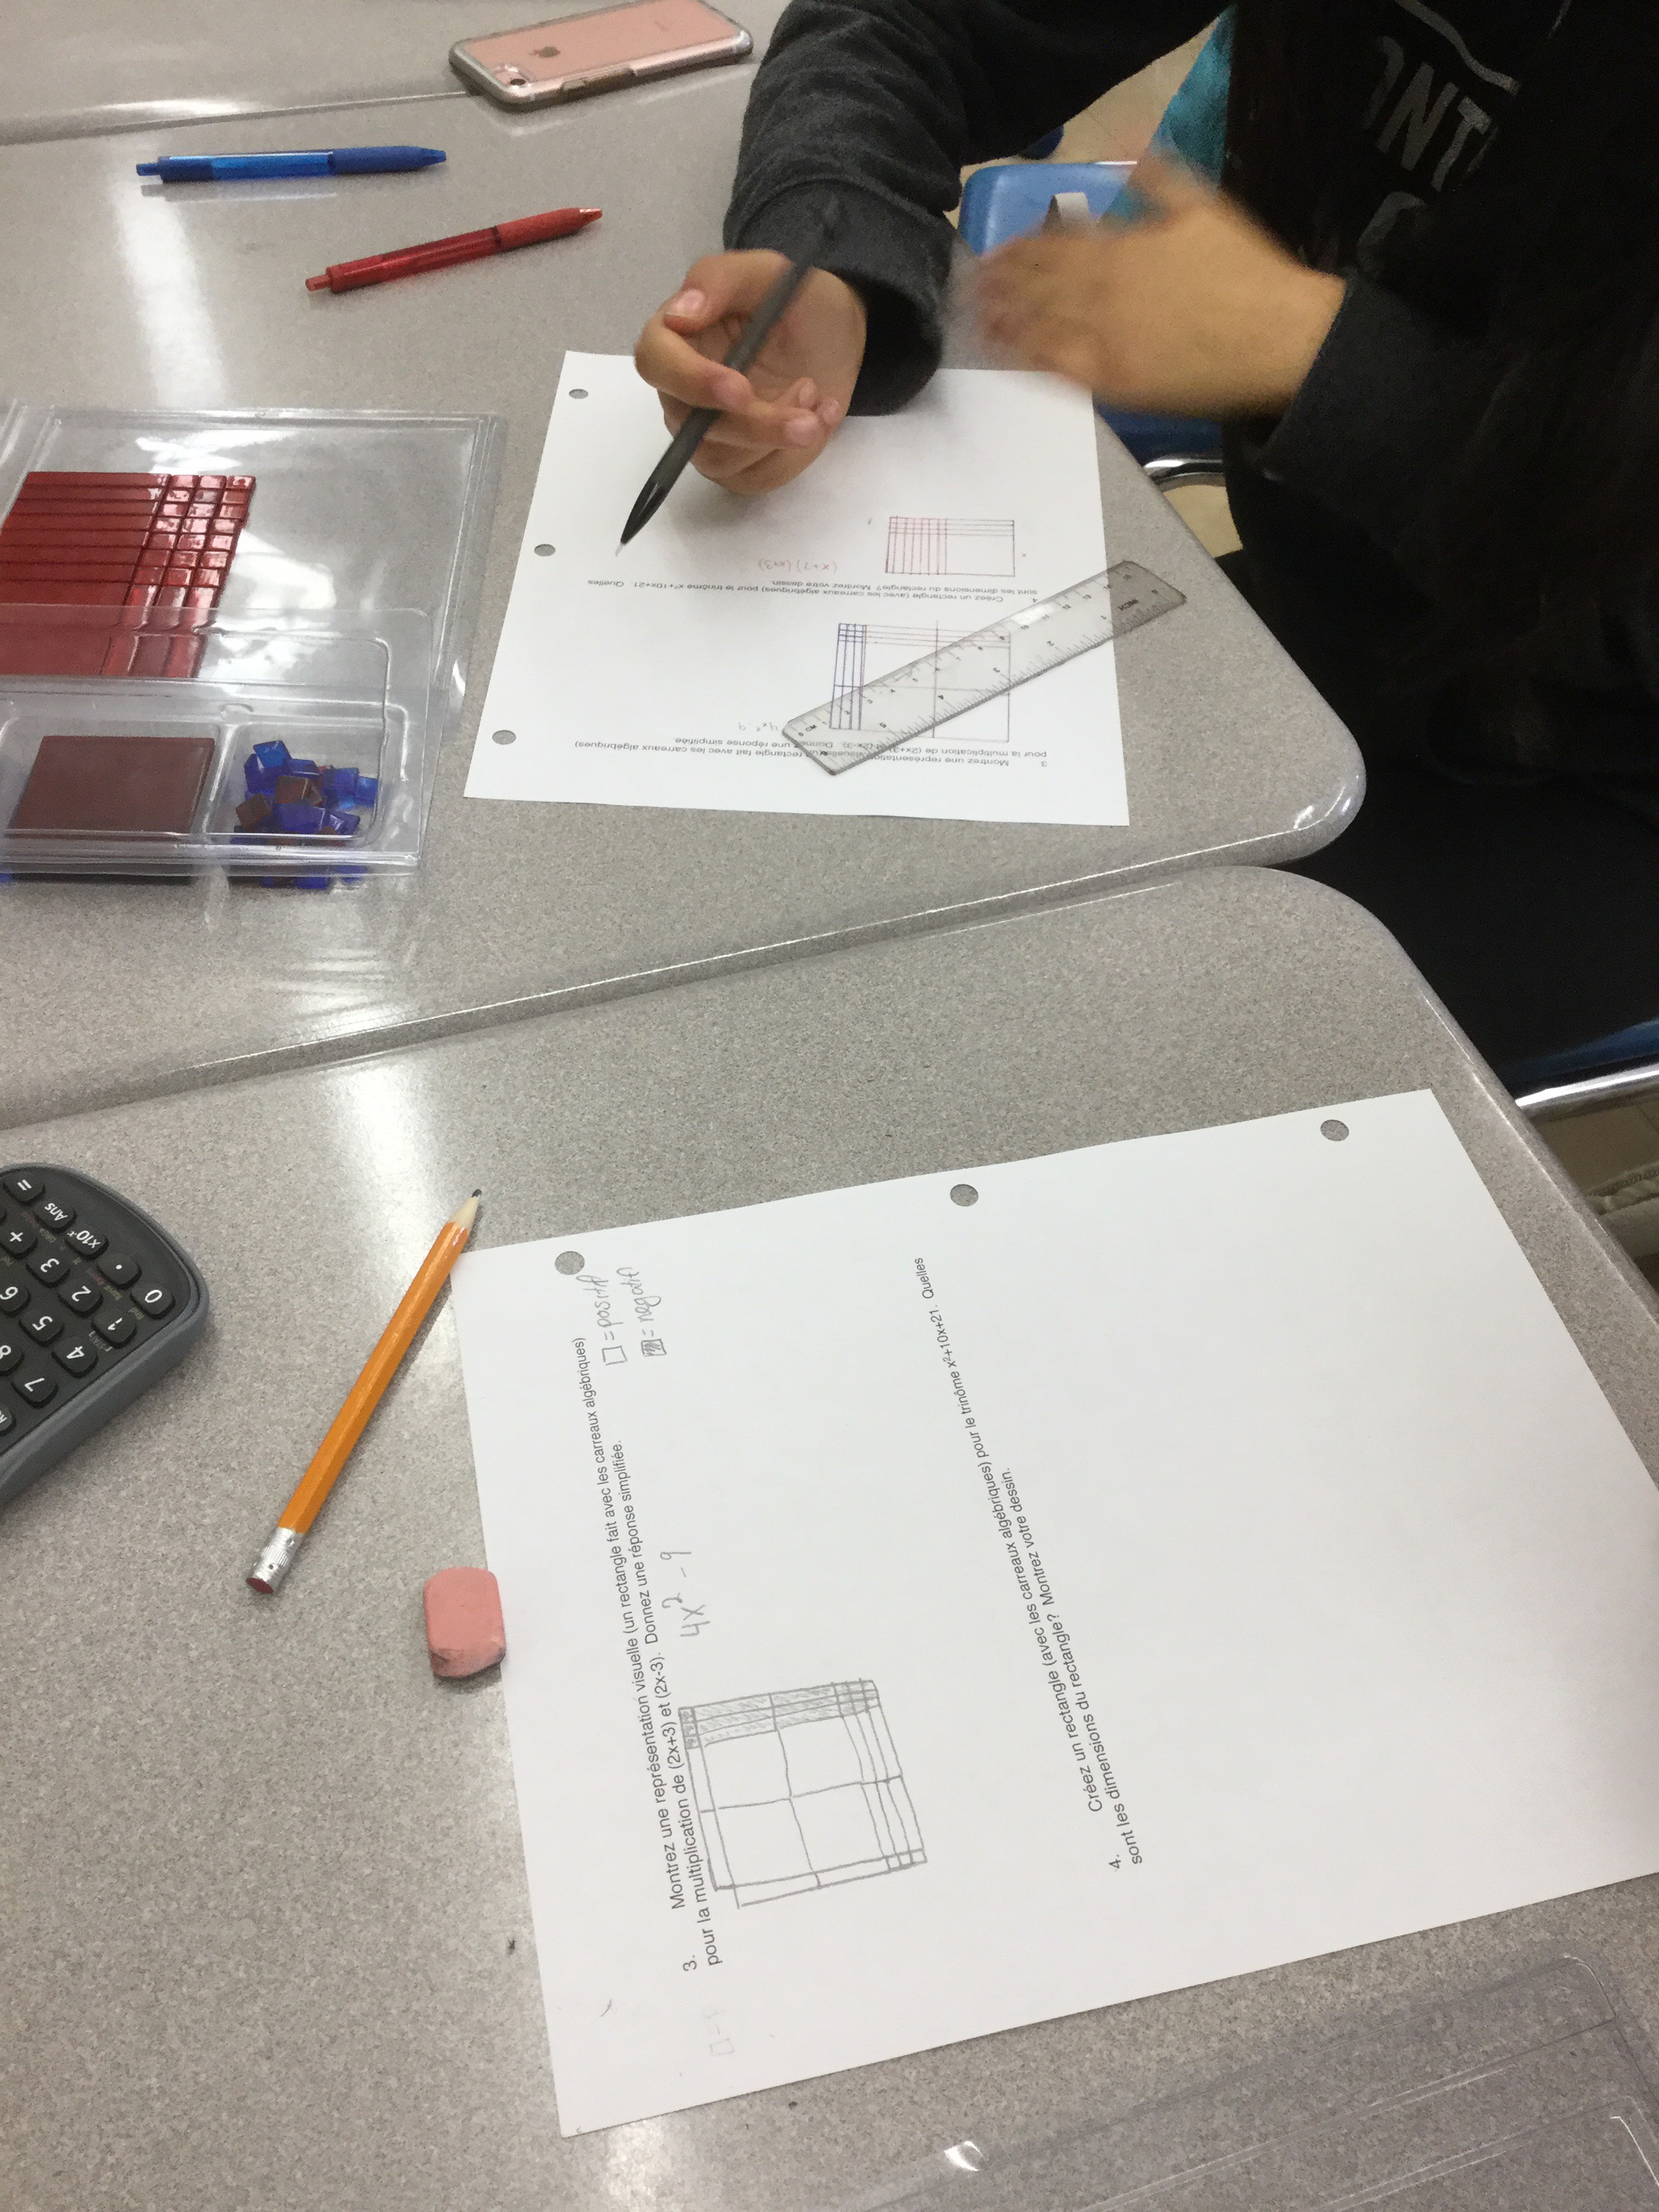
Some of the expressions we get are pretty neat. This one will simplify to 4x^2-9.
The next representation we’re connecting is the graphical. We looked at some equations in desmos today to notice some things about them. X and y intercepts were some good hangs to consider.

Circle Graphs
We braved the cooler weather today to go collect primary data outside.
Some of us observed clothing colours, hats/no hats, types of headphones, methods of transportation, shoe type, drivers distracted or not at the stoplight, or if they were wearing a poppy or not.
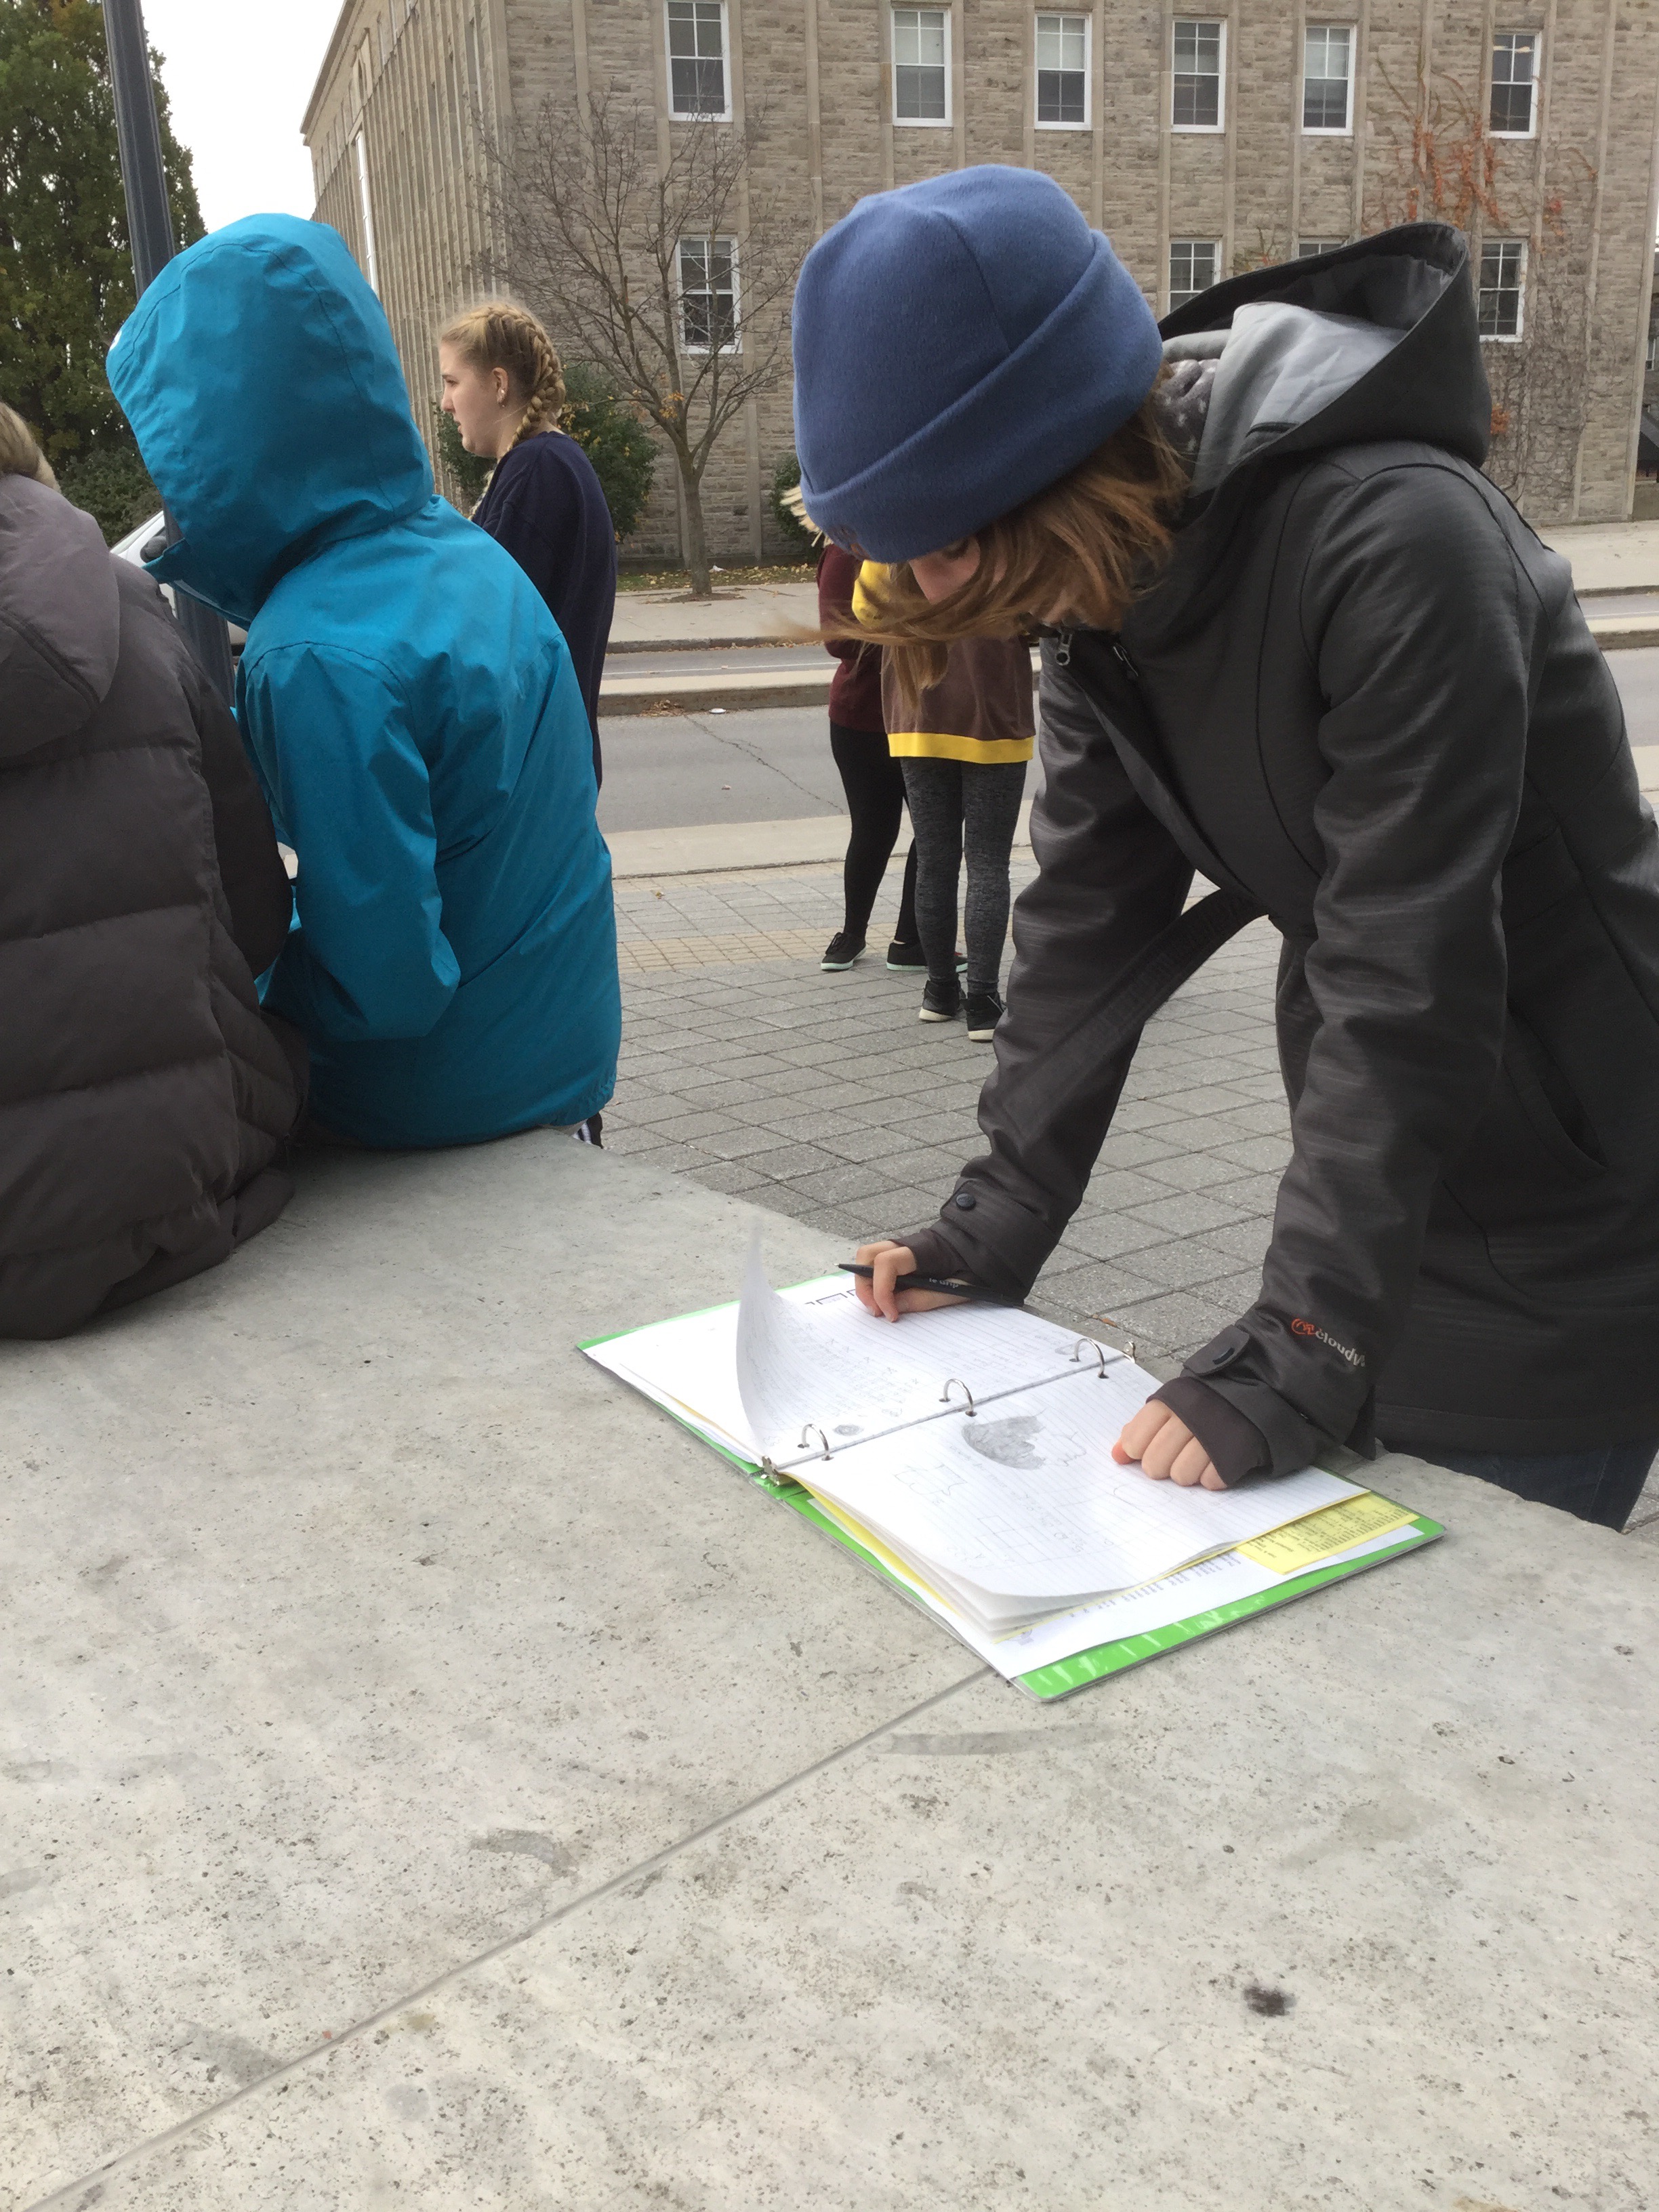
We made tallies on paper and on phones
We stayed out for almost 15 minutes then went to get some other tallying materials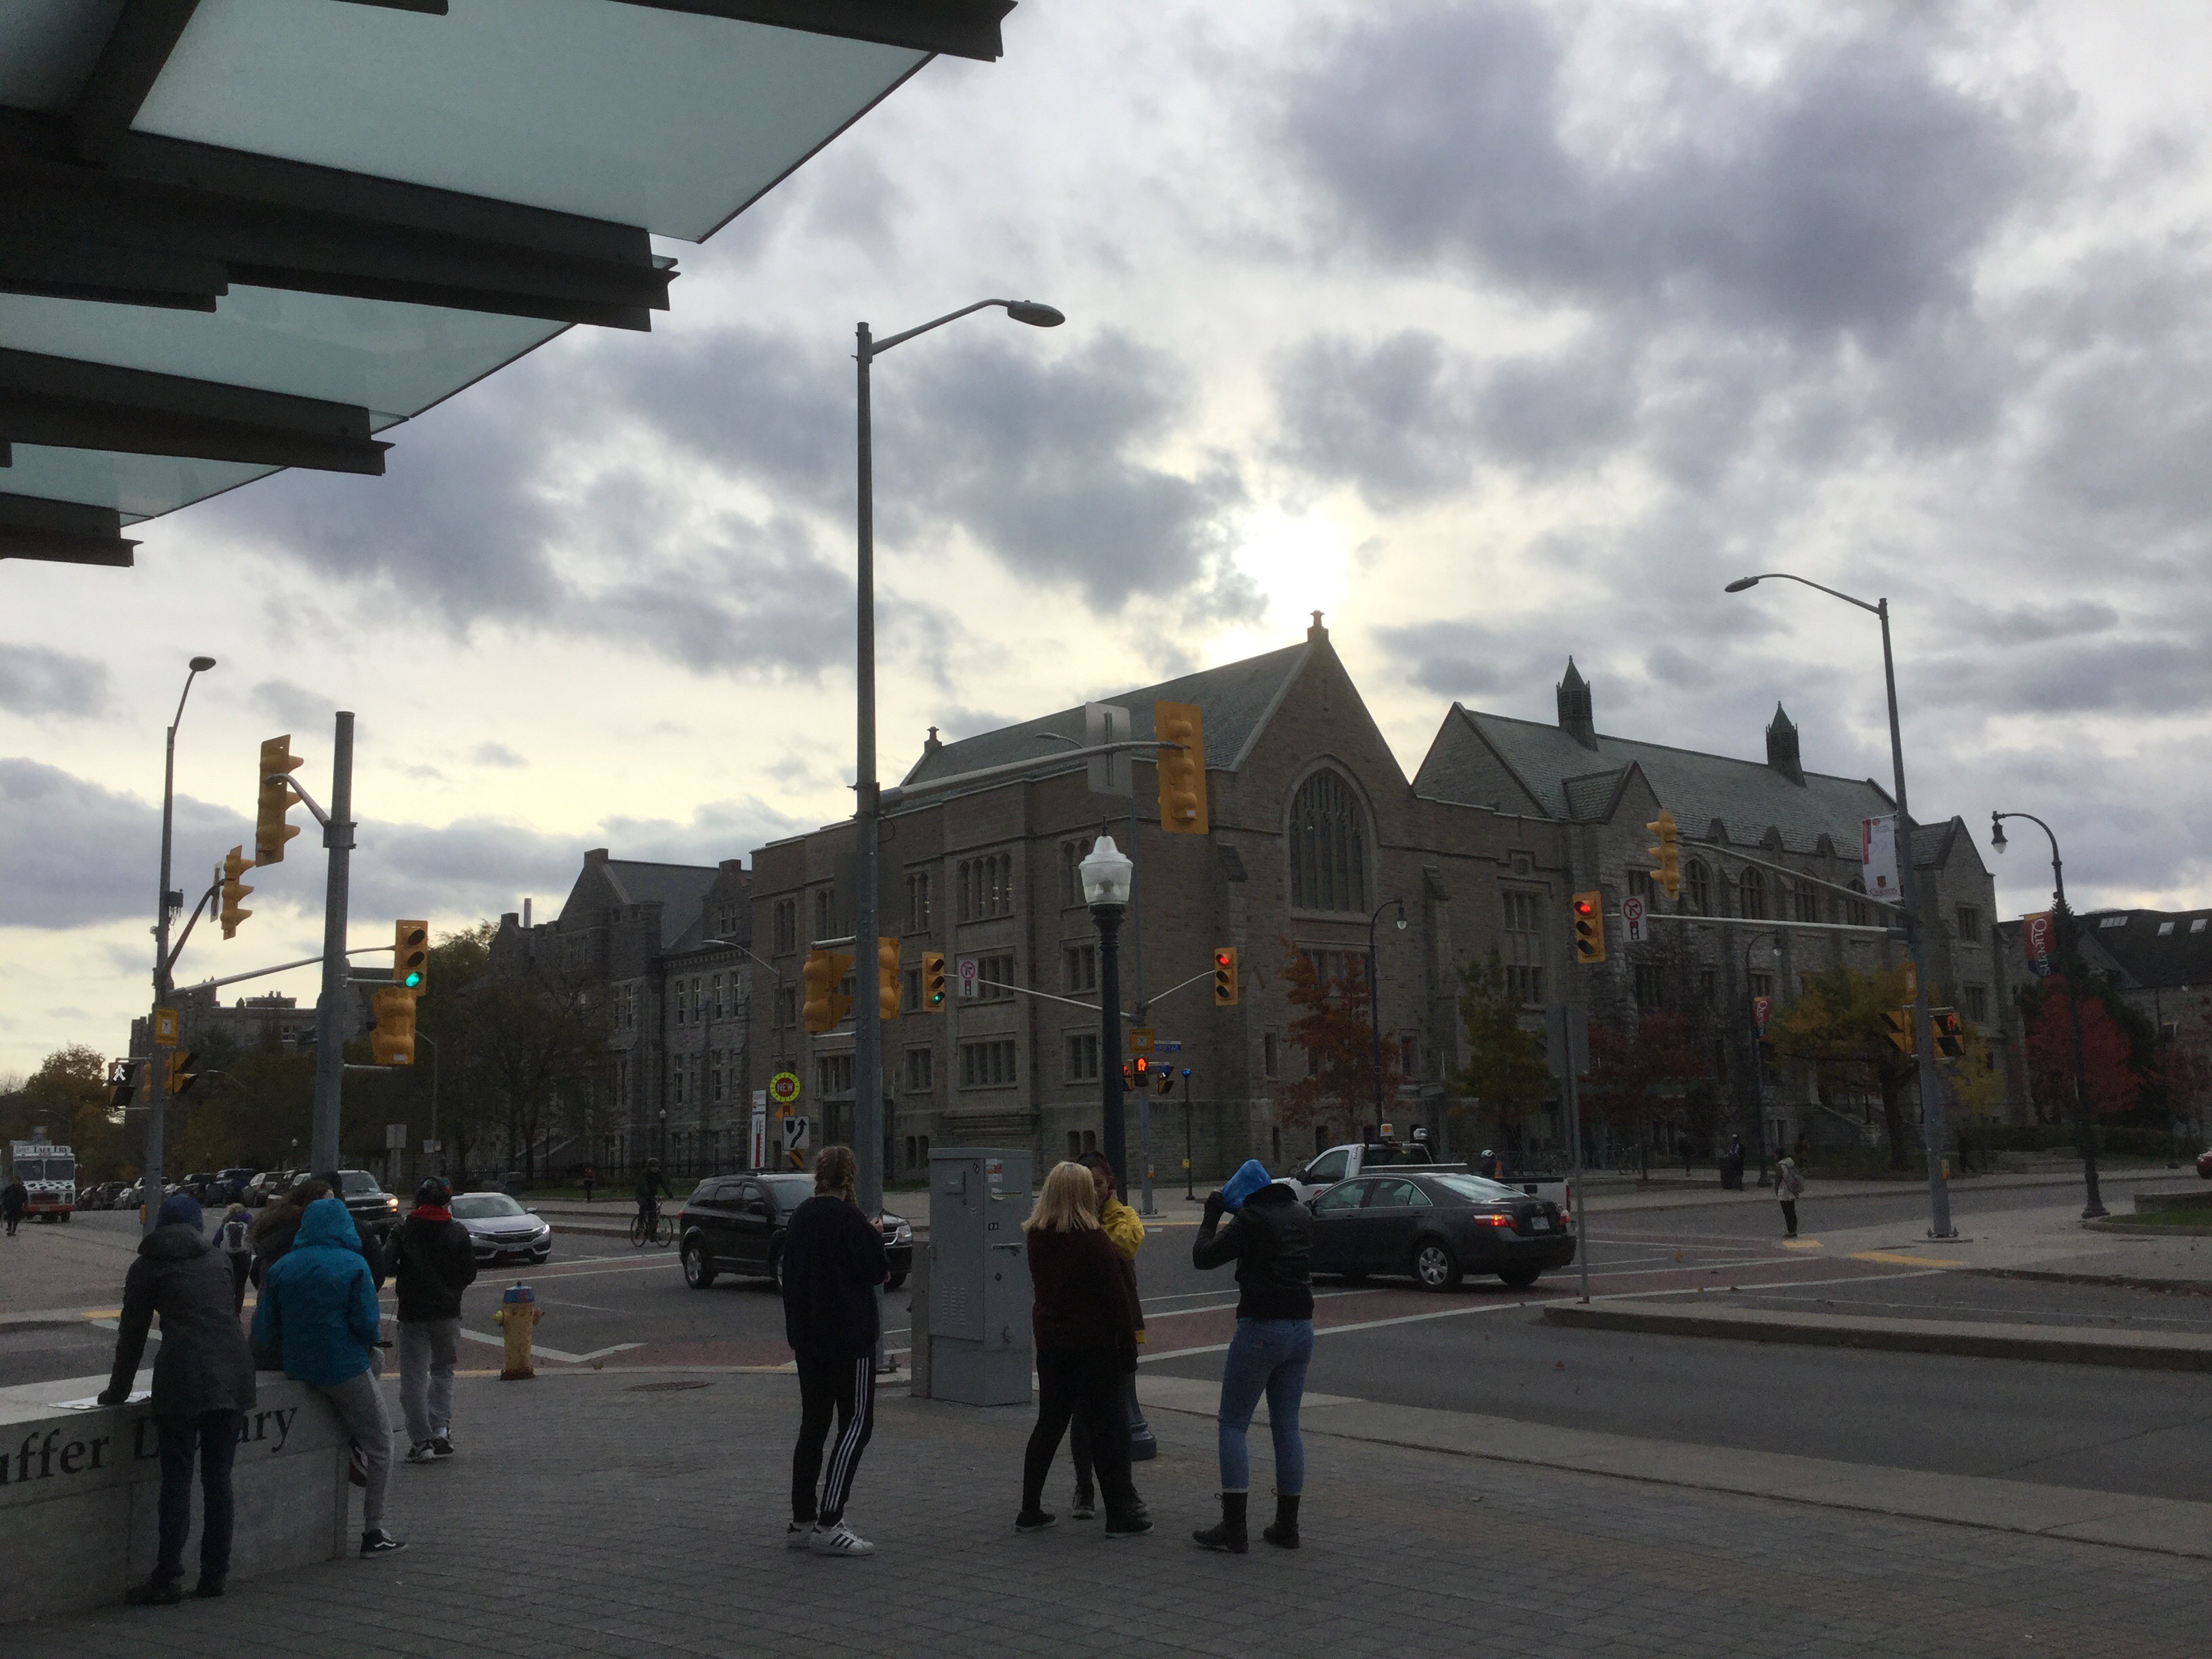
We got a box of 50 timbits (but there were only 48 in the box), and we separated them by type, and made a circle graph from that data.


Test day inspiration
 We are ready! We have the proof!

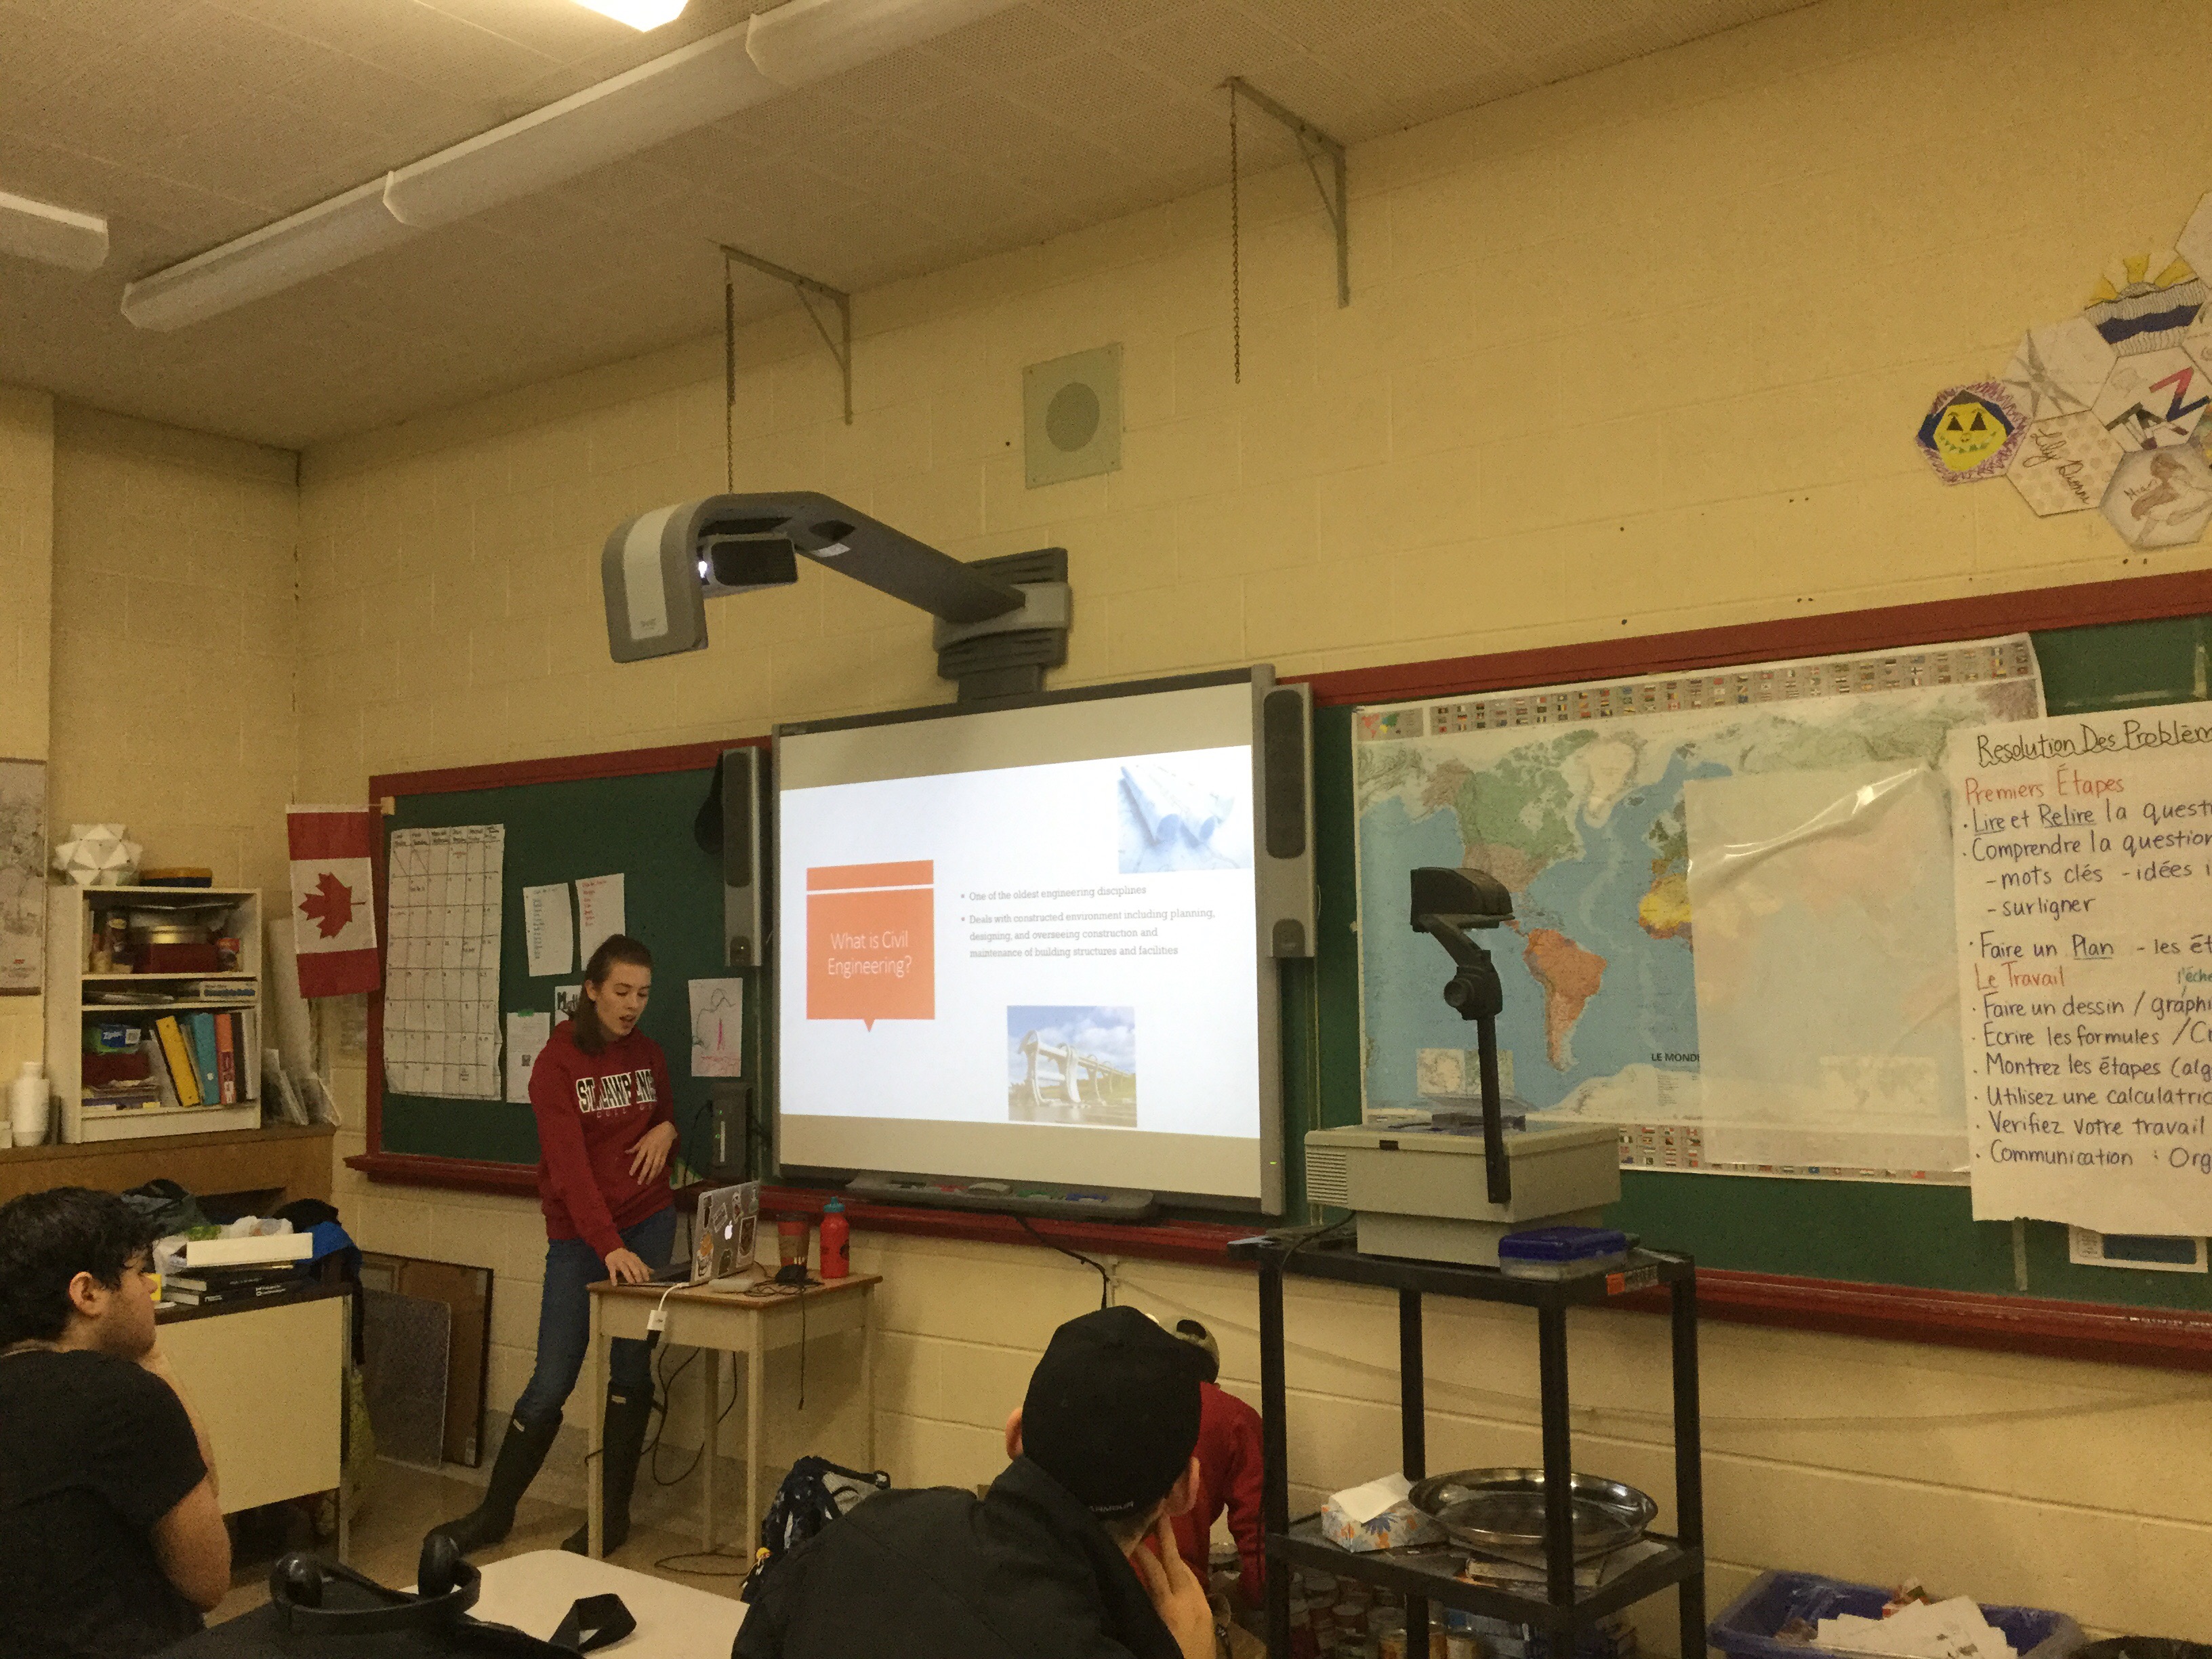
Guest speaker:civil engineering technology
We had a guest speaker today who told us all about civil engineering technology at St. Lawrence college. She was a KC grad, and is excited to share about her educational journey.
 She brought us a challenge: to make a popsicle stick bridge.
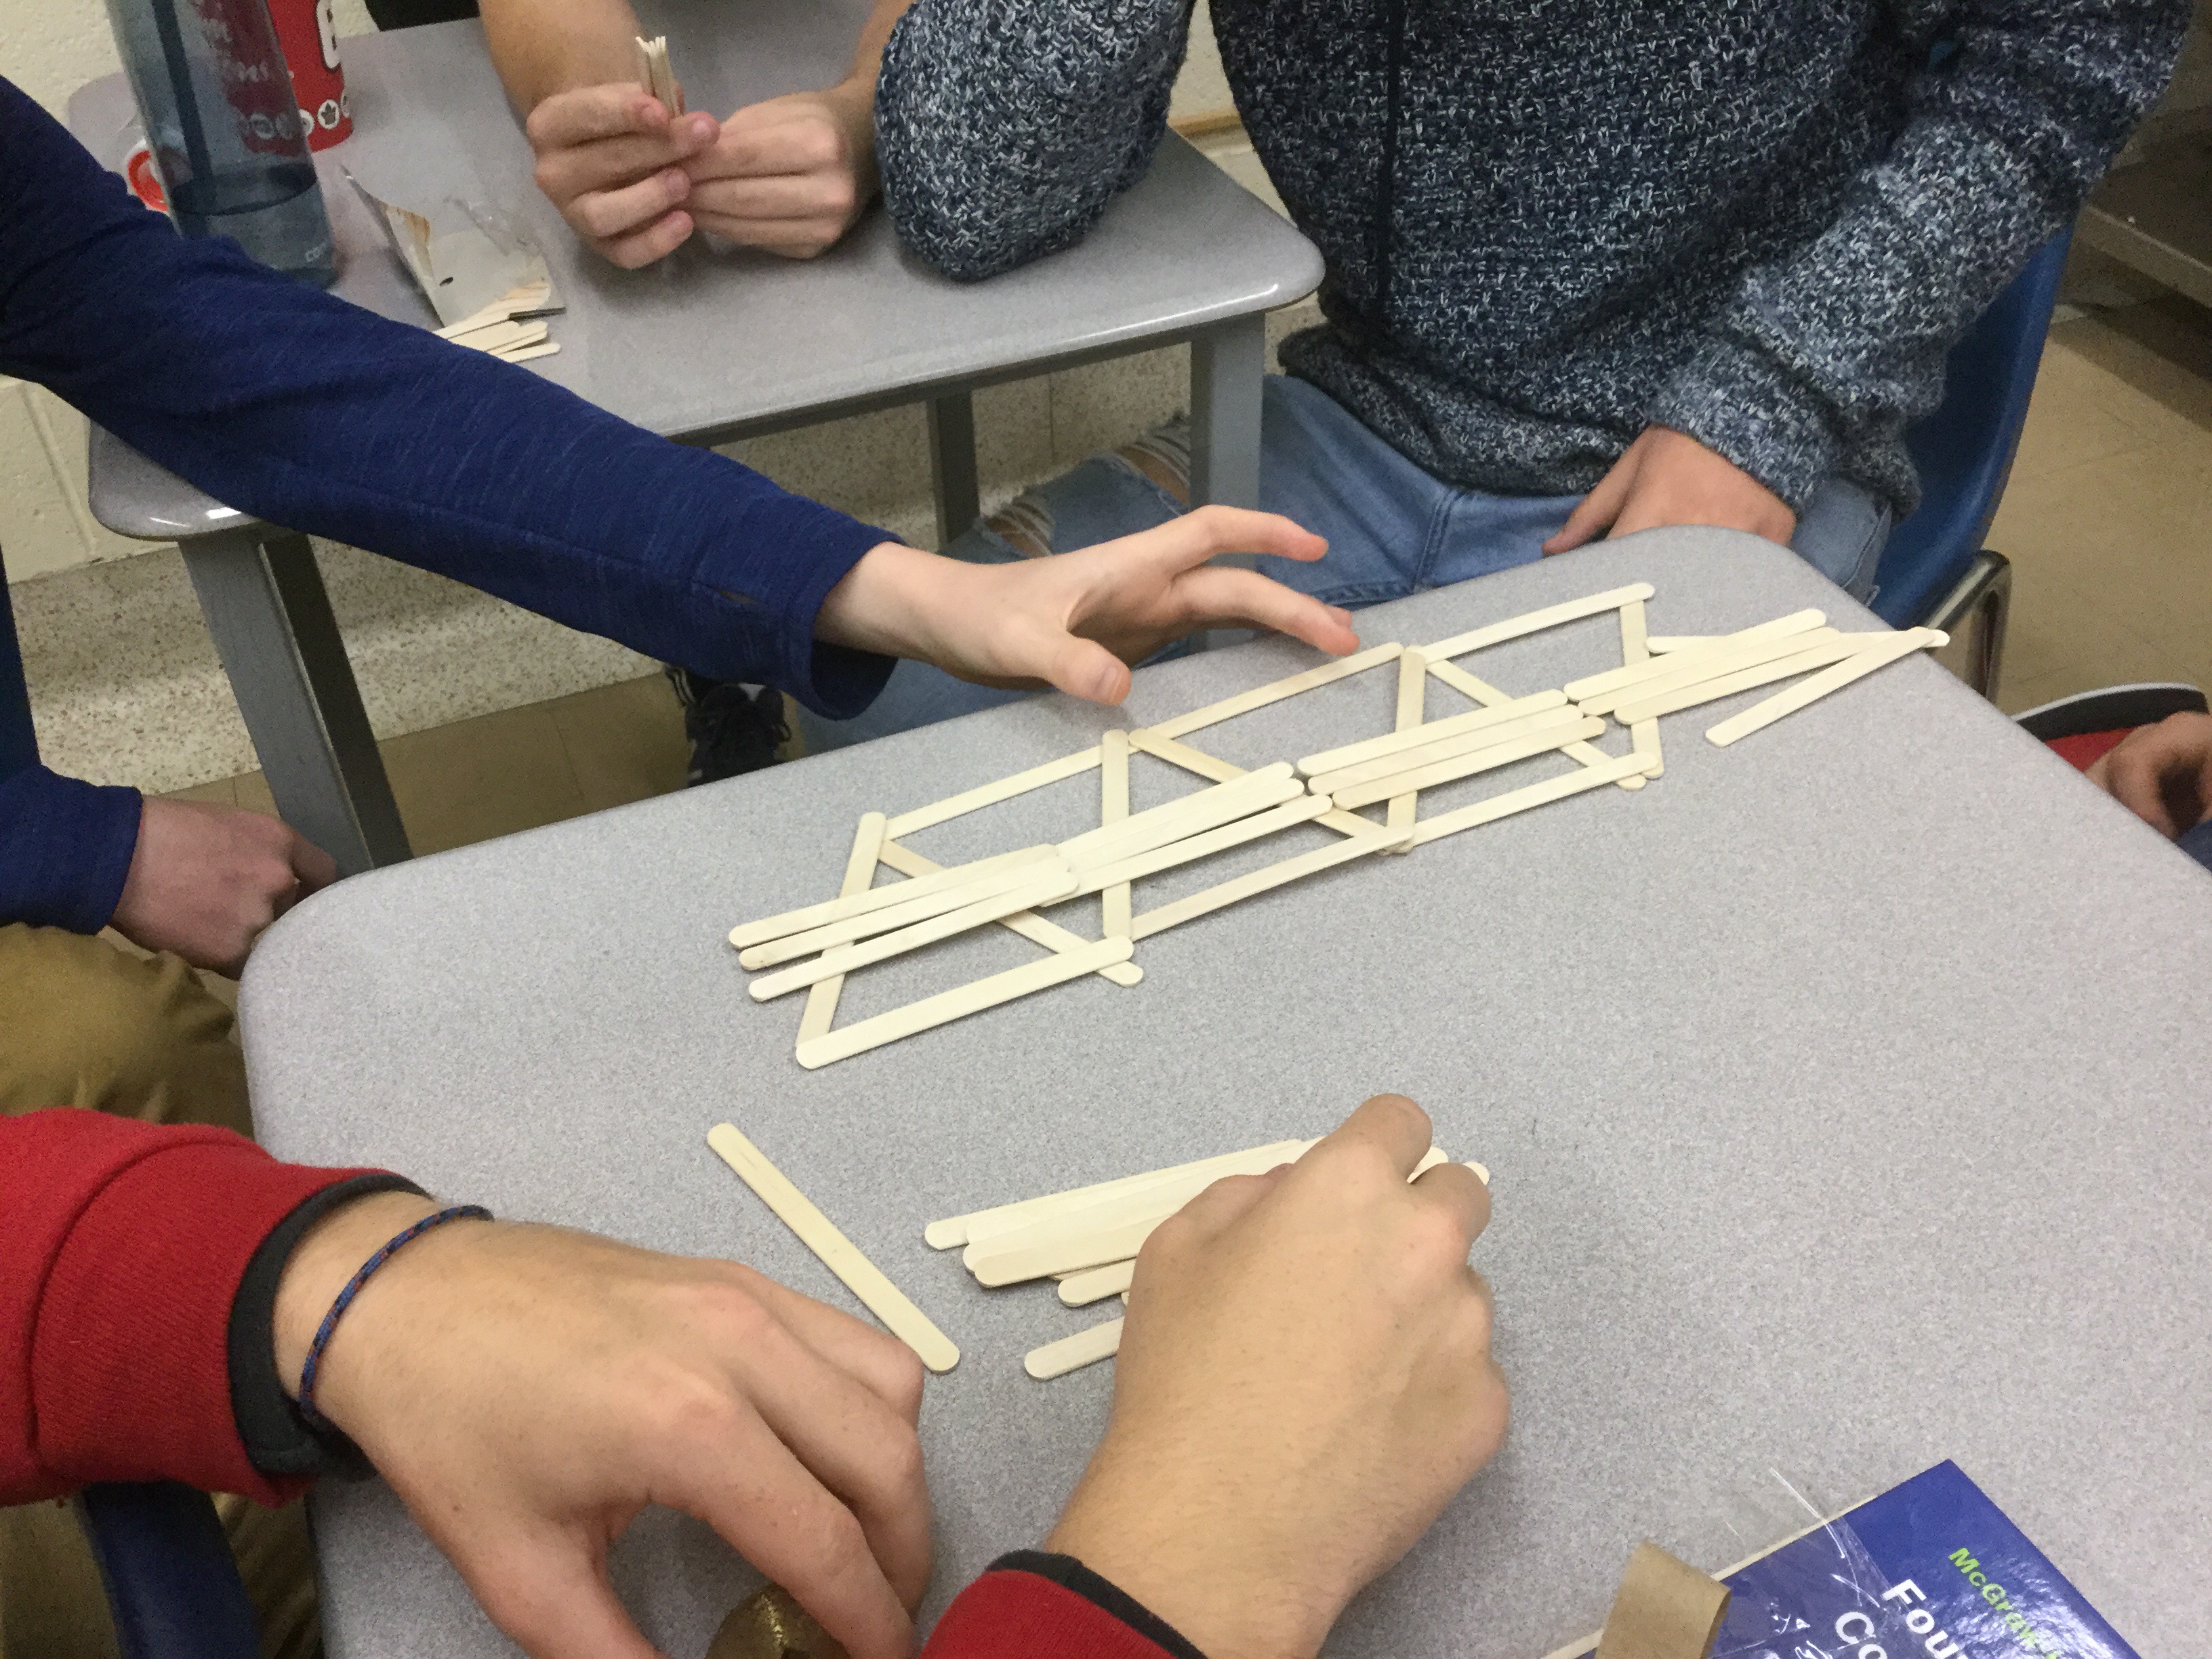
Here were many different approaches to the activity.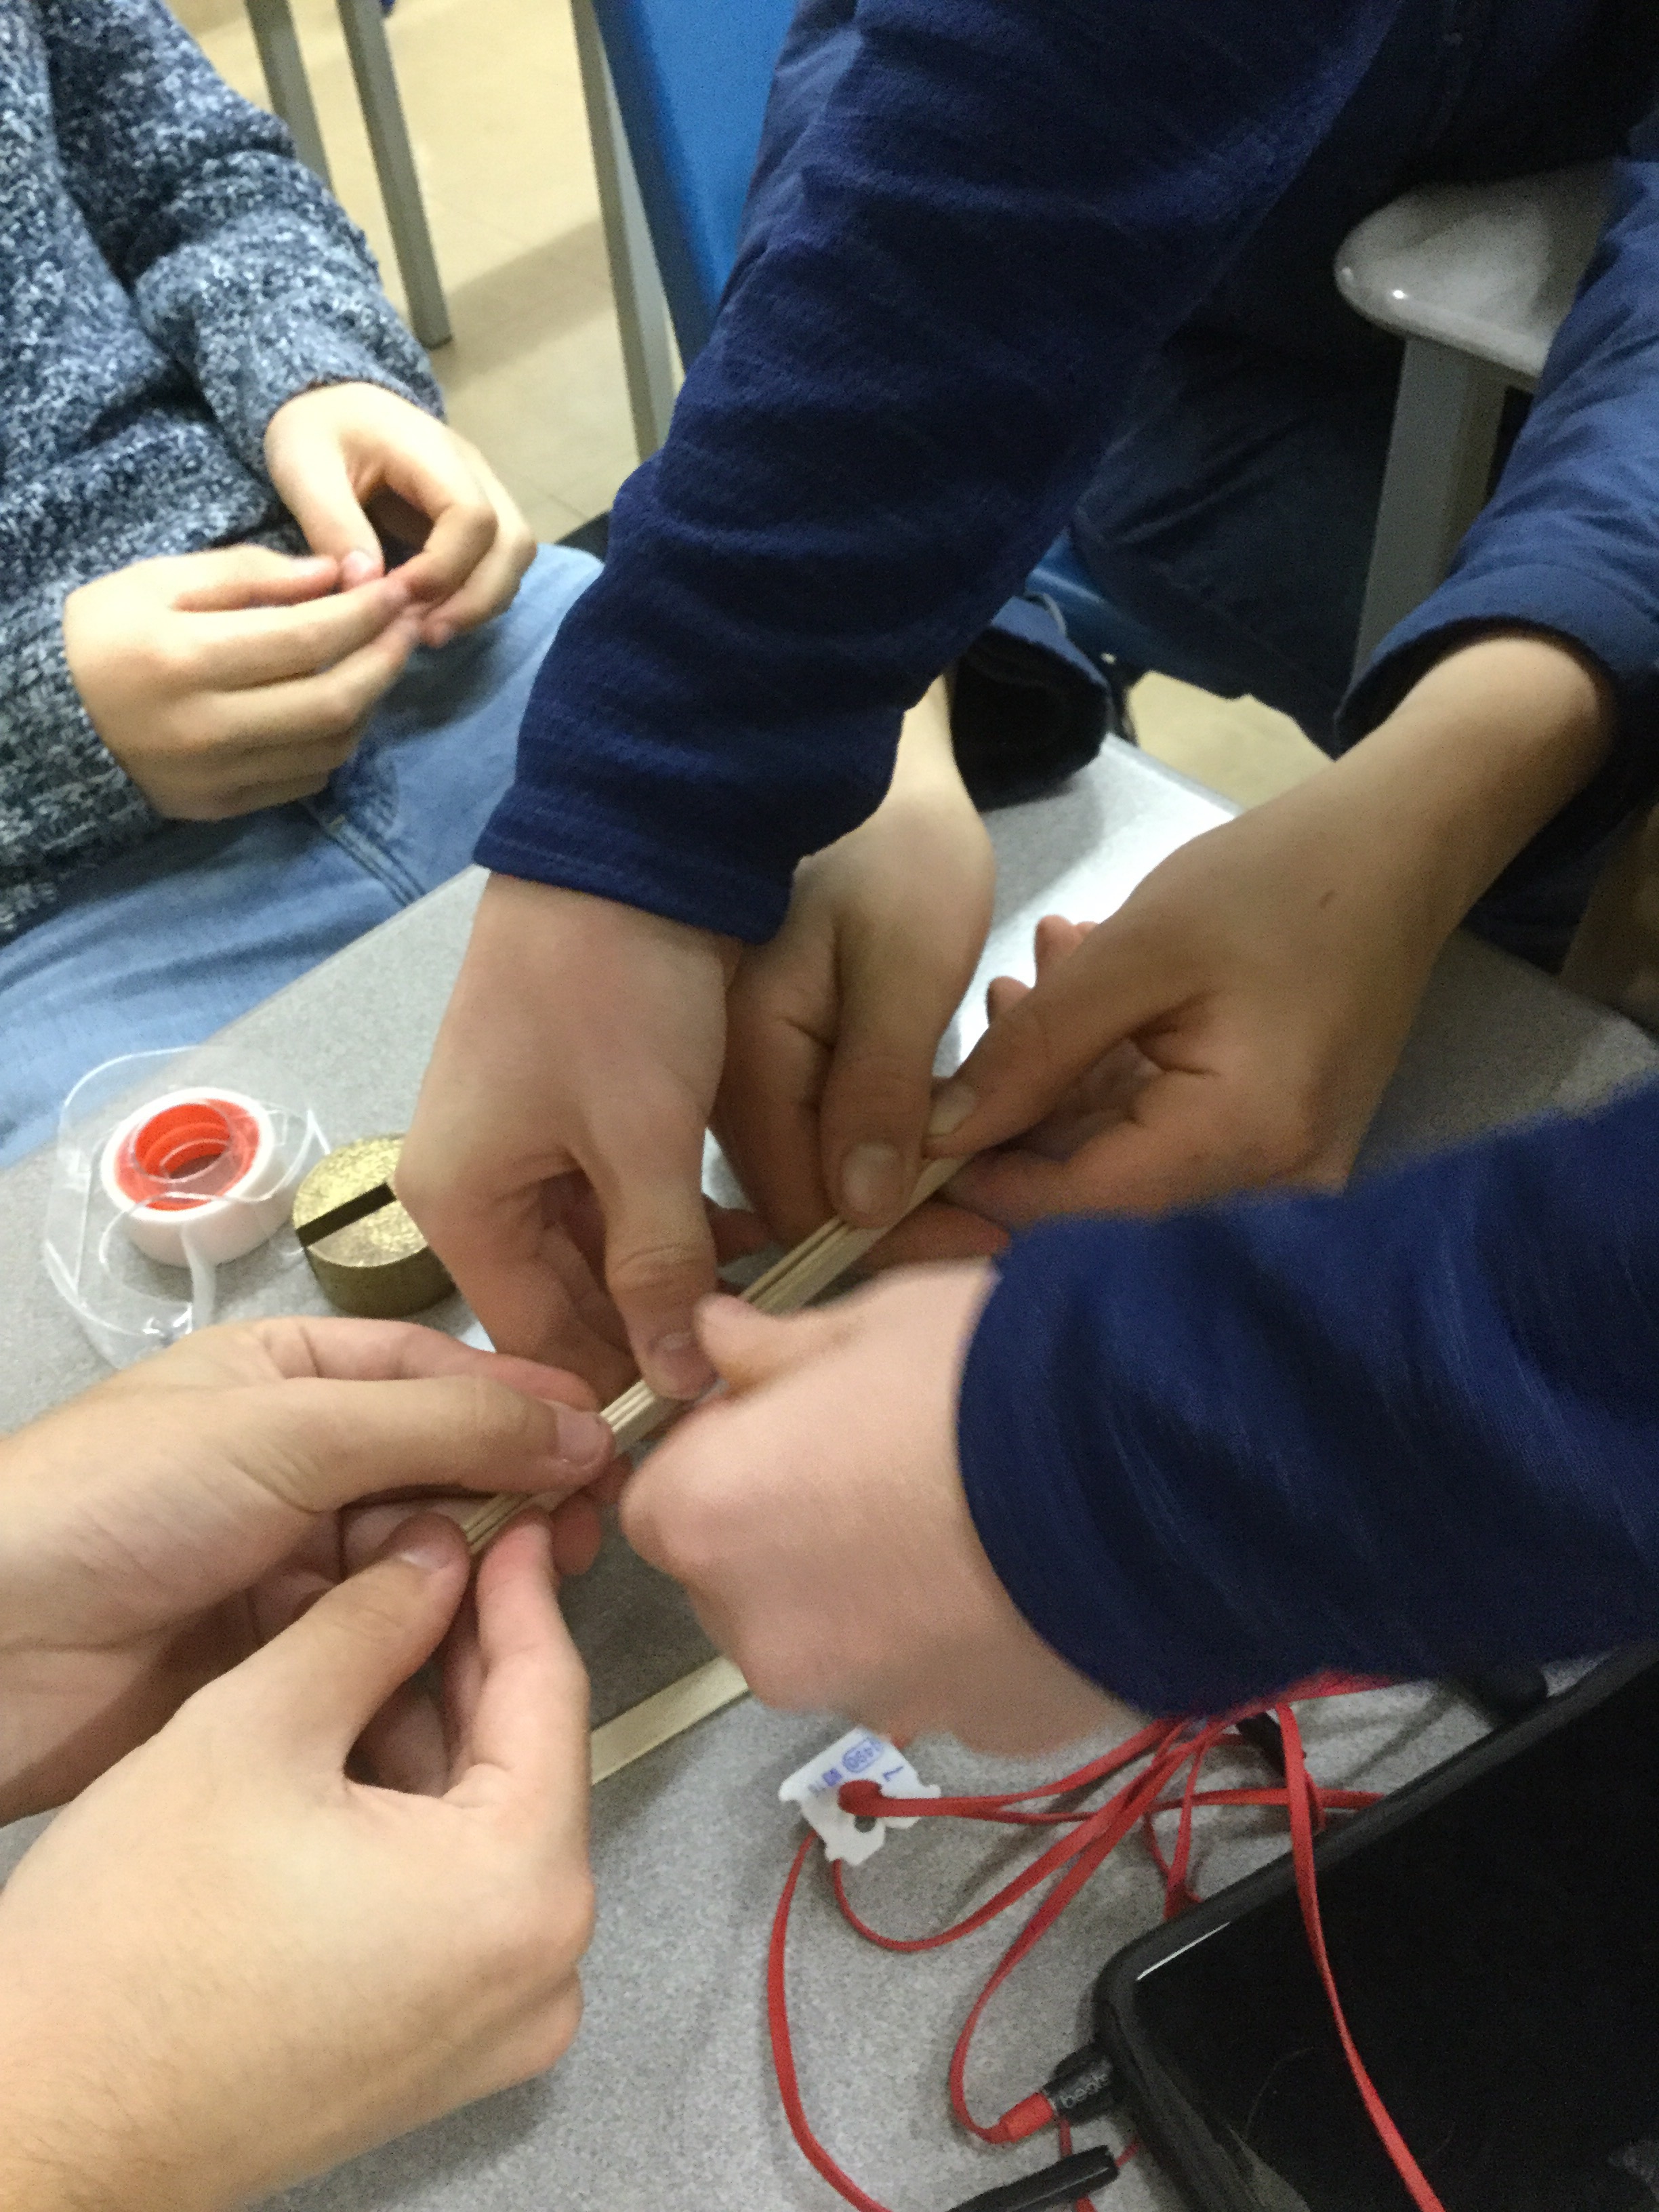
The bridge needed to span 1 foot and be free standing.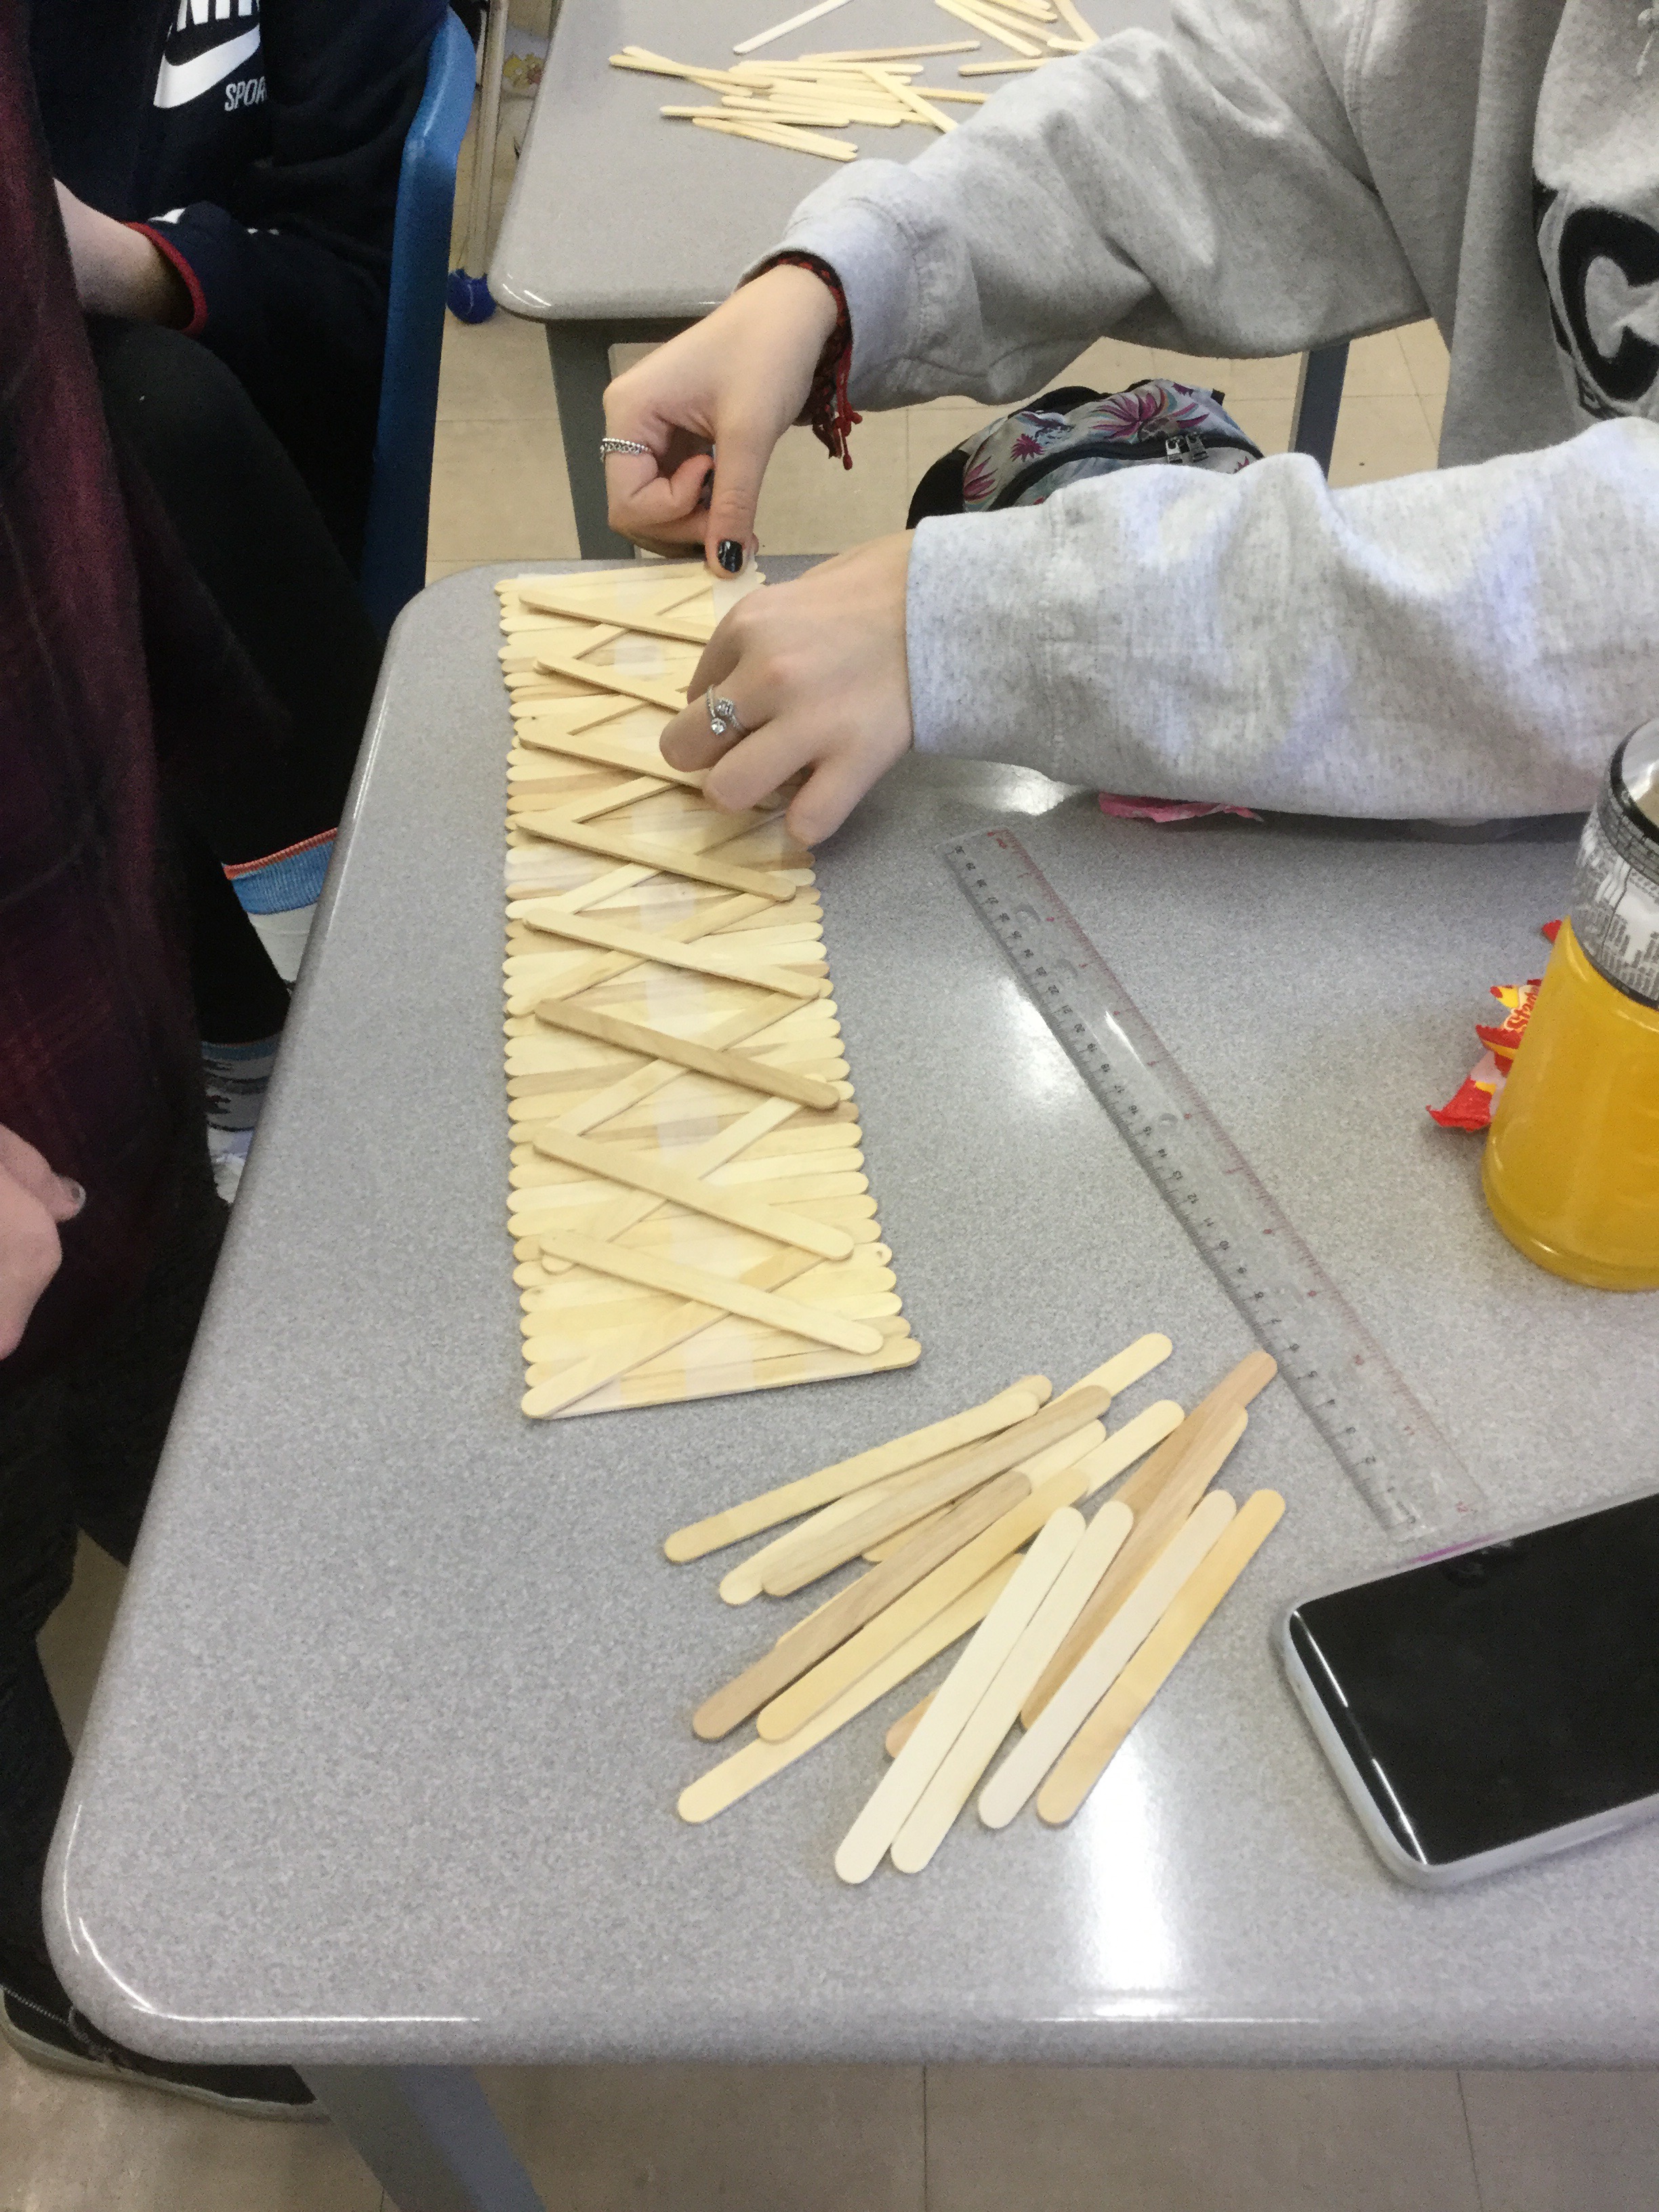
It was made of popsicle sticks and tape only.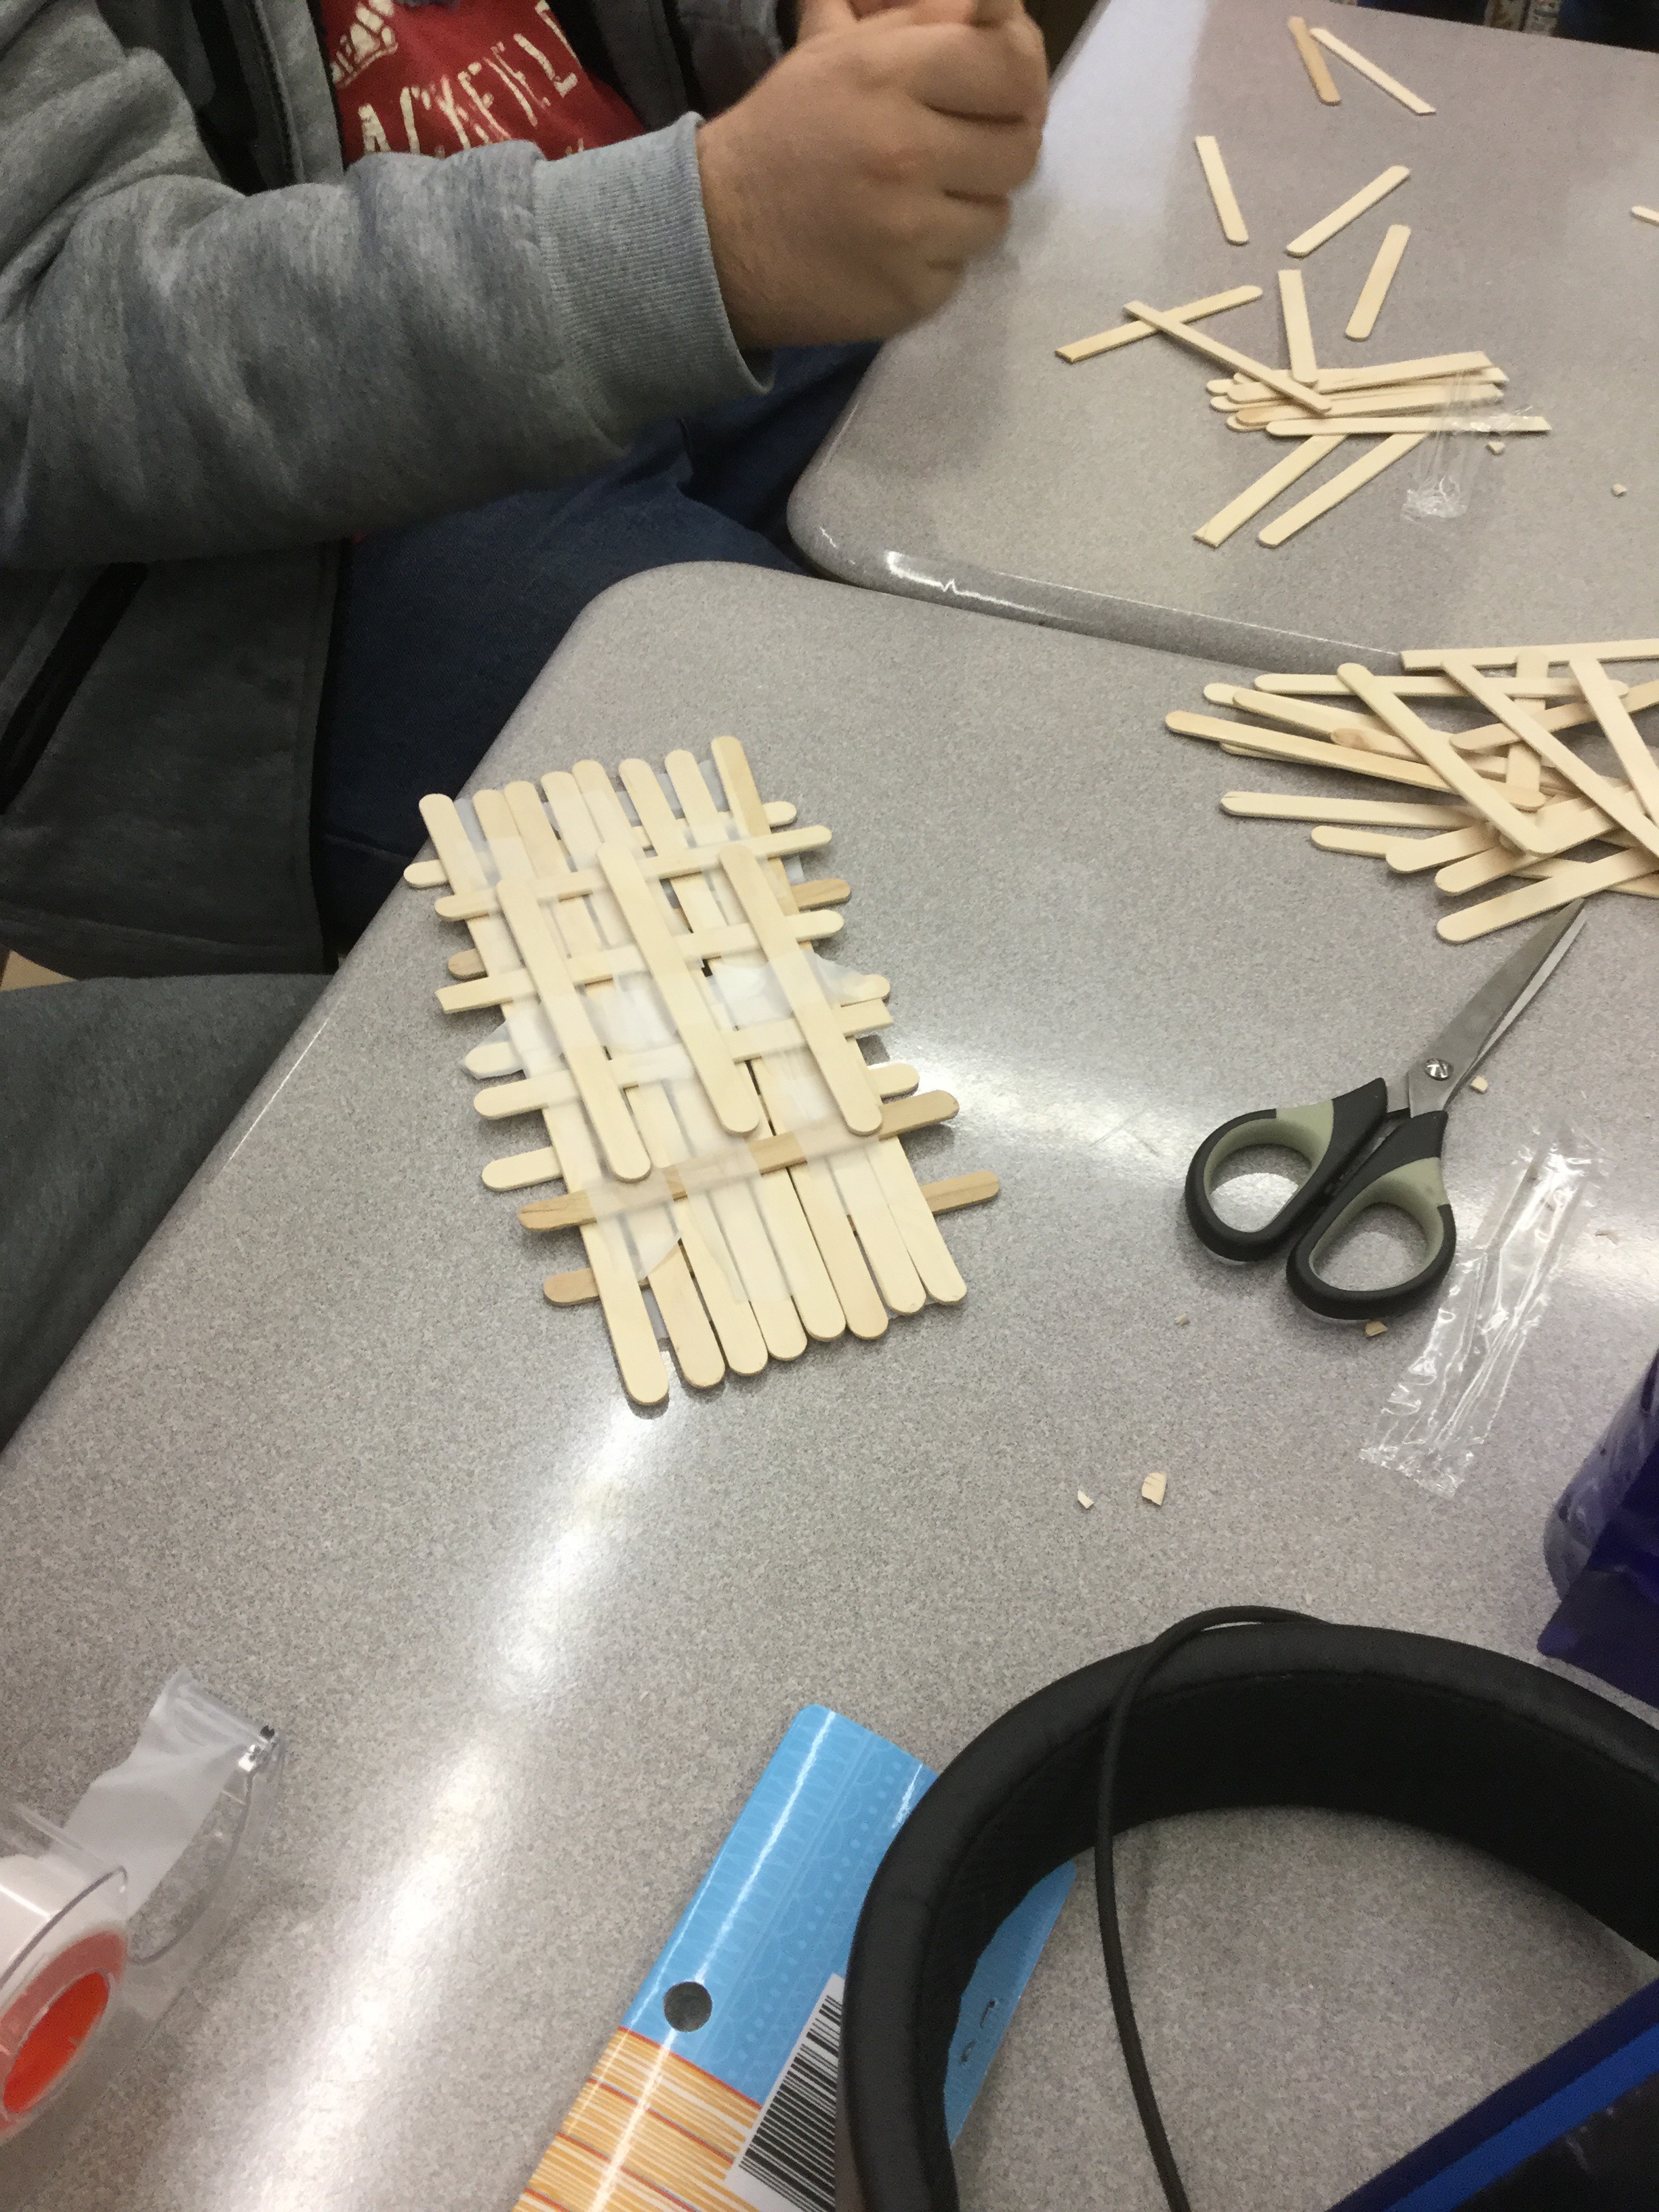
This bridge did very well, but was not long enough to actually span the gap.
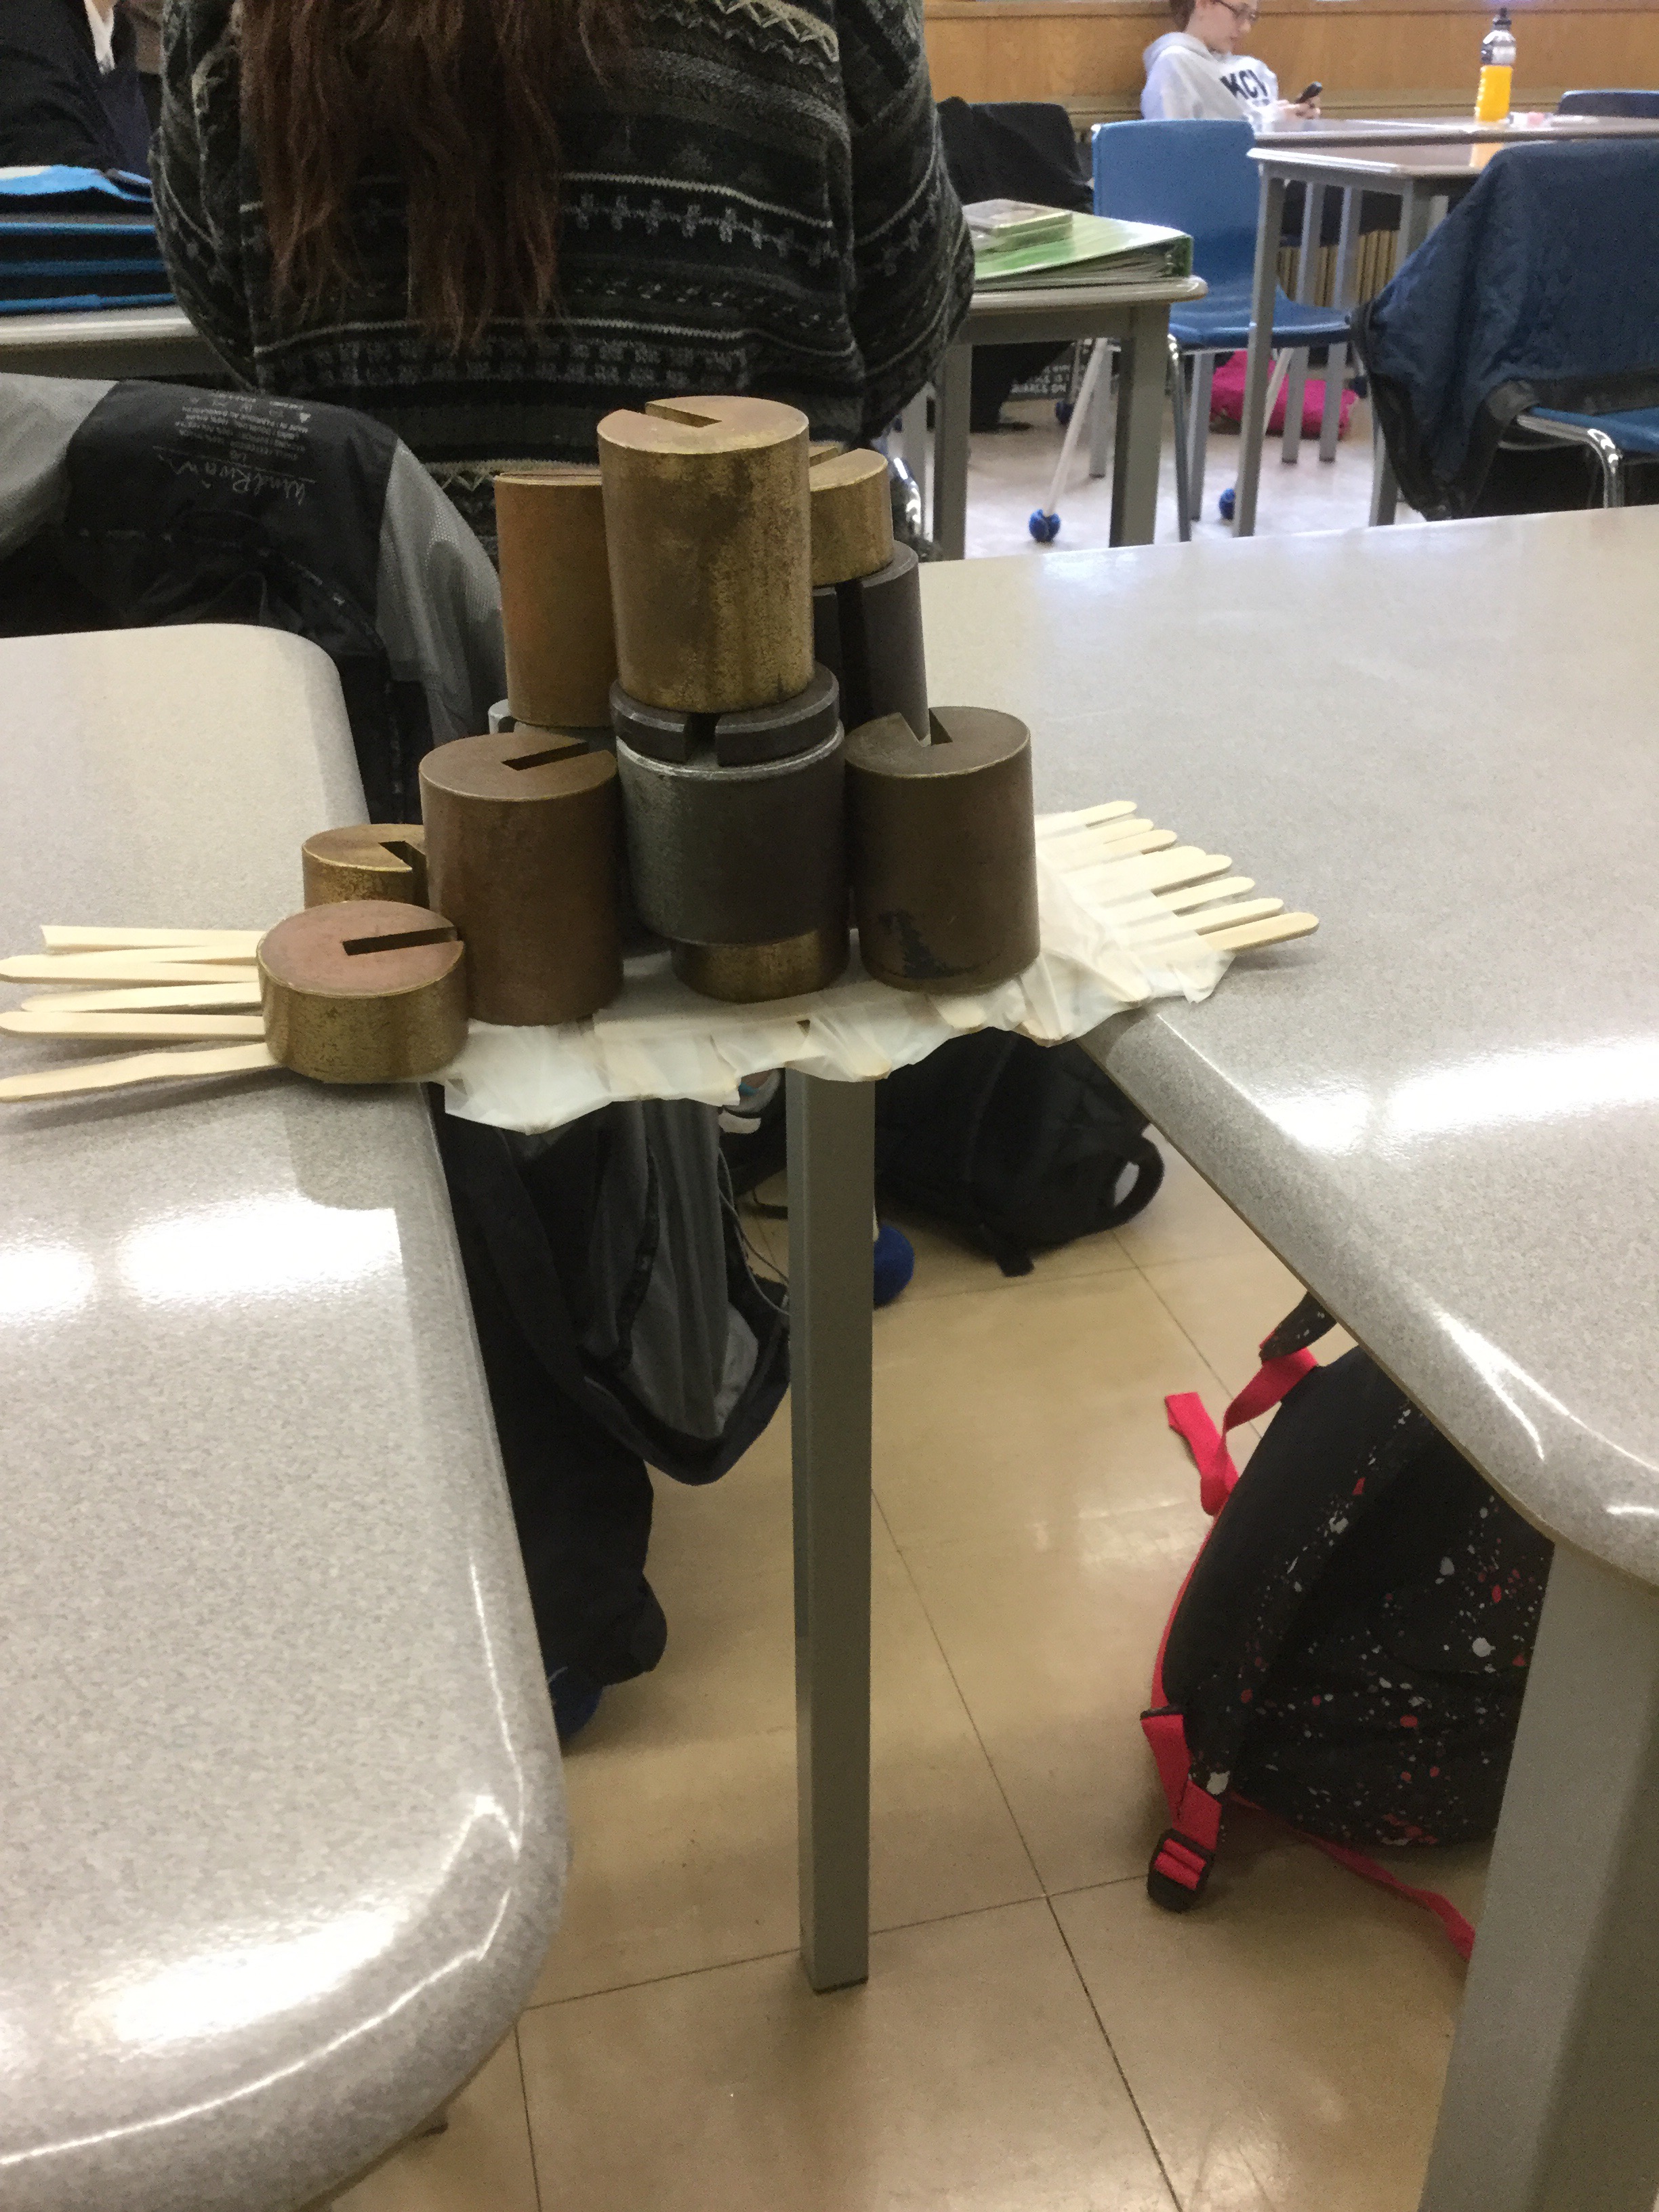
It was a good challenge to accomplish a goal as a group with limited time and limited materials.
Algebra tiles
Today we are looking at representing this kind of expression with algebra tiles.
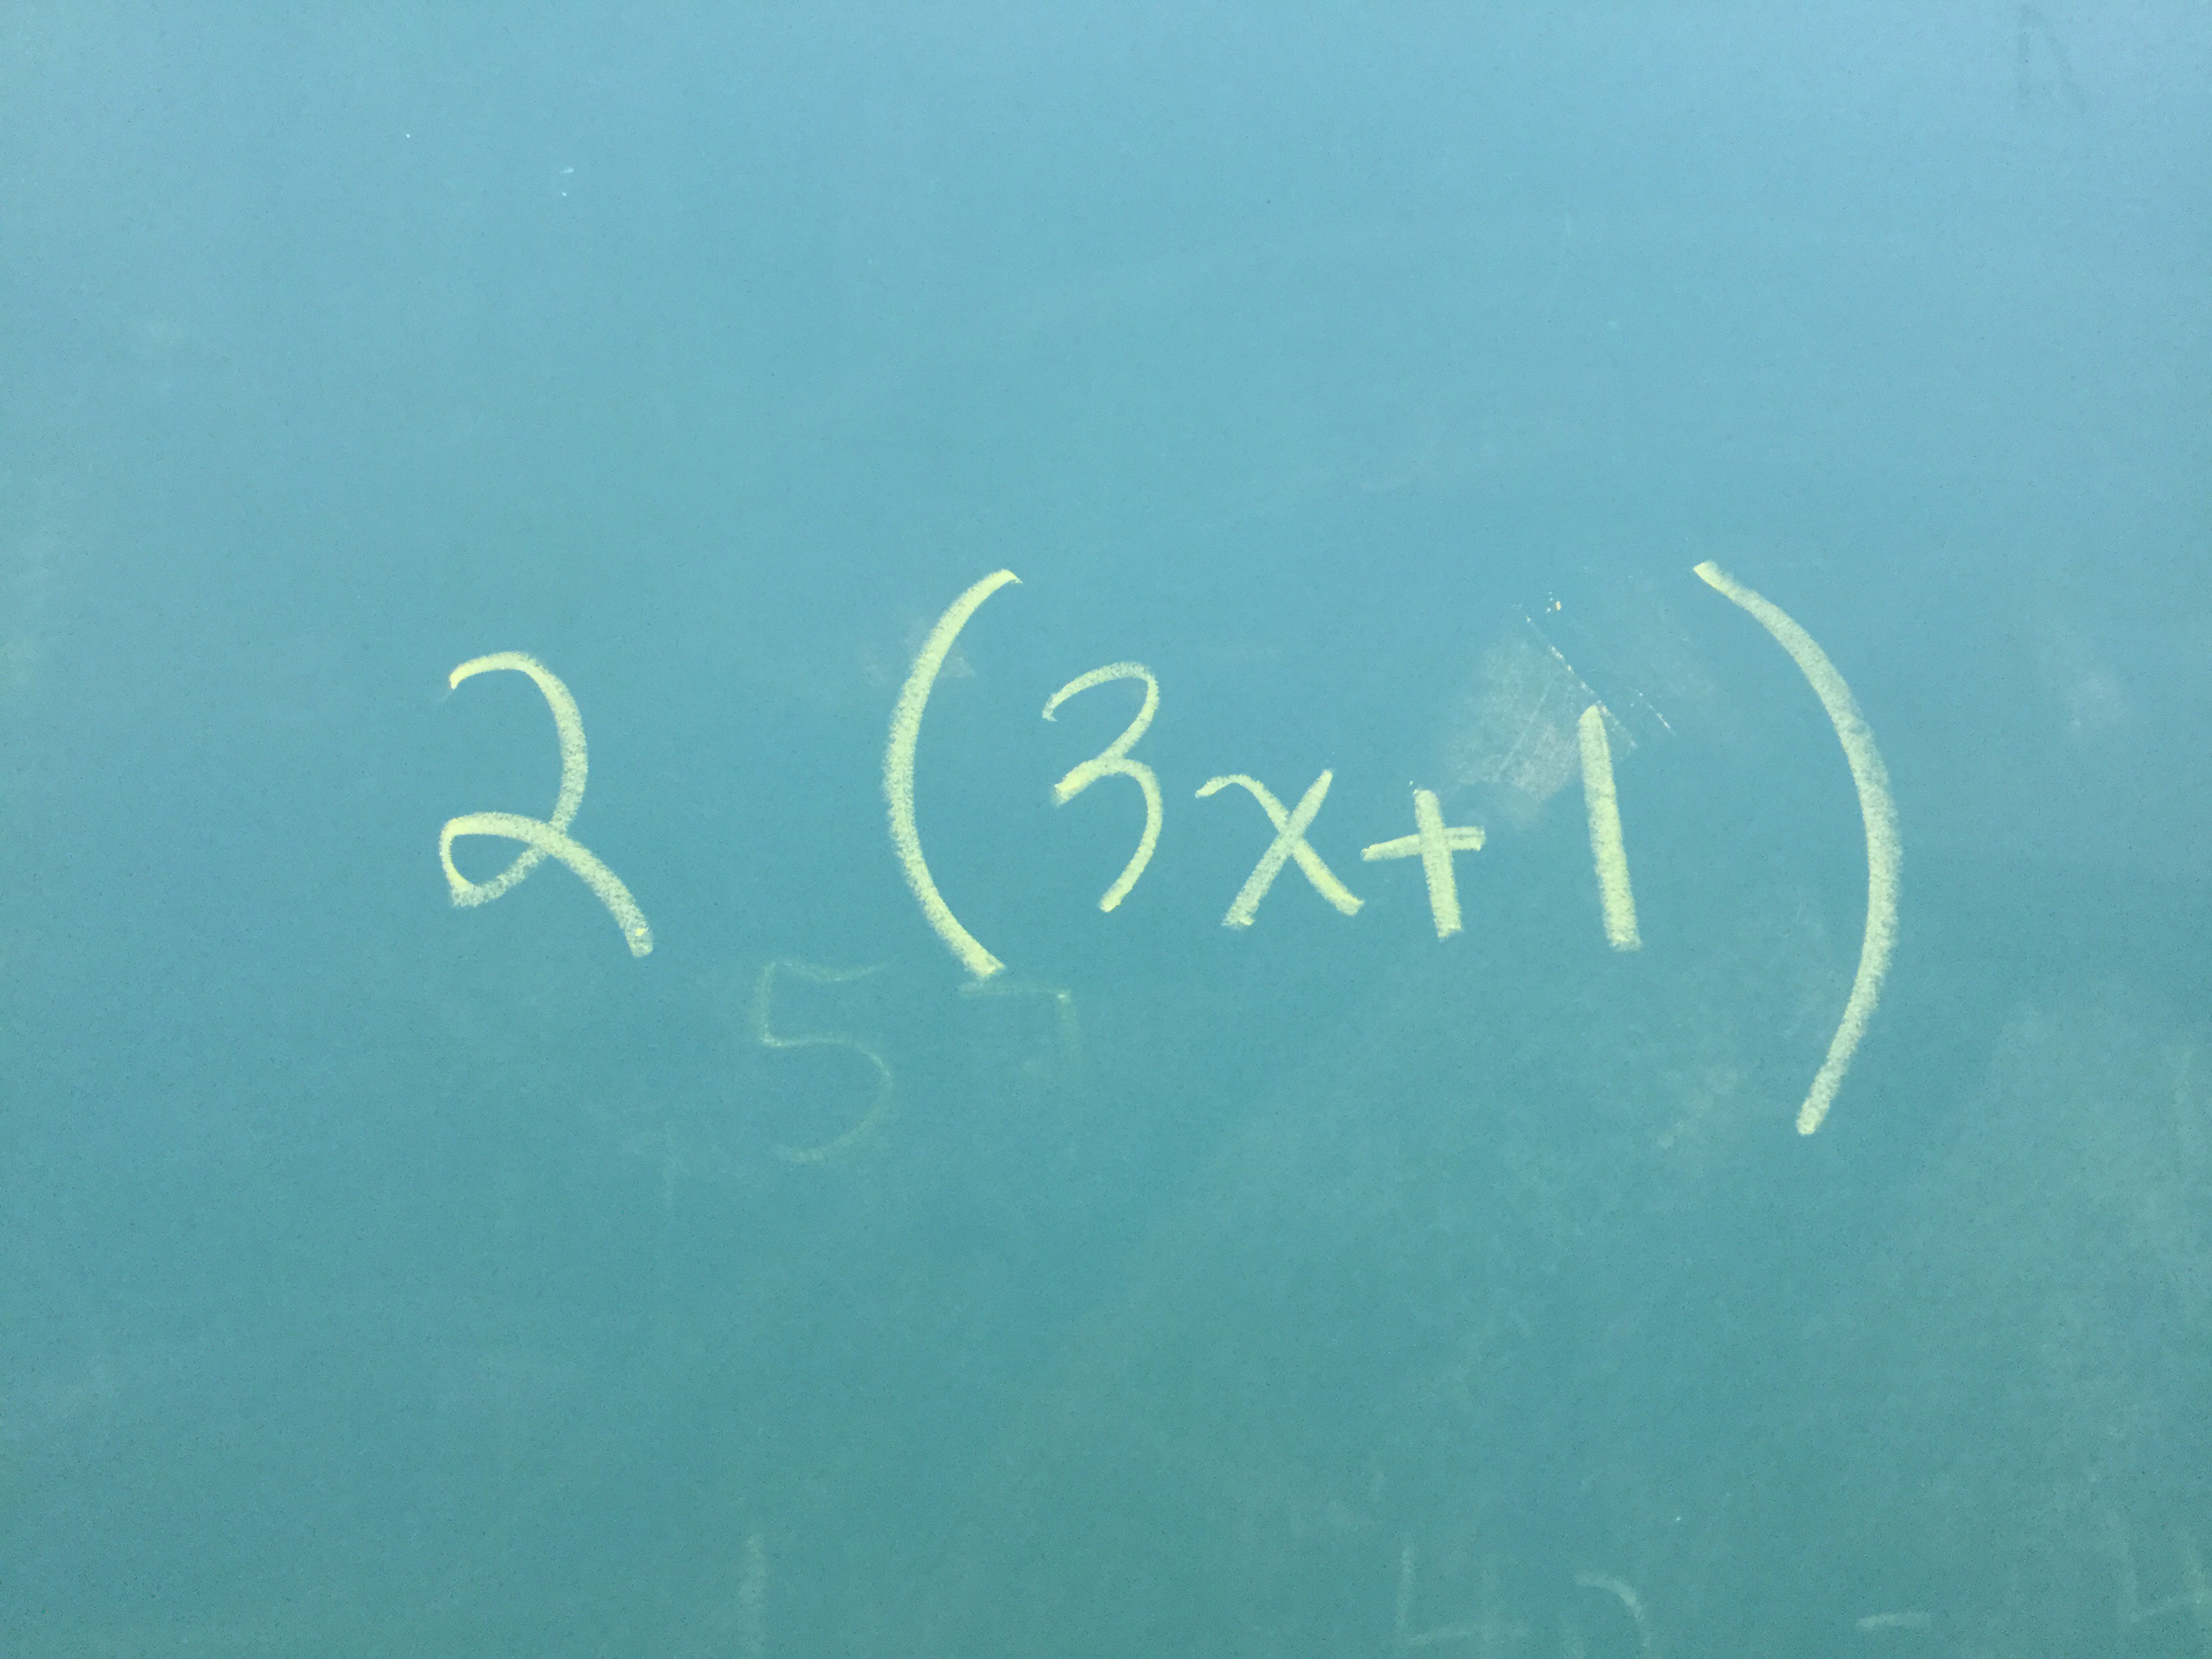 We can show it as two groups of 3x+1
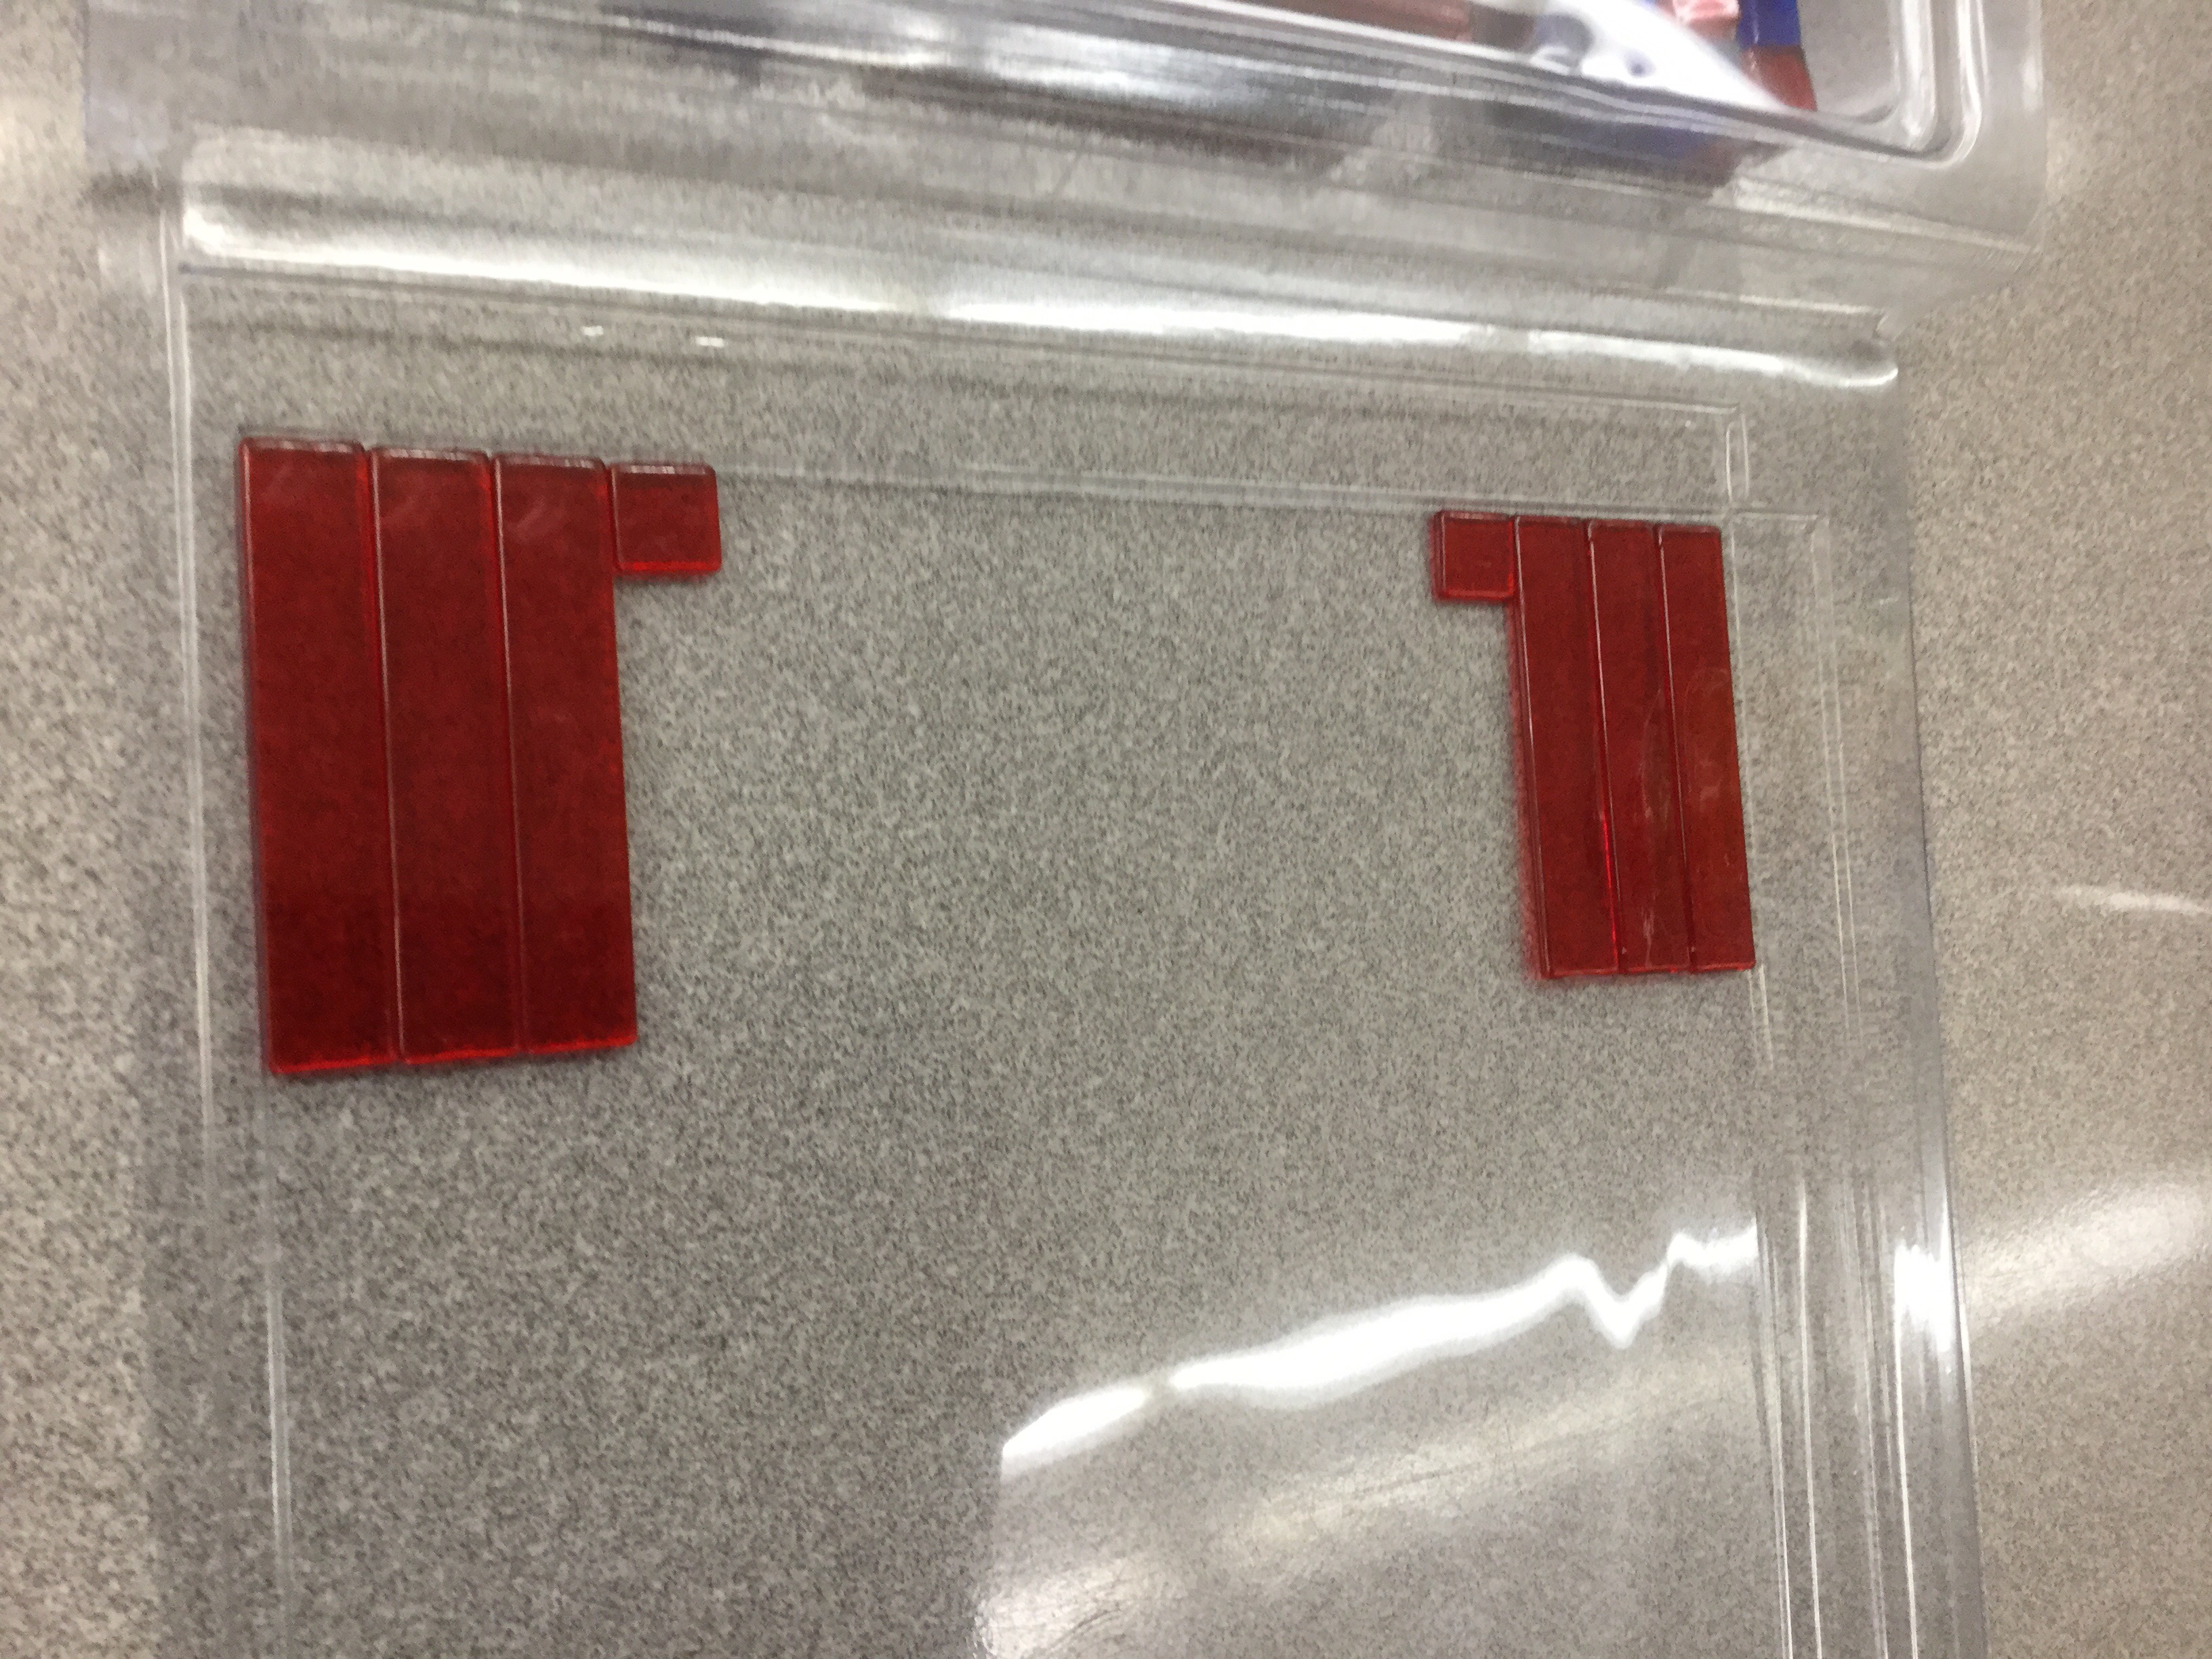
Which is the same thing as 6x+2
But we can also see each expression (the 2 and the 3x+1) as dimensions of a rectangle.
The product of these two dimensions would be the area of the rectangle. We fill in a rectangle with length of 3x+1 and width of 2 and we get 6x+2 as an answer.
The area model is particularly useful when multiplying expressions with variables in both length and width.

X(2X+1)=2X^2+X
