Lots of experiments in grade 9
We experimented with squares, plotting area and perimeter against side length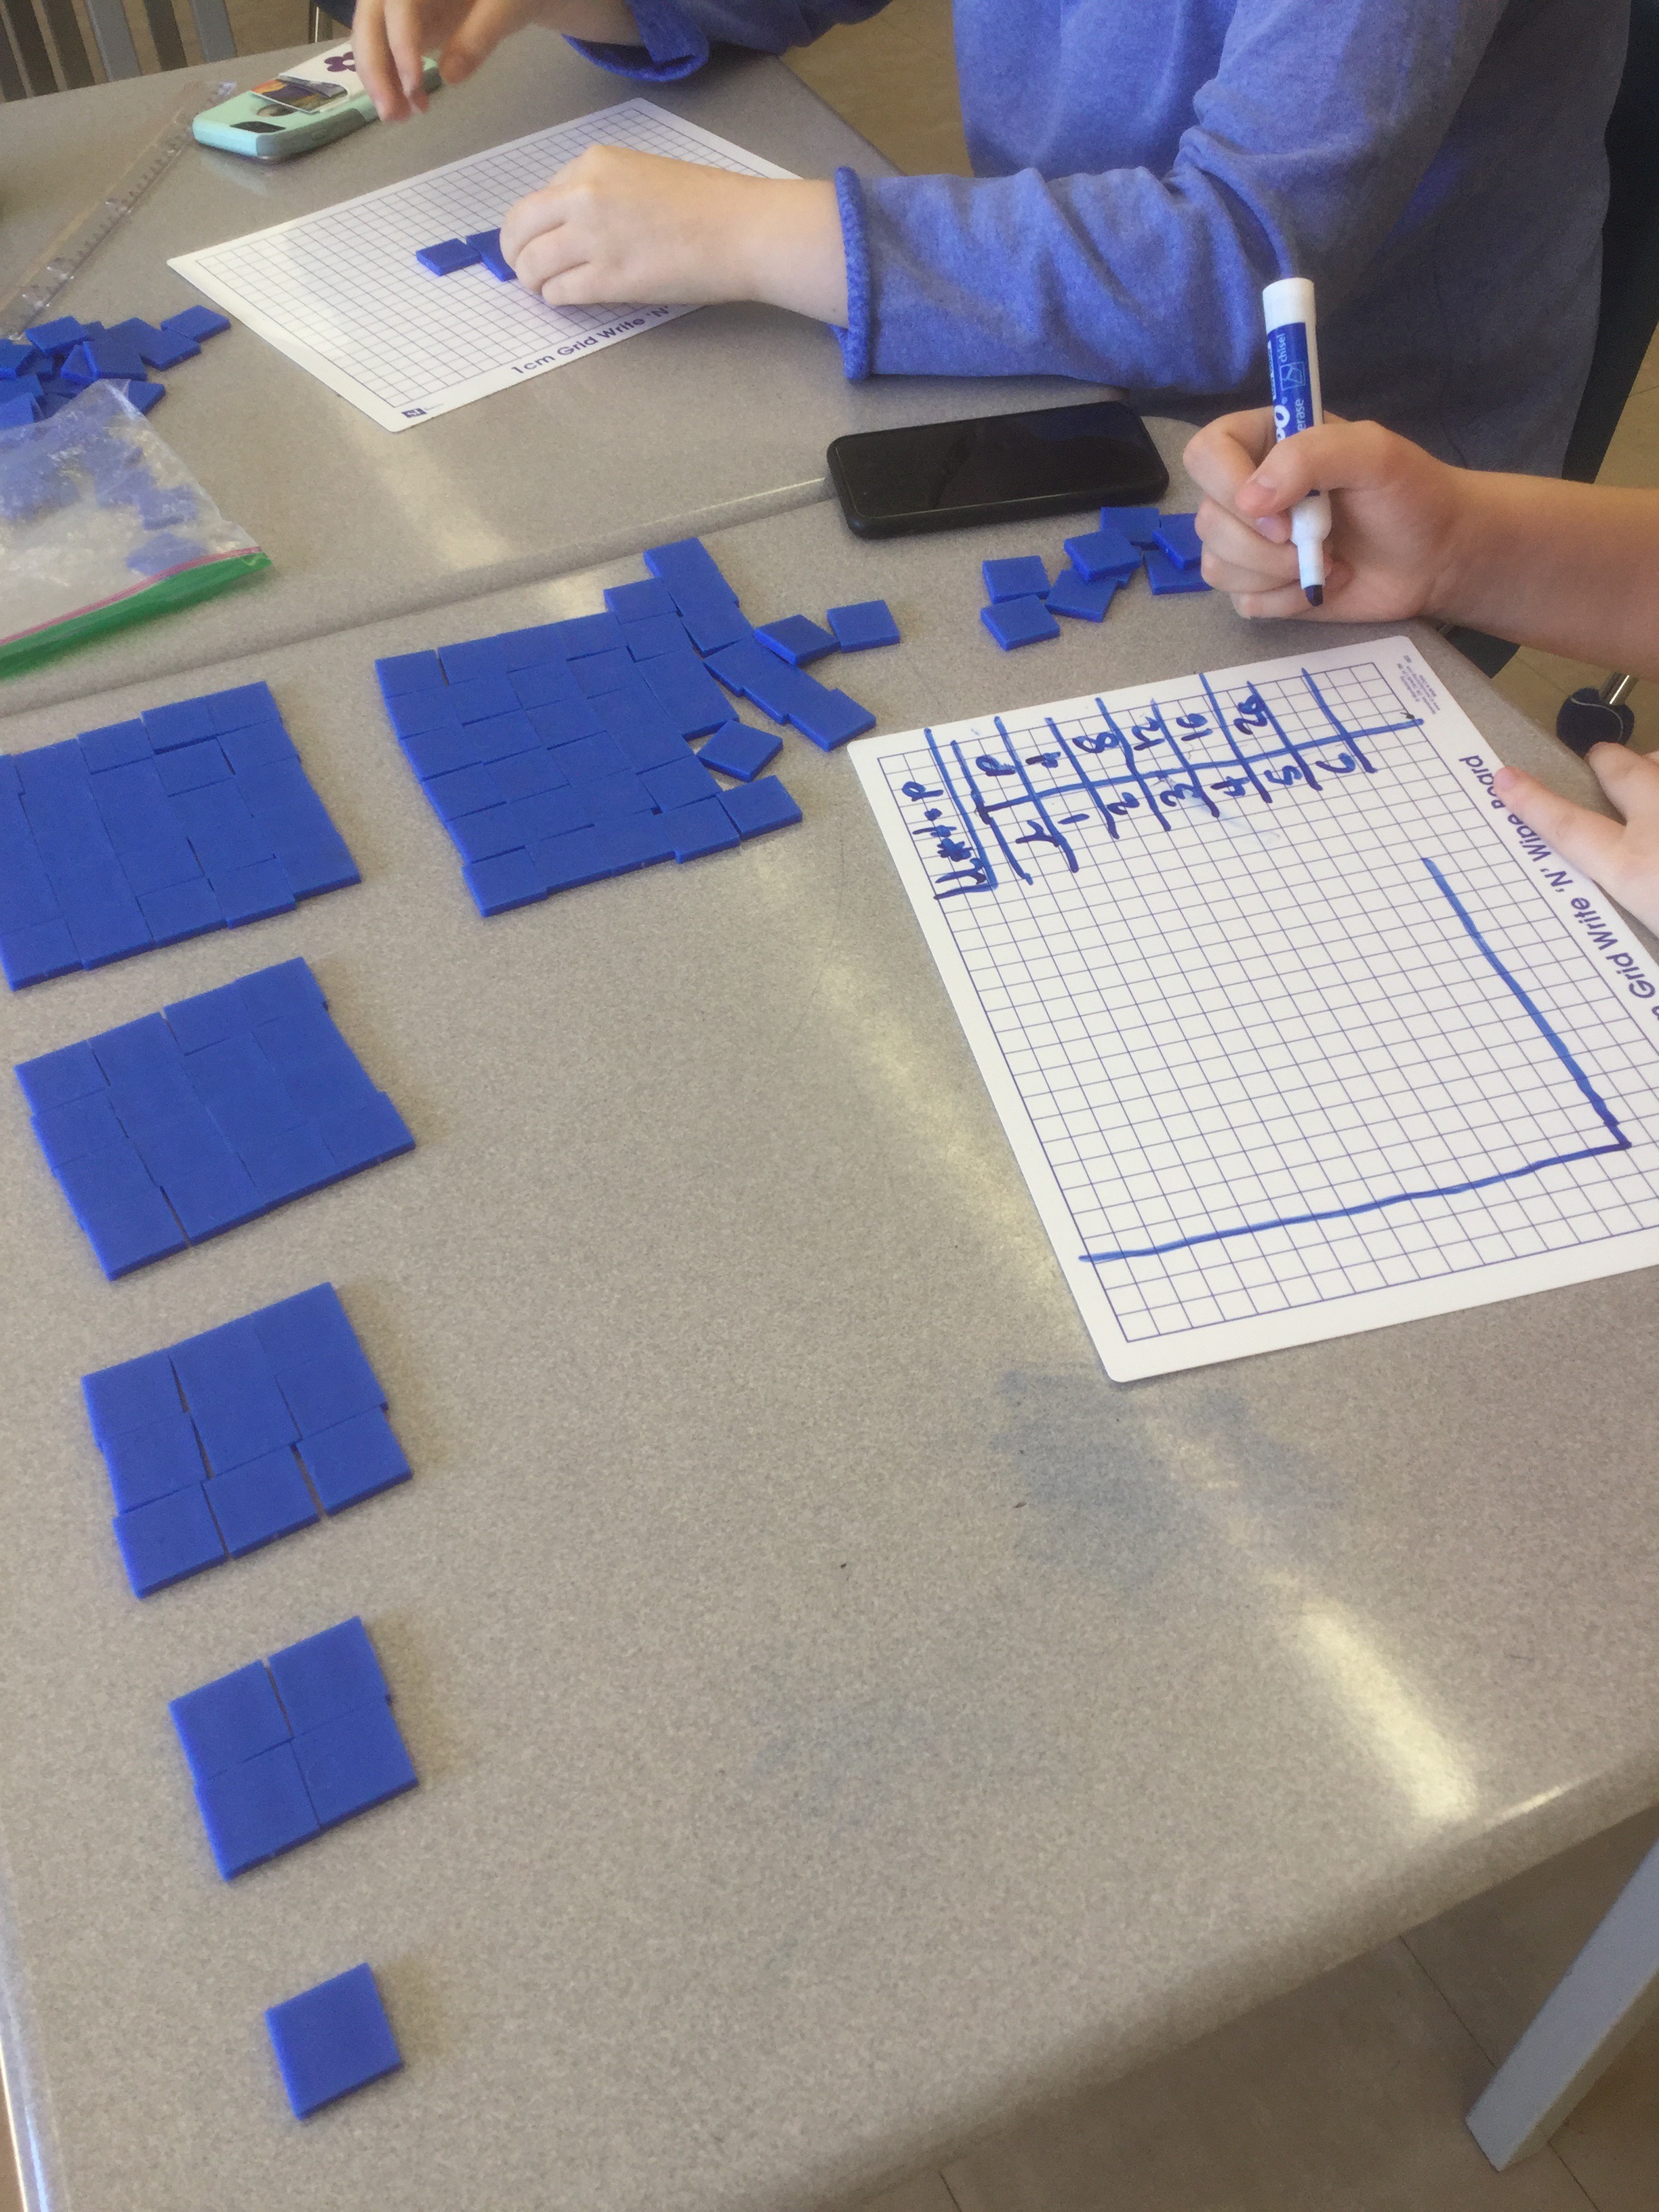
We are making tables of values, visual models, graphs, and looking at the trends we see.

With the squares we noticed that perimeters increase steadily as the side length increases, and so we have a linear relation. We also made a formula for calculating perimeter and noticed there is no exponent. We compared the area graph, which is an increasing curve. We noticed there is an exponent when we calculate area. We also saw that the perimeter and area are the same if the side length is 4, because there is an intersection on the graph.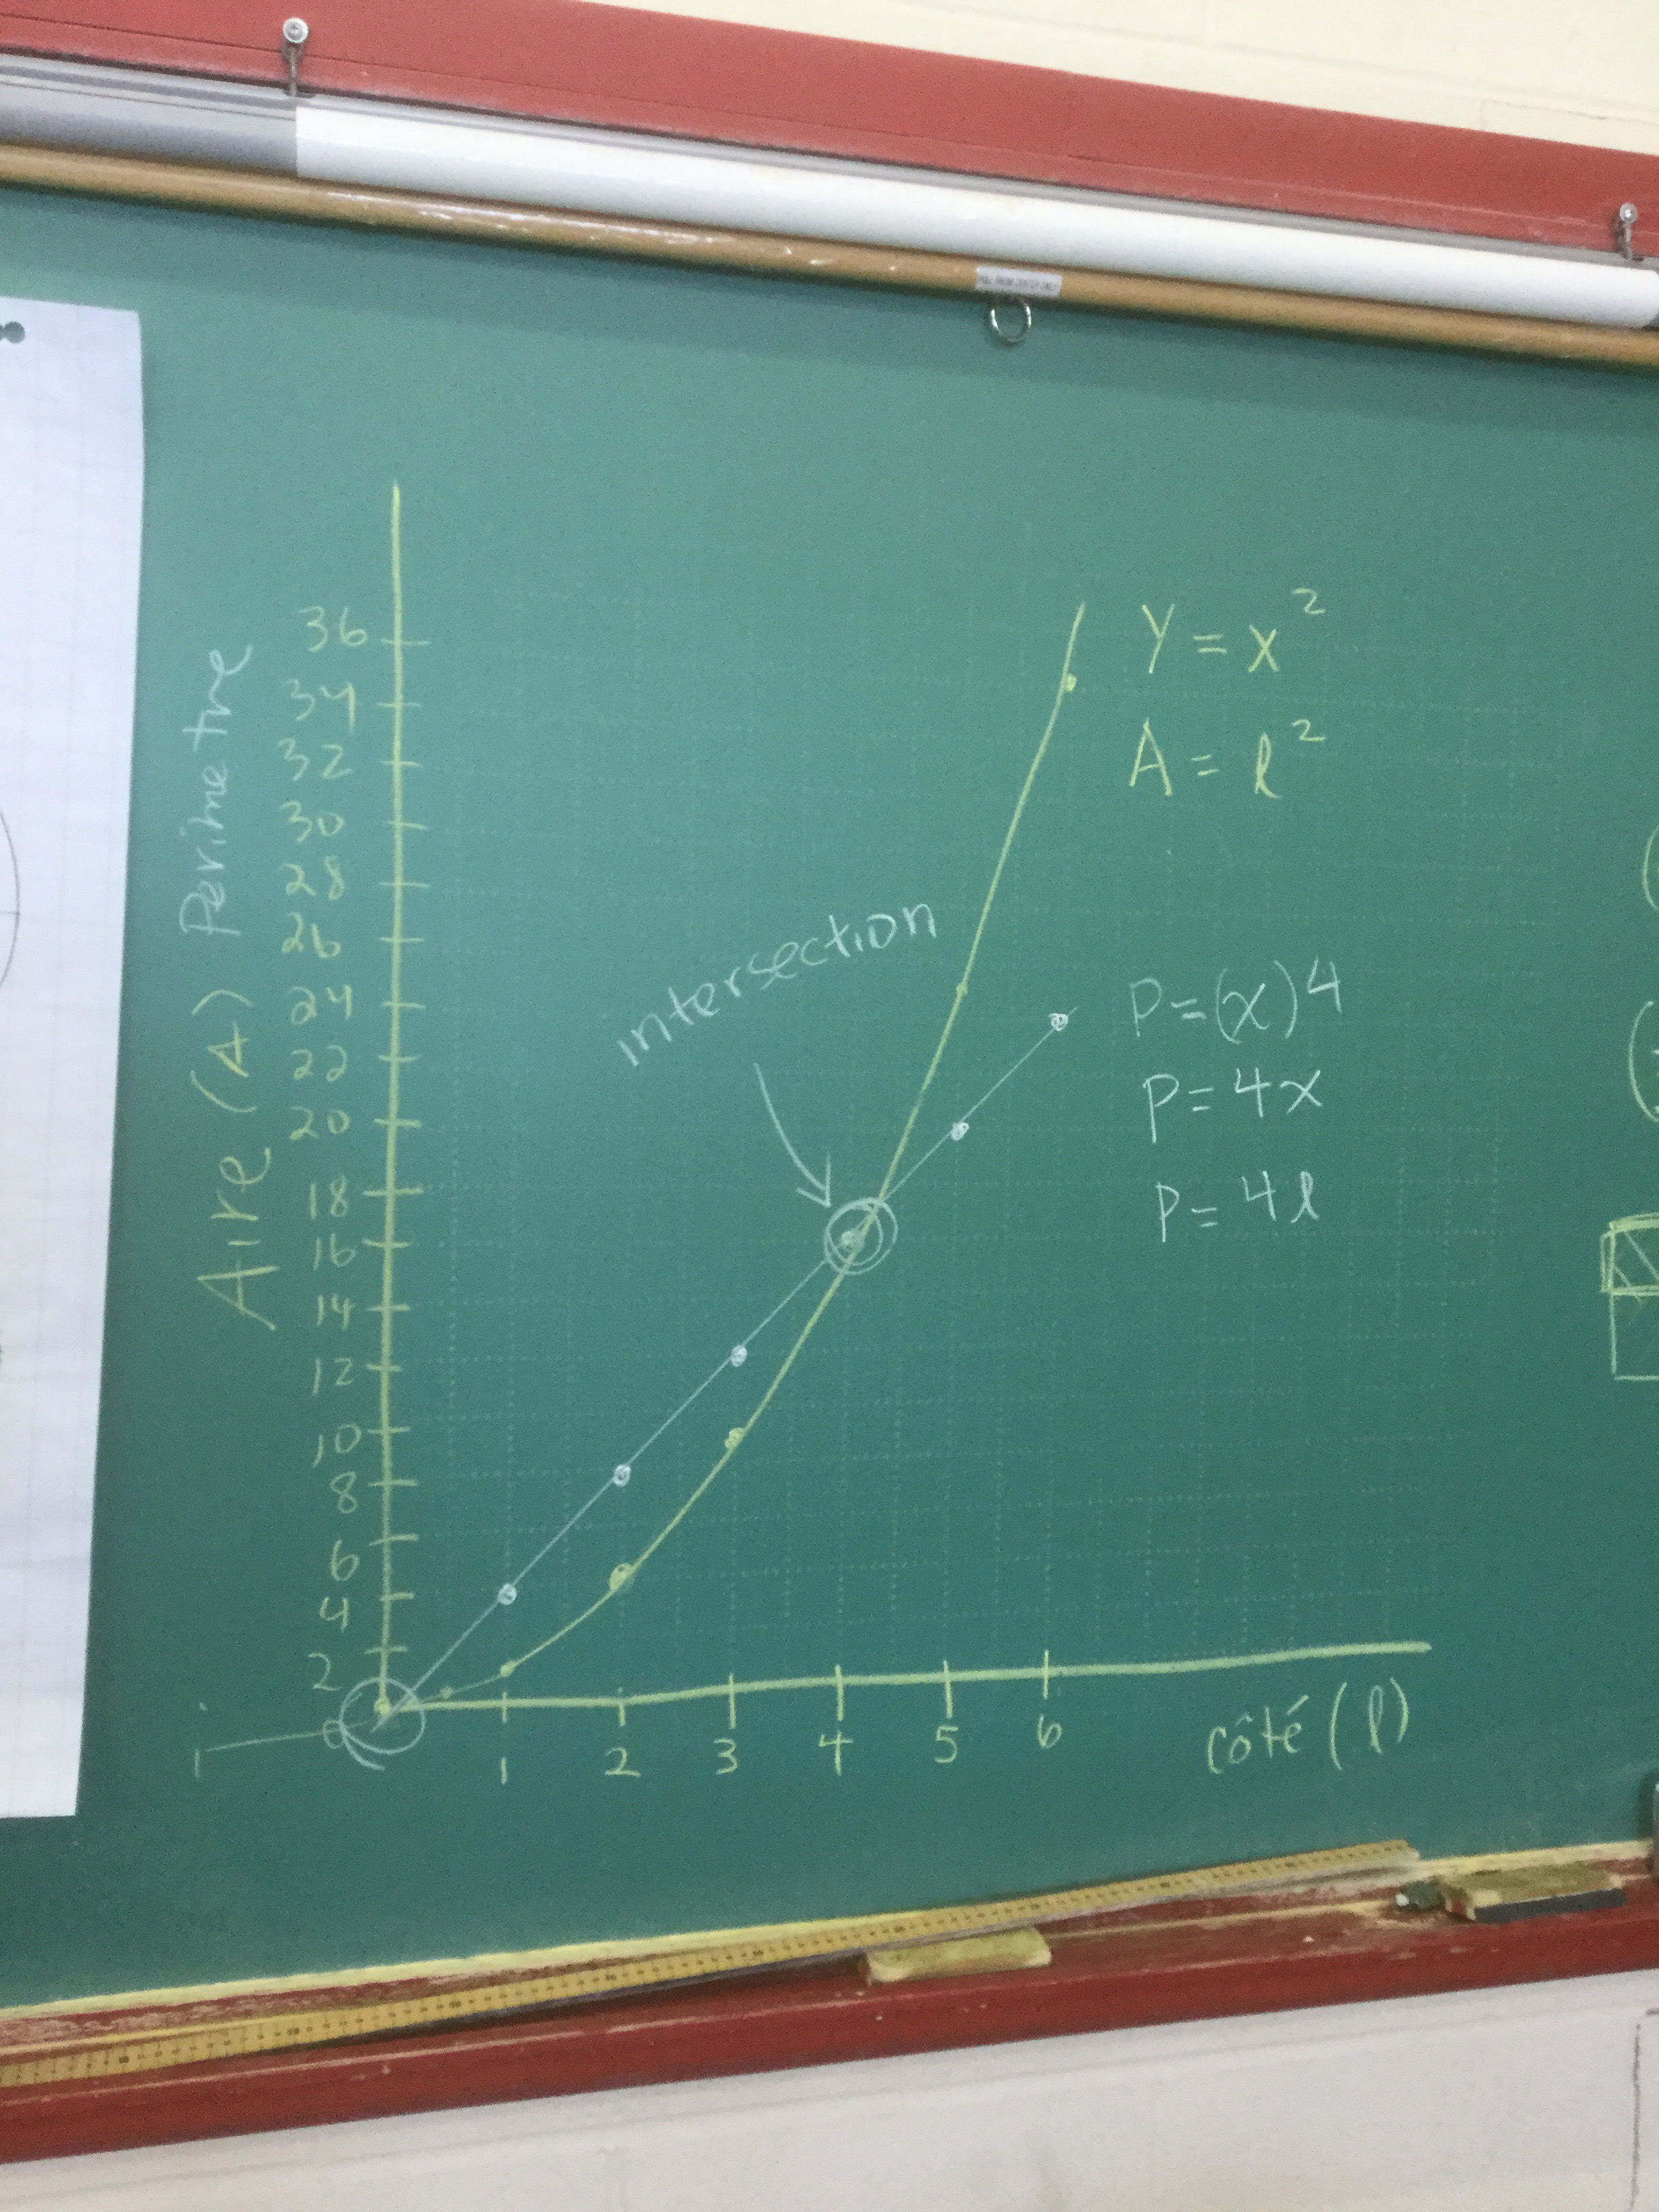
Our next experiment was all about hot water. We boiled a kettle and then poured the hot water into a mug. We took temperature measurements each minute and put them into a graph.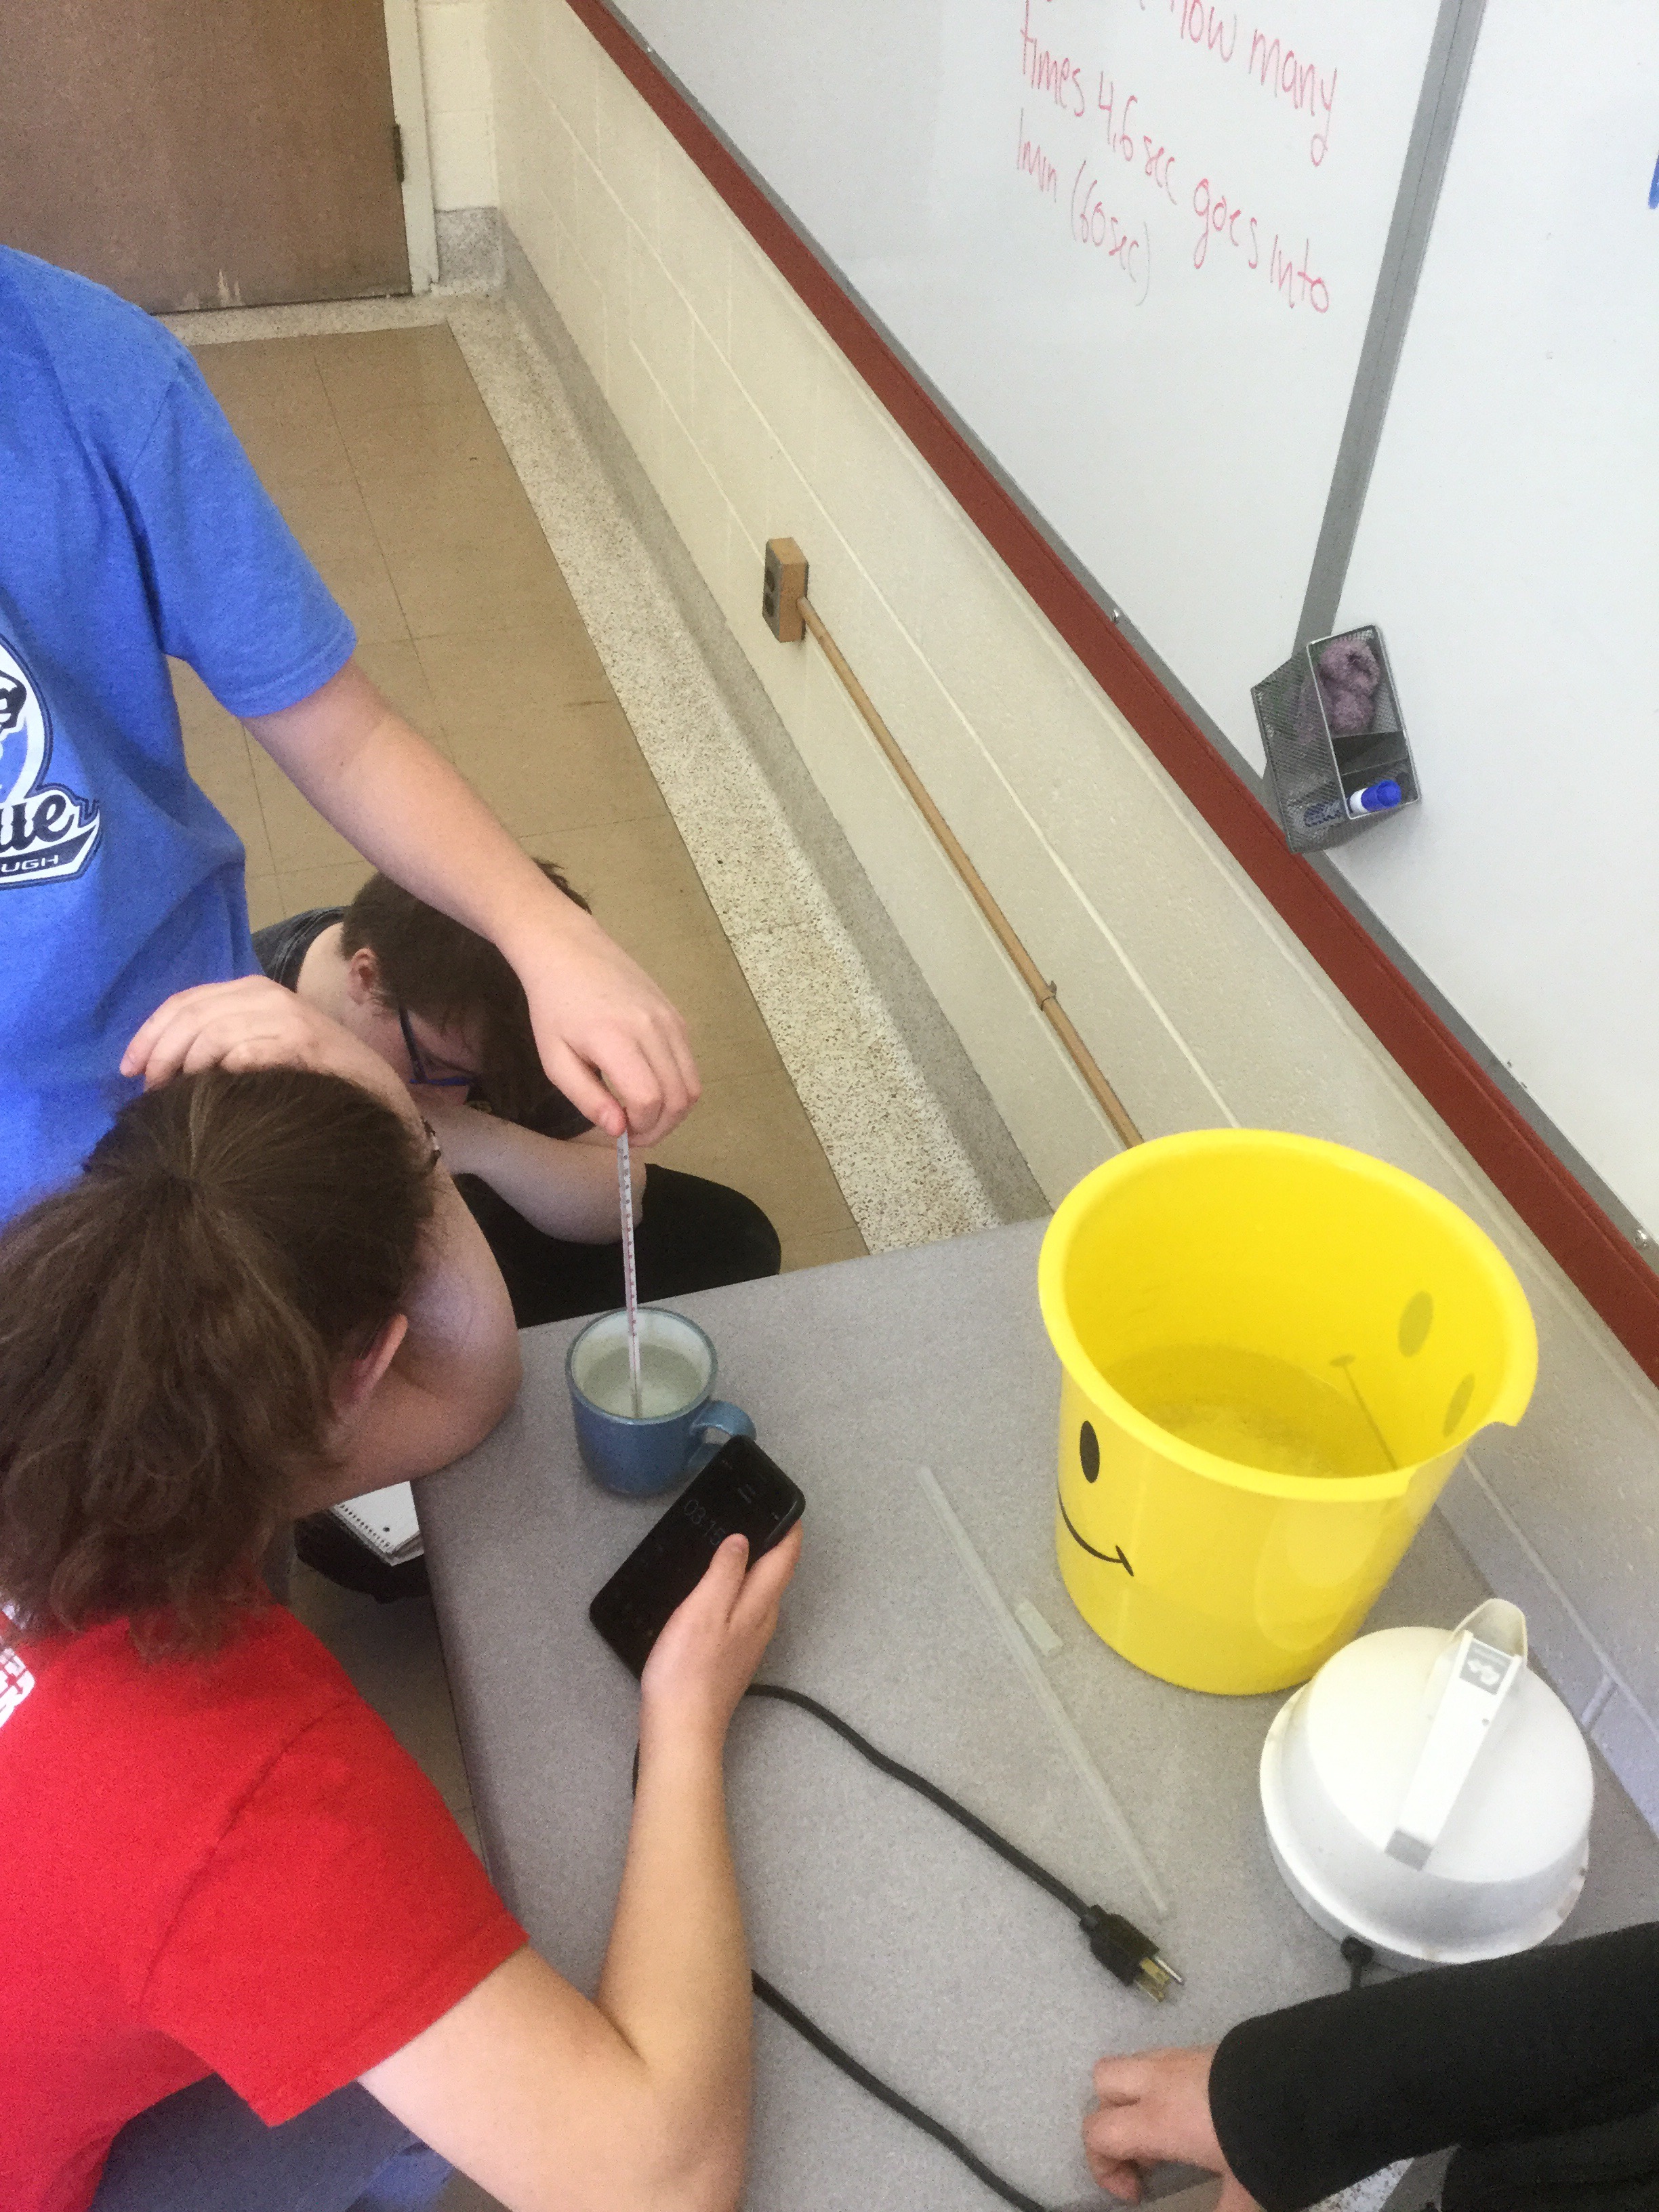
We made some predictions after the first few minutes…
Some of us drew lines that continued downward all the way to the bottom of the graph (the x axis) which would represent the temperature becoming zero. Our classroom is ridiculously hot so we know the water can never get to zero!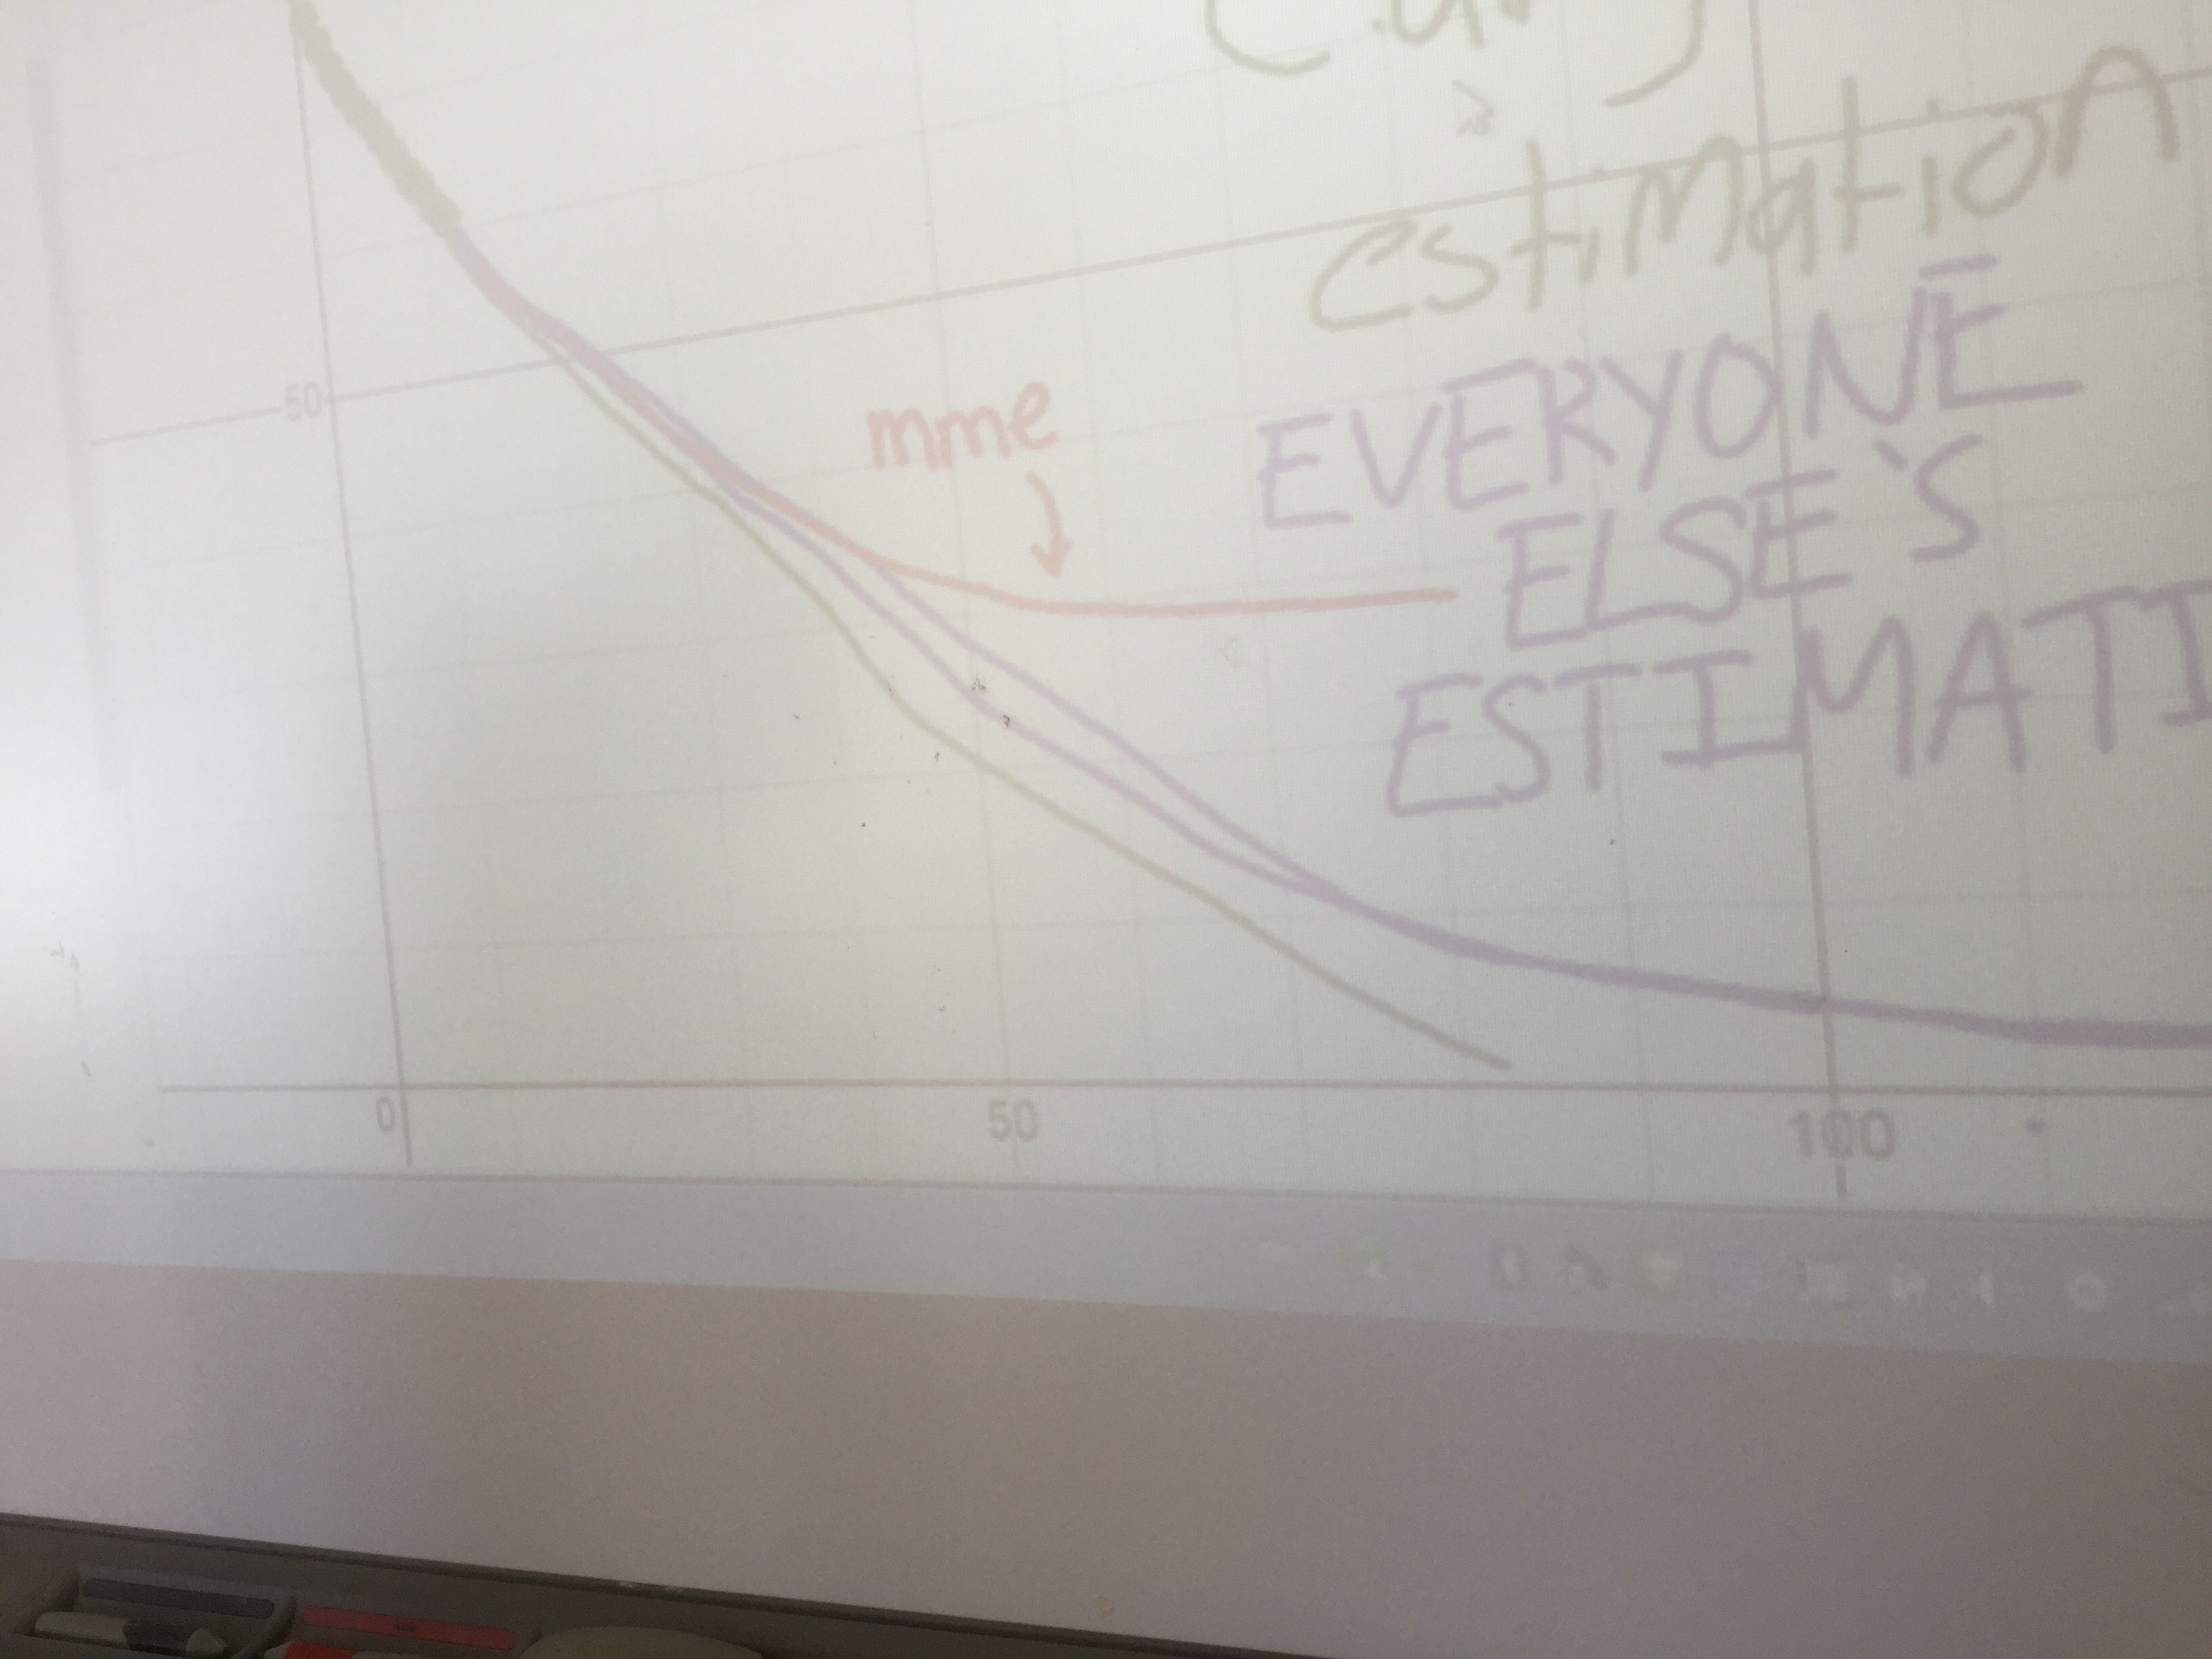 We need to be careful when extrapolating; we should think about what is happening, and what the limitations might be, or what the future values could be. Each situation is different so we need to consider the details and constraints very carefully.
Great work grade 9s!
