The power of yet
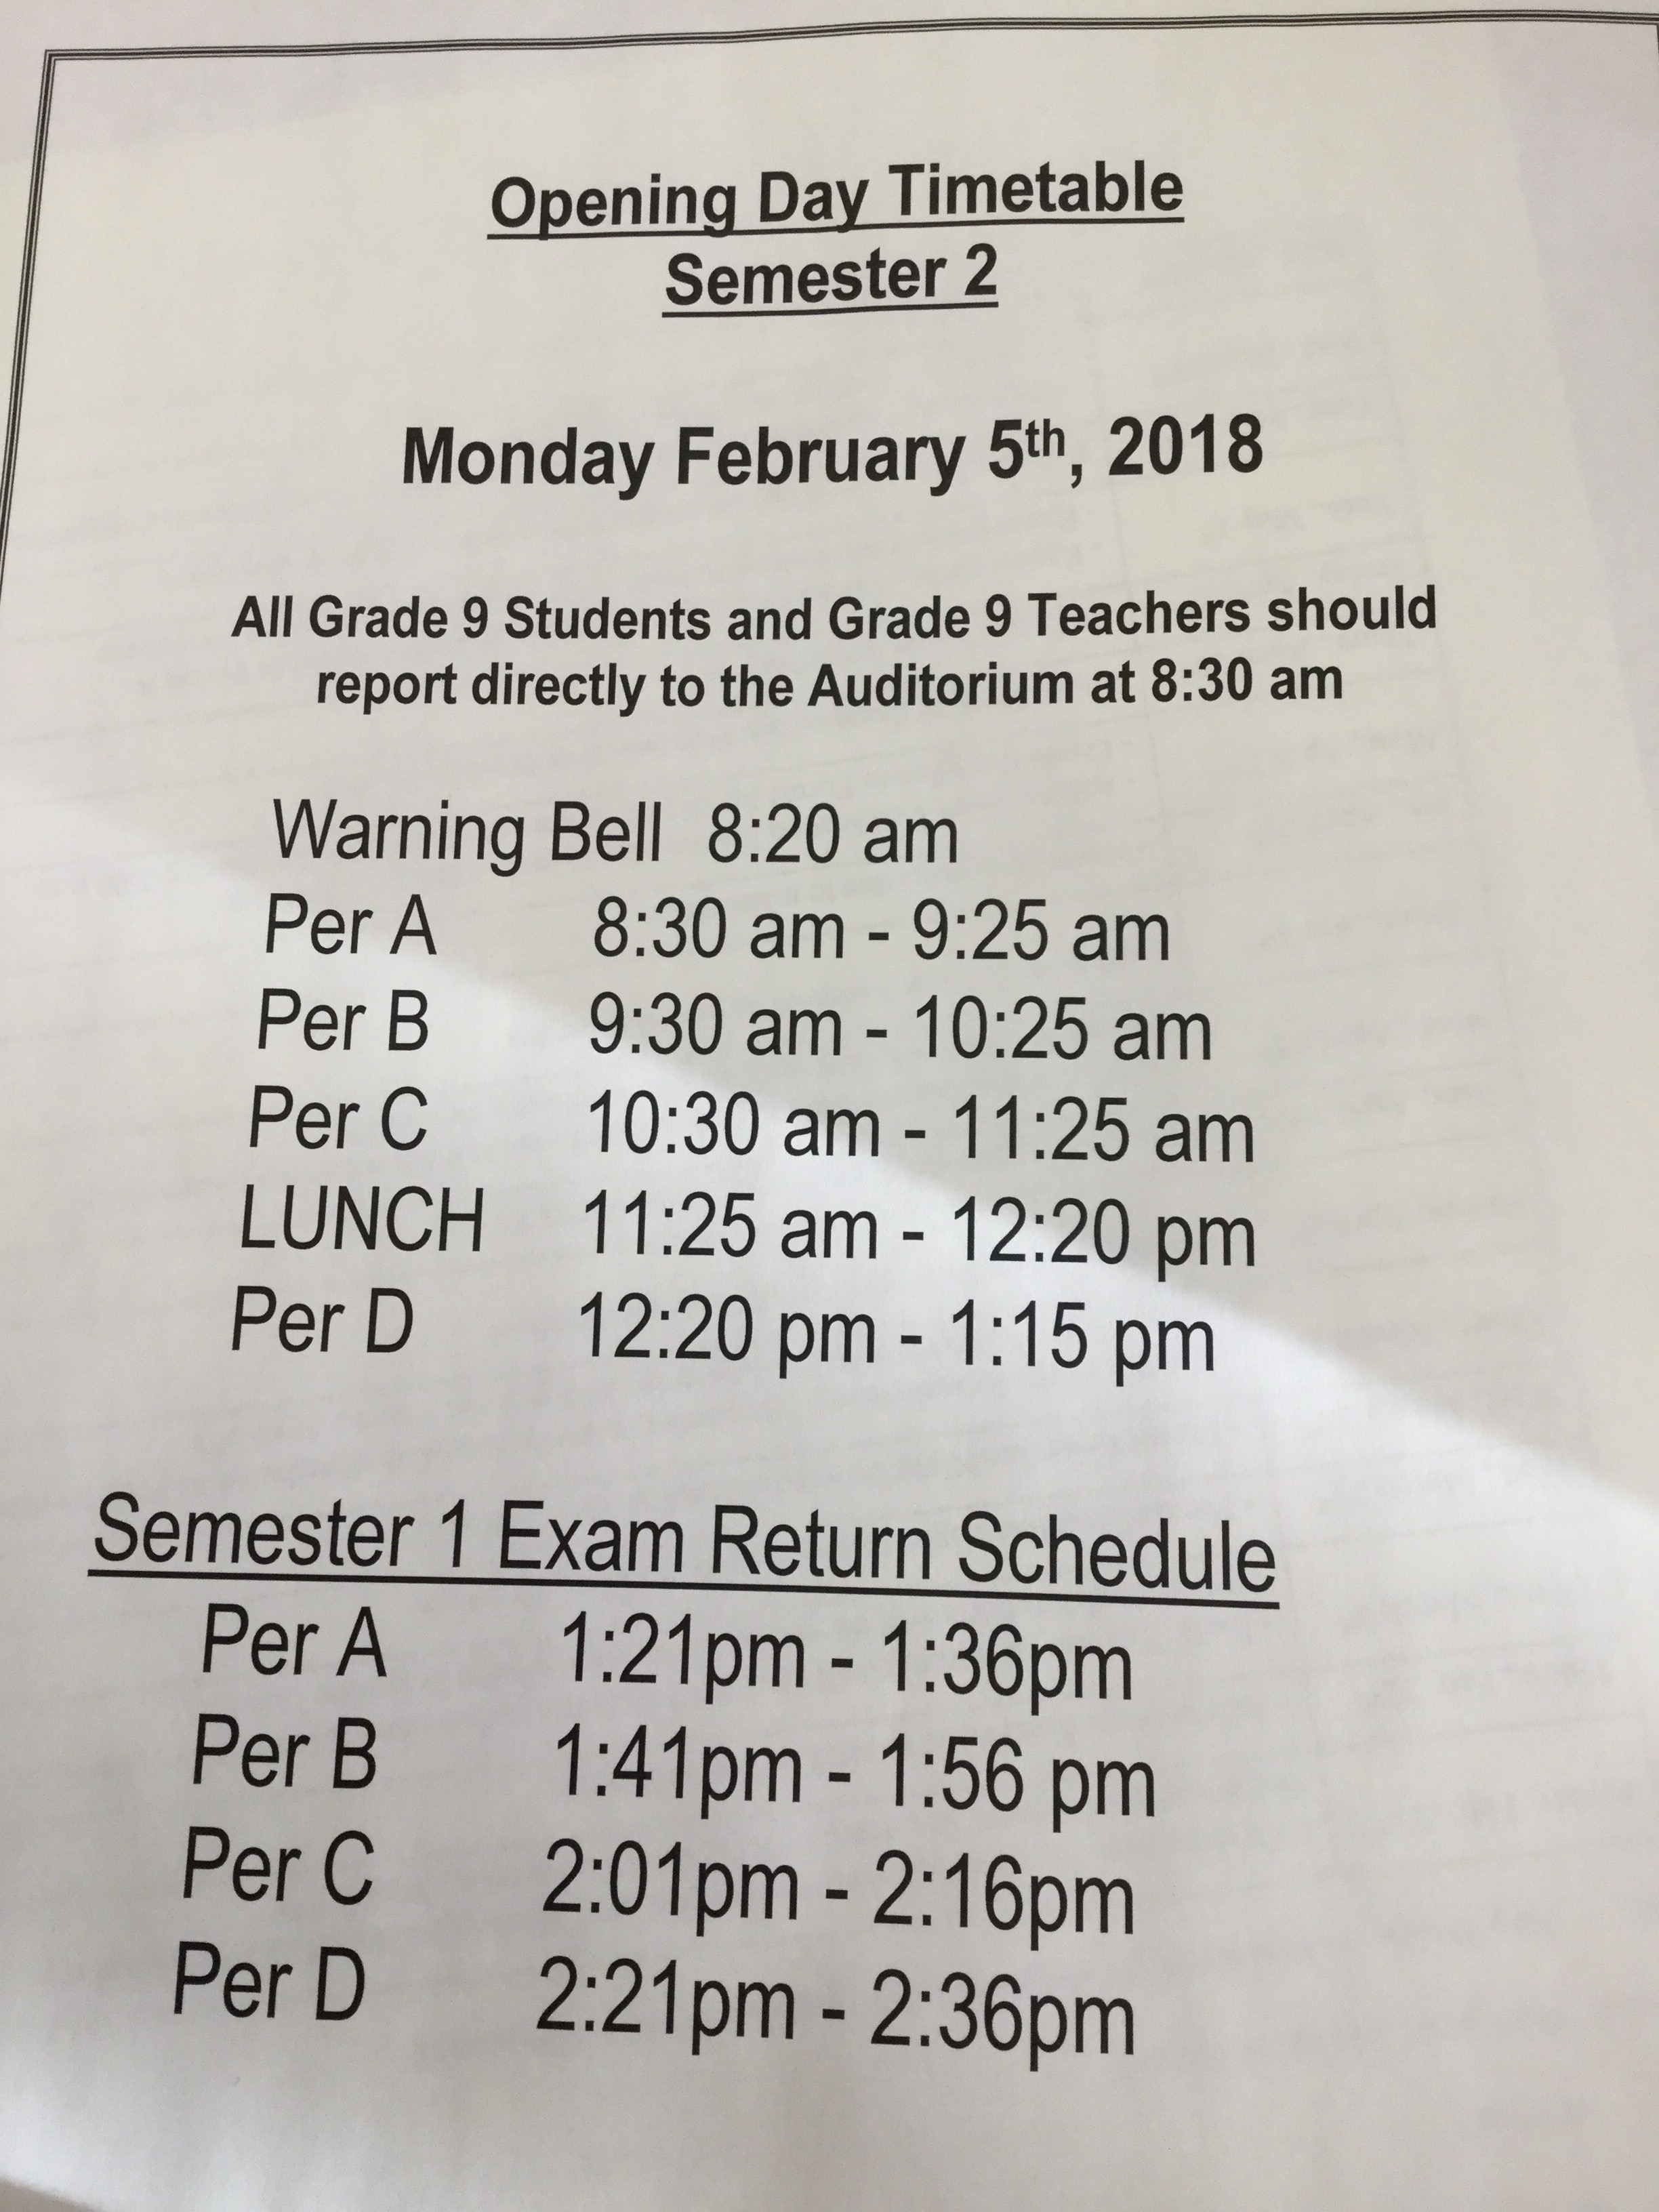
First Day Schedule
Two snow days!?
Ok kids, here’s the plan!
Grade 9’s: work on your portfolio. The test for chapter 7 is cancelled. Here’s the sheet to prepare for your interview.

Here’s the portfolio rubric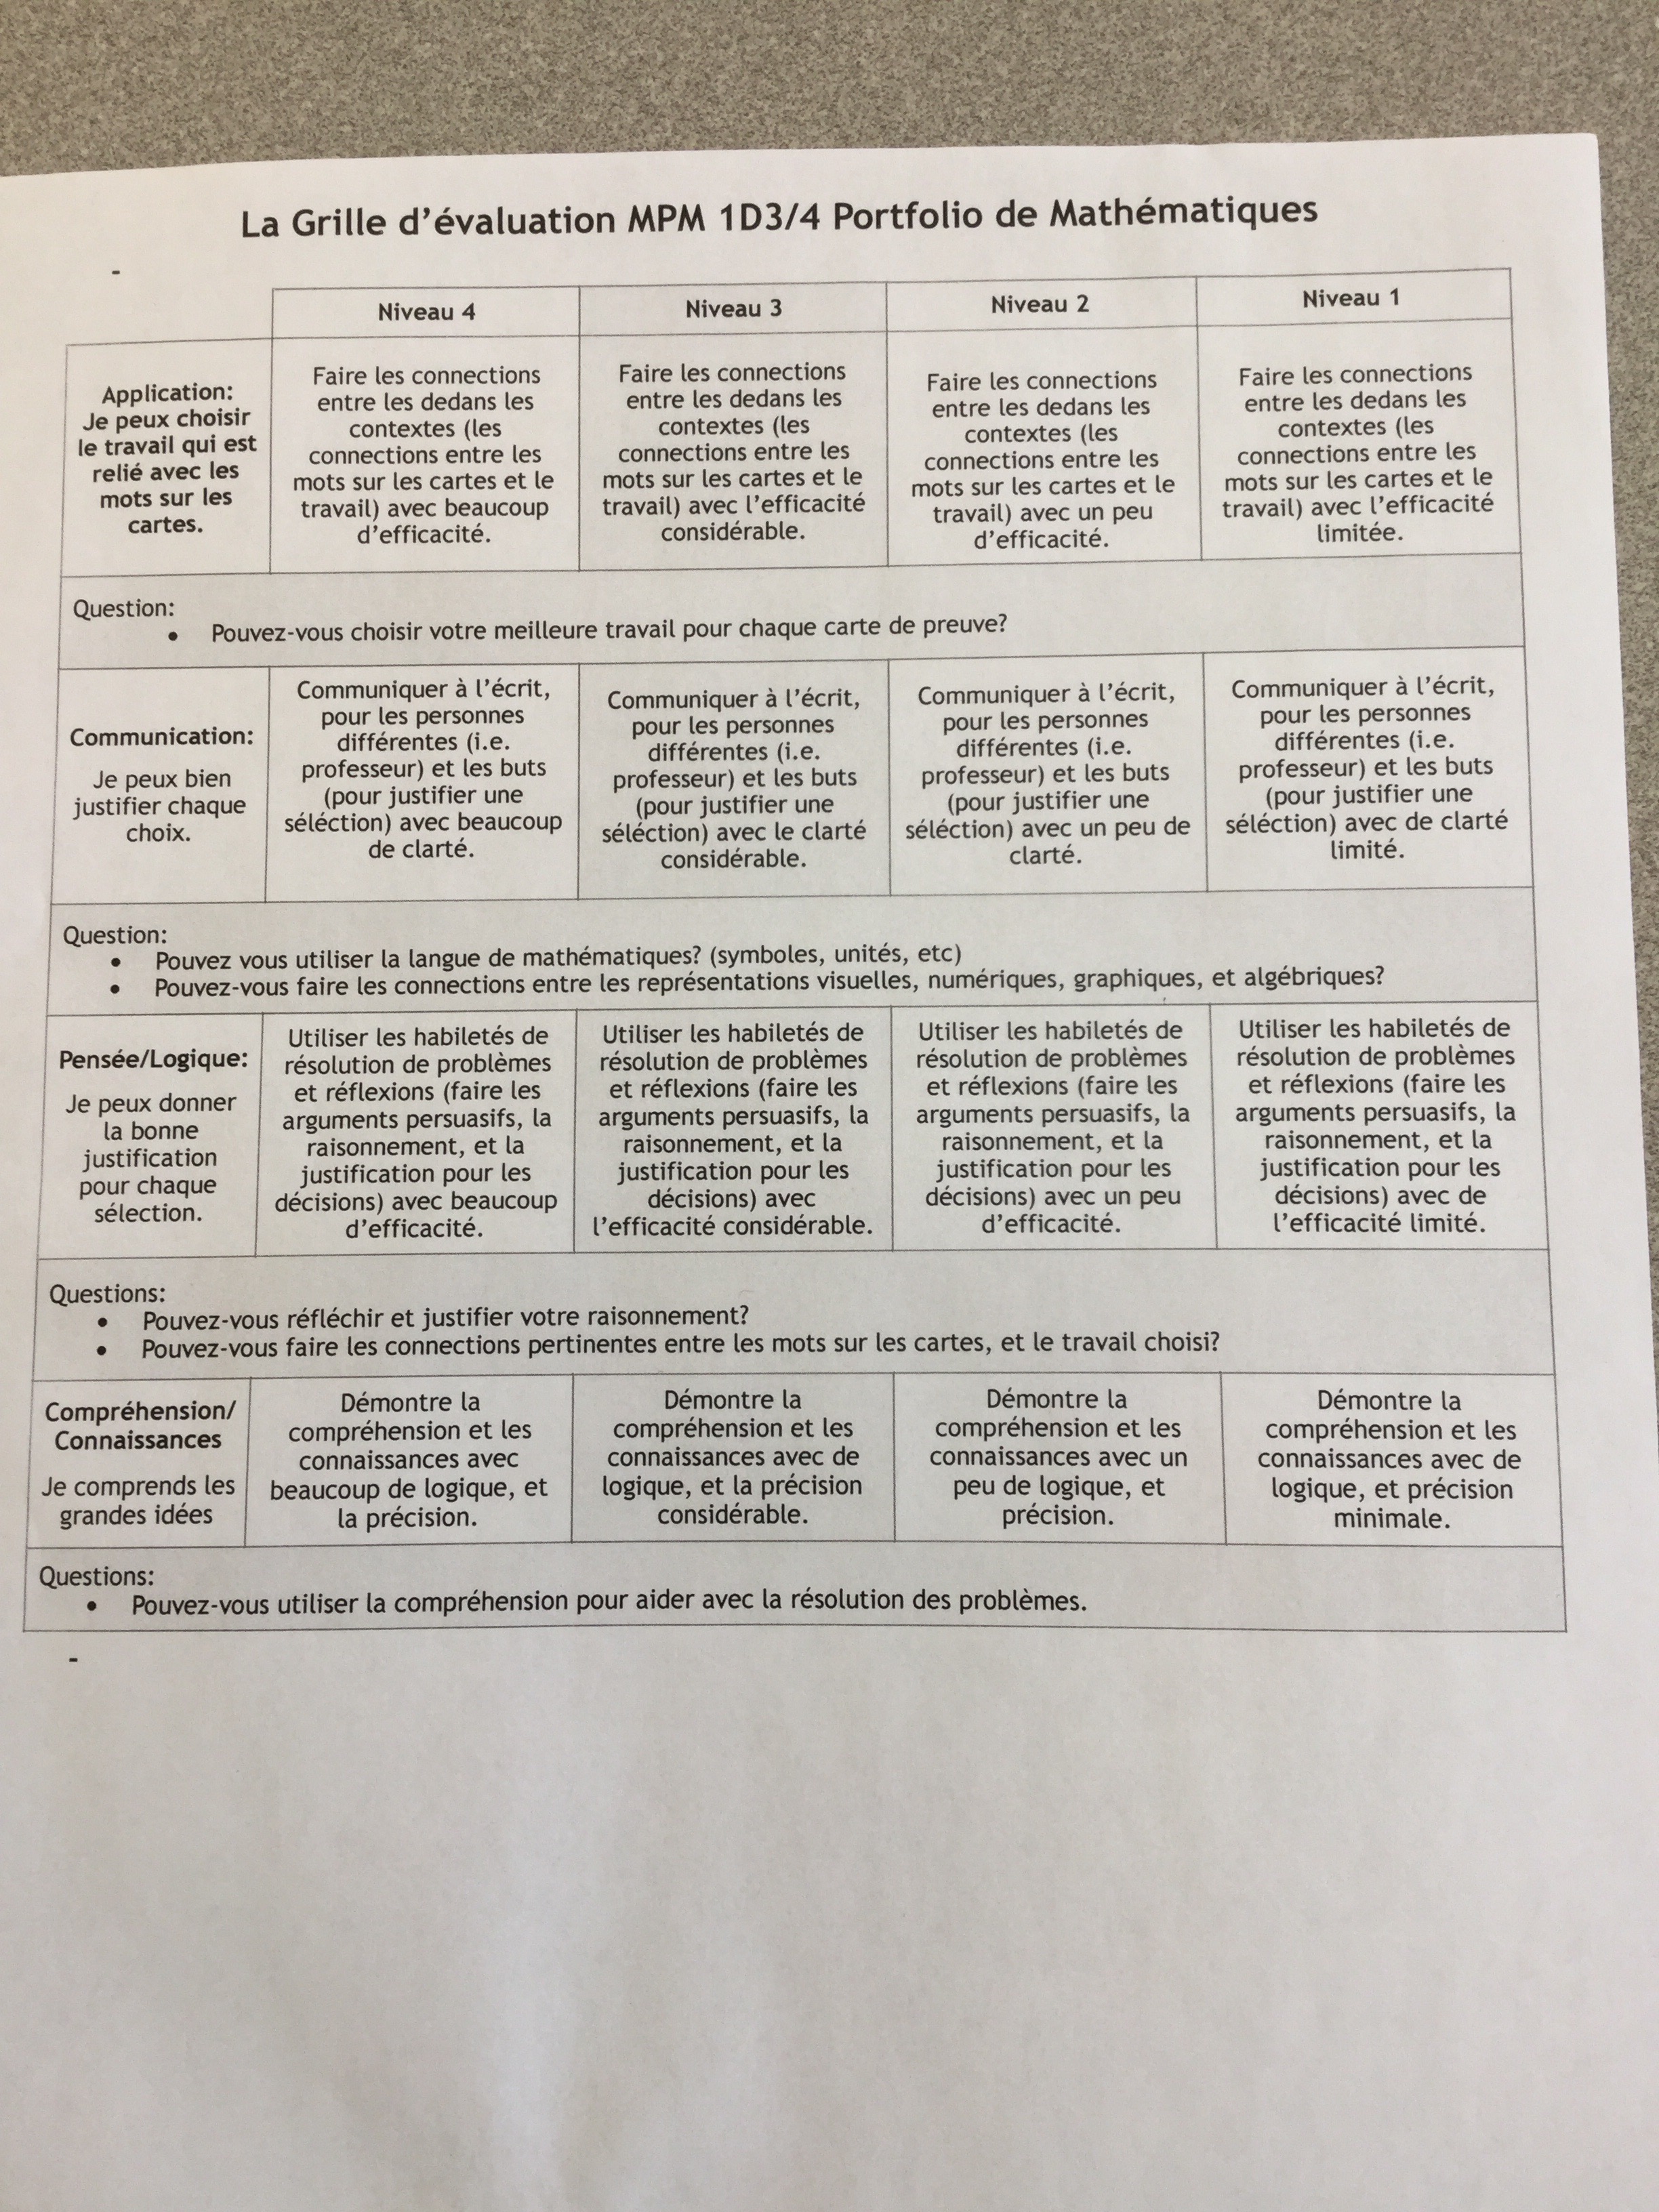
And here’s the main page that says what you need in it.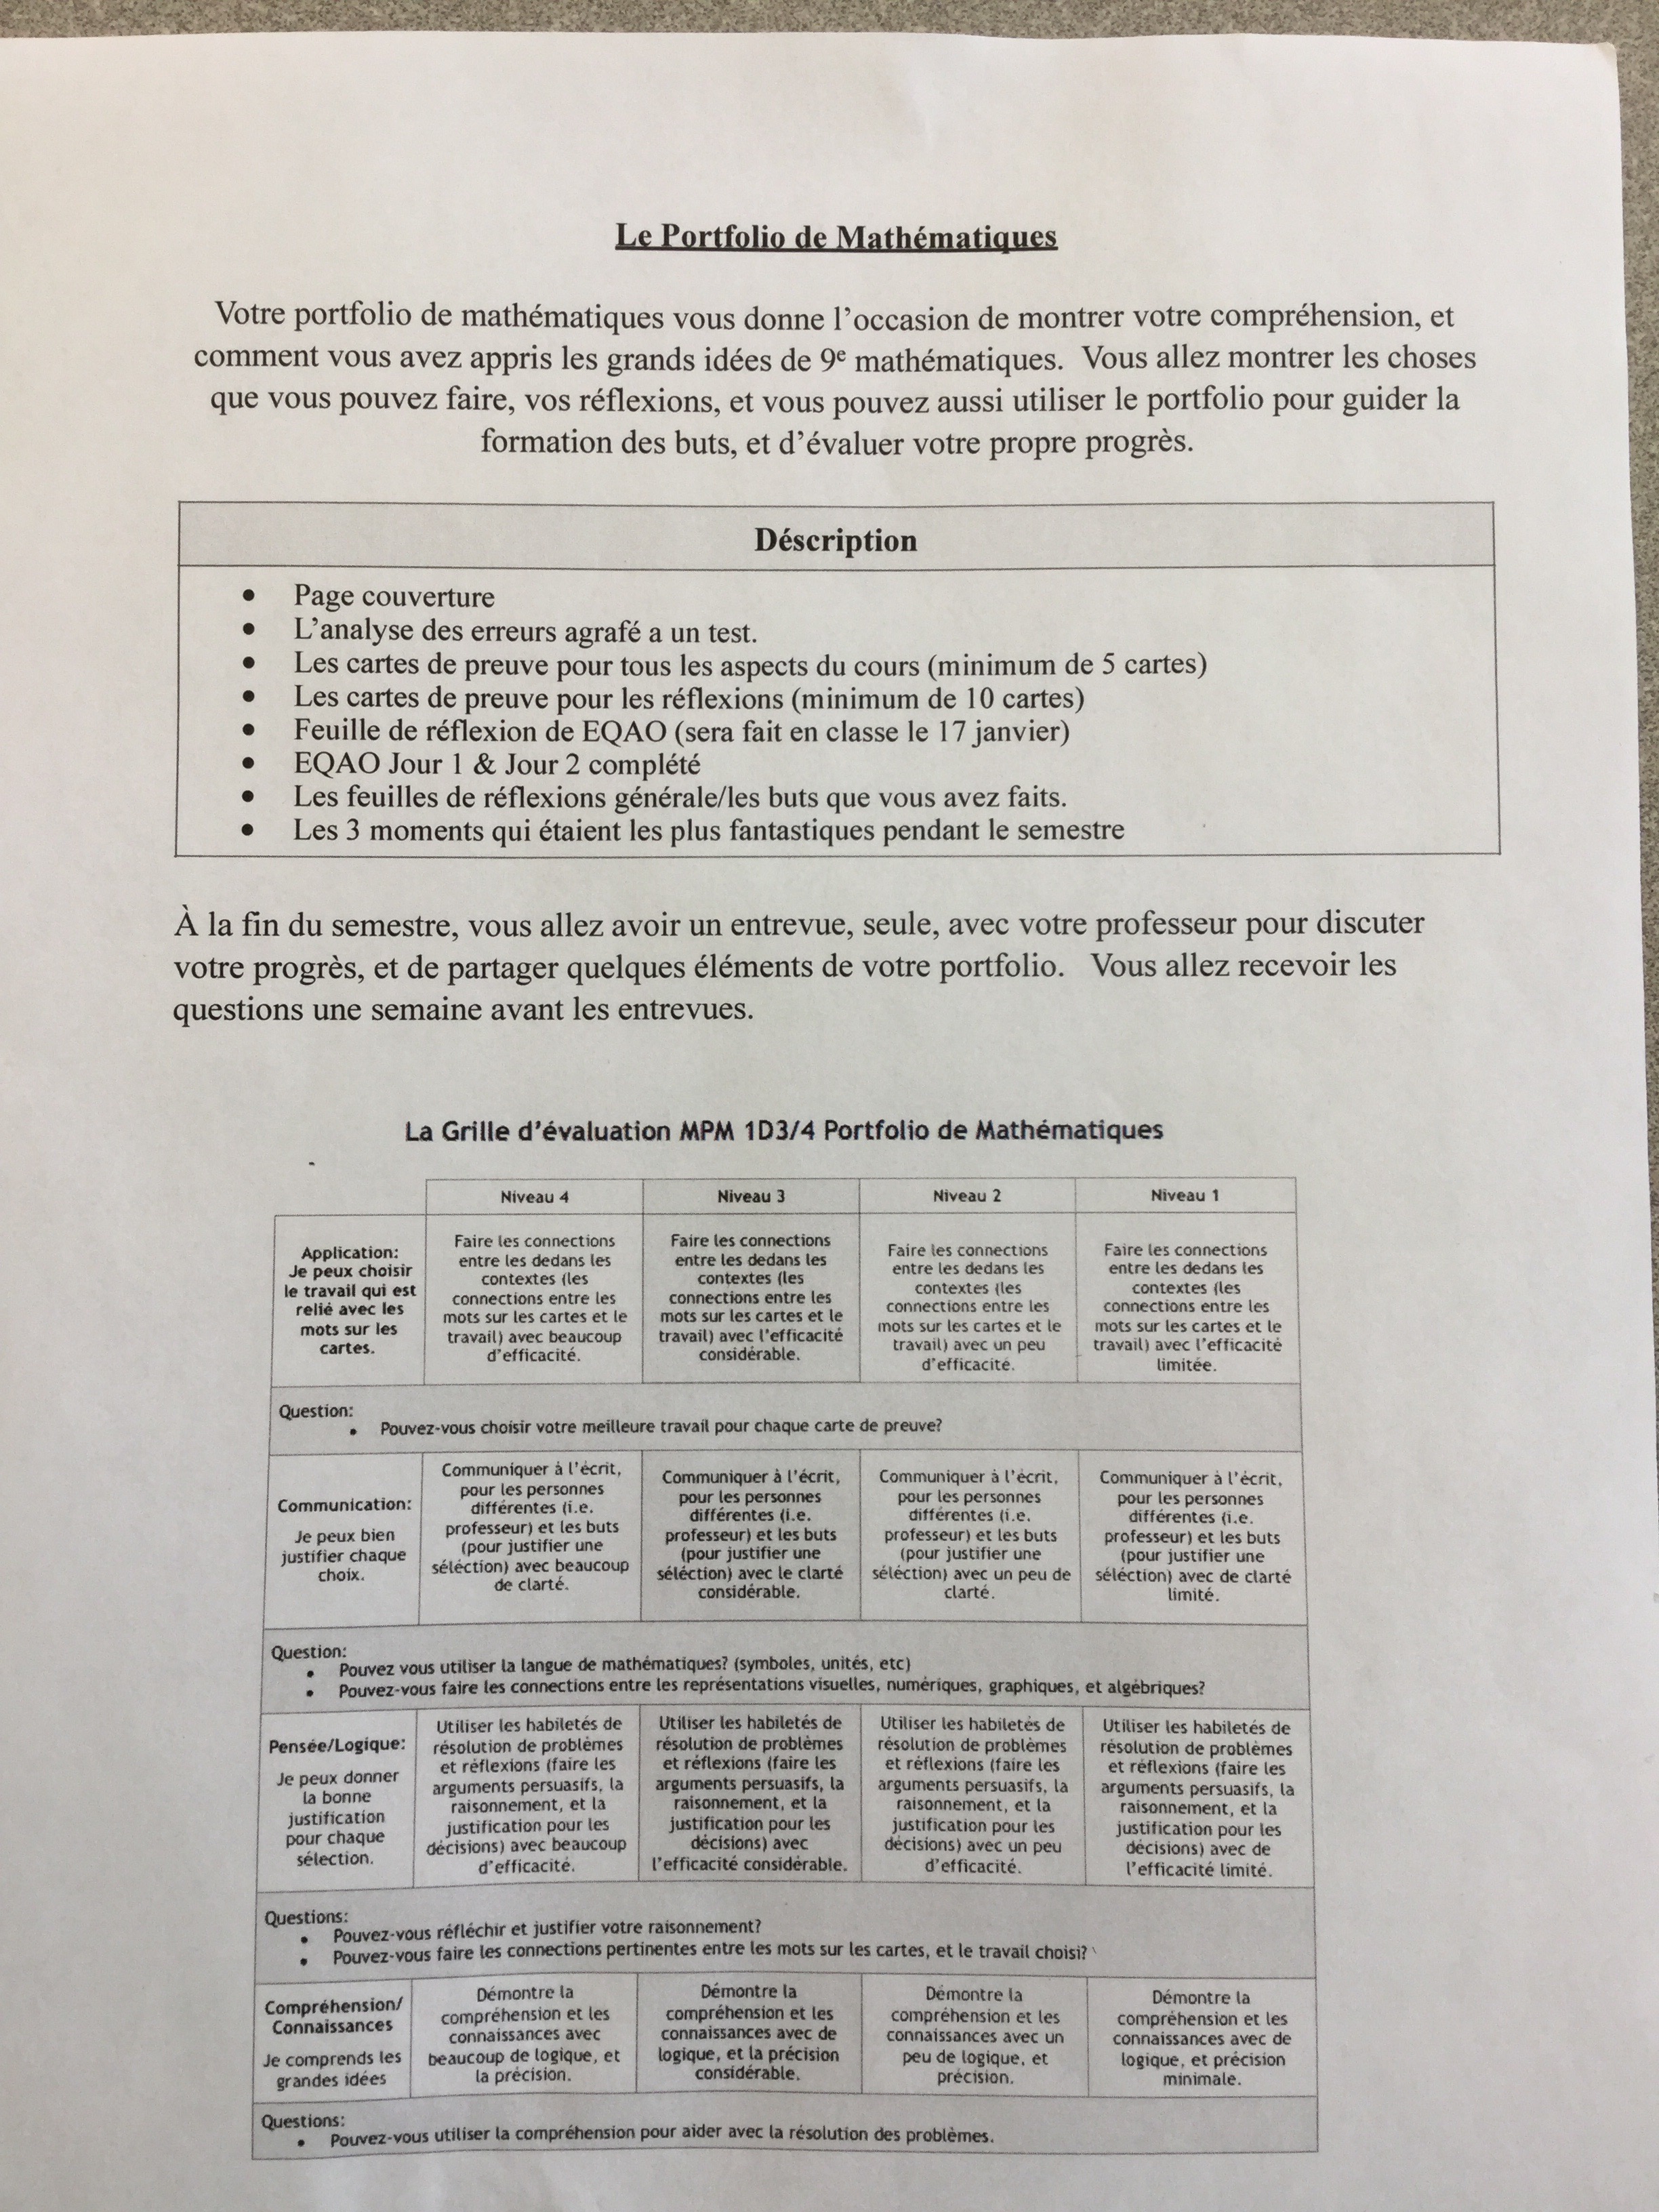
There will be a final task in class tomorrow (weather permitting).
Please share this information wih friends and classmates.
Grade 10’s
You know the review…it’s at the end of the book. Keep working on those questions. Email me if you have tried, and your friends have tried, and you are still stuck on questions. There will be a day of review tomorrow (likely parabola highlights), and the exam on Thursday.
Grade 11’s
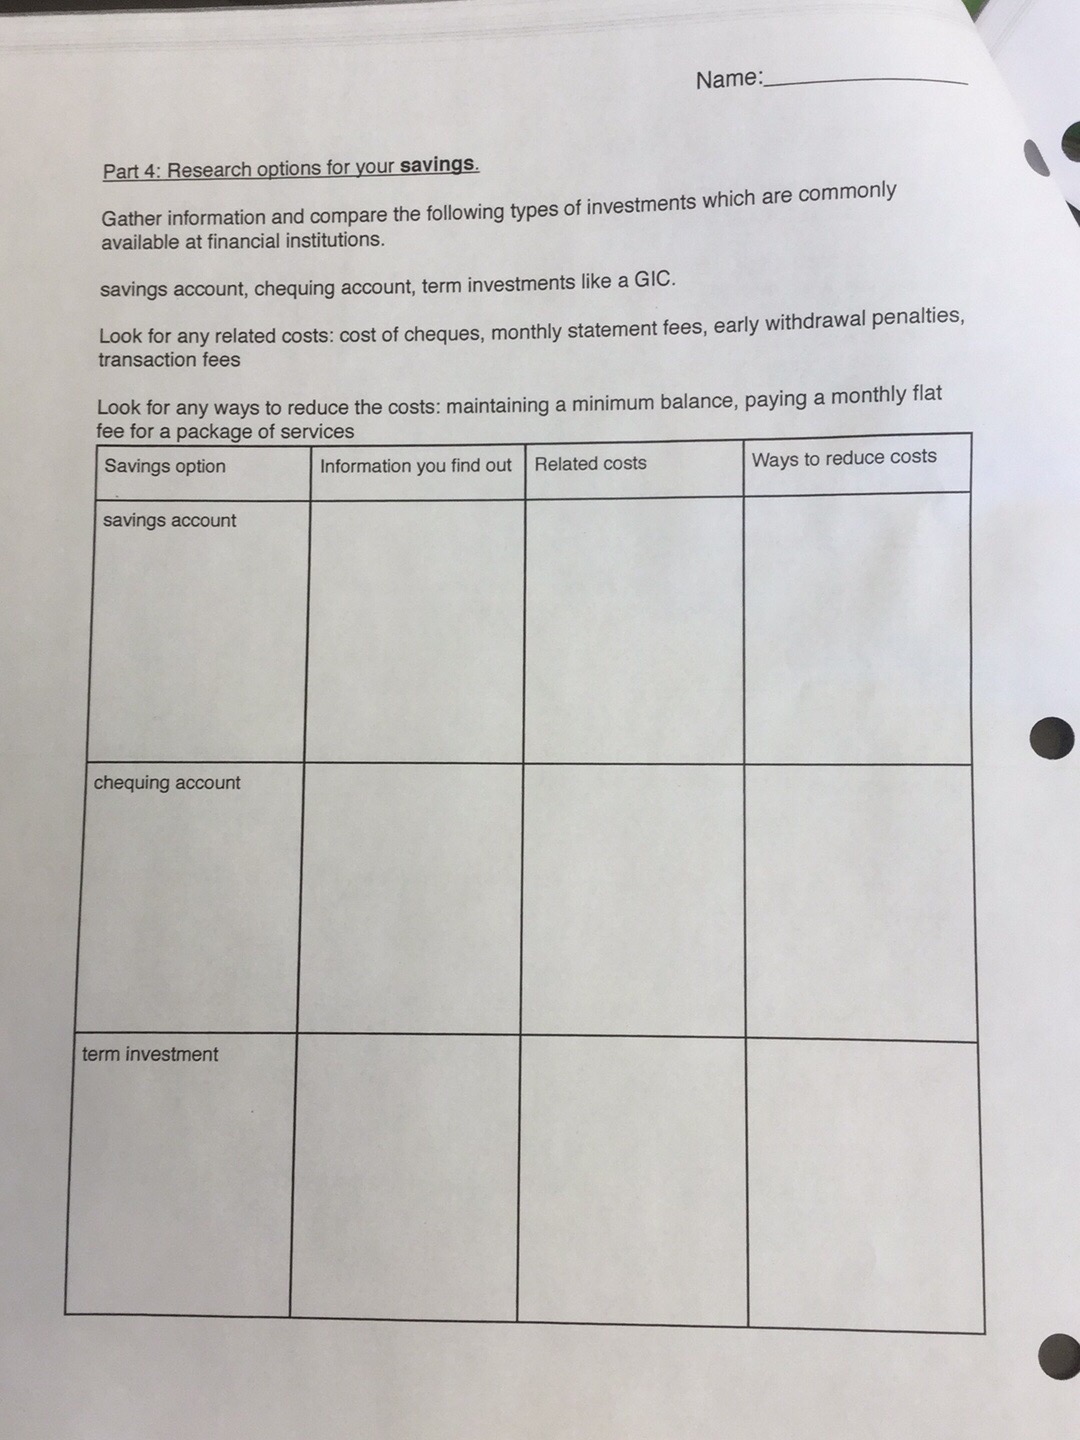
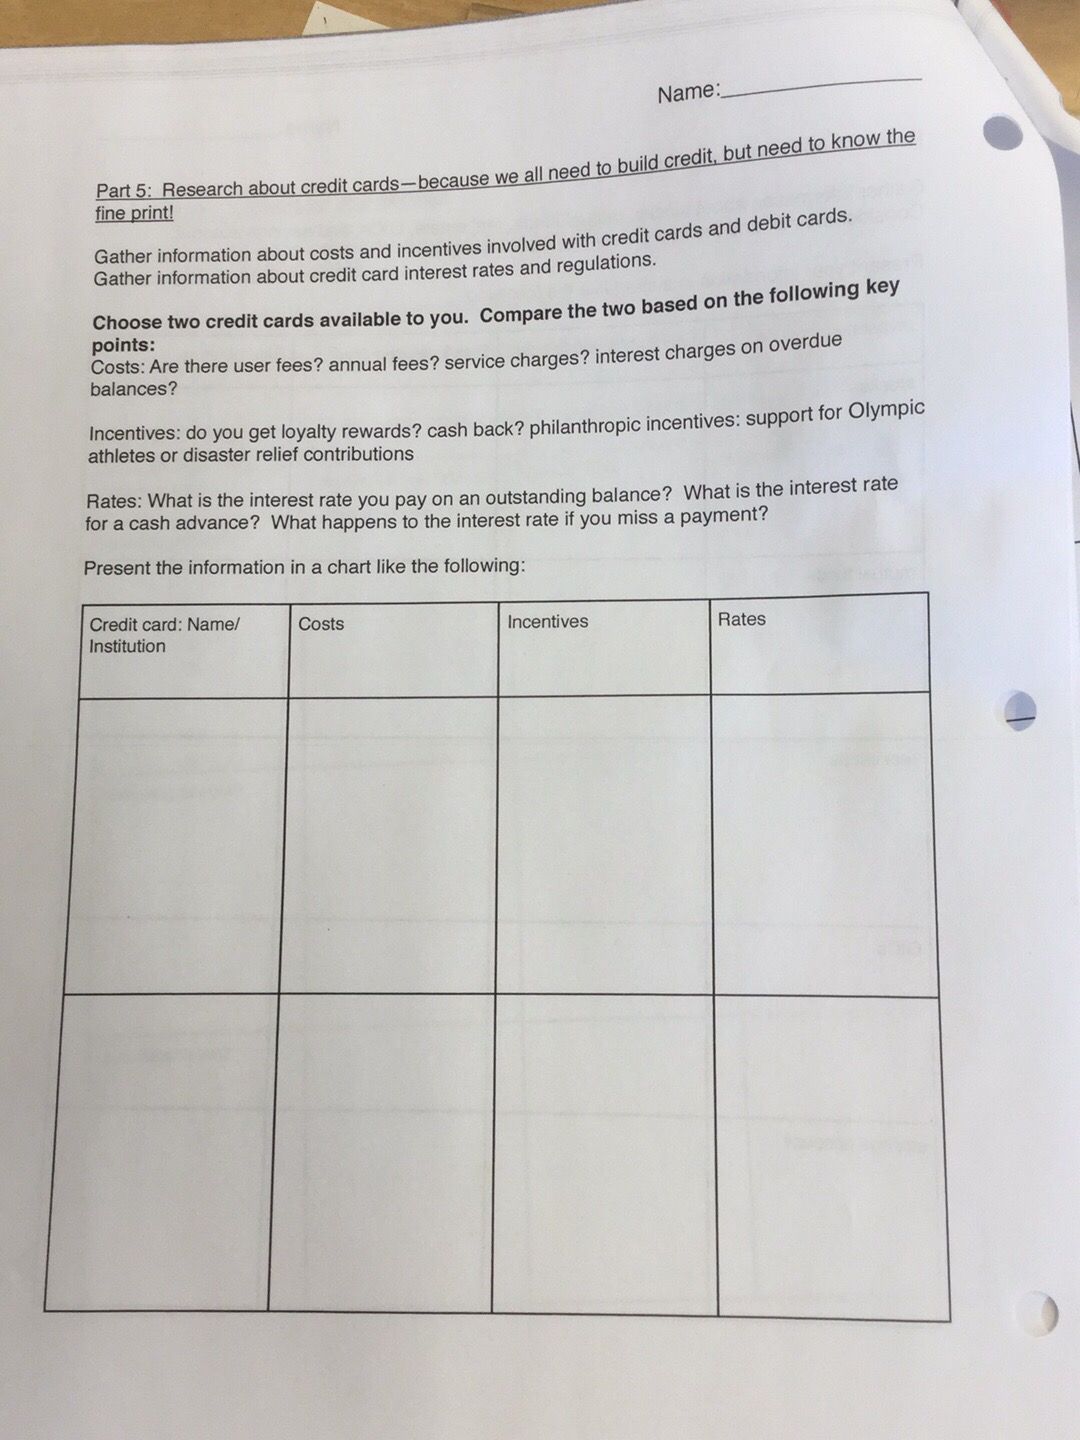
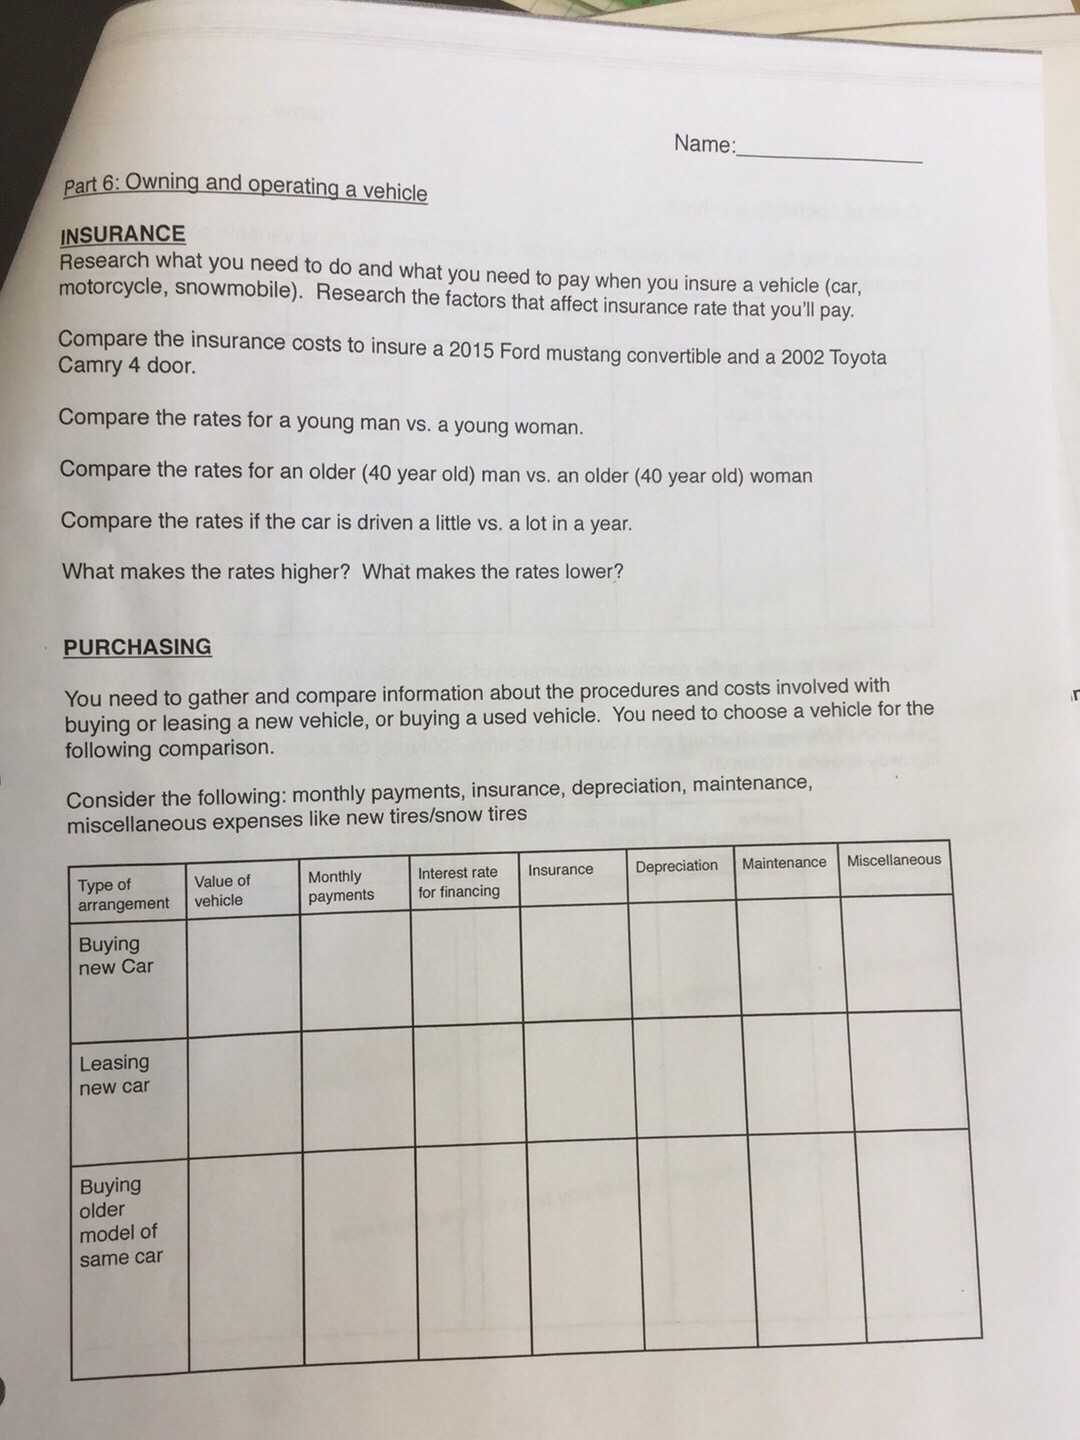
You have a financial math portfolio to be working on. Some of you might be looking for the outline…. here it is. It’s due tomorrow. There are good resources listed in the prior blog post.


Your exam (part 2) will be on Friday, and it’s based on quadratics and exponentials, similar to what was on the test, and financial math, including simple and compound interest calculations, and a tiny bit of probability. Email me if you are stuck on what to study.
Financial math resources for grade 11s
Sites for Learning about and Comparing Services
- account comparison tool
- credit card comparison tool
- vehicle lease or buy calculator
Blogs about Budgeting and Saving
- You Need A Budget (they are selling an app, but lots of free advice too)
- Mr Money Mustache (how to save to retire early)
- Gail Vaz-Oxlade (the host of “Til Debt Do us Part“)
Financial Institutions (not a complete list)
Grocery store flyers/market information
Rental companies/search websites
Practice for EQAO
Tomorrow and Thursday we will be writing EQAO. Today we did a practice run to see what it feels like. Bring your calculators tomorrow grade 9s!
Working on representing math concepts
When we look at a visual pattern, we can analyse it in a few ways, and depending on how we view the pattern, we’ll have a different algebraic expression.
 We are drawing more figures, and counting squares. We are watching how the pattern grows. Sometimes the numbers of squares increases by the same number each time. Sometimes the increase is not consistant each time.
Sometimes we look at how the parts of the pattern add up. Sometimes we look at what pieces have been subtracted.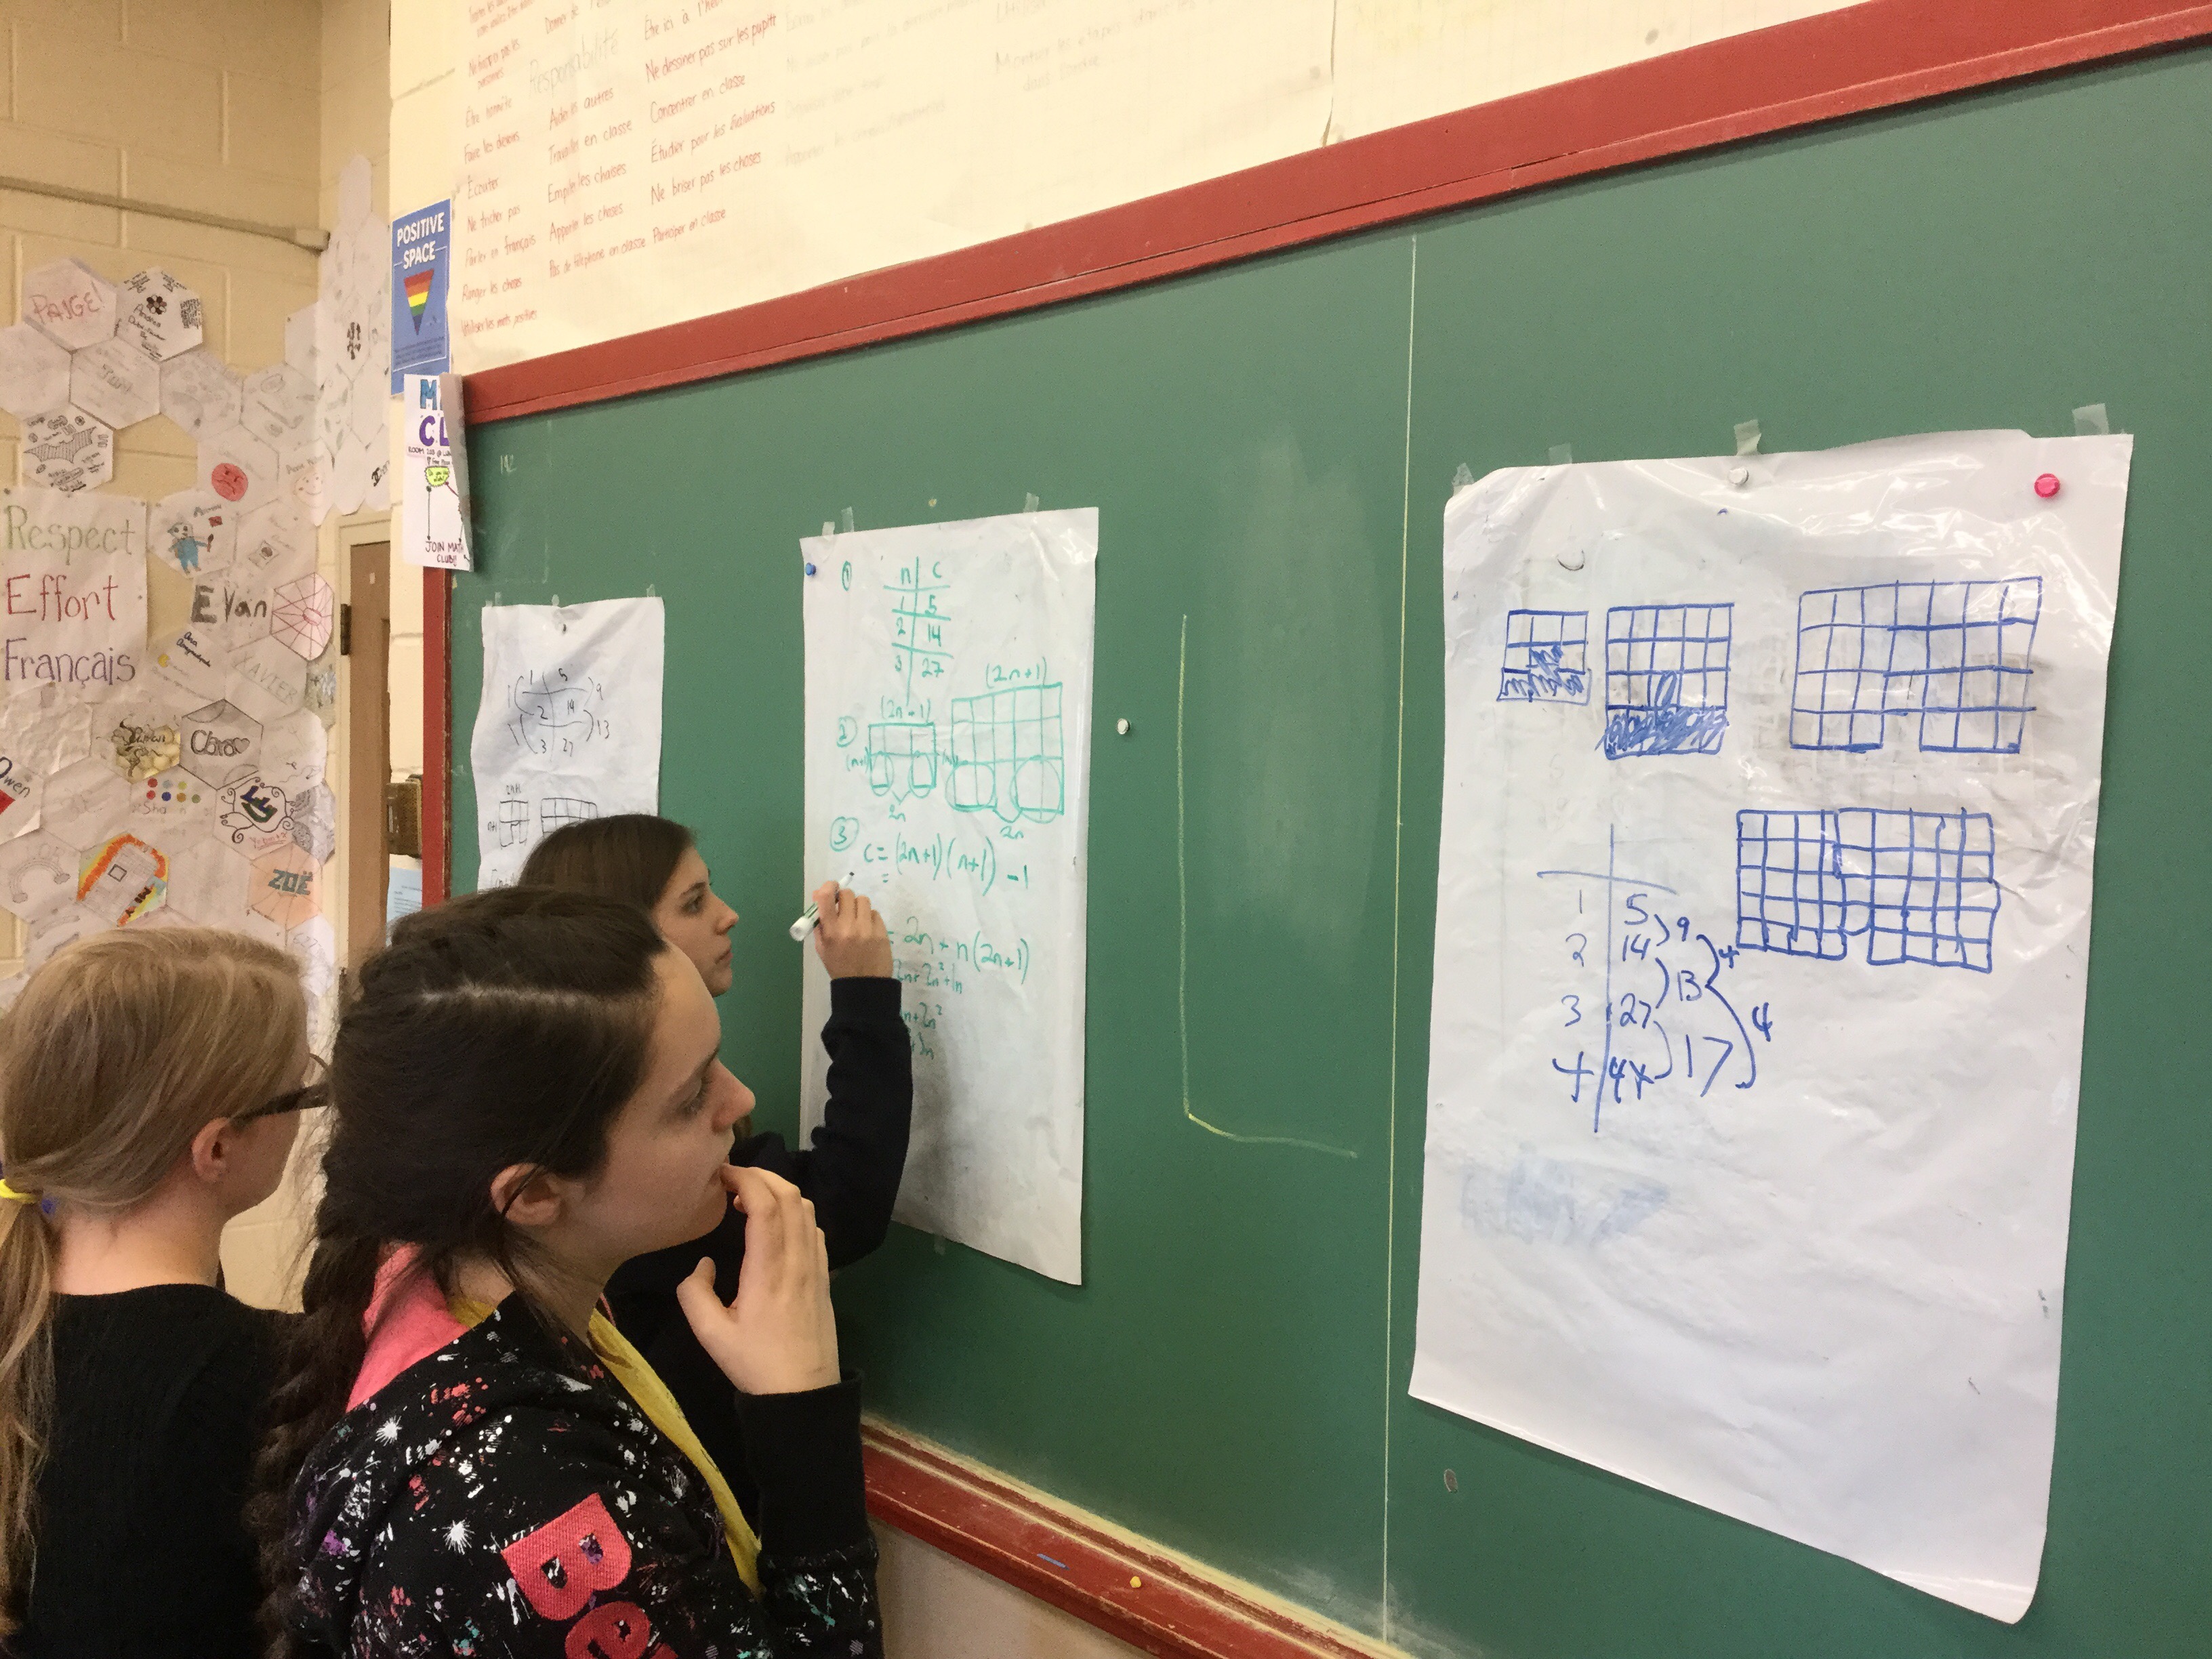
We try, no matter what the method to relate the visual representation in terms of the figure number.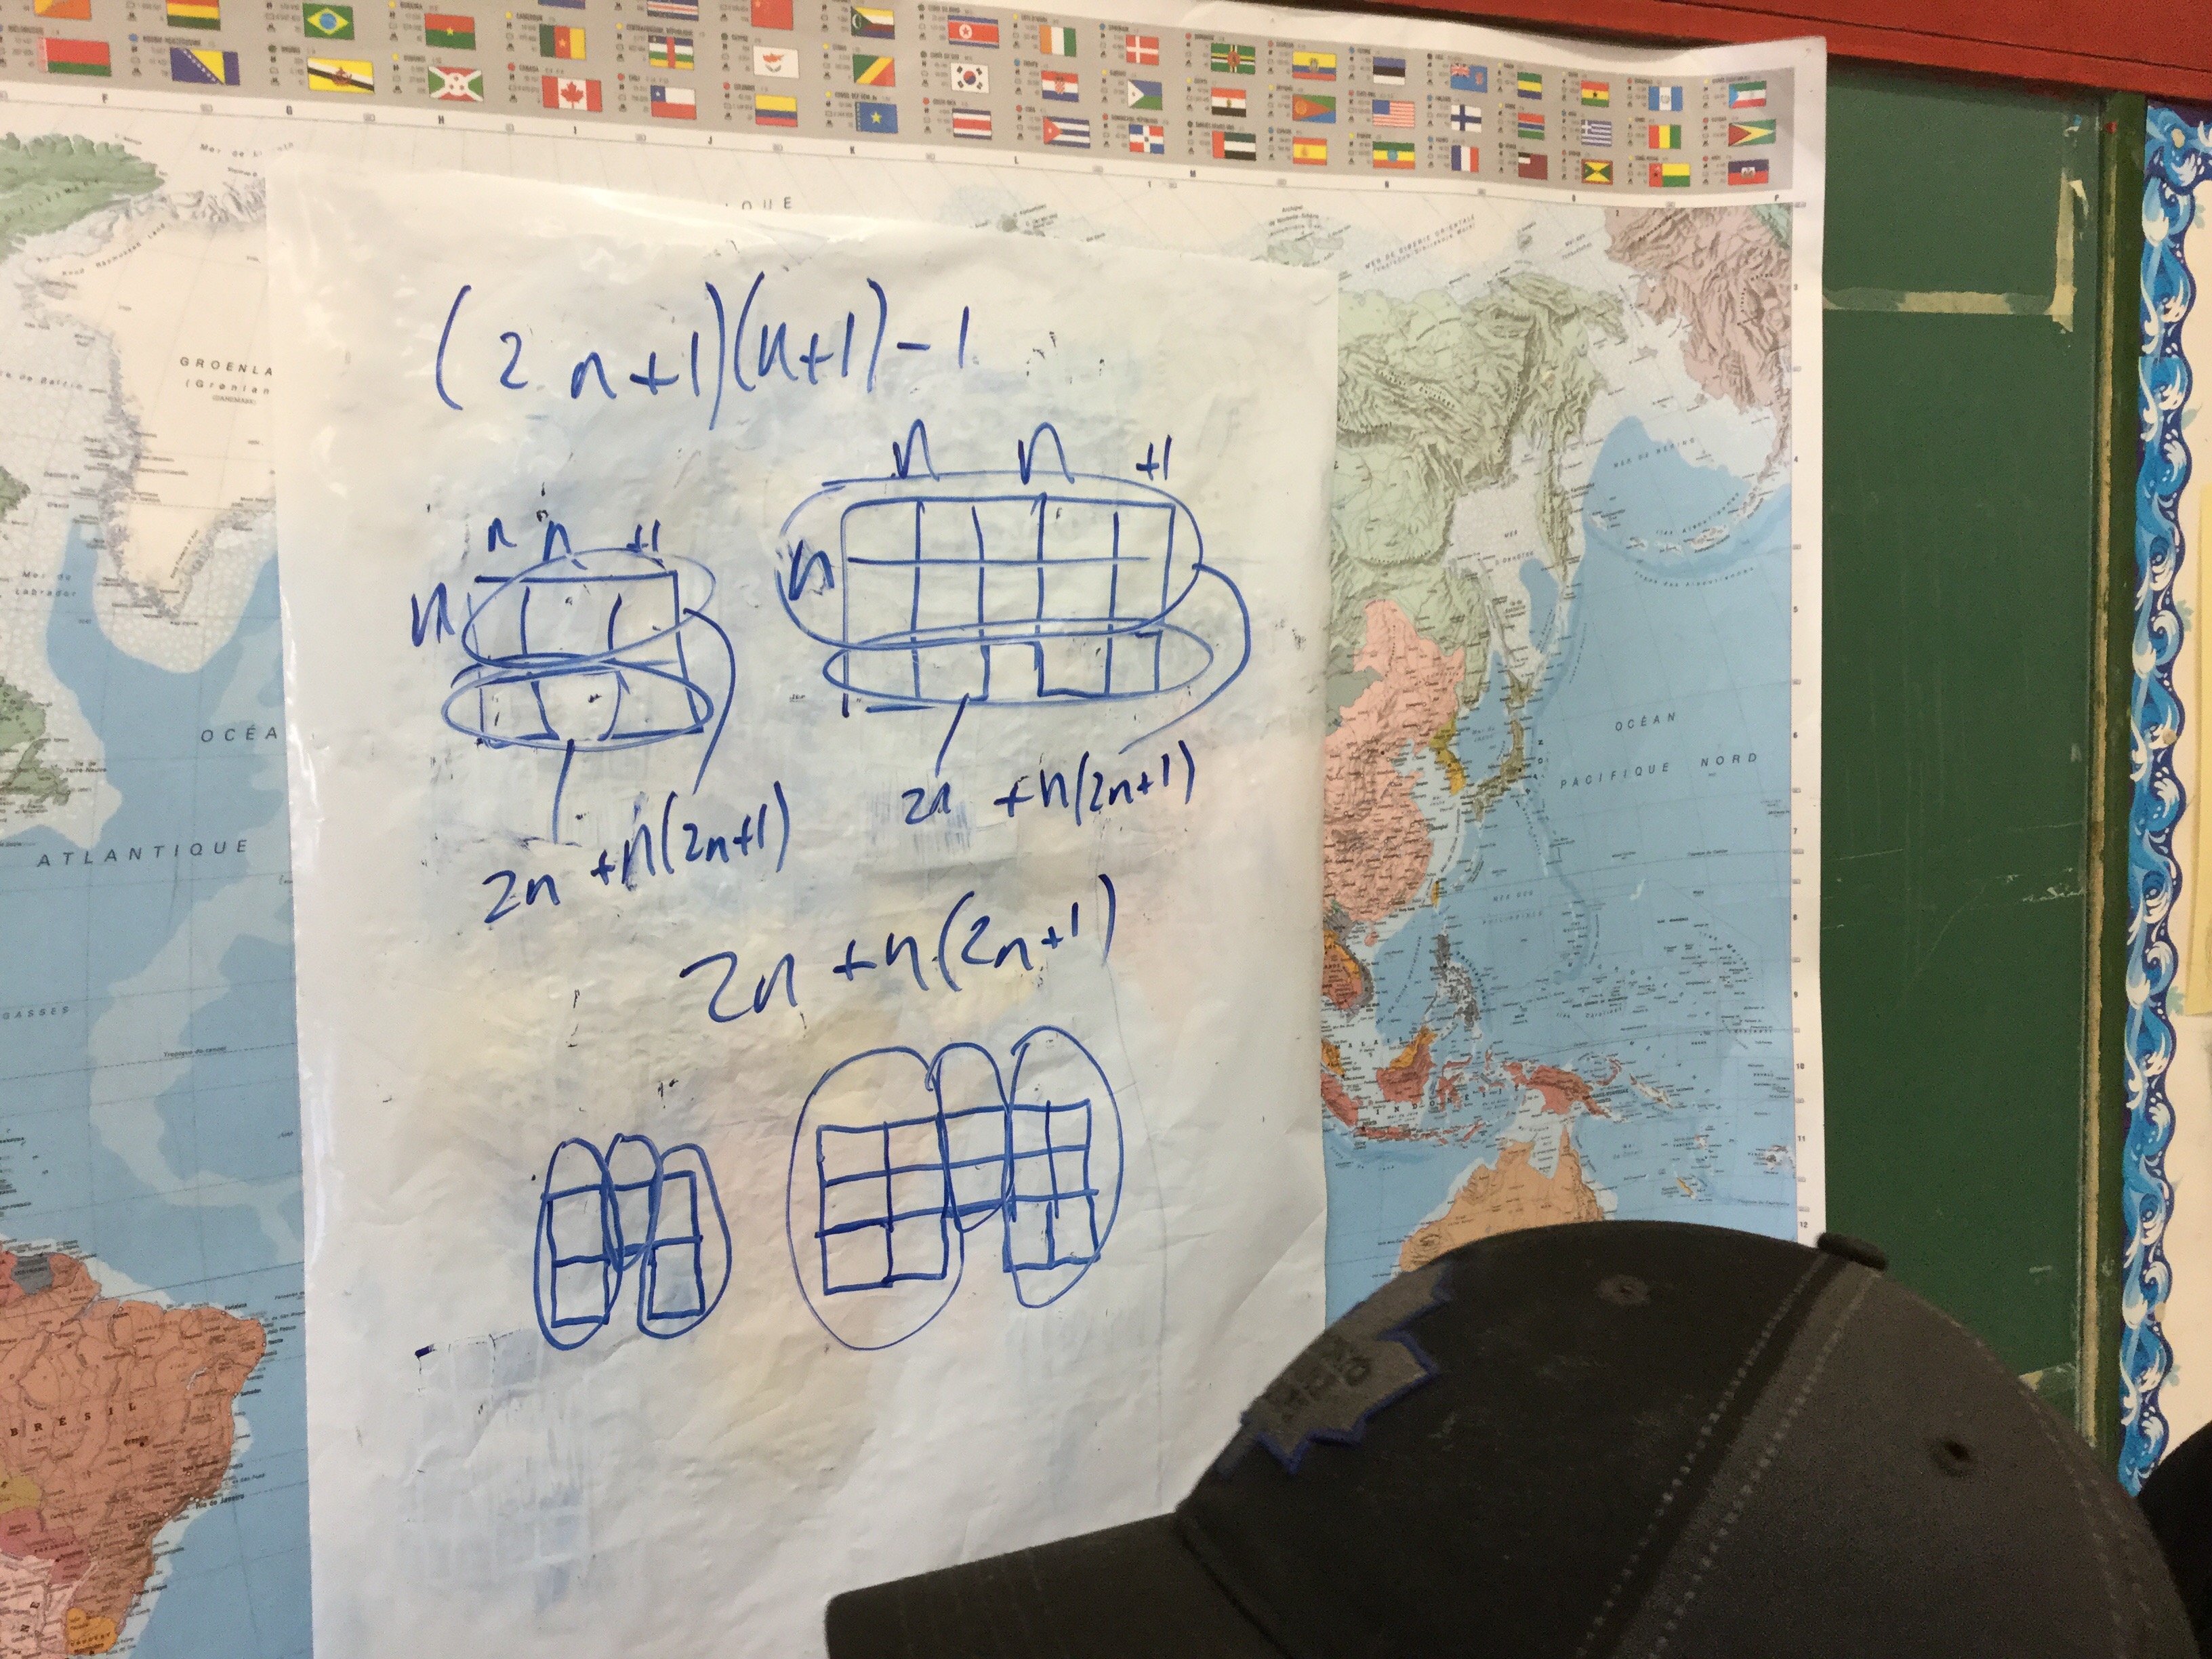
It’s very interesting that no matter how we express the original algebraic expression, each time they will simplify to the same expression in the end.

Learning about different Pathways
 We have a presentation this morning about different educational pathways for post secondary options. There are many choices to make and it’s exciting to think about the possibilities for our future.
More patterning and making equations
We made linear patterns, where the growth is the same each time…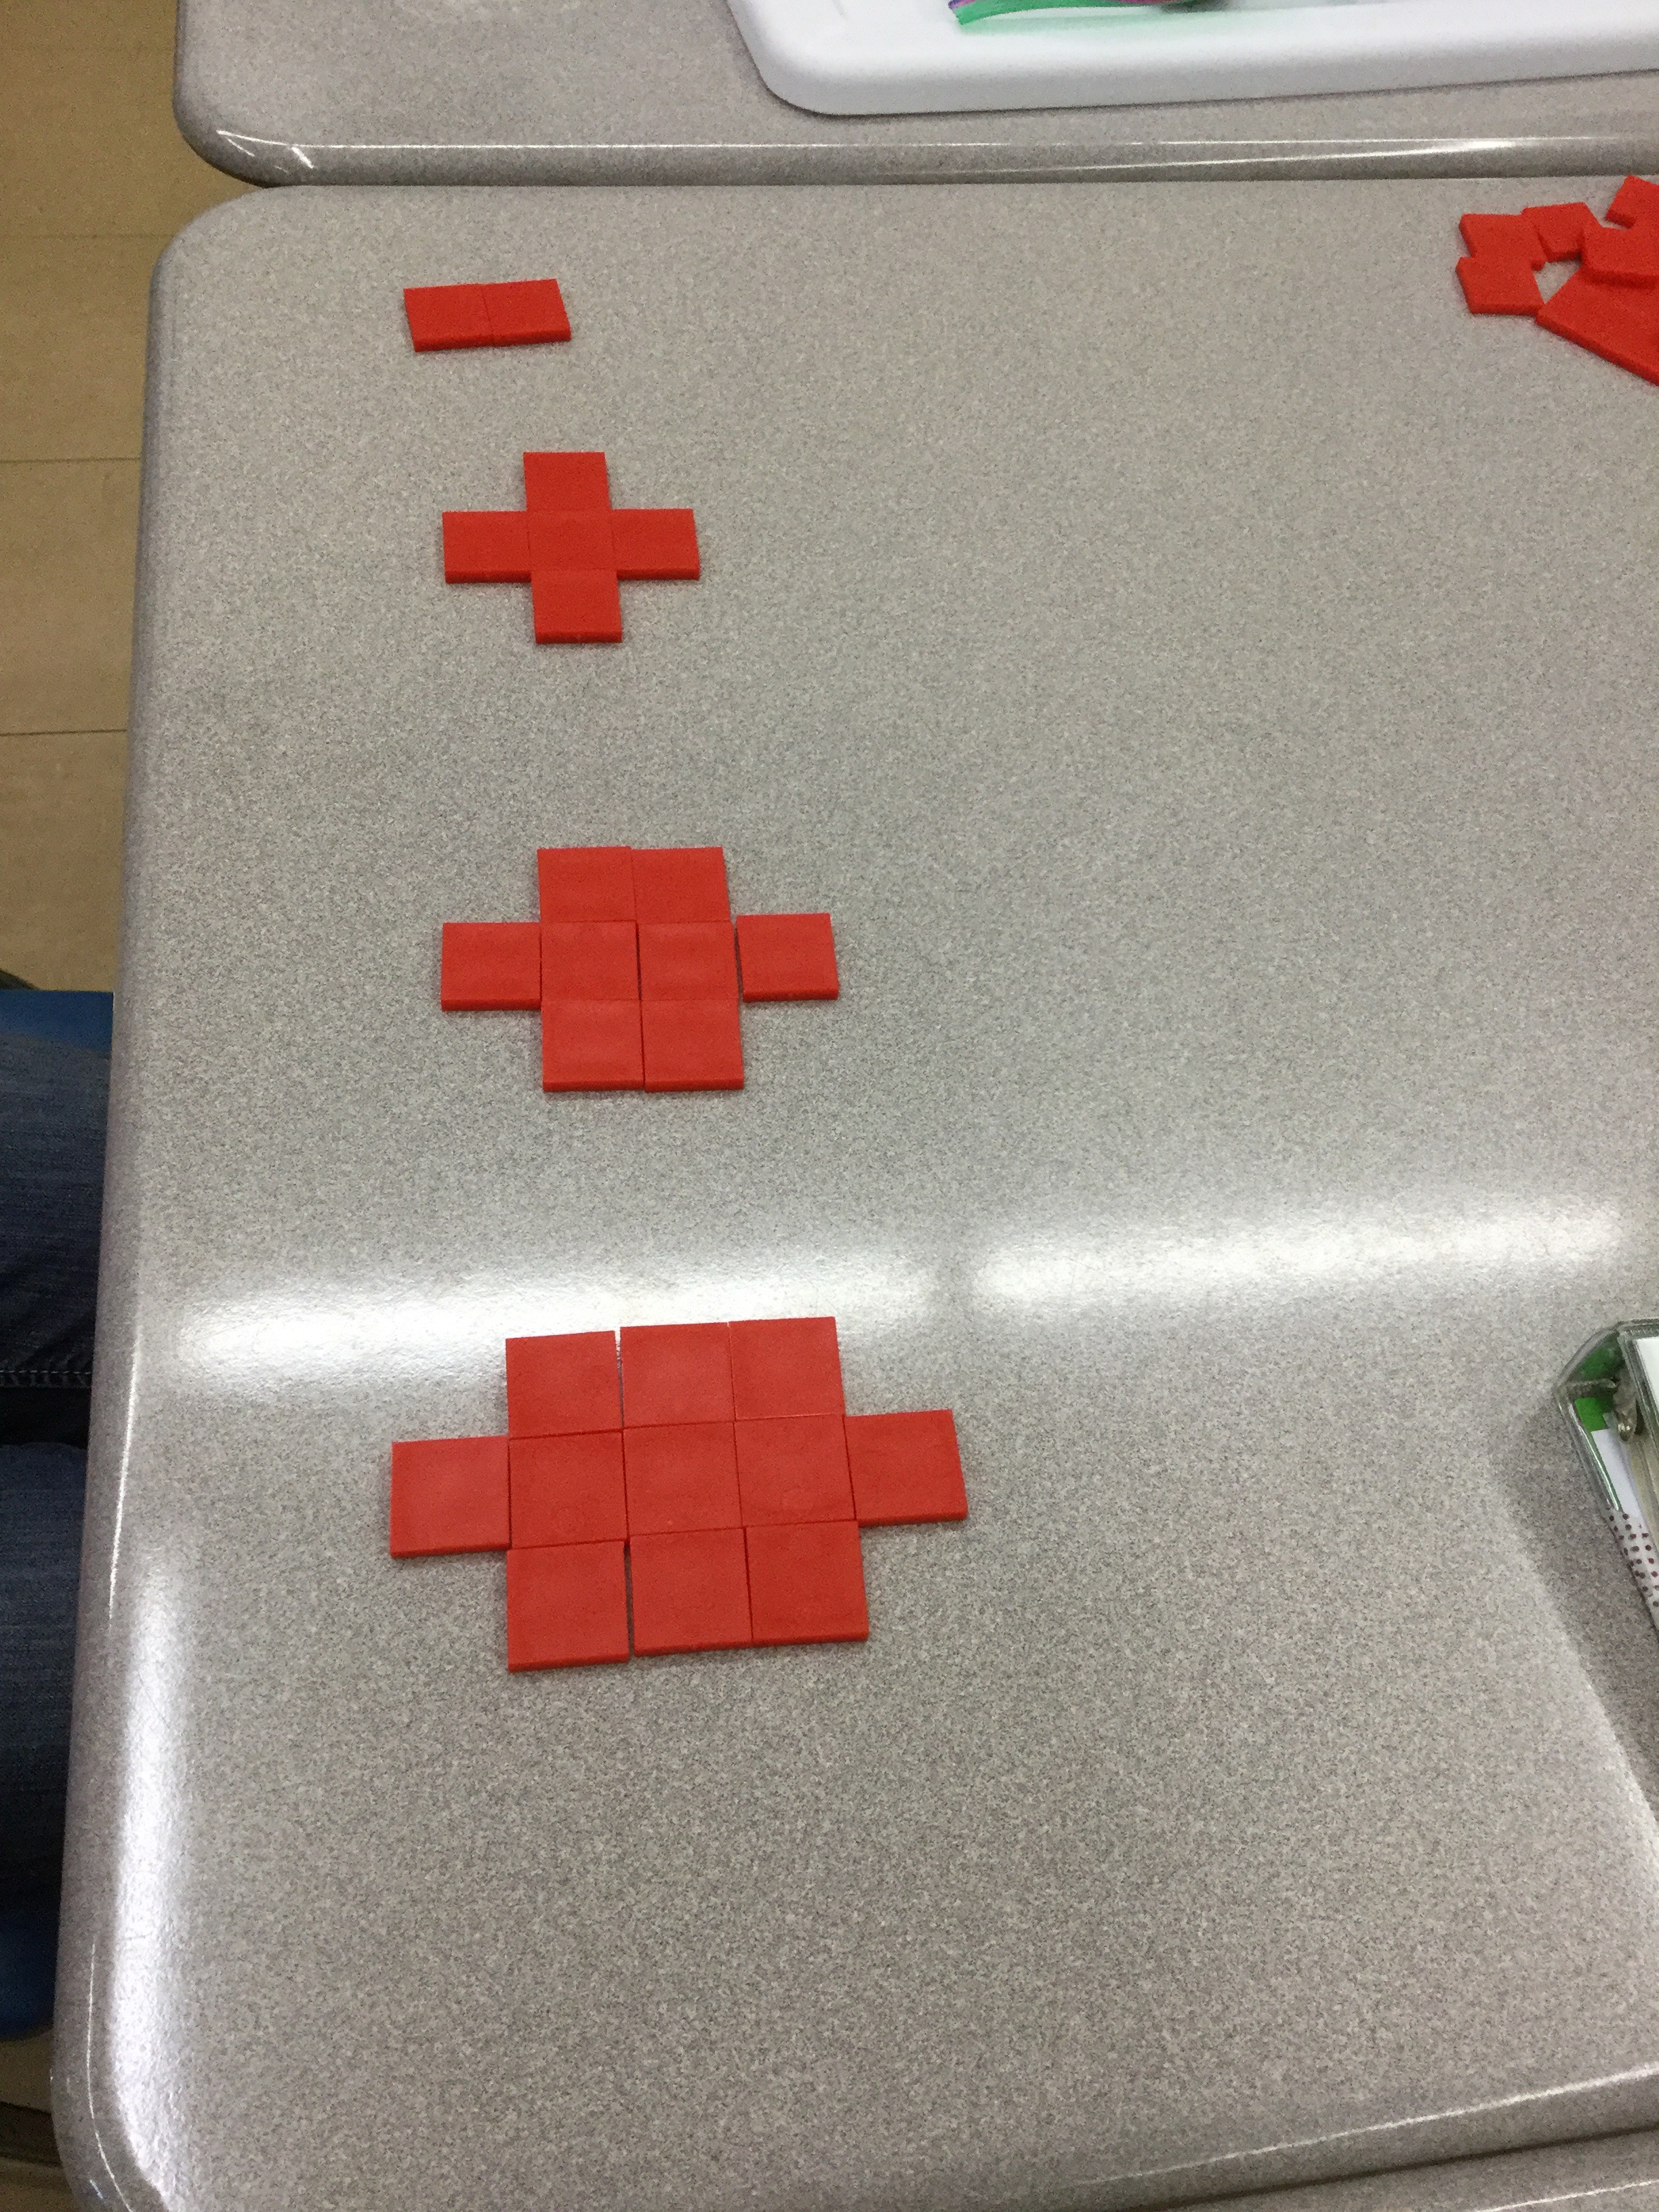

And some quadratic patterns which show growth that is not the same each time. He growth grows each time by the same amount.

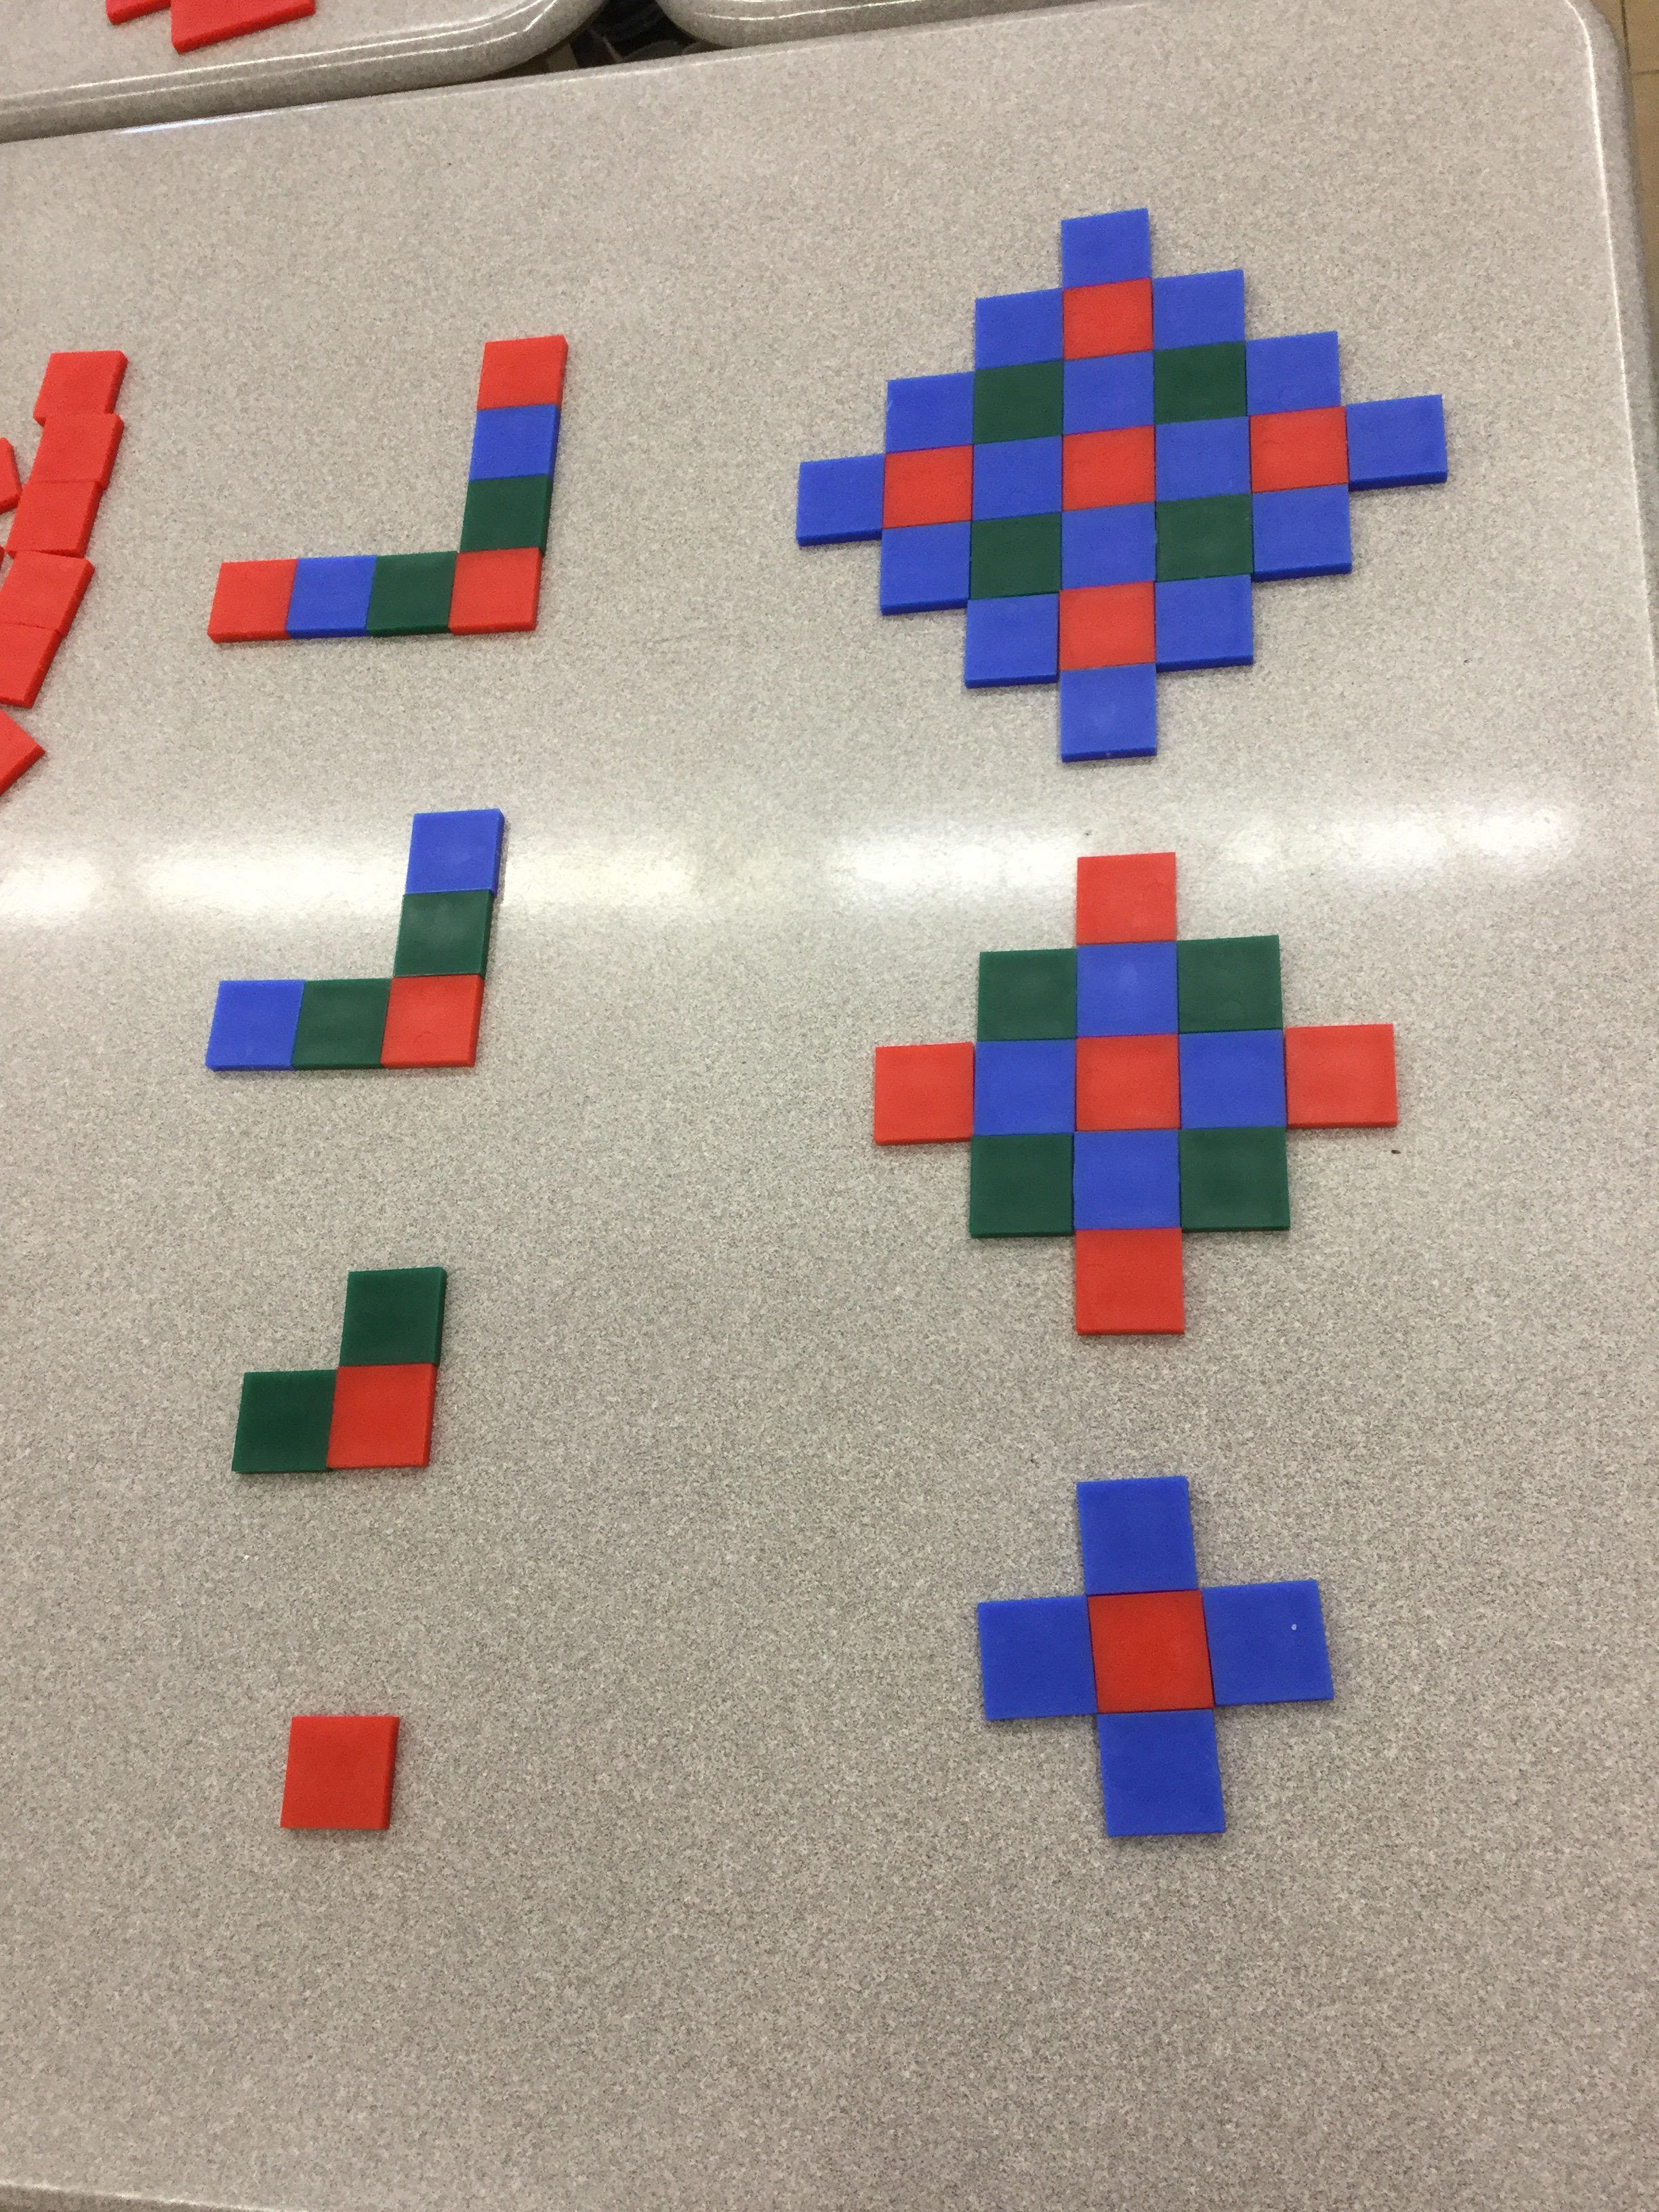
We are working on making the colours help us with creating equations.
Here we have 2n^2+3n. We have two squares that have side length n, and then we have three segments that are n units long, arranged to make a T.

Here we have a n by n square in green, and two groups of n, in blue, and a constant of 1. He expression for this is n^2+2n+1
It’s pretty neat once you get the hang of colour coding the patterns.
Parabolas
We built a growing pattern of rectangles that had dimensions (n+1)(n+2)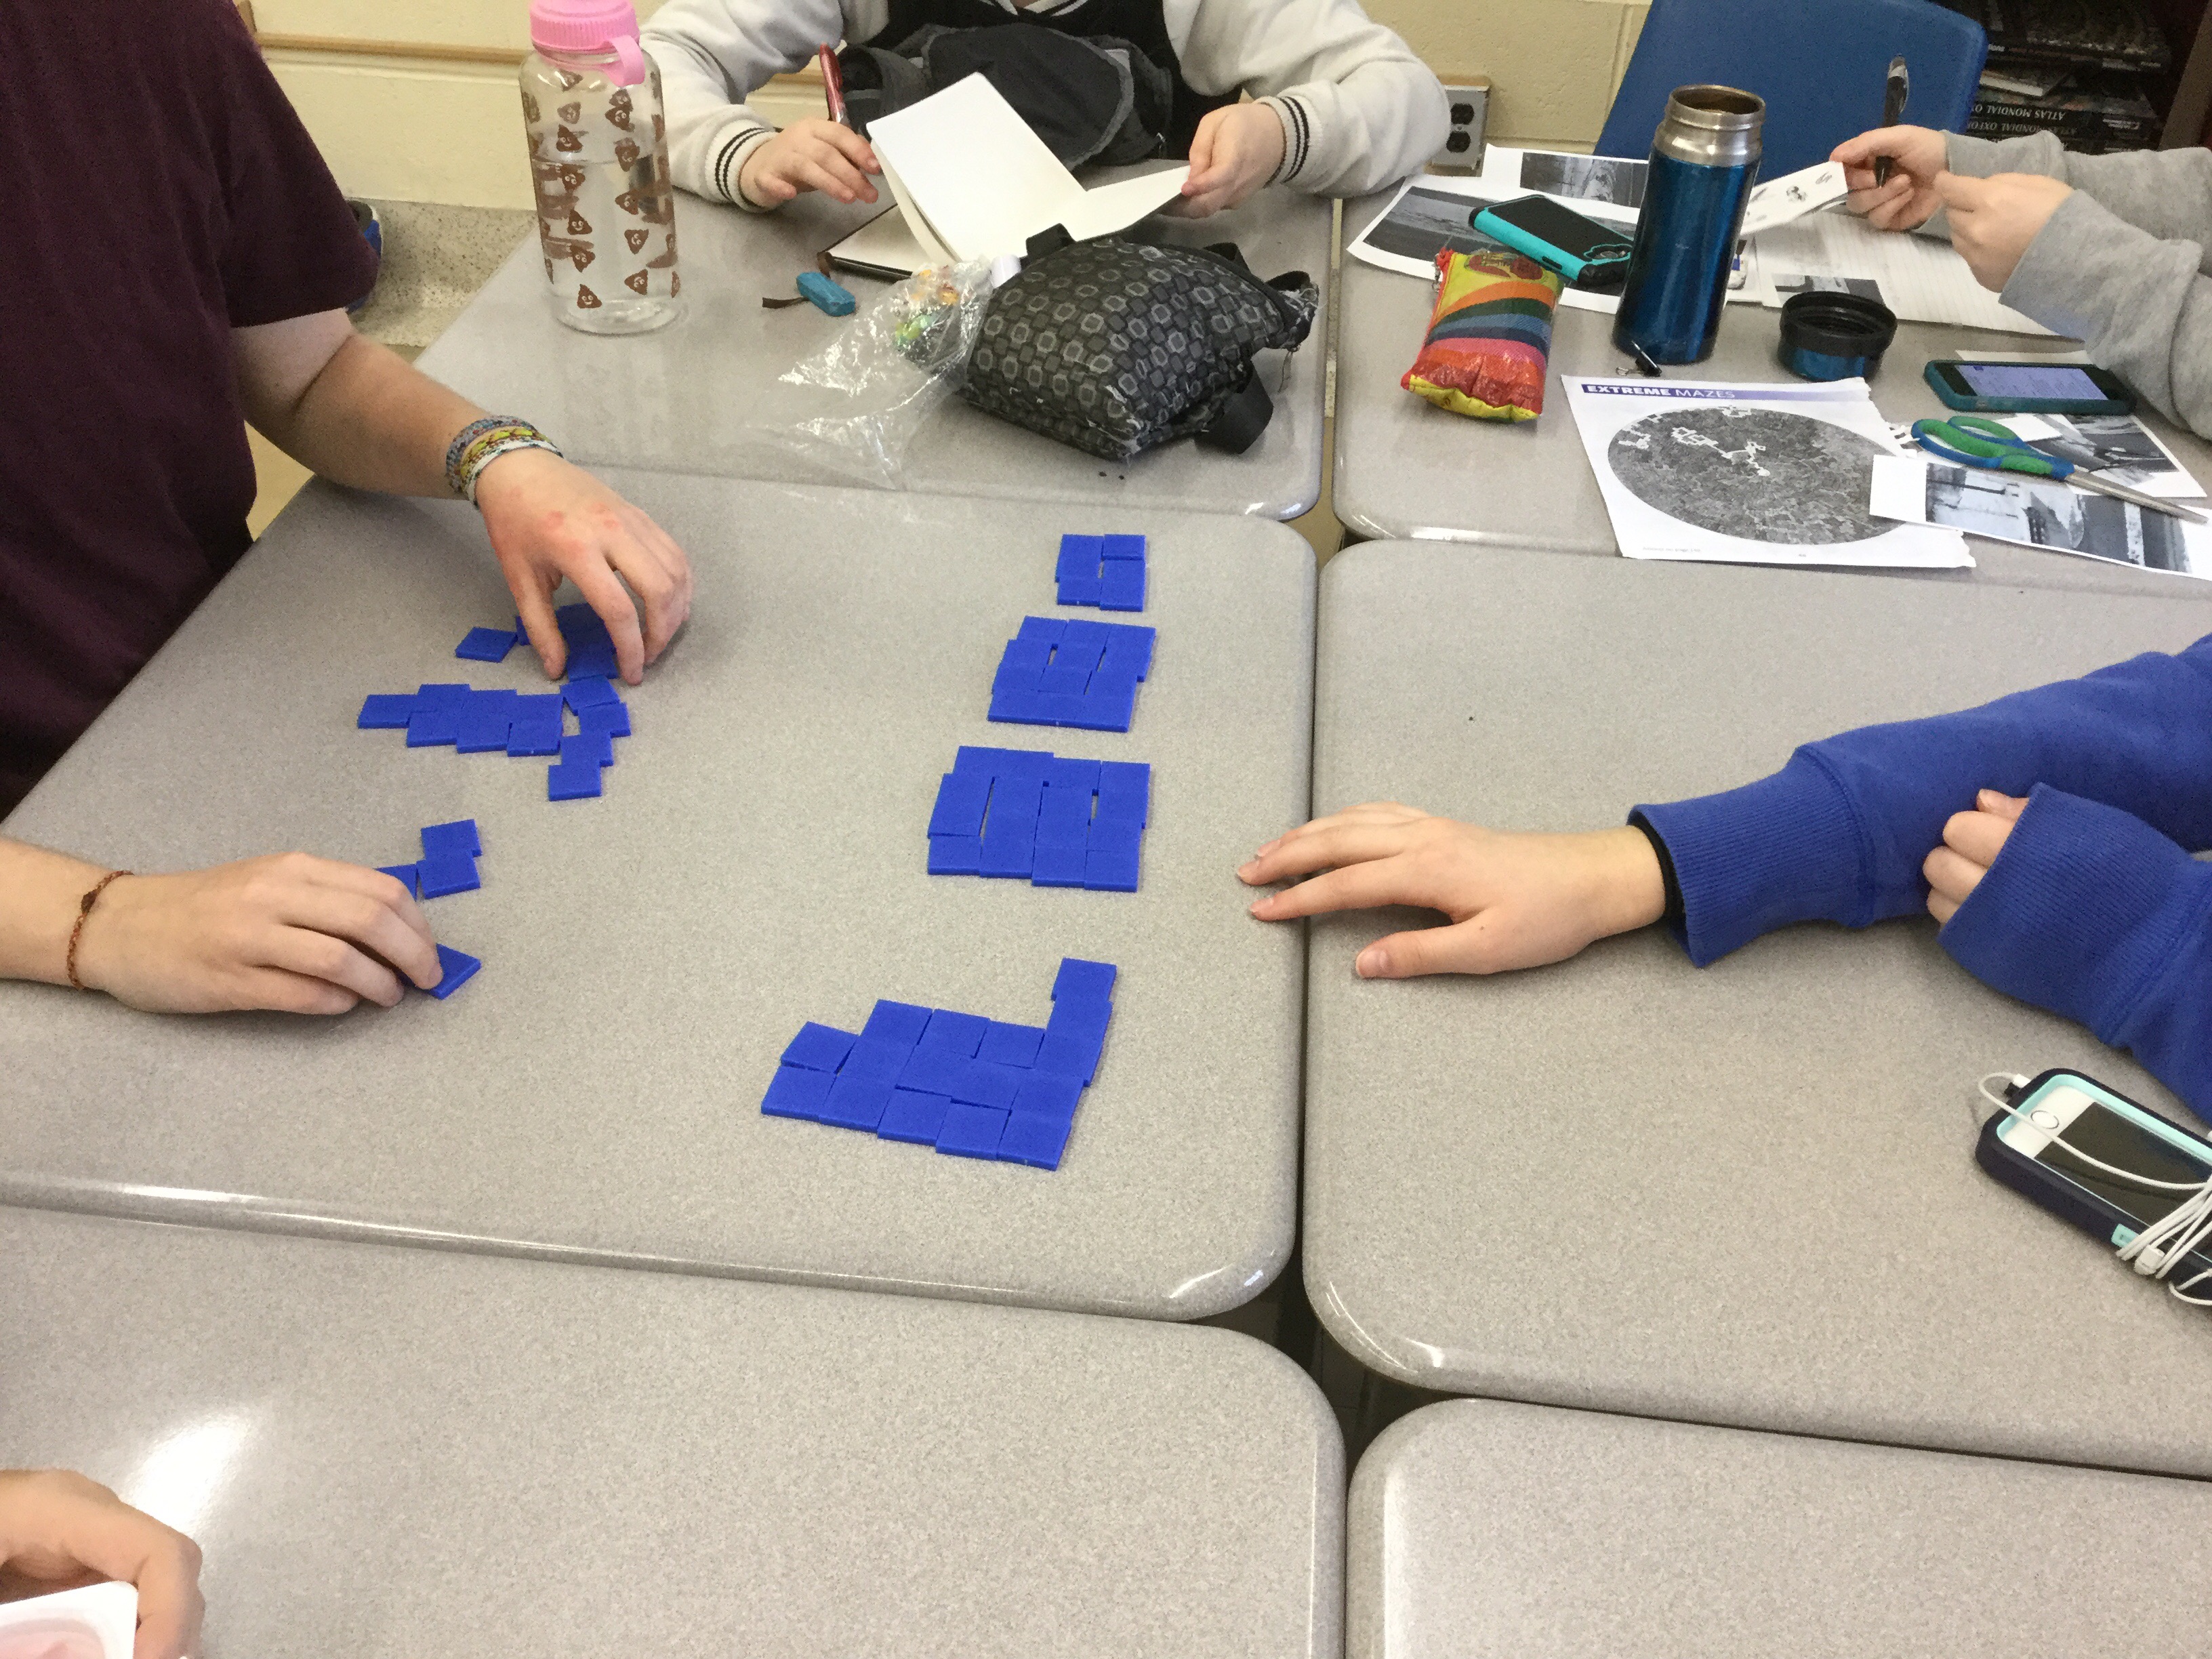
Next we lined up all the squares contained in each figure.

And we noticed that the step pattern was not consistent. The increases were bigger each time. Each time the increase got bigger by 2.
We plotted the data on desmos

And then we plotted the equation we made to describe the area of the rectangle
Y= (x+1)(x+2)

The equation hit all the points in our model! Pretty neat.
Taking a break for kindness
We used the last 20 minutes of class today to say thank you to some people at our school who might not regularly hear it.

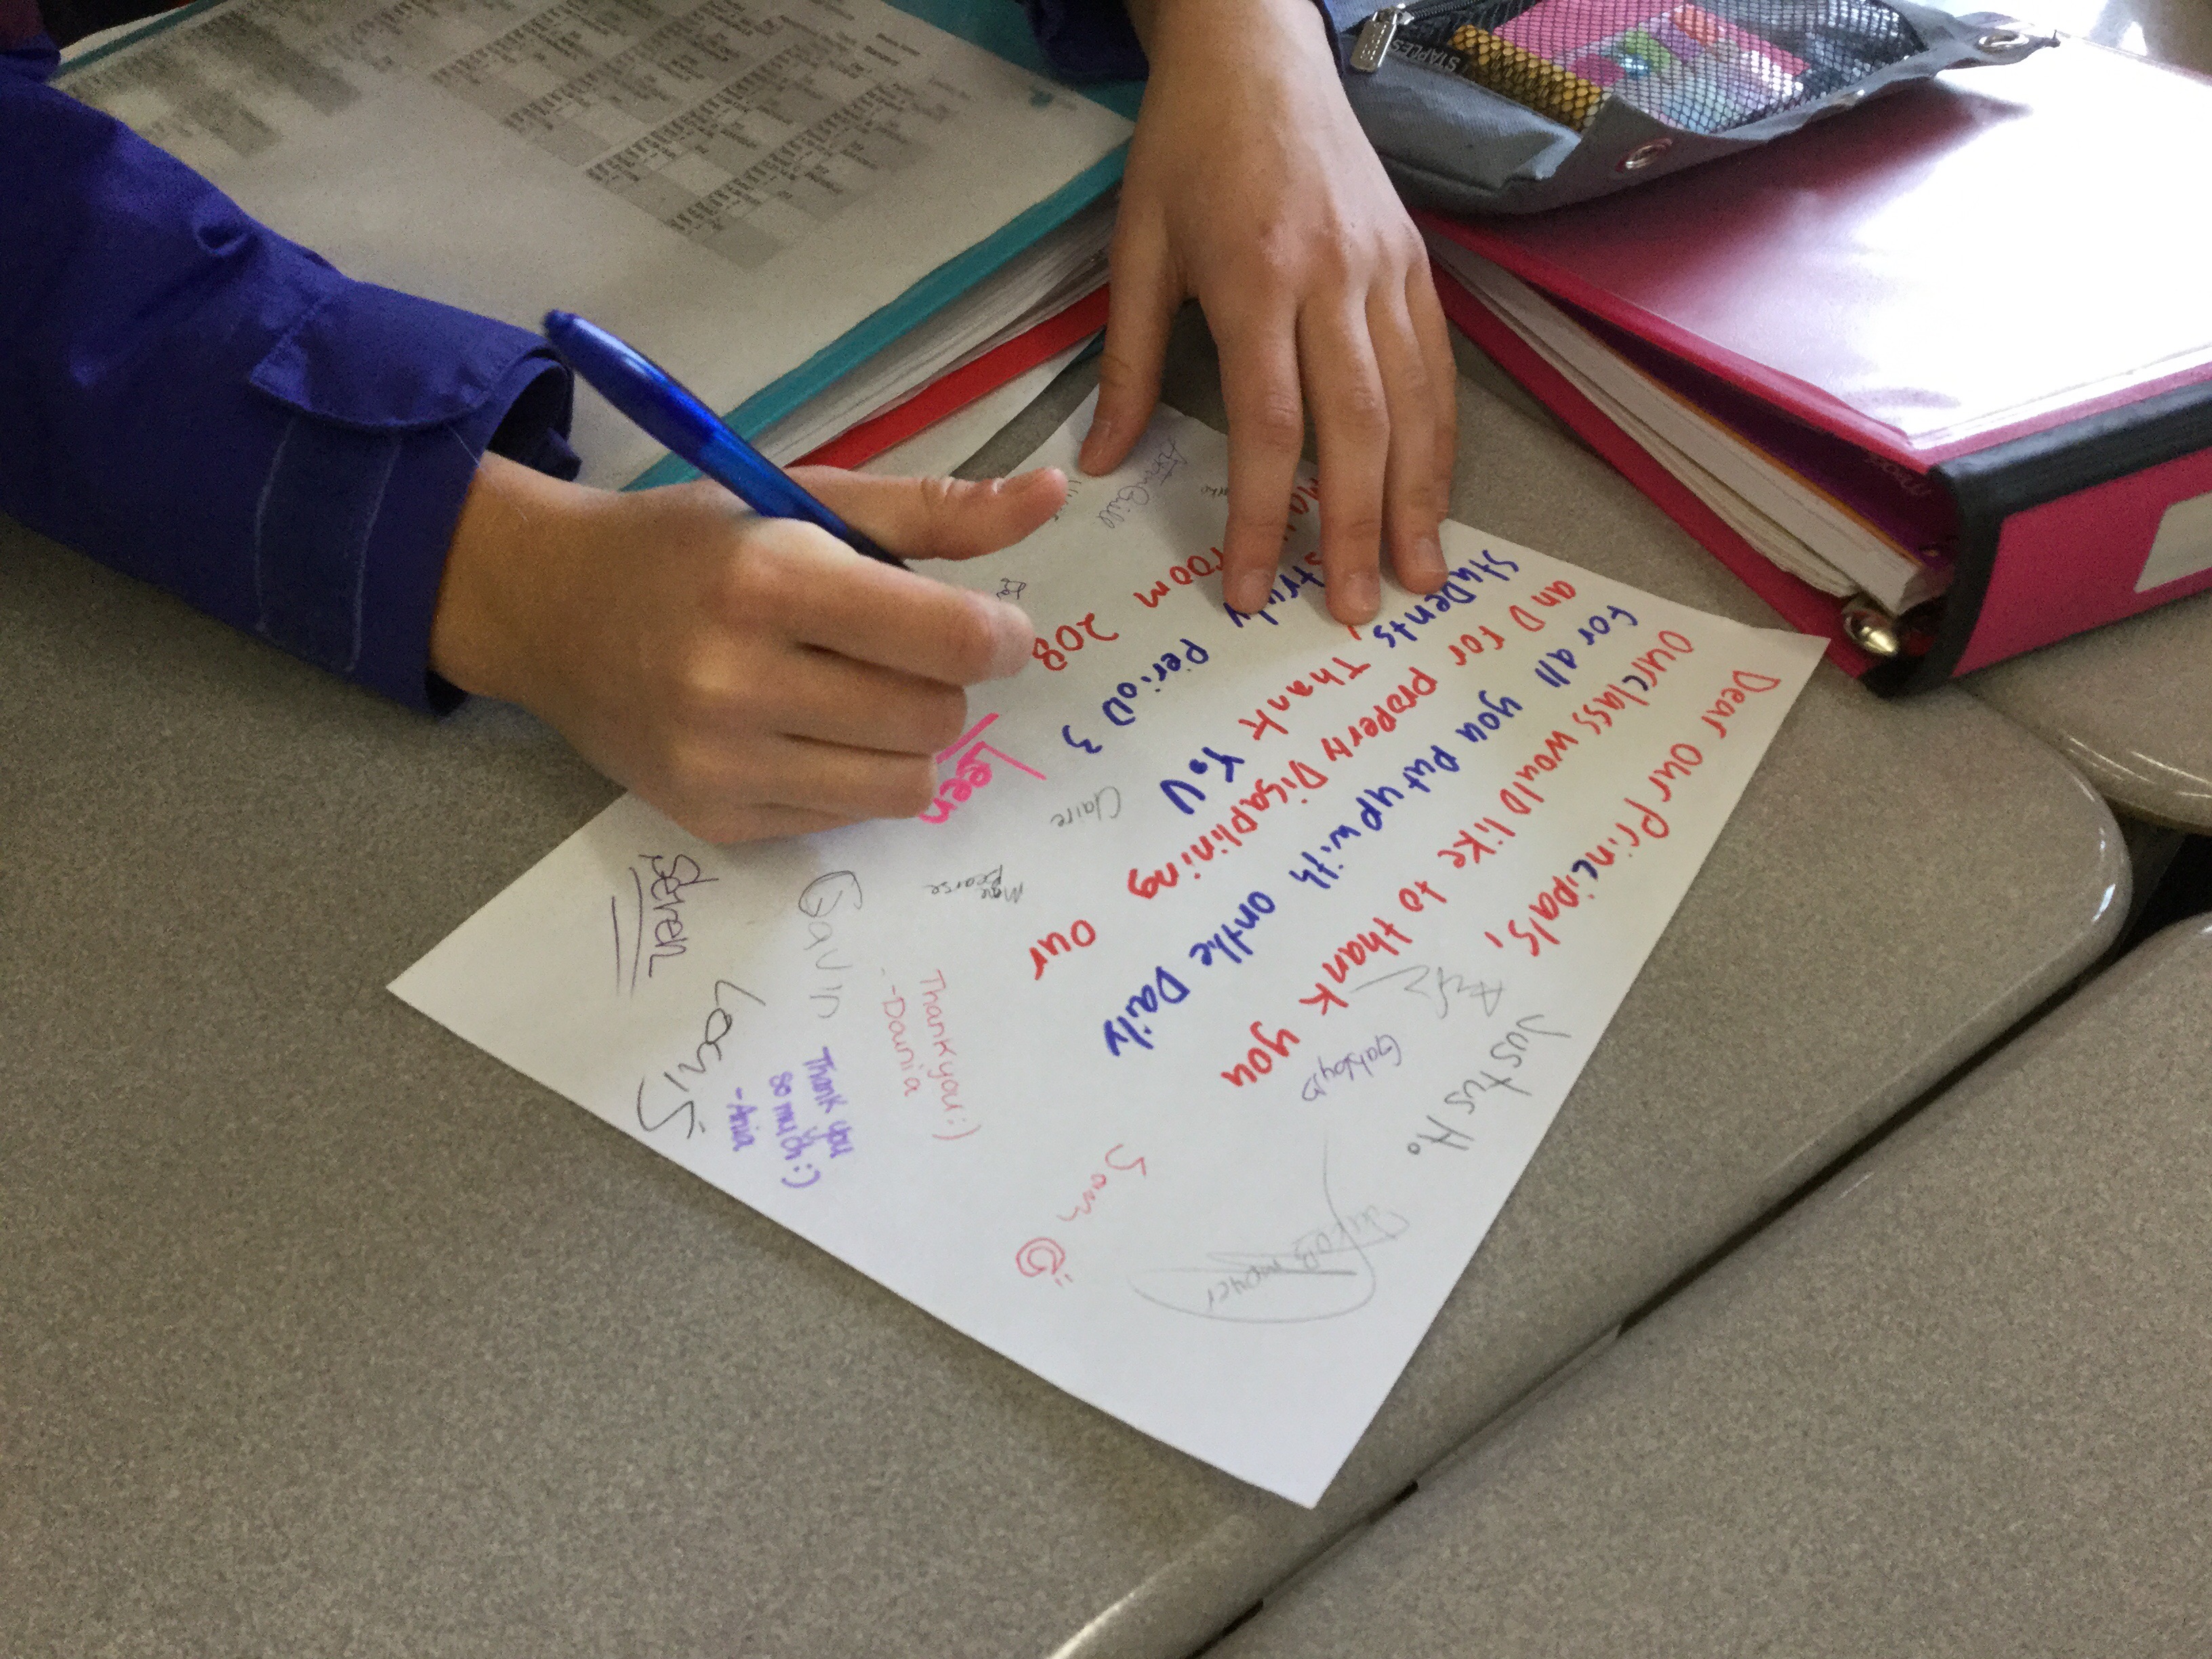
We thanked our admin team, the office staff, the custodians, educational assistants, student services team, and adolescent care worker.
