Graphing our bean growth
Grade 9s are graphing bean growth today!
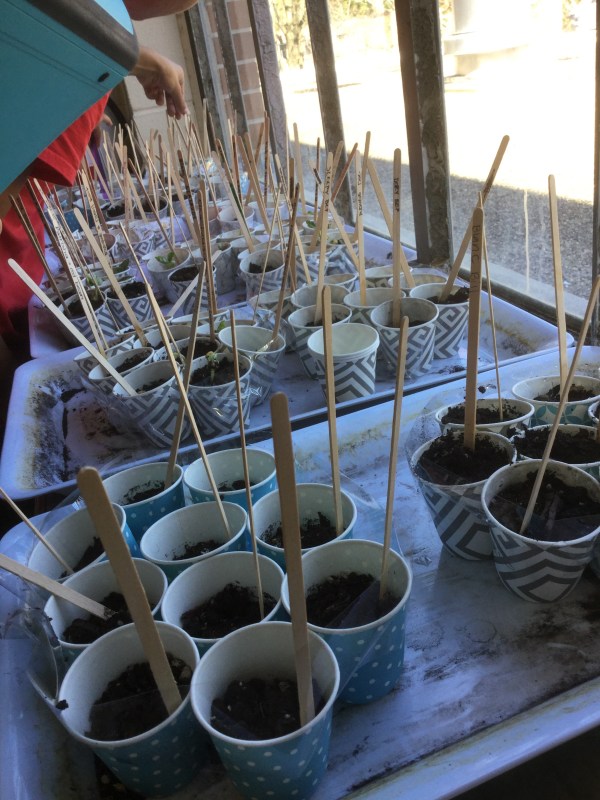

Look at that before and after comparison! We expect to see positive trends!
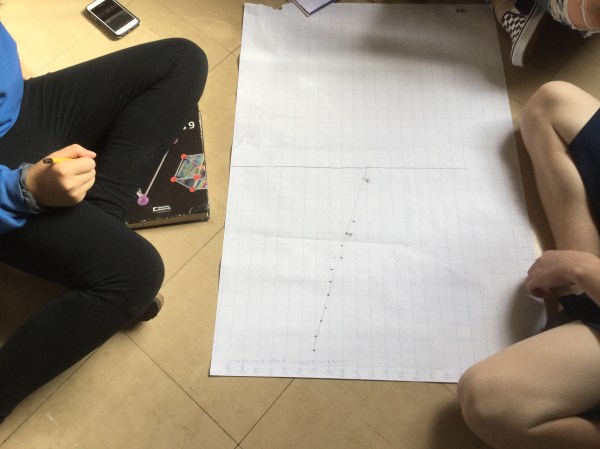
We’ve been measuring and tracking the growth of many plants. Today we chose one red bean and one black eyed pea, and we’re plotting two graphs on the same axes. We are able to compare growth rates, and predict how tall they’ll be in a week.
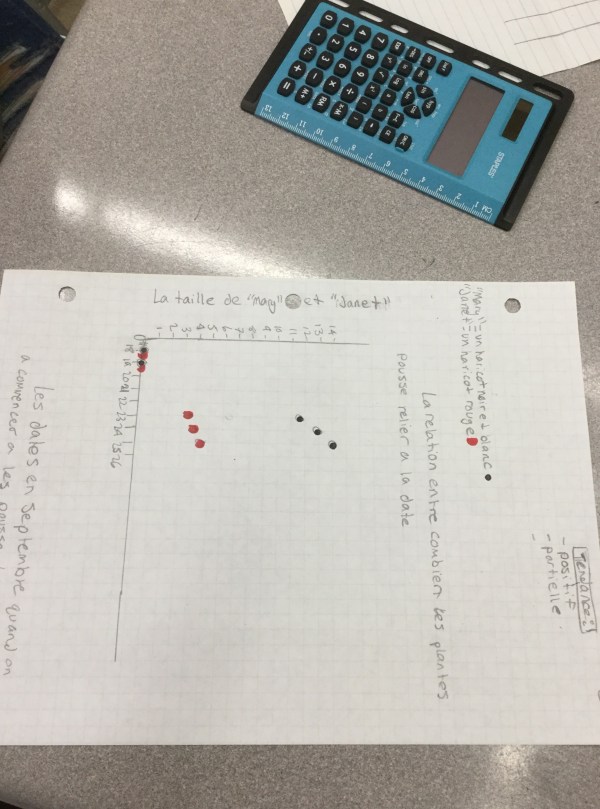

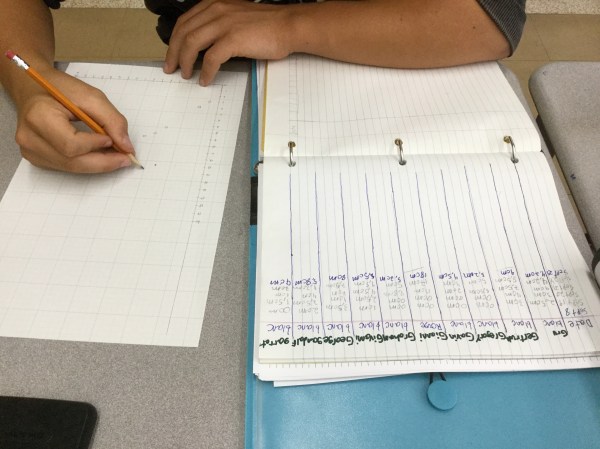
We are making clear scales on axes, plotting points, using a legend, and deciding if our data shows a linear or non linear trend. We made our predictions, and we will report back in October to share how accurate our predictions were.
We are also beginning to work on our math portfolio.

We are making notes and brainstorming using our template, and then we’ll write our submission and hand it in via google classroom.
Perpendicular Bisector
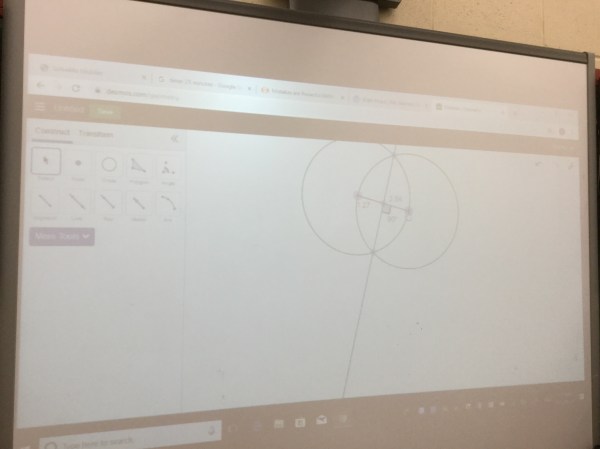
We looked at desmos geometry today to construct perpendicular bisectors (la médiatrice). These are lines that pass through the midpoint of a segment, and run perpendicular to the segment.
We have to use all of our skills (finding slope, calculating midpoint, using knowledge of perpendicular slopes, and calculating the y intercept)
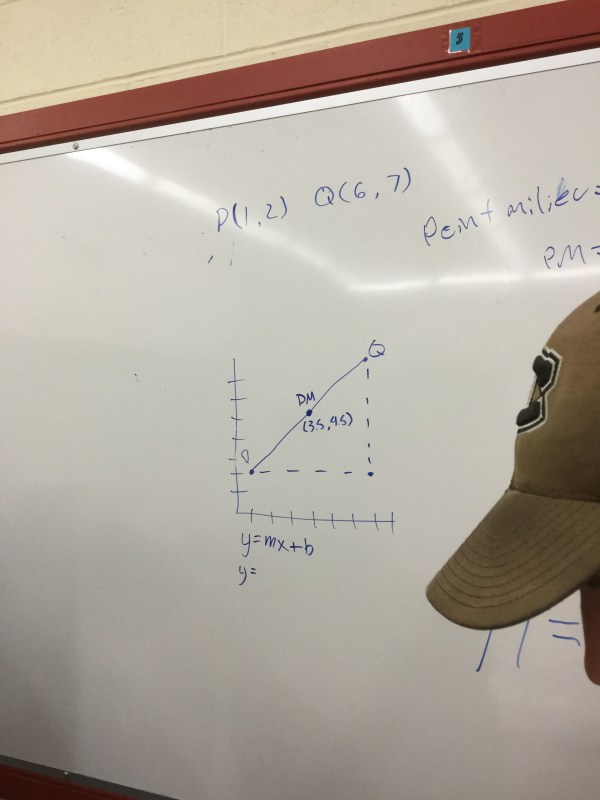
We worked together to represent our solutions, at the board, and then worked a little from our textbook,
Two math experiments
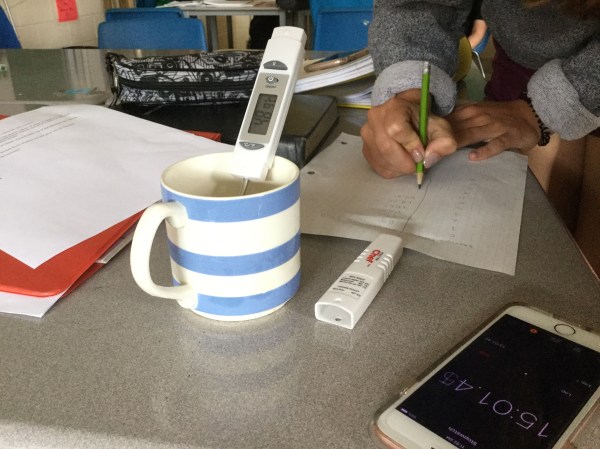
Today grade 9s did two experiments. One looked at the cooling of hot water, and the other looked at the frequency of sound produced when we blow over the neck of a bottle compared with the depth of water in the bottle.
We measured the depth.
We blew across the mouth of the bottle to make a noise, which is not always an easy task!

We used the app “sonic tools” a free download, to measure the frequency of sound. We then decreased the amount of water in the bottle and tried again and again and again.

We made tables of values and made graphs
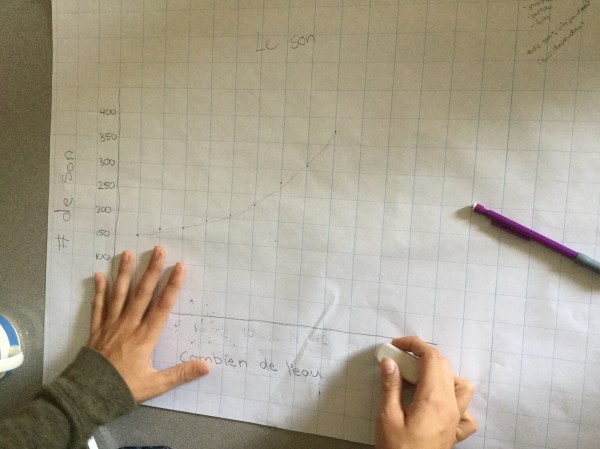 We are looking at trends and scales and axes, and making sure that we are communicating clearly.
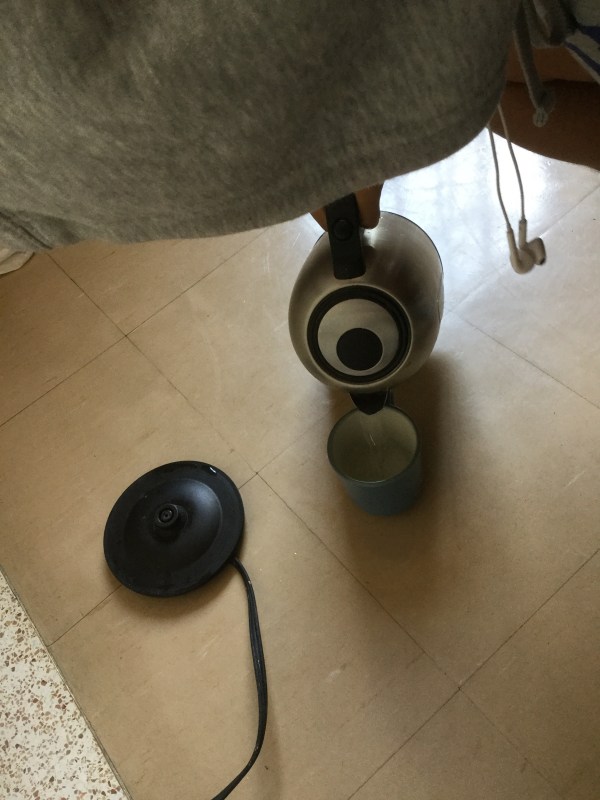
For the temperature experiment we poured hot water into a mug, and took temperature readings each minute.
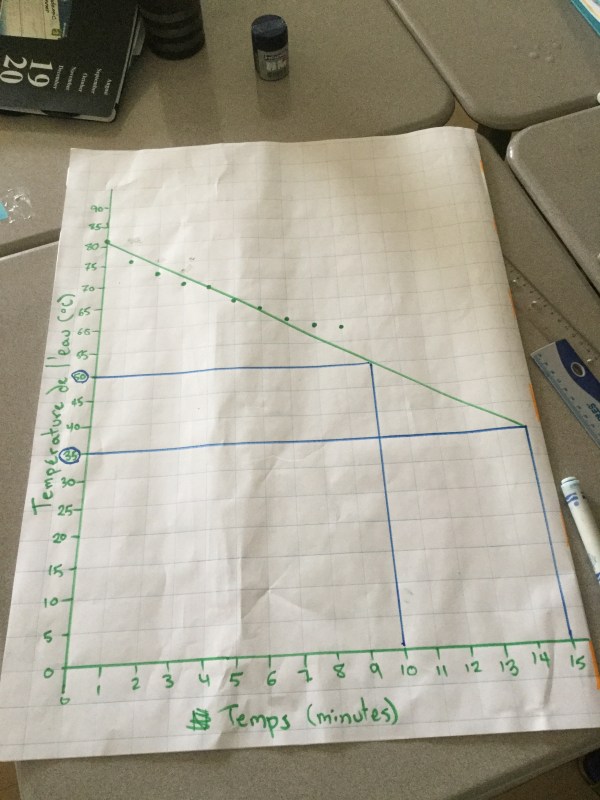
After 5 minutes, we made a best fit line and extrapolated to predict the temperature at 10 minutes and 15 minutes.

We made clear graphs…
And compared our real data at 15 minutes with the predicted temperature at 15 minutes. In most cases, the water had not cooled as much in reality as predicted. We realized that the data is not linear, but gently curved.
Learning from mistakes
We watched the following videos about mindset and how we learn more when we struggle with concepts and confront our mistakes.
 https://www.youcubed.org/resources/mindset-video/
 https://www.youcubed.org/resources/mistakes-powerful-video/
Today test 1 was returned to grade 10s, and we will be looking at our mistakes and completing an error analysis task where we look at the question, identify what type(s) of errors we made, and then write the correct solution.
The error classifications we are using are
inattention, not reading things carefully, careless mistakes
computation, calculation error, error with +/- signs, PEDMAS error etc
precision, communication error, units, work is too messy to follow
problem solving, didn’t have a plan, got stuck and couldn’t continue
and test taking strategy, spending all the time on one question and not finishing the rest.
We will be reflecting on the things we can do differently to prepare better for the next one. Good ideas are: working hard in class, asking questions, doing homework and checking answers, getting a tutor, studying by redoing questions and working through the chapter review problems, making study notes to summarize the unit.
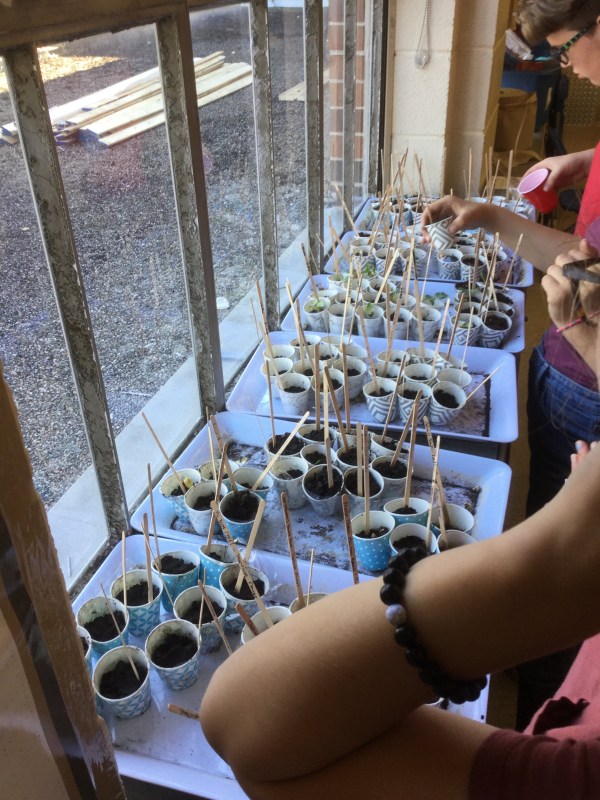
Beans!

The plants are really growing a lot! We will be making graphs of their growth this week.

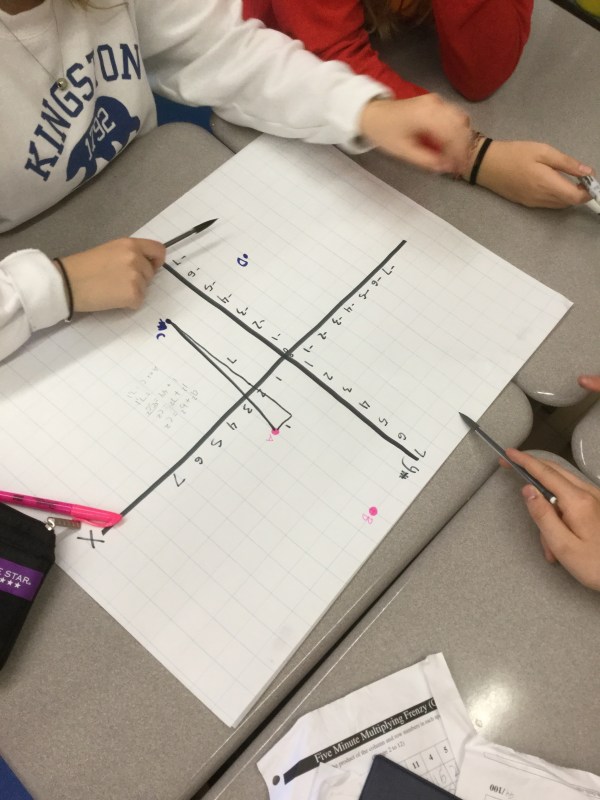
Today we started to make graphs of our multiplication data. We are paying close attention to what variables go on what axis, and we are making sure our scale is consistent. We are looking for trends in the data and we will make some predictions using the trends.
We started to look at what is going to be contained in our math portfolio today also. Our first portfolio deadline is Sept.30 and it’s all about scatter plots.
Solve me mobiles

Grade 9s did a quiz today and after sending emails and watering beans, we looked at solve me mobiles. There are some pretty intense problem solving tasks!

Distance and circles are all just pythagorean theorem!
Today we looked at the distance between 2 points. We had an easy time if the segments were horizontal or vertical, but stumbled when we had to calculate the distance of a segment that is diagonal. Pythagorean theorem helped us out!
We also looked at the group of points that are a fixed distance from the origin (0,0). This example is a lot of points that are 5 units from the origin. It makes a circle!
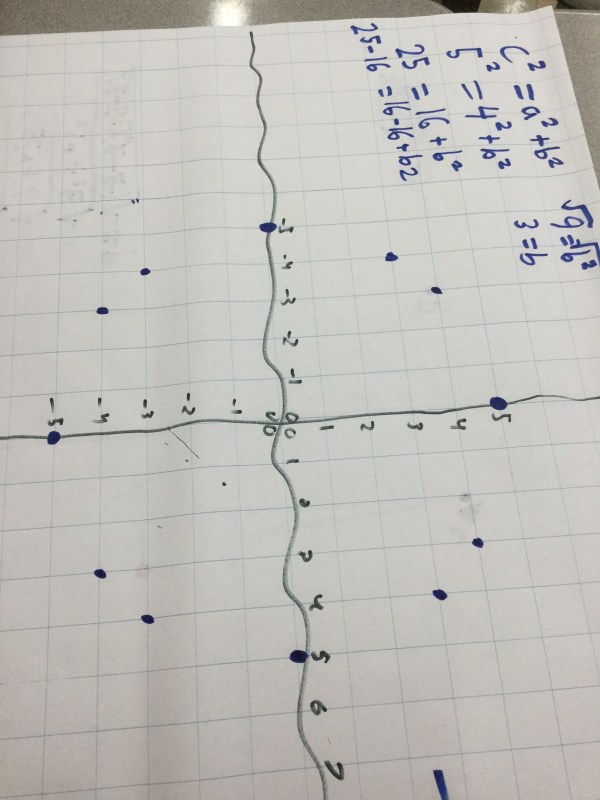
We now know the equation of a circle is x^2+y^2=r^2.
Do people with longer feet have longer forearms?
After watering and measuring our plants…
…we looked at correlation in scatter plots again. We started with this image as inspiration.
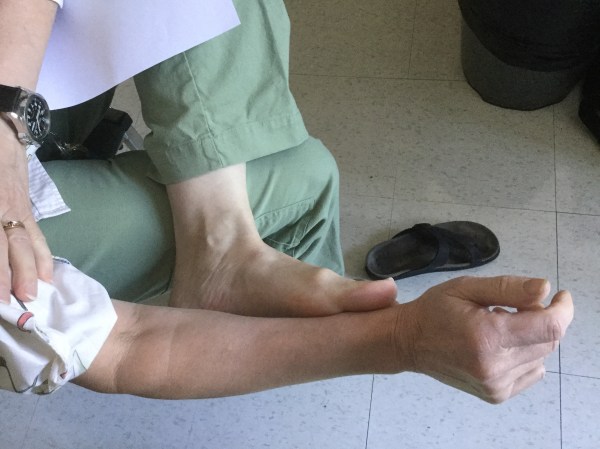
We wondered if feet matched up with forearm length.
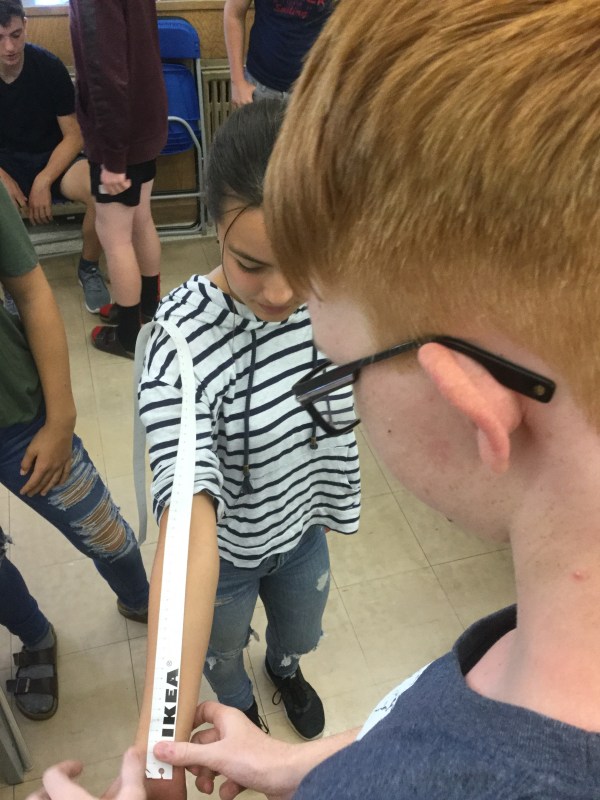

We measured, and put out table of values on desmos.
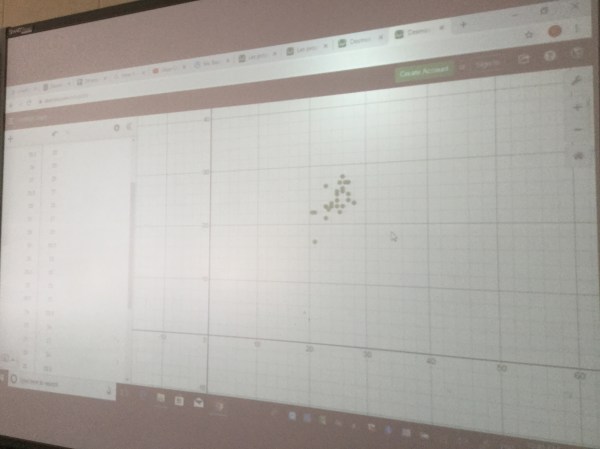
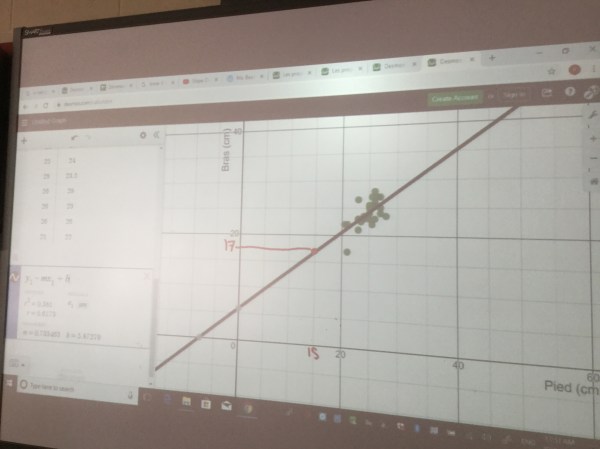
We noticed the trend was positive, weak, linear and partial.
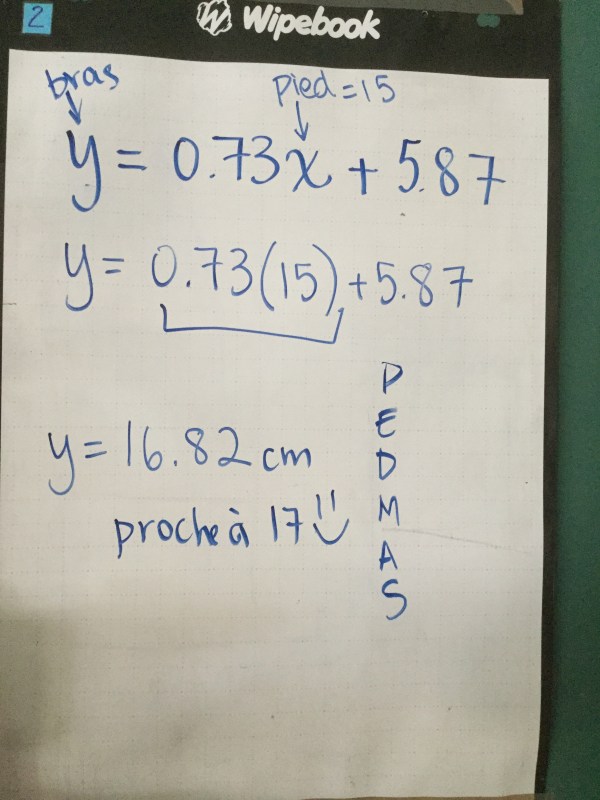
We got desmos to do a linear regression for us, and then we estimated the forearm length of someone with 15cm feet to be 17cm.
Just for fun we used the equation that desmos gave us, and we calculated it too, using BEDMAS.
Grade 10s have a test tomorrow!
Good luck grade 10s as you prepare for your test.

Today we were busy working on chapter review, graphing lines, solving problems, and asking lots of questions to clarify last minute concerns from chapter 1.
Learning from our TV dimensions graph
We used our desmos graph and added a line of best fit (by typing y=mx+b) and adjusted it with the sliders.

We noticed that “m” changes the slope (steepness) of the line, or makes it positive or negative. We noticed “b” changes the place where the line crosses the vertical axis.

We are practicing lots of our vocabulary as we look at these graphs.
We also got desmos to do a regression for us (to make the best line of best fit). We need to type in y2~mx2+b this time. The ~ tells the program that we want a regression, and the little 2s after the x and y link to the headings of the table of values we used.

We looked at interpolating and extrapolating, and making a rate triangle to approximate “m”.
We have some homework for tonight that uses desmos and analysis of graphs.
