Understanding all the words!
In grade 10 we are working on verifying and proving different scenarios using analytic geometry skills. We need to first understand what the question is asking. As we read through, we need to interact with the question. The question words will make us think of related things, and prior knowledge. Here’s an example of all the added things we can include for the following question.
In English the question asks to verify algebraically that if the midpoints of adjacent sides of a quadrilateral are joined a parallelogram is created.
We set out to draw quadrilaterals, and join up the midpoints, and then use our math skills to prove that the new shape is a parallelogram.

We are working well with graphical models, and are practicing a lot of our calculations.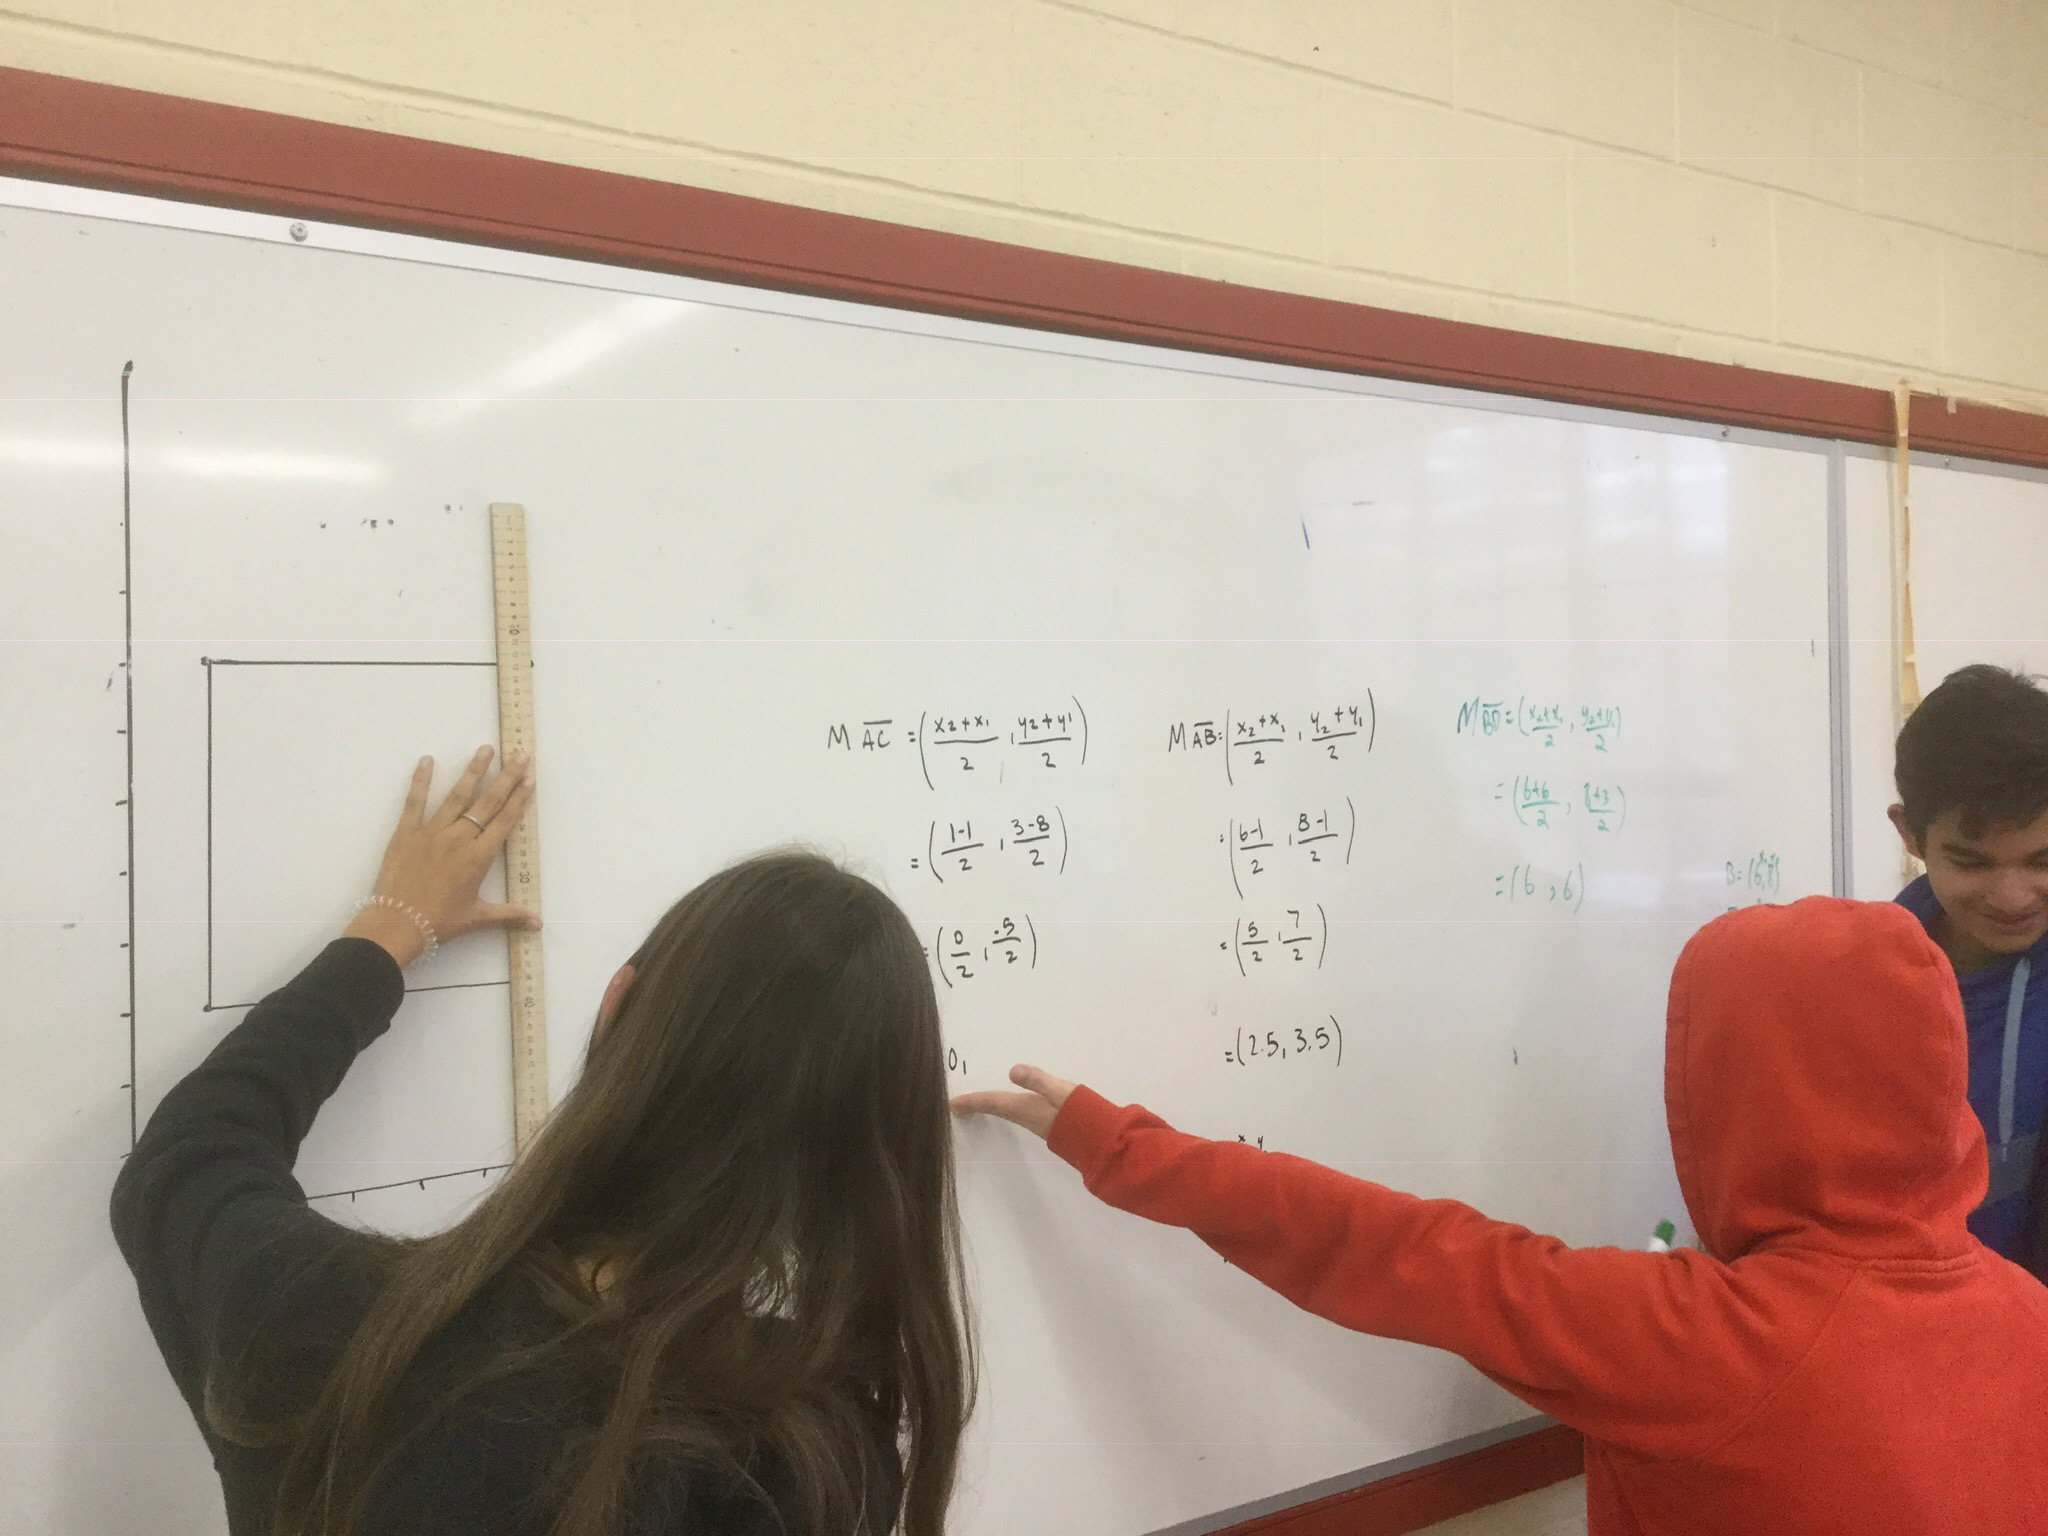
Desmos geometry was very helpful for a conceptual visual proof. We can construct a model on the screen, and drag points around and watch that the middle shape remains a parallelogram.
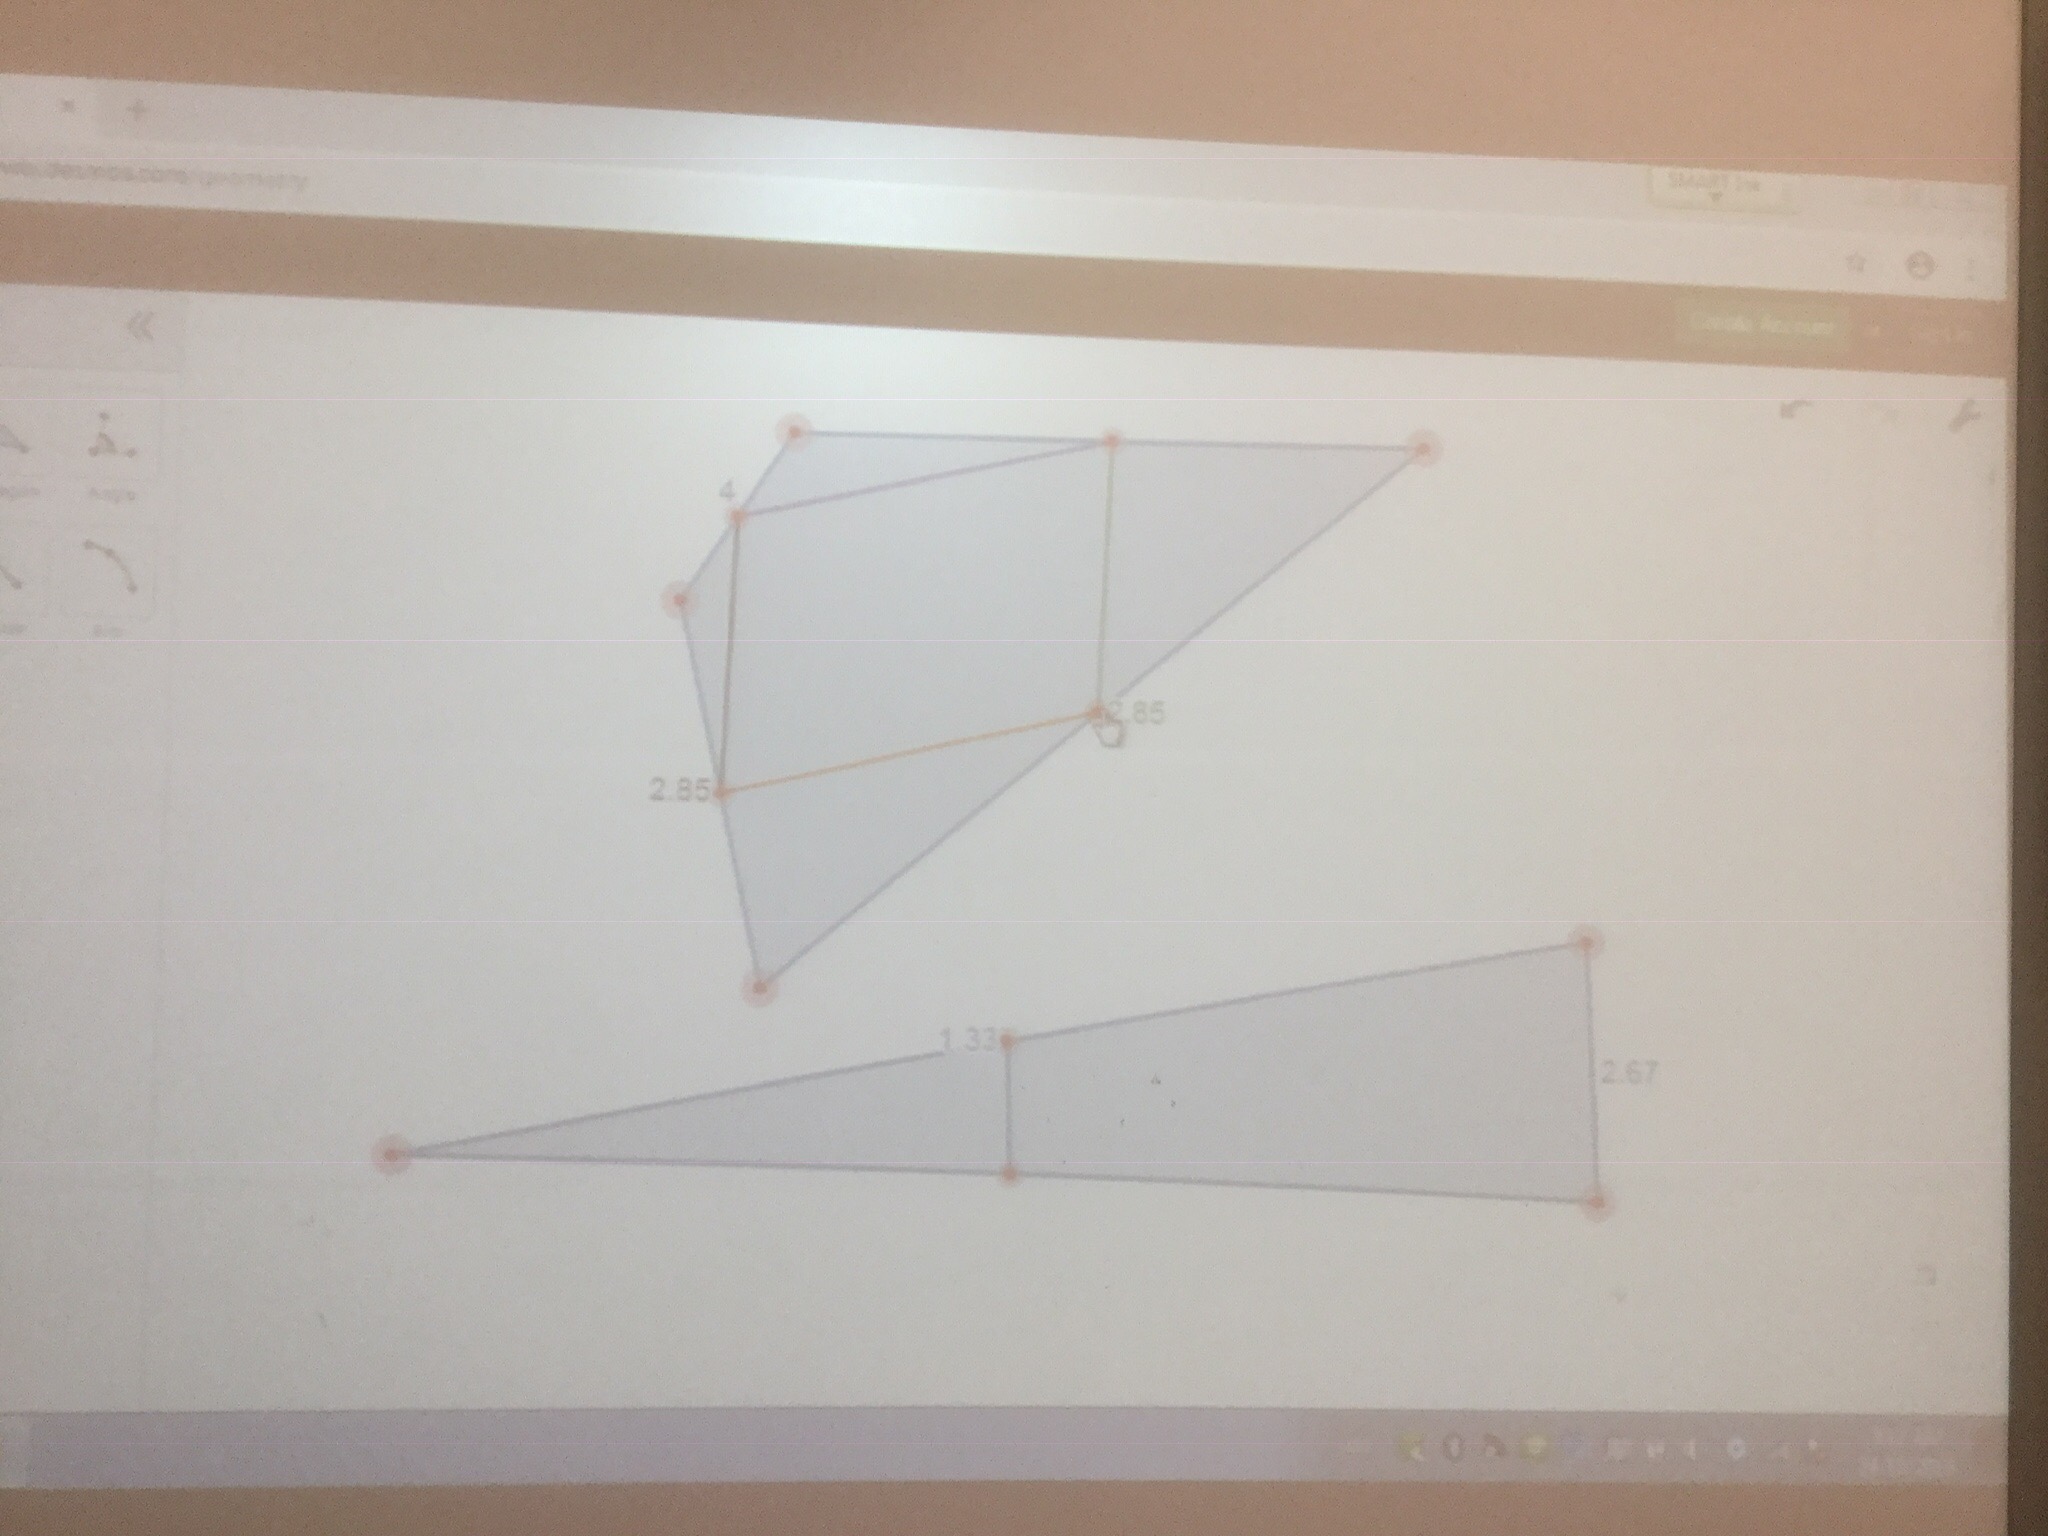
Our second proof involved joining midpoints of 2 sides of a triangle, and comparing the segment created with the 3rd triangle side. The segment is parallel and also half the length.
Making Connections
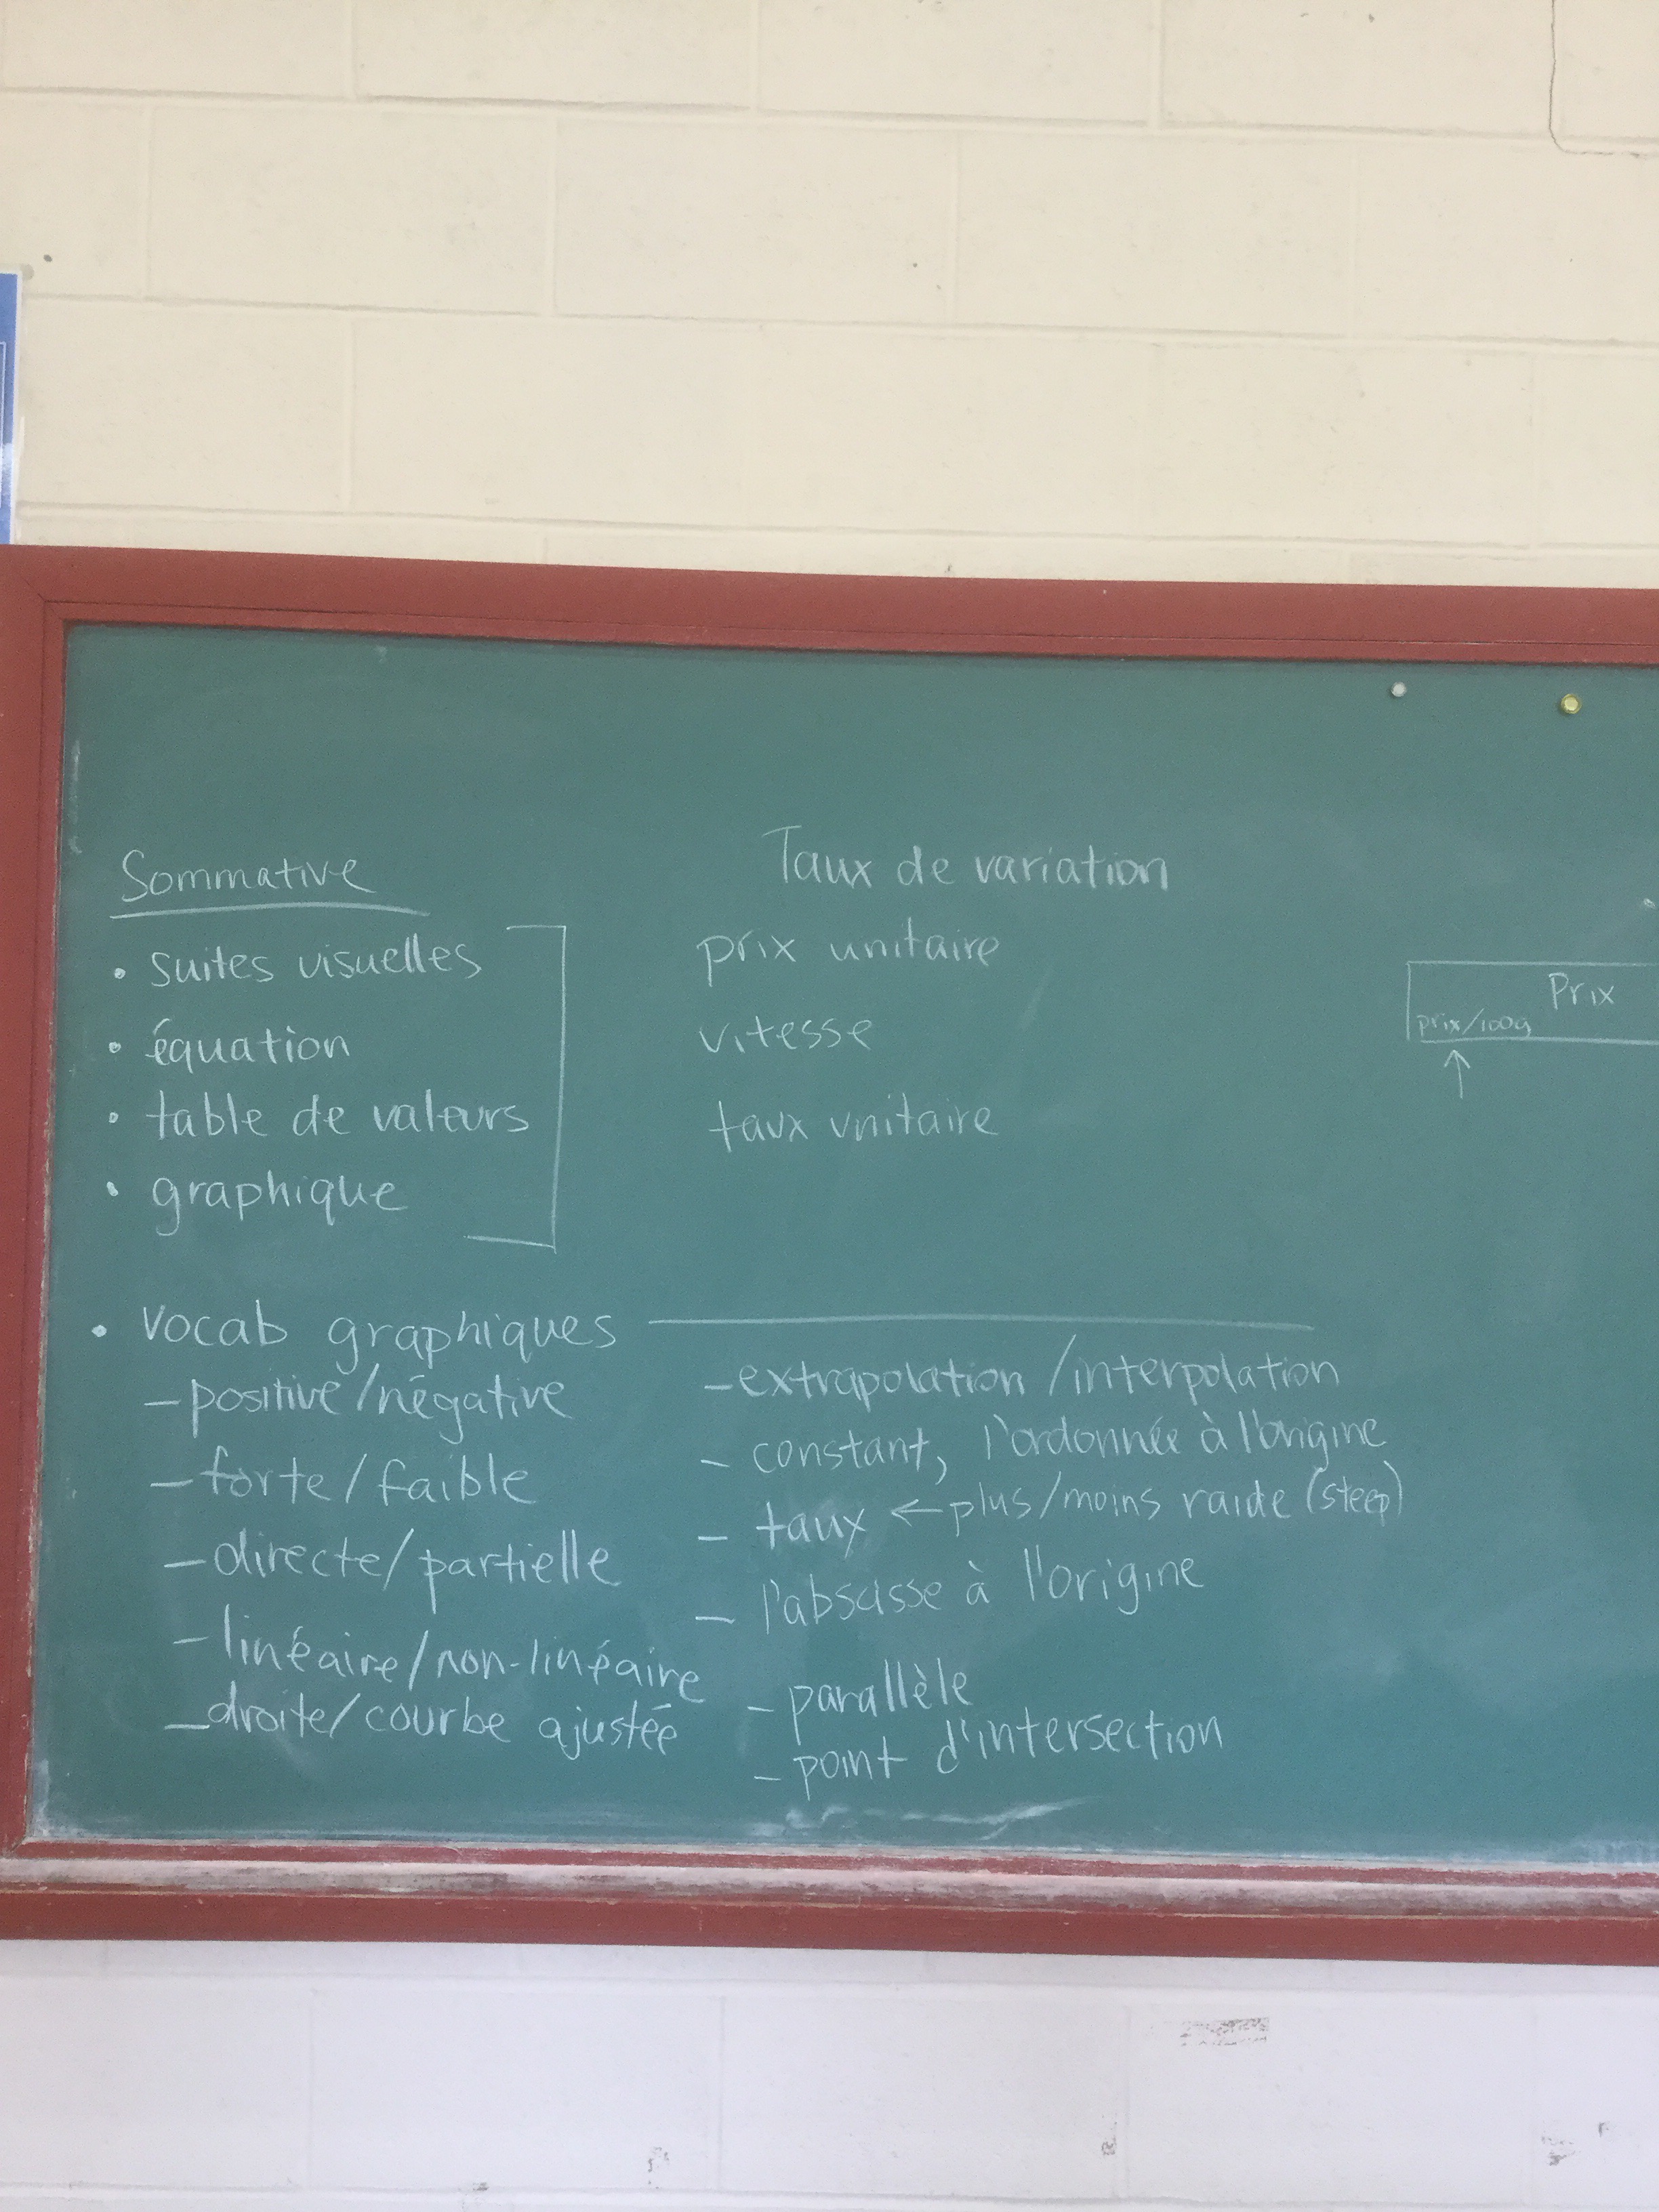
In grade 9 we used a graphic organizer today to consolidate our understanding of the multiple representations of linear relations. We colour coded the constant and the rate (taux) for each representation. 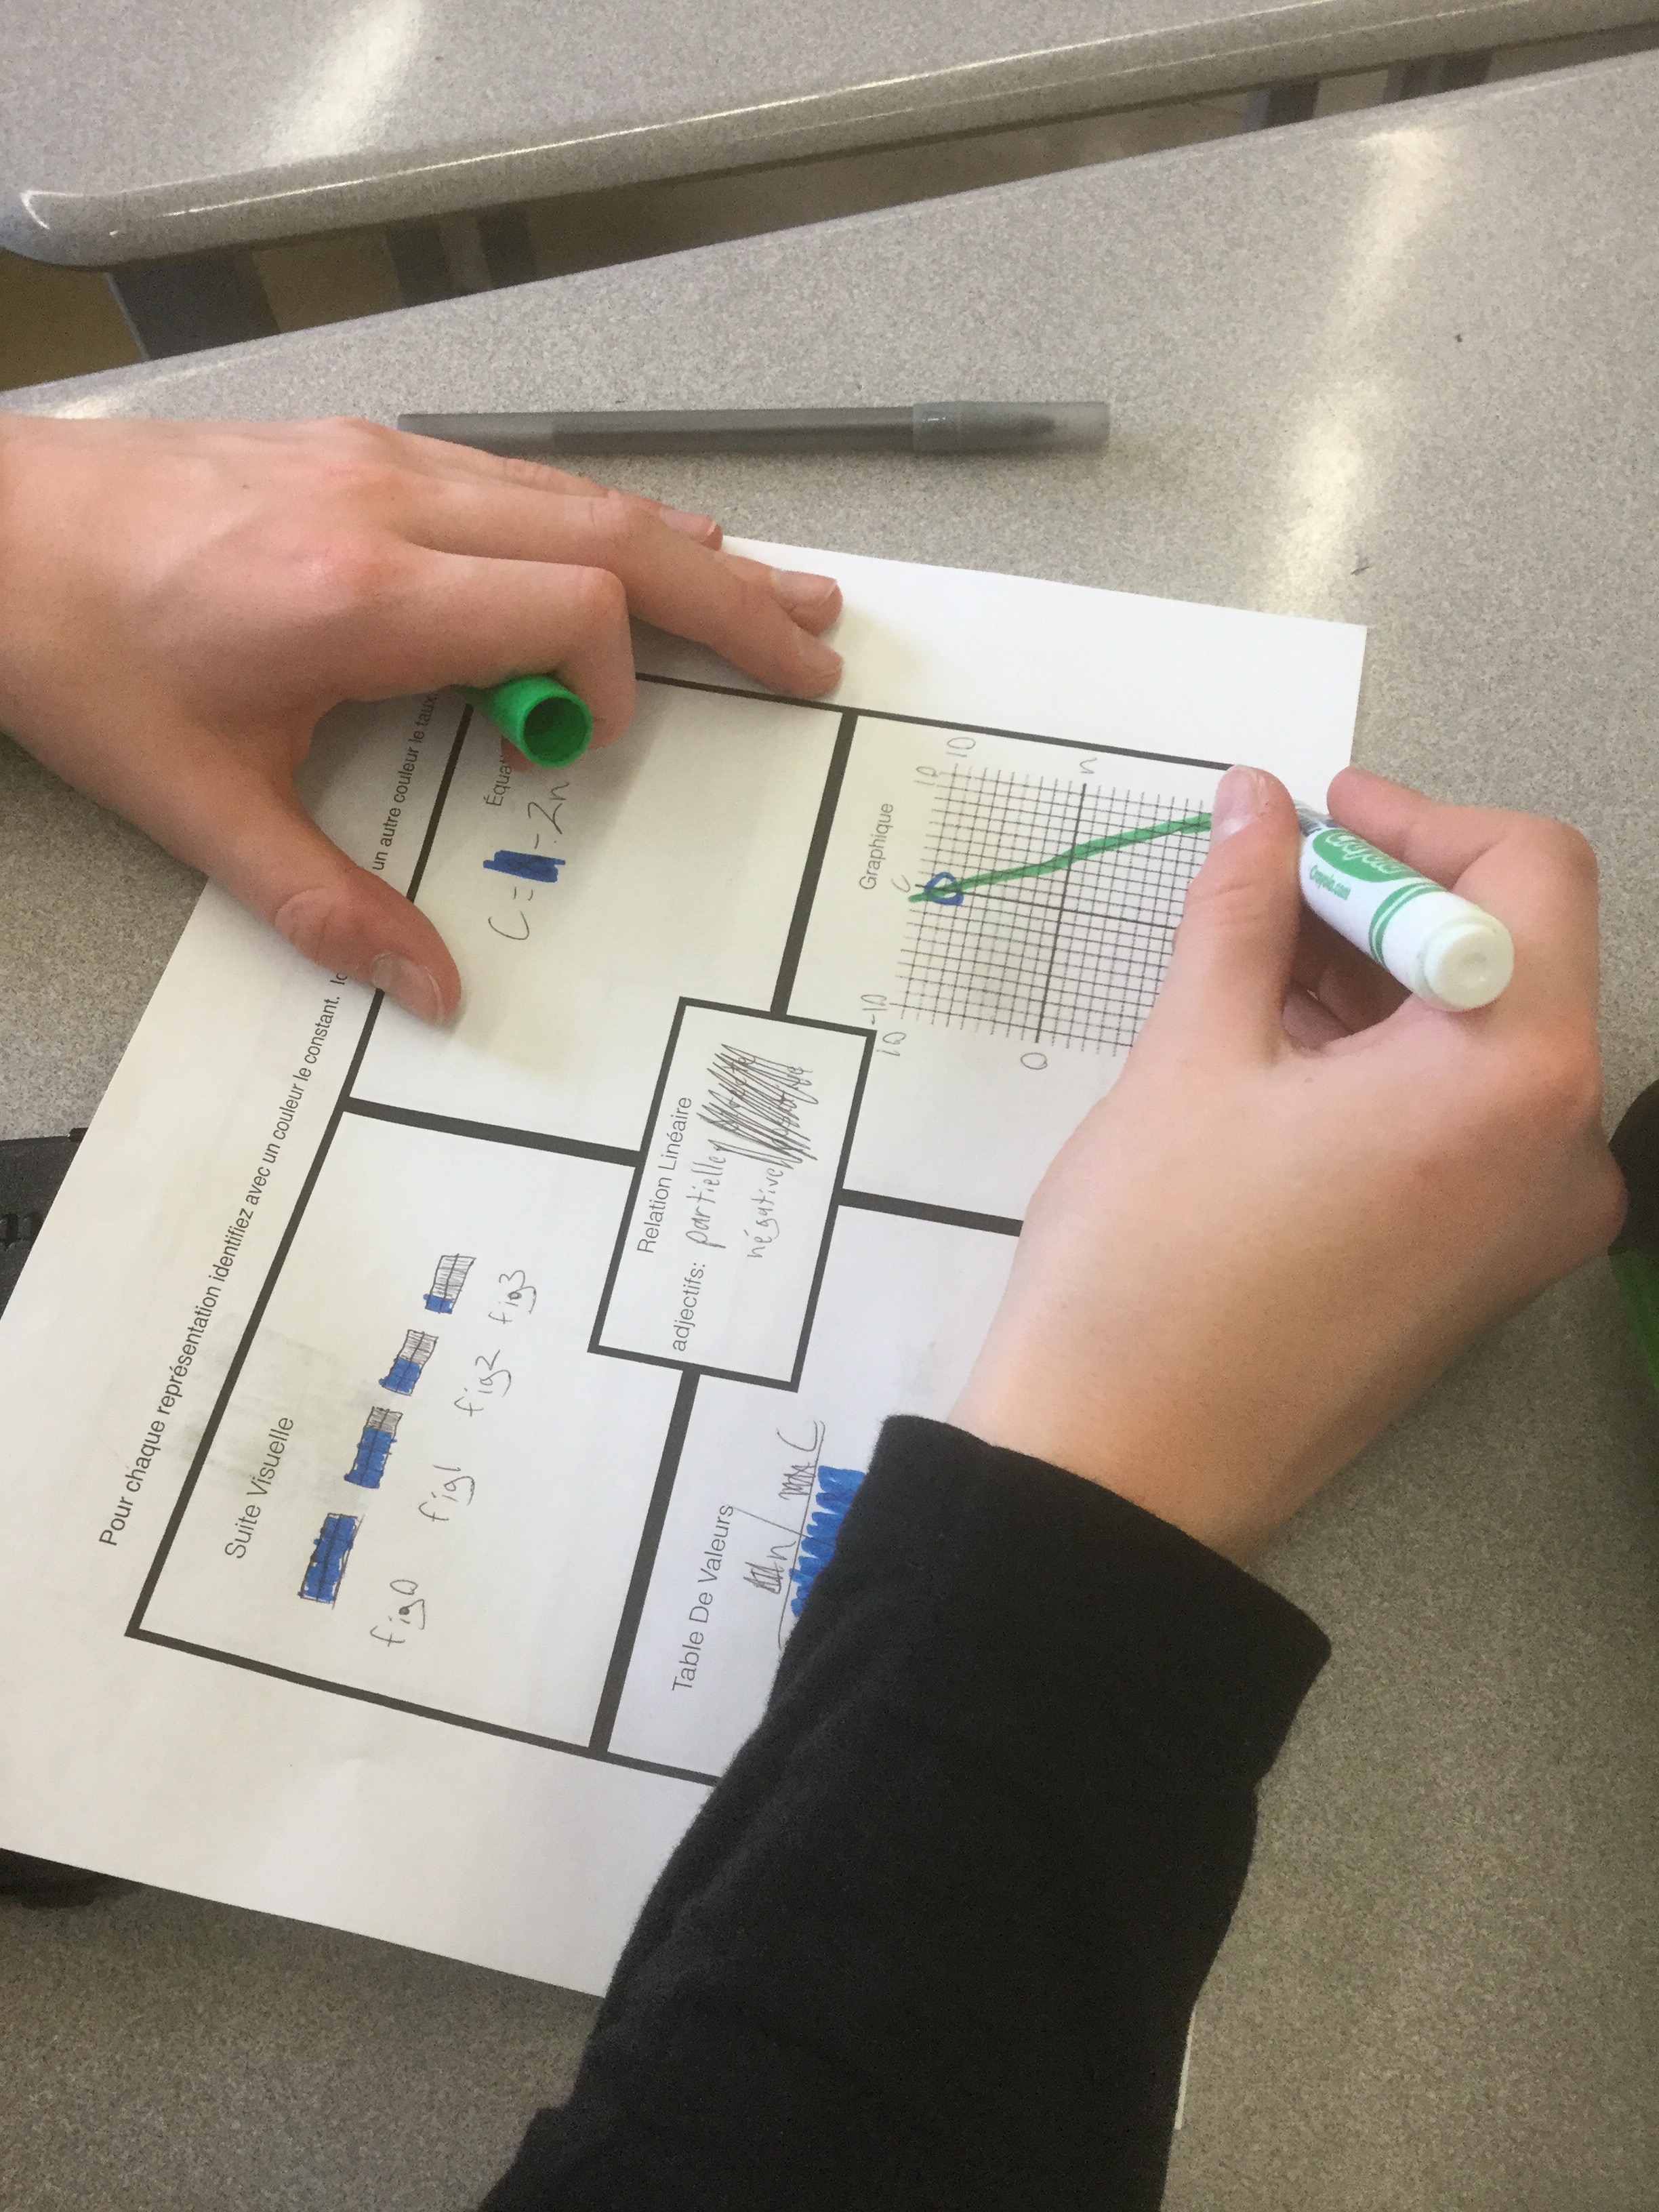
Here’s another example.

We next used our knowledge to try some past years’ EQAO questions. (For more check here)

We made graphs from tables, and made equations to go with them.
We made best fit lines (droite ajustée) for graphs, and then made equations for them.

With all of this practice we are getting better at solving problems with a context.
Good work grade 9s.
Quadrilaterals and their diagonals
We looked yesterday at how to classify quadrilaterals using their side lengths and slopes. Today we are looking at properties of their diagonals. We drew squares, rectangles, parallelograms, rhombuses (“losanges”), trapezoids both isosceles and not, and kites. We compared their 2 diagonals to see which ones have diagonals that are perpendicular, congruent, and have the same midpoints.
If we can make sense of this, we can cut our work in half! 2 diagonals are quicker to analyse than 4 sides.
It’s good to review all of these skills because we will need to do these on the summative.
Our summary:
Congruent diagonals: square, rectangle, isosceles trapezoid
Perpendicular diagonals: square, rhombus (losange), and kite
Diagonals with the same midpoint: square, rectangle, parallelogram, rhombus (losange).
Upcoming summative Grade 9
Grade 9s, your next summative is on October 30. Here are the things you will need to know. Review your notes. Ask for help if needed.
Upcoming Summative Grade 10
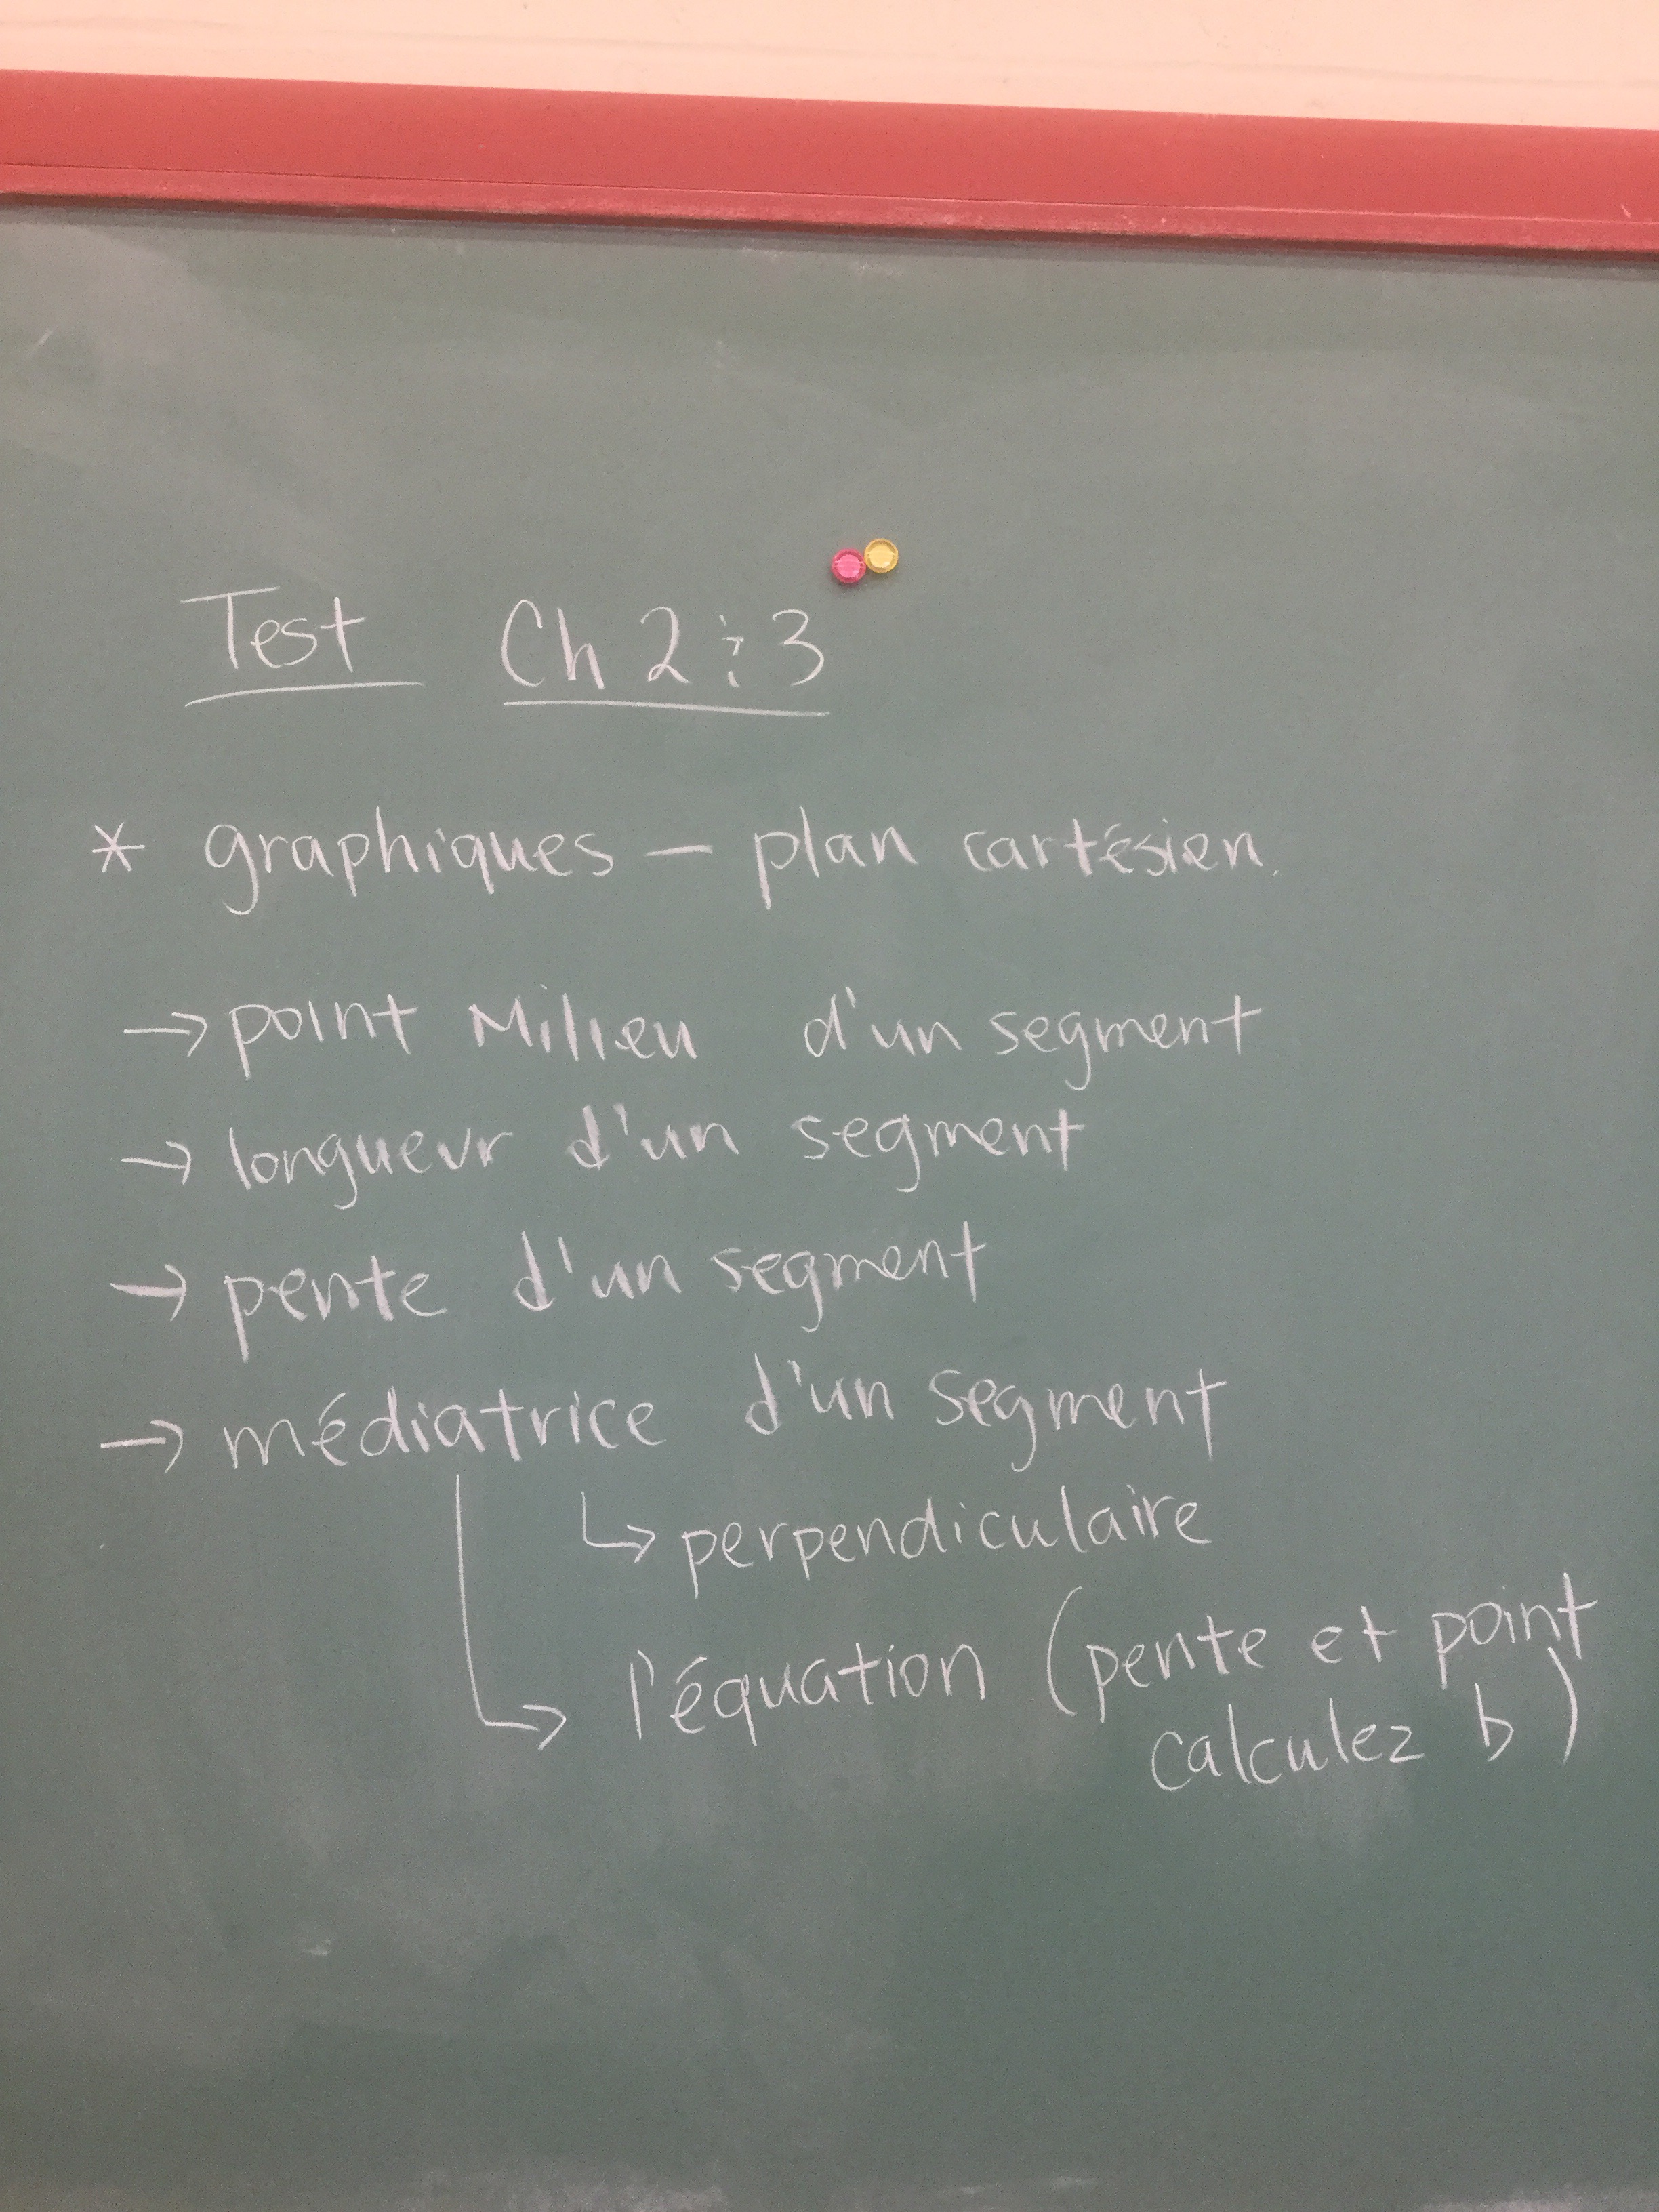
Grade 10s, your next summative is October 30. This next week is busy with leadership camp, cross country, and a PA day, so start your reviewing now. You are responsible for chapters 2 and 3 in our text. There are great chapter review questions and a model test for each chapter in the book.


Technology in Grade 9
Today’s technology in grade 9 is the spreadsheet. We used google sheets, but excel does similar things too.
We put data into the table on the spreadsheet, and learned how to make a scatter plot. We formatted the graph and added titles. We explored trend lines, and saw how a linear fit isn’t always the best model for real world data. For beans that did show linear growth we inserted a trendline “droite ajustée” and looked at the expression that the computer gave us. We recognized it has 2 parts, one is a constant, and one is the rate. In this case the blue line has a constant of 14.1 which makes us think the bean was initially 14.1cm when it was planted, and the rate is 0.262 cm/day of growth.

We are making graphs of our beans using google sheets and working on making good models to fit their growth to predict their height next week.

Technology in Grade 10
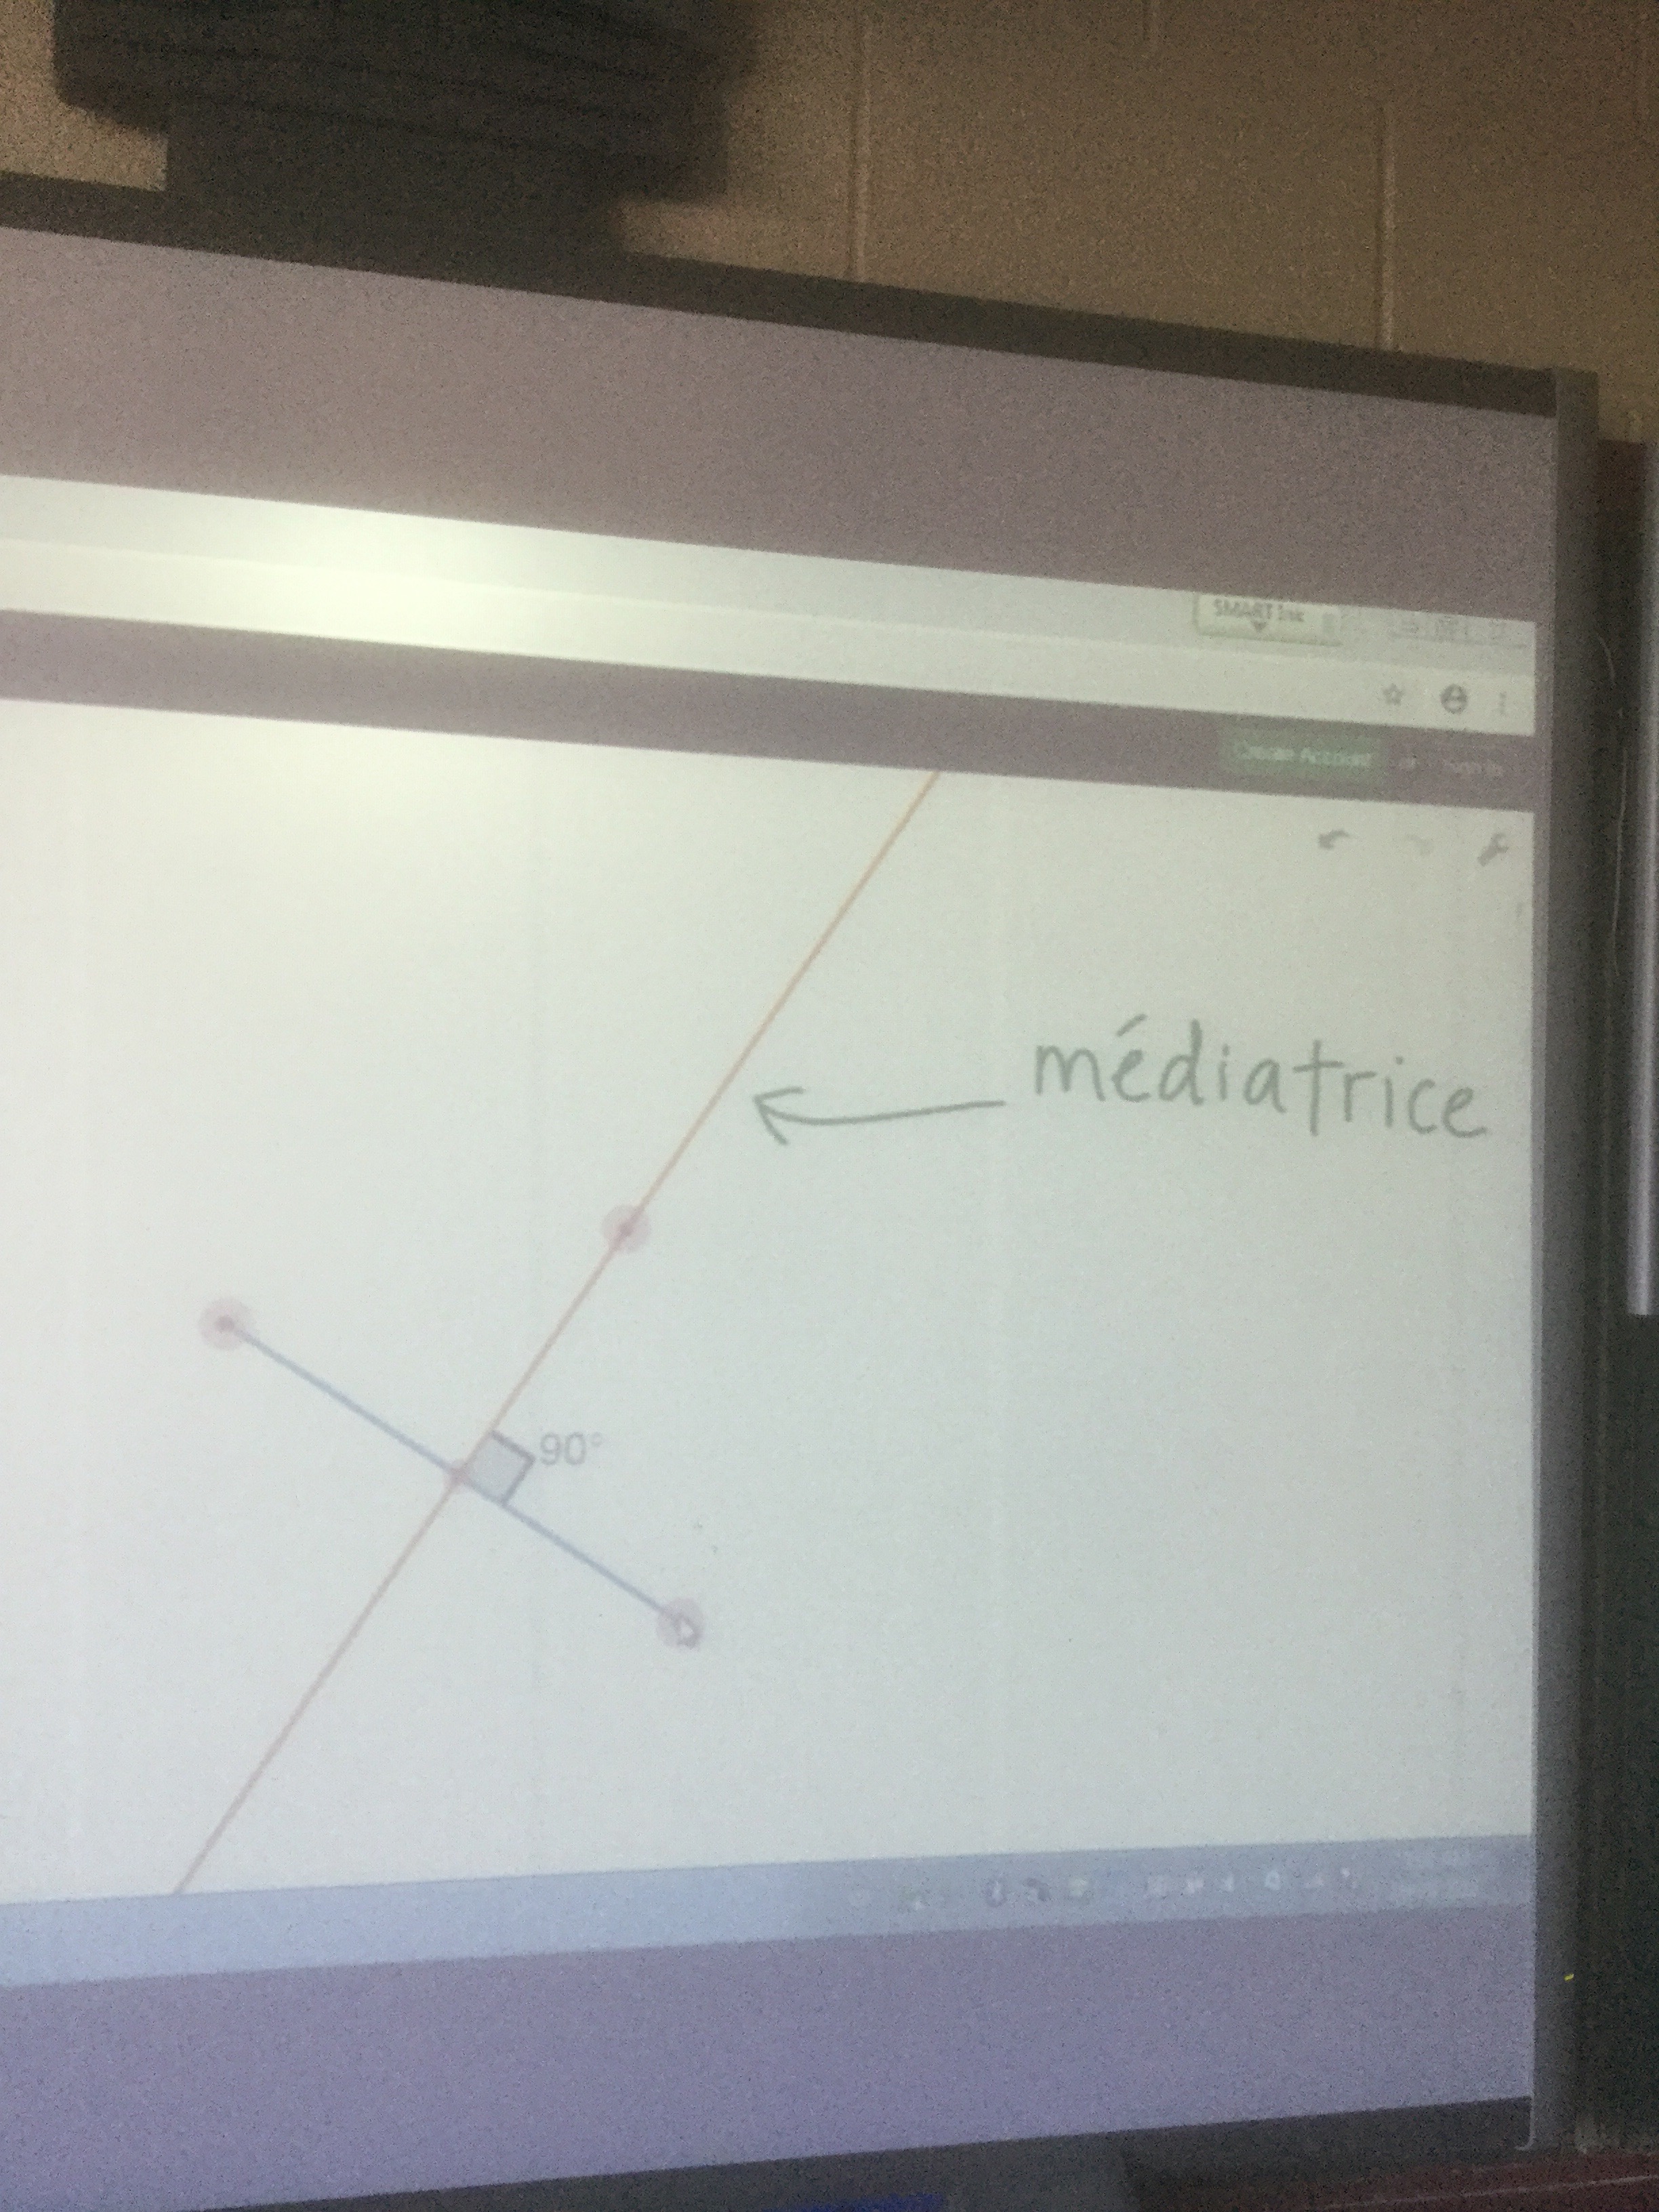
Today in grade 9 and 10 we were working with some new technology. Grade 10s were using the desmos geometry website to visualize some of our recent concepts like perpendicular bisector (médiatrice) and median (médiane). In French these words are so similar that they are often mixed up. We need a lot of practice and a good visual sense of what they are.
We could see that for isosceles triangles the “médiane” and “médiatrice” are the same for the non congruent side (it’s perpendicular to the side), and for an equilateral triangle all of the “médiane” and “médiatrice” are equal.

This program is great because you can construct something and then drag points around and see how the concepts are visually related.
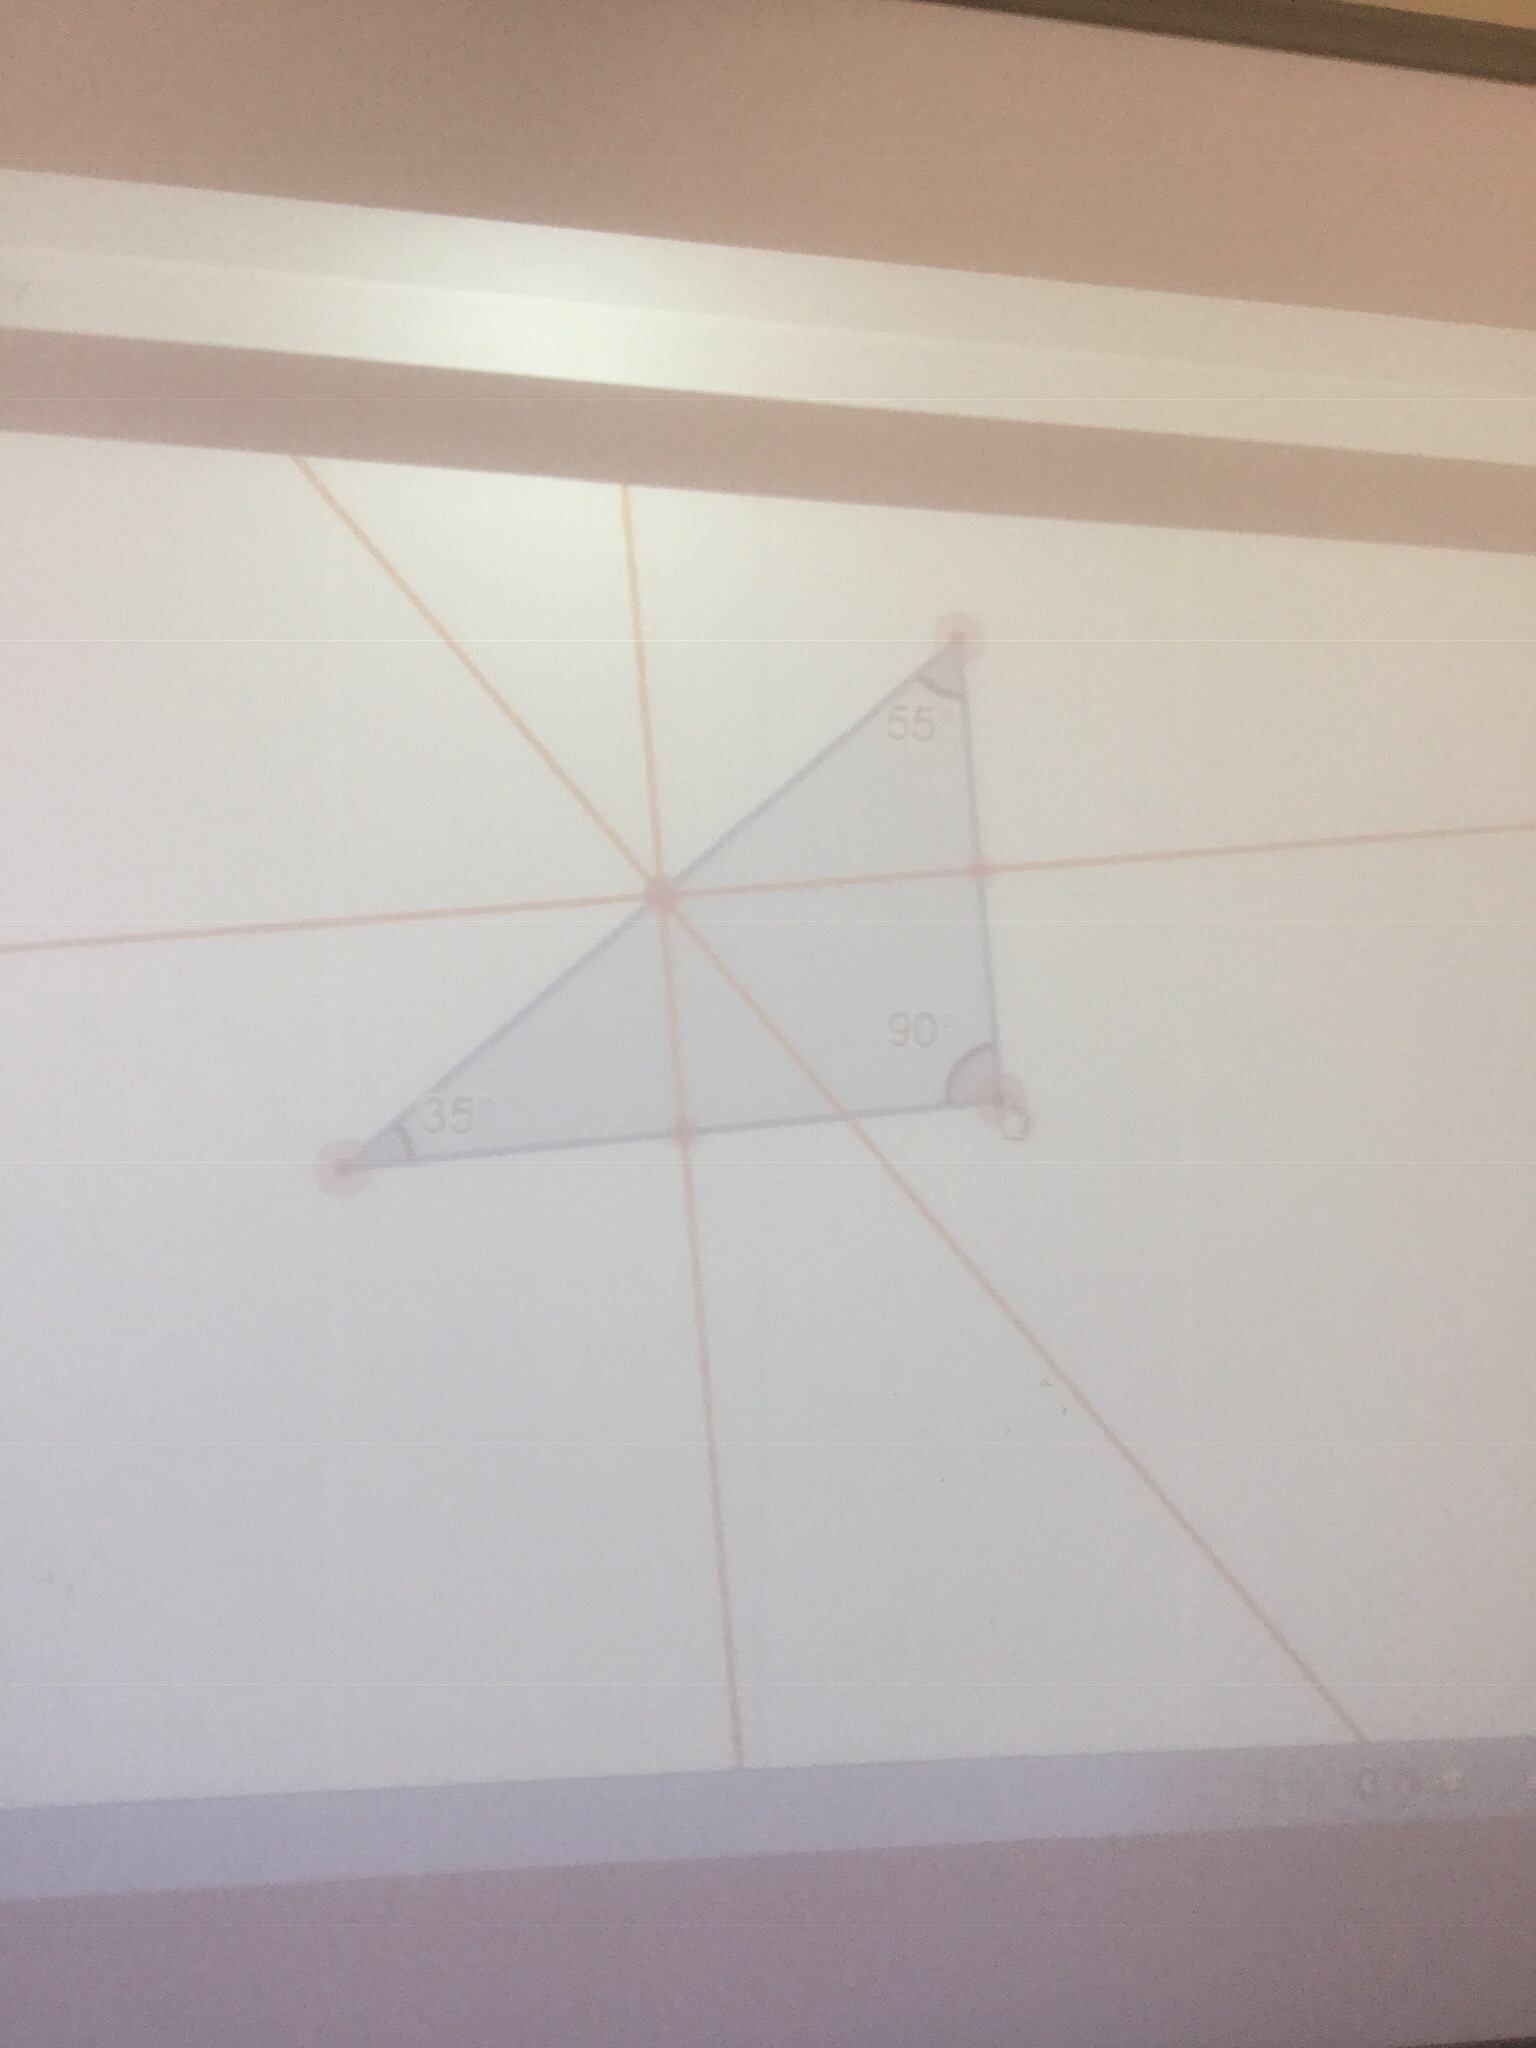
Here’s a wordy question that we tried. “Show algebraically that the perpendicular bisectors of the legs of a right triangle intersect at the midpoint of the hypotenuse.”

We analysed what the words told us, and what pictures came to mind. We can show graphically that it is true.
And with some strategic calculations we can also verify algebraically.

Math speed dating
We’ve done a lot of practice with visual patterns, graphs, and expressions. Today we added tables of values, and made our expressions into equations using c= in front of the expression we already know how to find. C in this case represented squares (carrés) or things (choses). 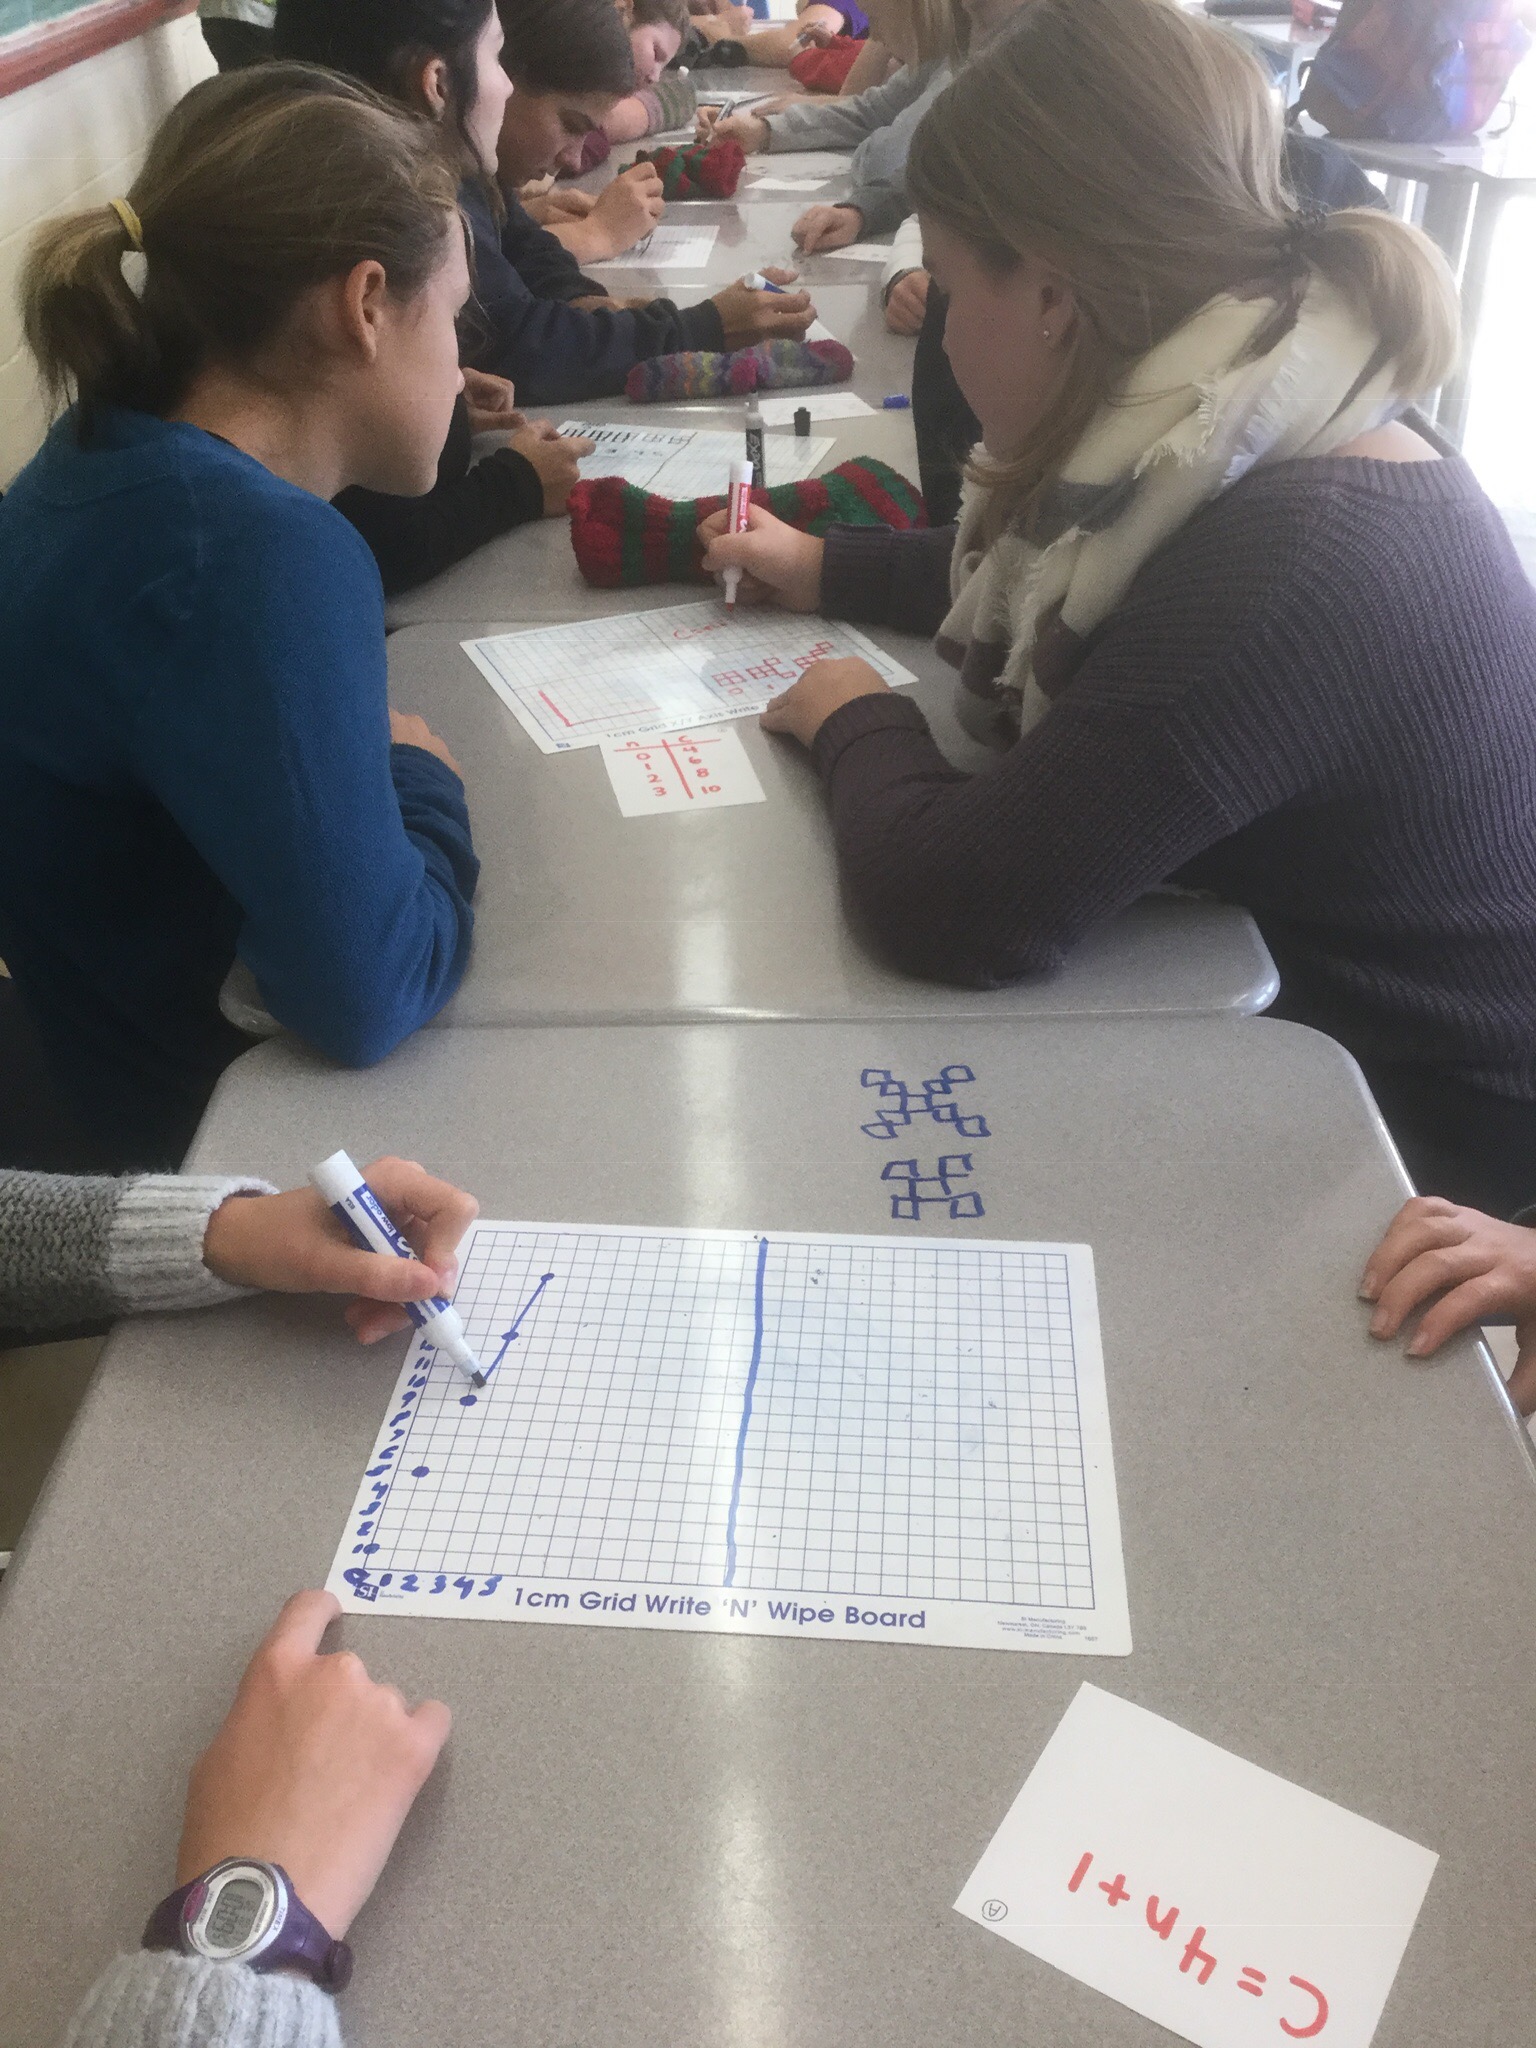
The activity is done in pairs, but the pairs change every 3 minutes. Desks are arranged in a long line, with chairs on opposite sides of each desk. Each pair (opposite each other) has a question card. Today they had one of our representations, and the task was to create the 3 missing representations. We had markers and tiles and white board out on the desks and many people wrote on the desks too. Fuzzy socks are our friends! (They make the best erasers).

In pairs both people make sure they understand each of the representations, and feel like an expert. This took about 5 minutes. After this point one row of students stand up and shift one position to their right (the displaced person circles back to fill the gap left at the start of the row). They are now going to solve the question in front of them with the help/prompting/guidance/quality control of the “expert” who did the question initially and didn’t change places yet. This step took about 3 minutes for these questions today. After the timer beeped, the previous expert row stands up and shifts to their right (forming a new pair)

We took pictures of our work for our portfolio task which is due this Friday.
We are getting good at showing our work, and connecting the various representations. We can identify the constant term, and how many groups of “n” we are adding or taking away.

A special note goes to period C who determined that in order to fit 15 desks (to accommodate our class of 30) we’d need to use the diagonal of the room. They used their knowledge of the pythagorean theorem! We measured first to be sure it’d work.
Good work today grade 9s. You are all getting to be experts!

Thinking outside the triangle
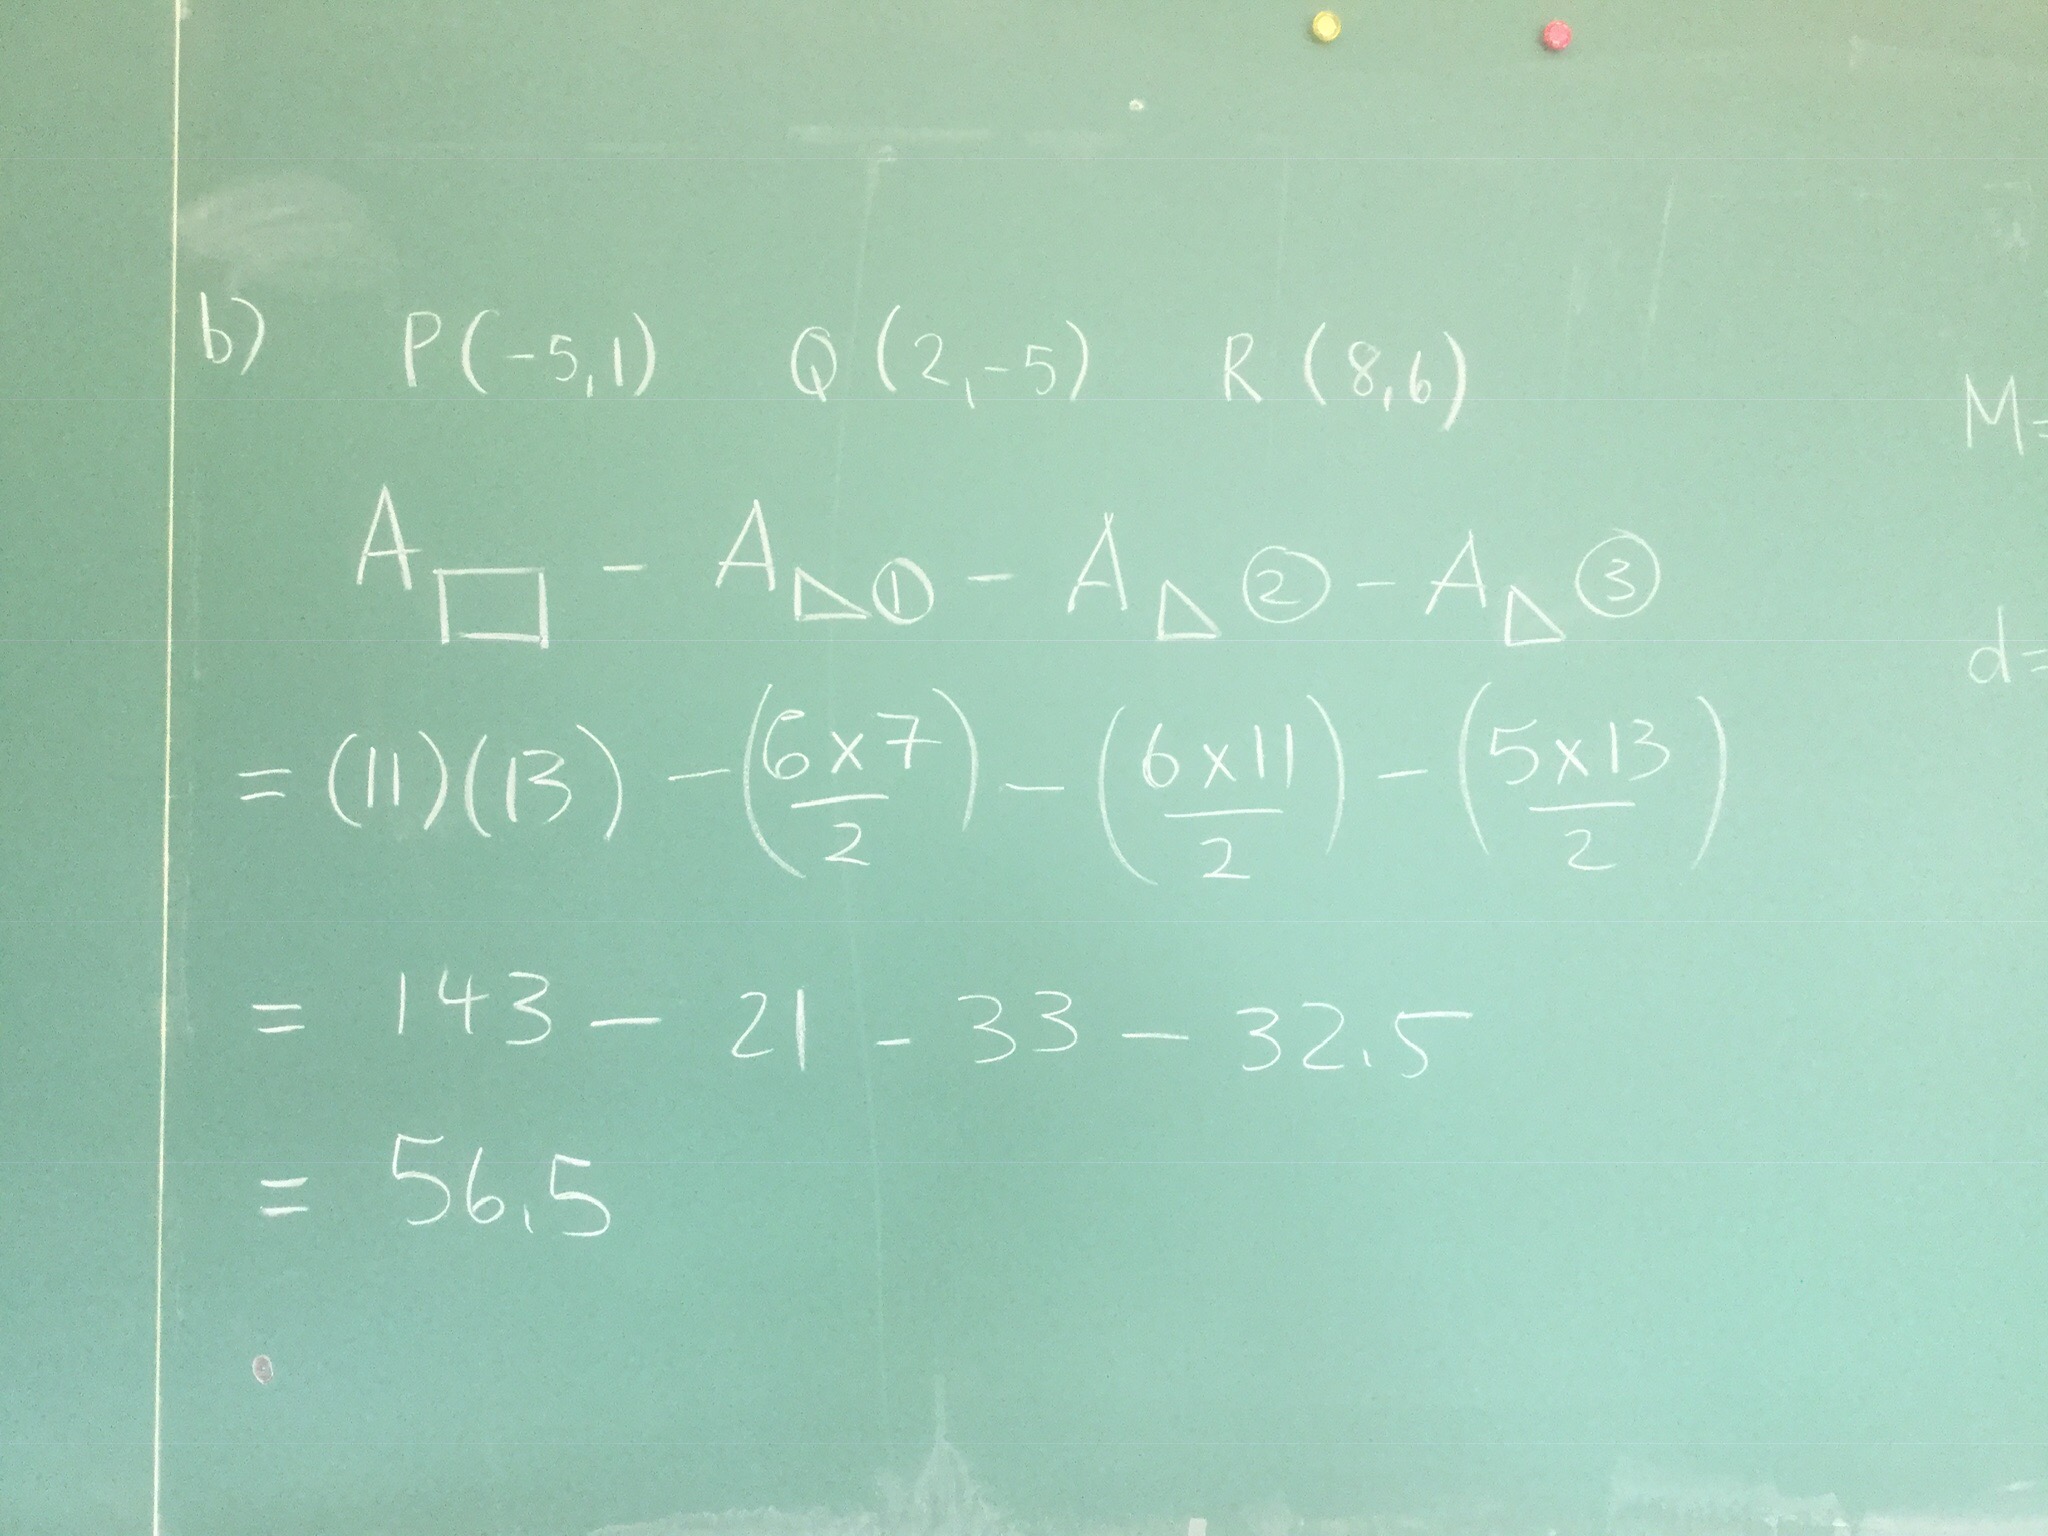
In grade 10 we’ve been working on classifying triangles using their coordinate points, and calculating perimeter and area. We worked on this one yesterday
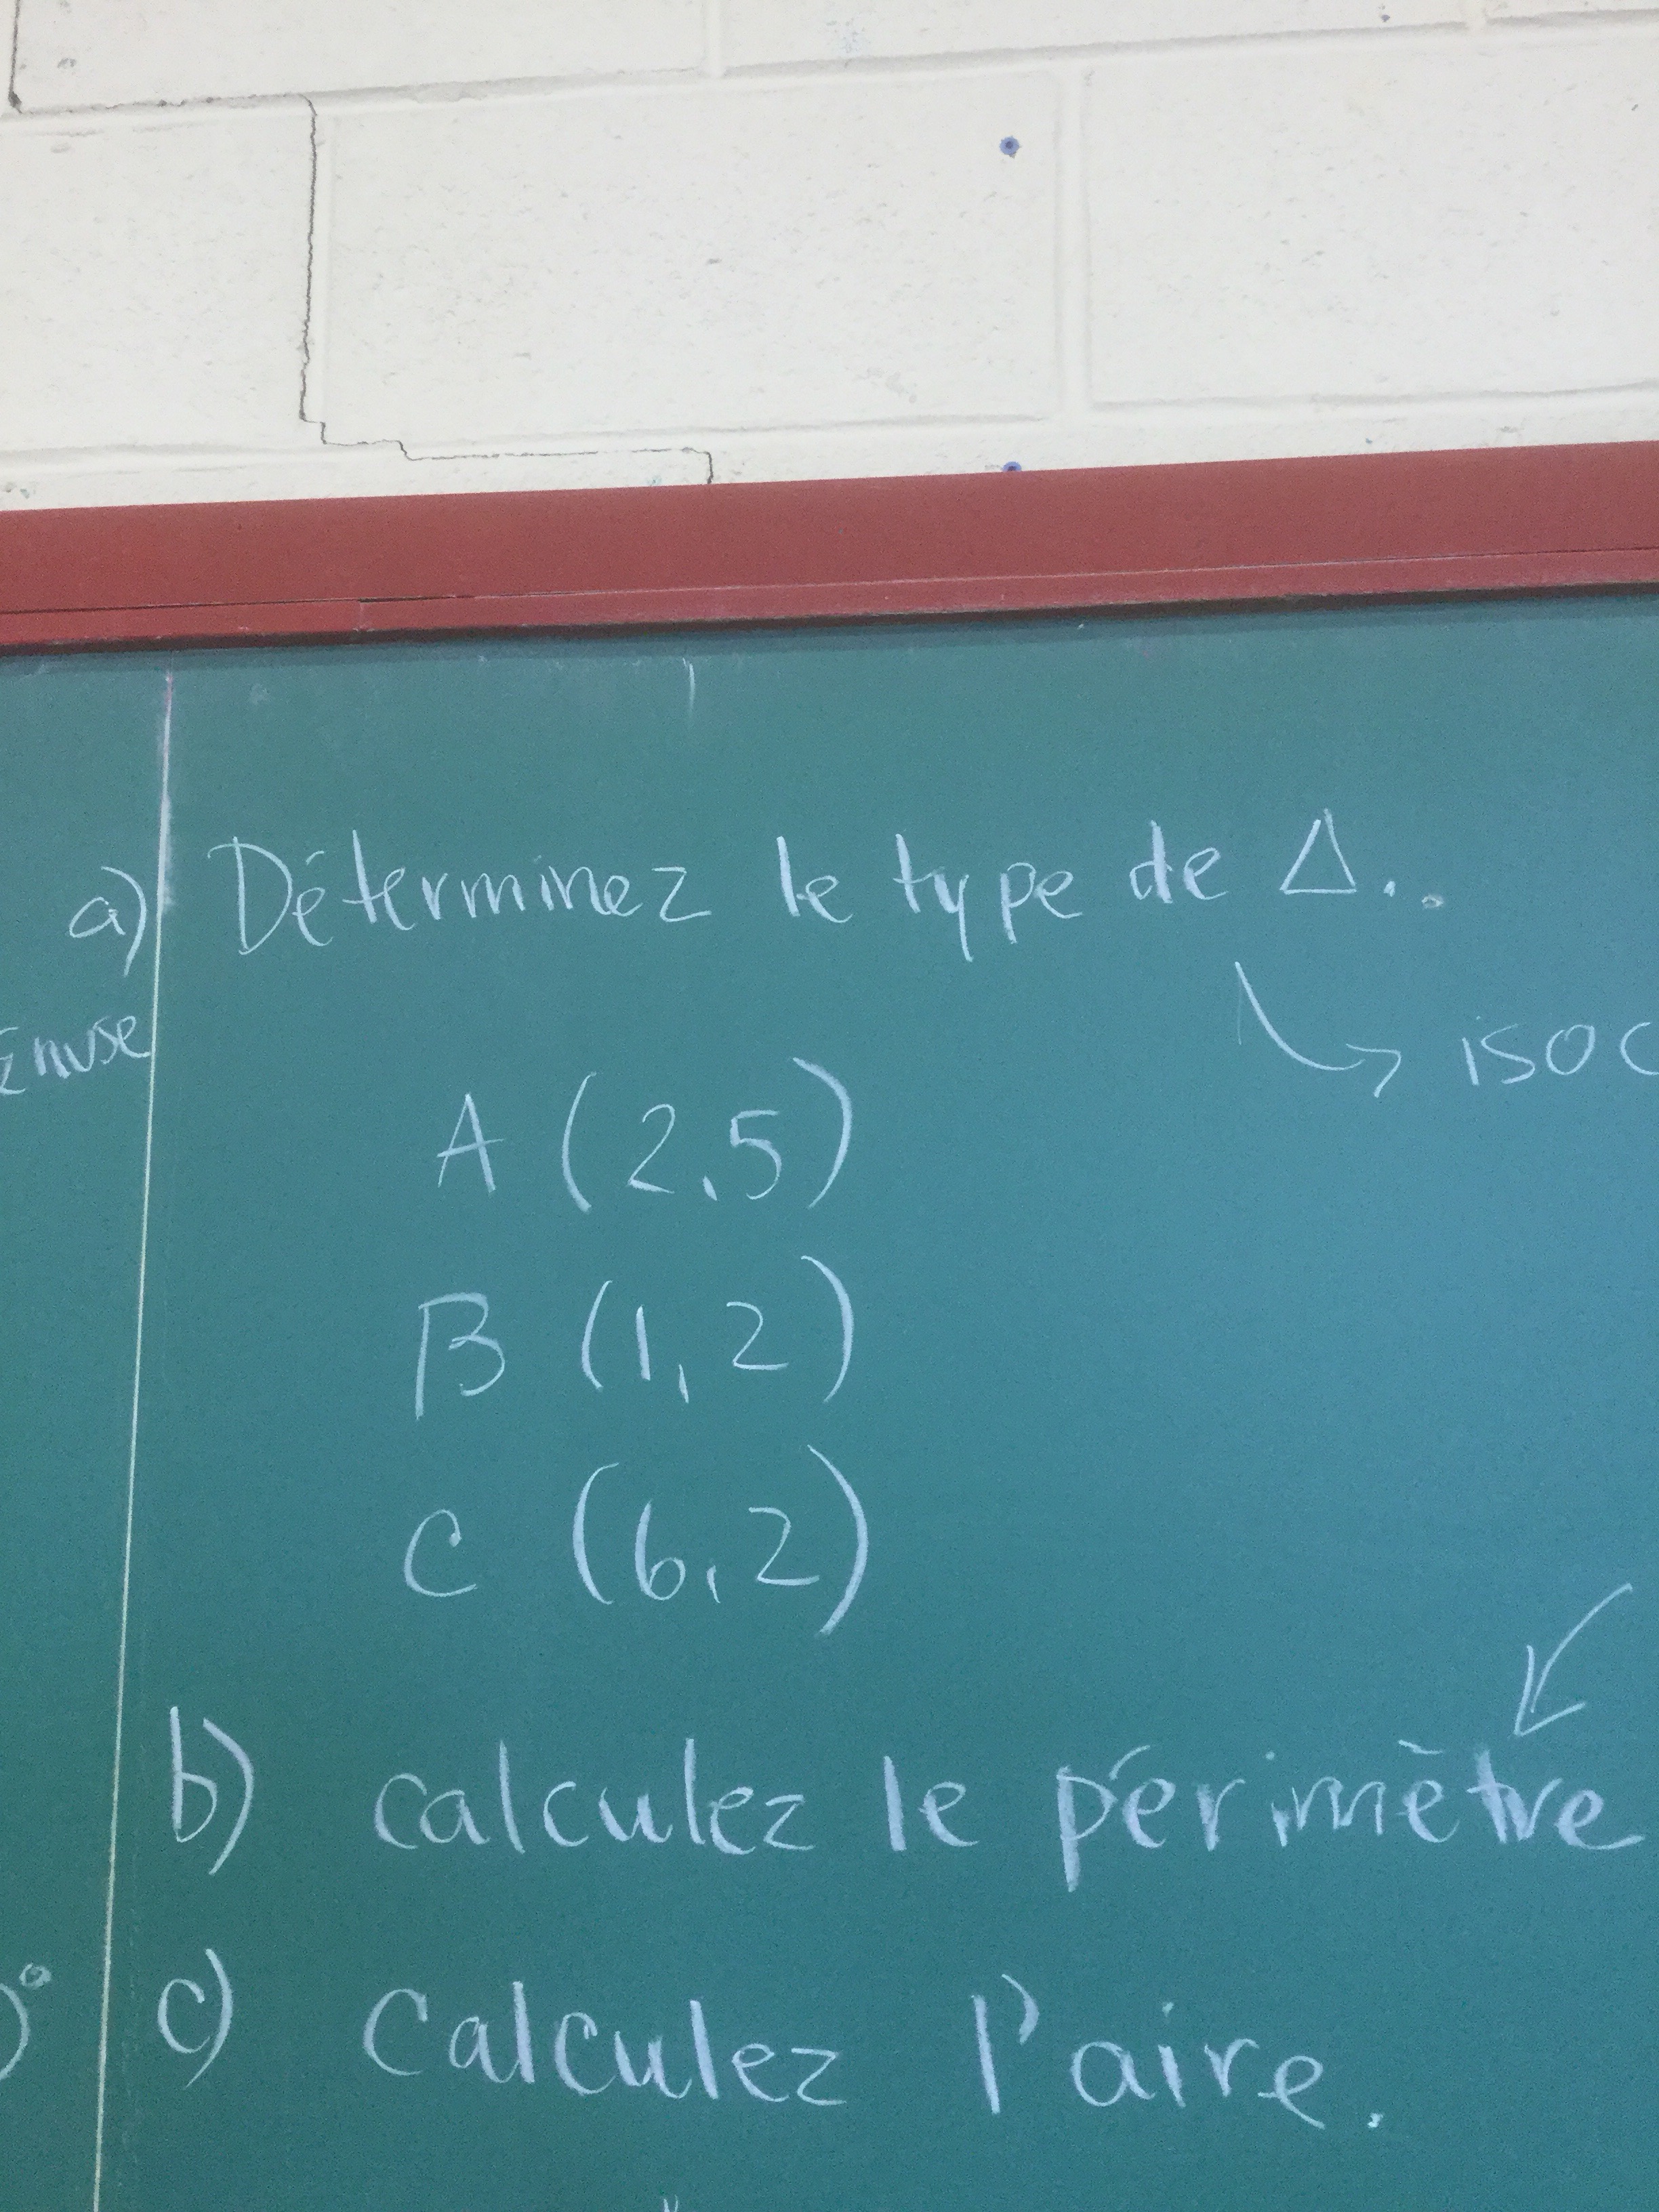
It was an isosceles triangle with a horizontal side, which made calculating the area pretty easy. We used distance formula to find the side lengths and then added them up to find the perimeter.
We then practiced finding the equation of the line containing the perpendicular bisector (médiatrice) of the non-congruent side…and compared the result to what we got when we calculated the equation of the median through C (the angle between the two congruent sides).
We had to review definitions, and make plans. A lot of this math is simple to calculate, but if you are not careful you can spend your time calculating unnecessary things.
Today we had 2 more triangles to work with
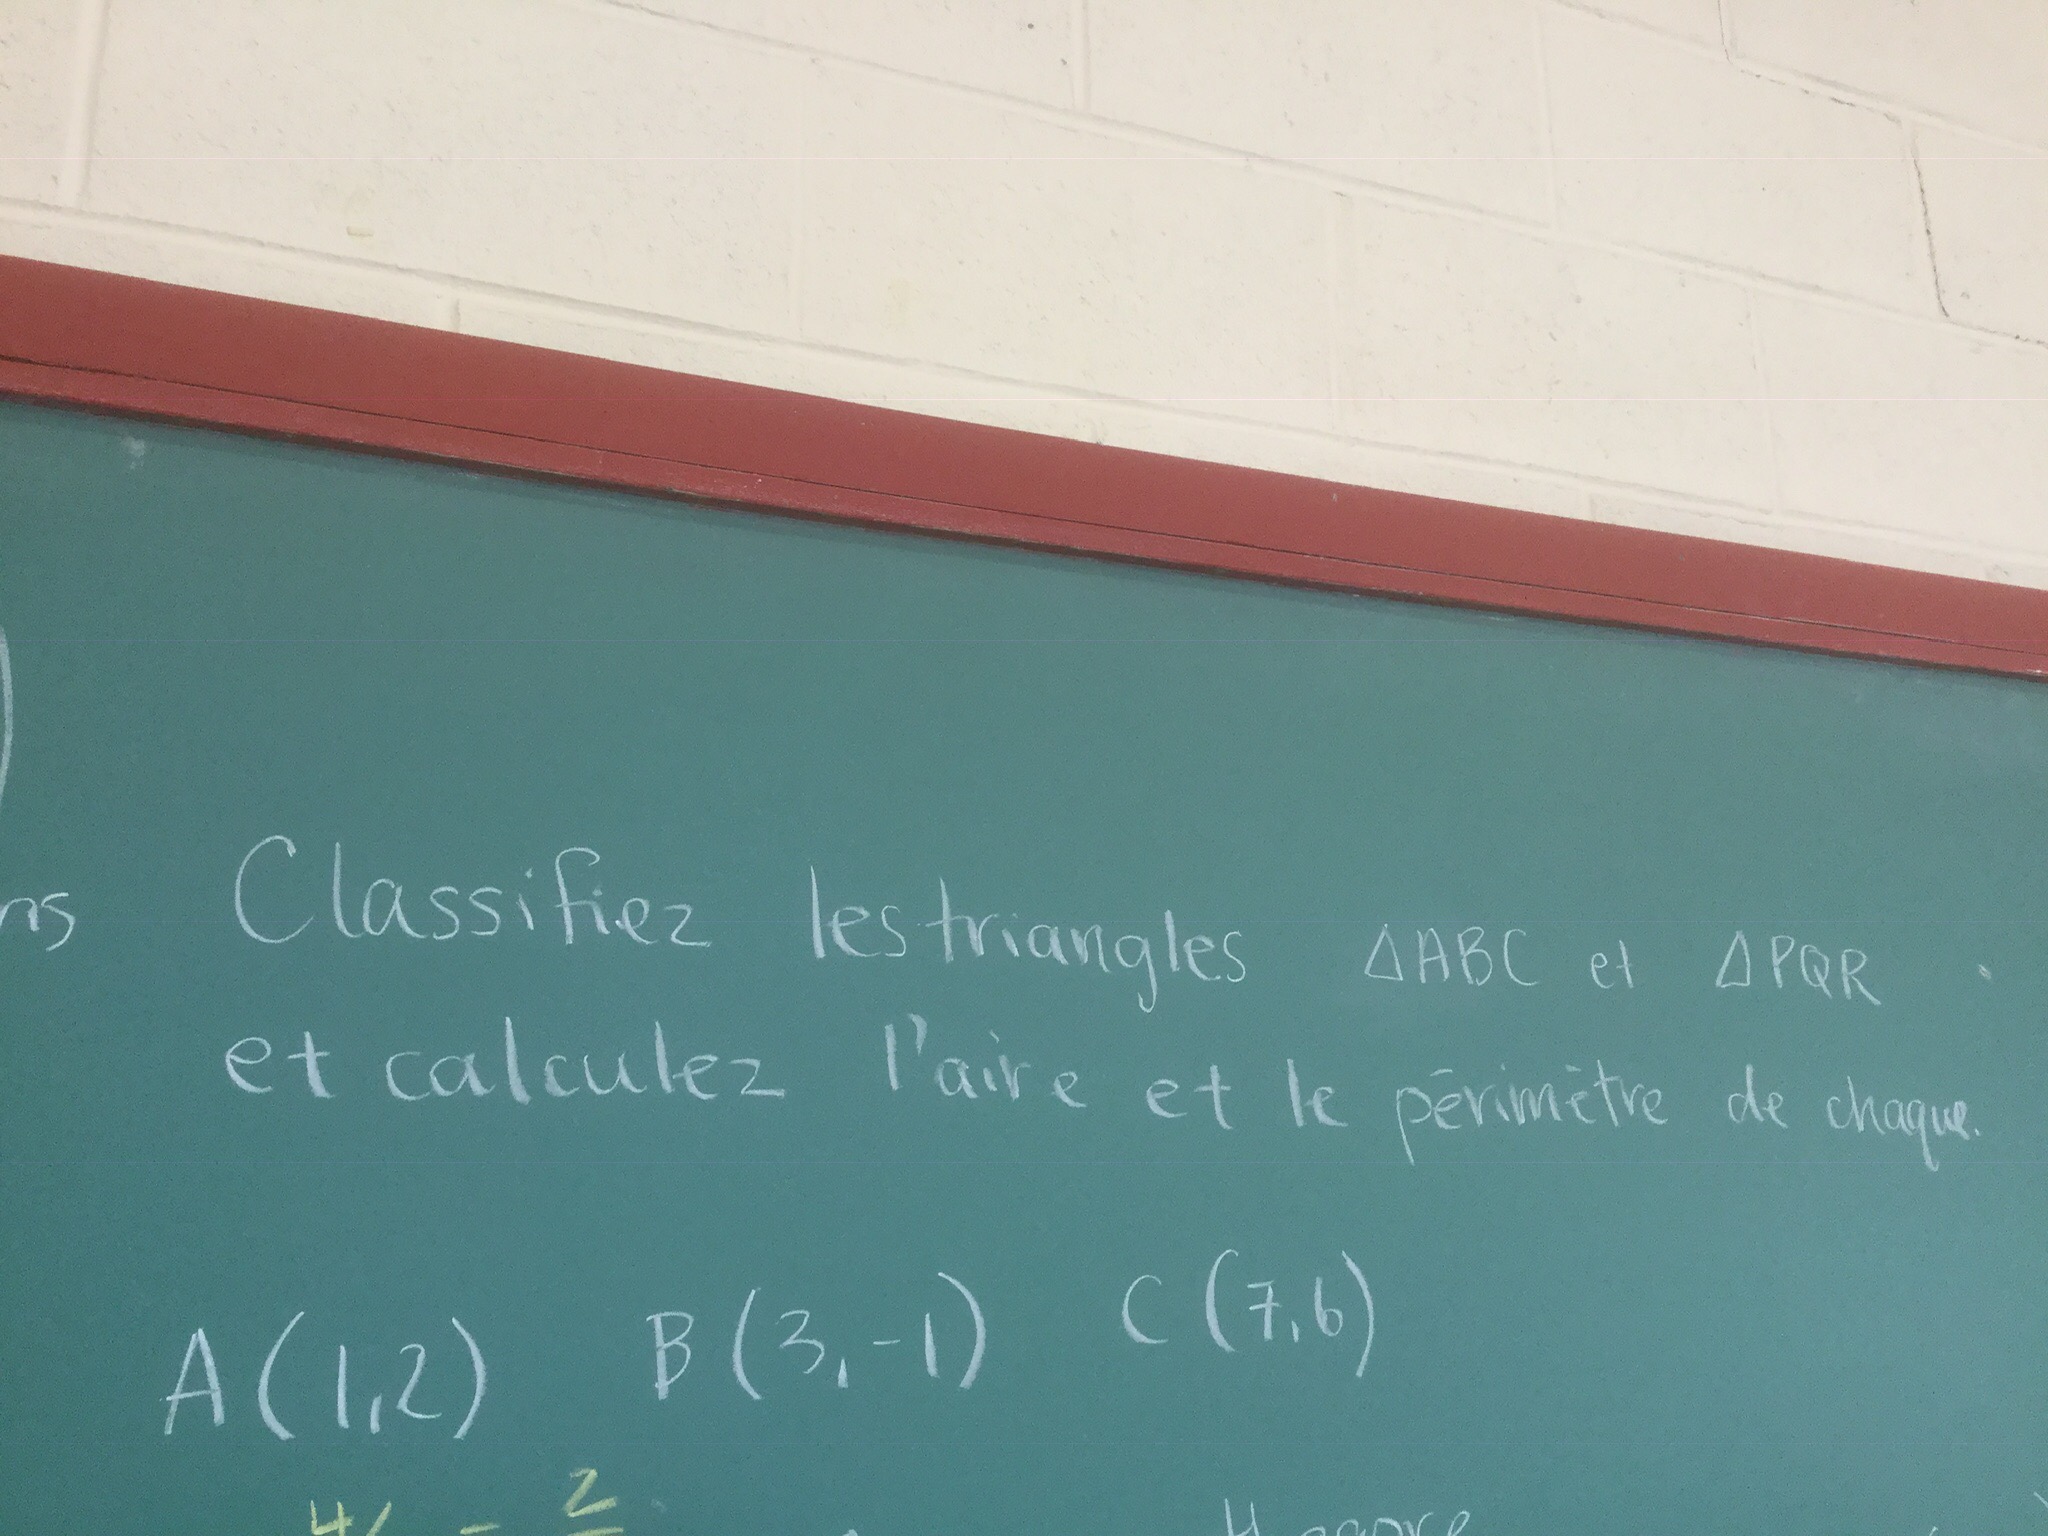
This was a right angle triangle that is also scalene. We proved it was a right triangle using slopes, and also using the pythagorean theorem. Once we know it is a right angle triangle we can use the perpendicular sides as base and height, and calculate the area.
The last triangle was not a right angle triangle.
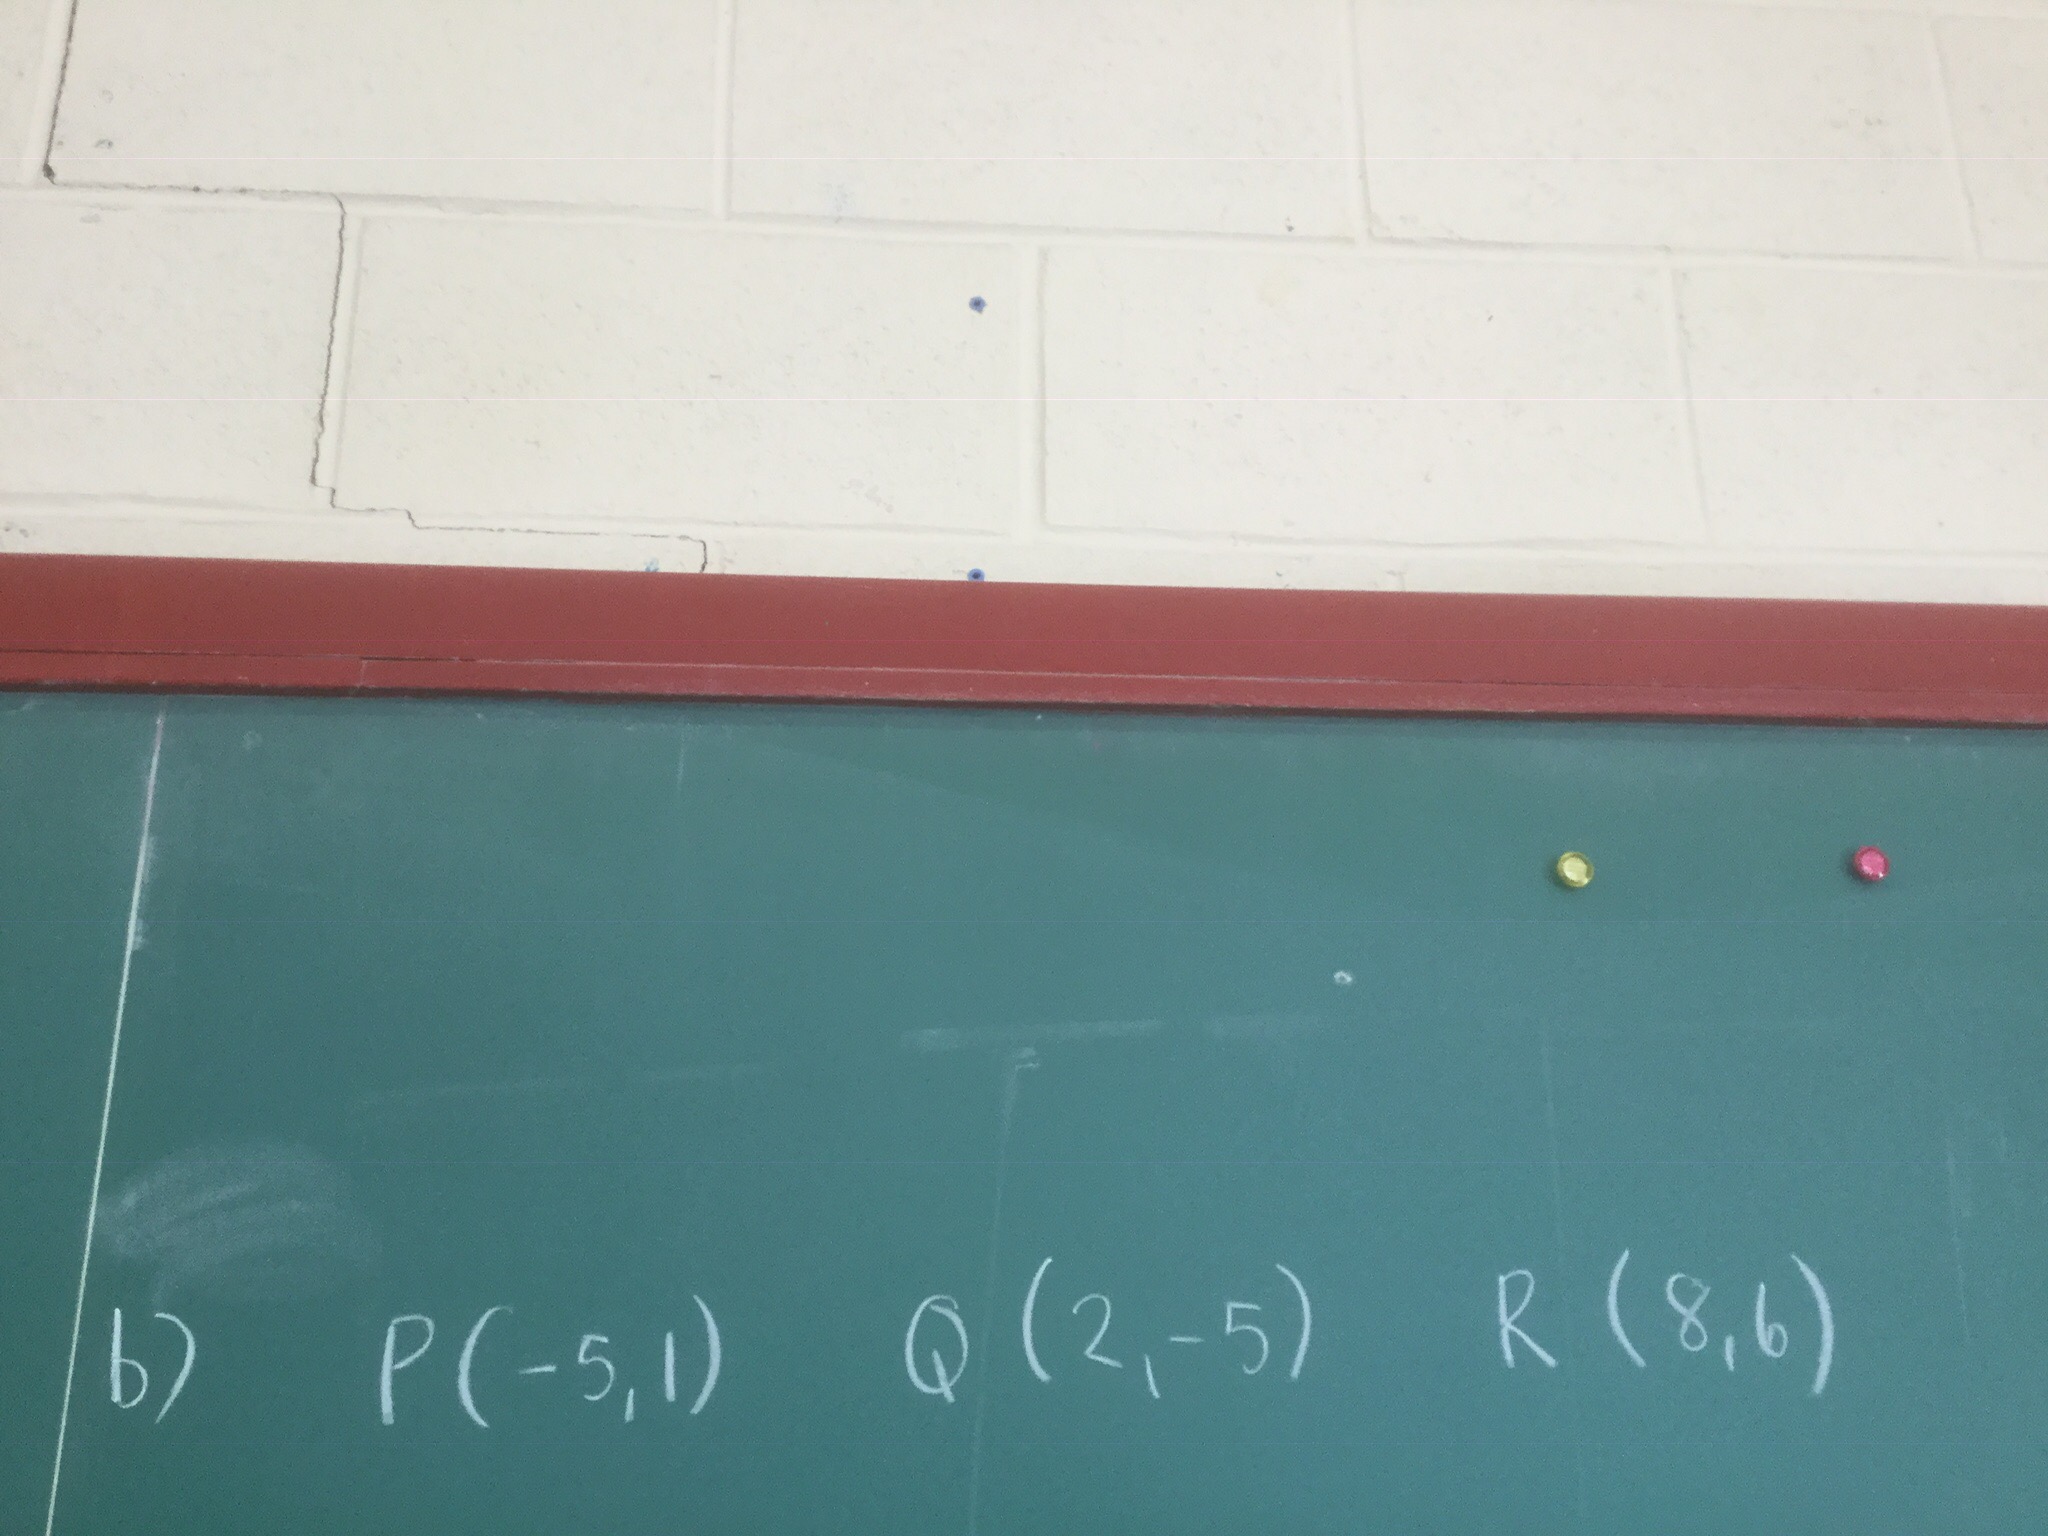
We needed to calculate the area. To do so we needed to calculate the height (altitude) of the triangle (the shortest distance between a point and the base). We created equations, substituted and solved. It took a long time to go through the process.
Afterwards we looked outside the triangle, and saw an elegant approach to finding the area.
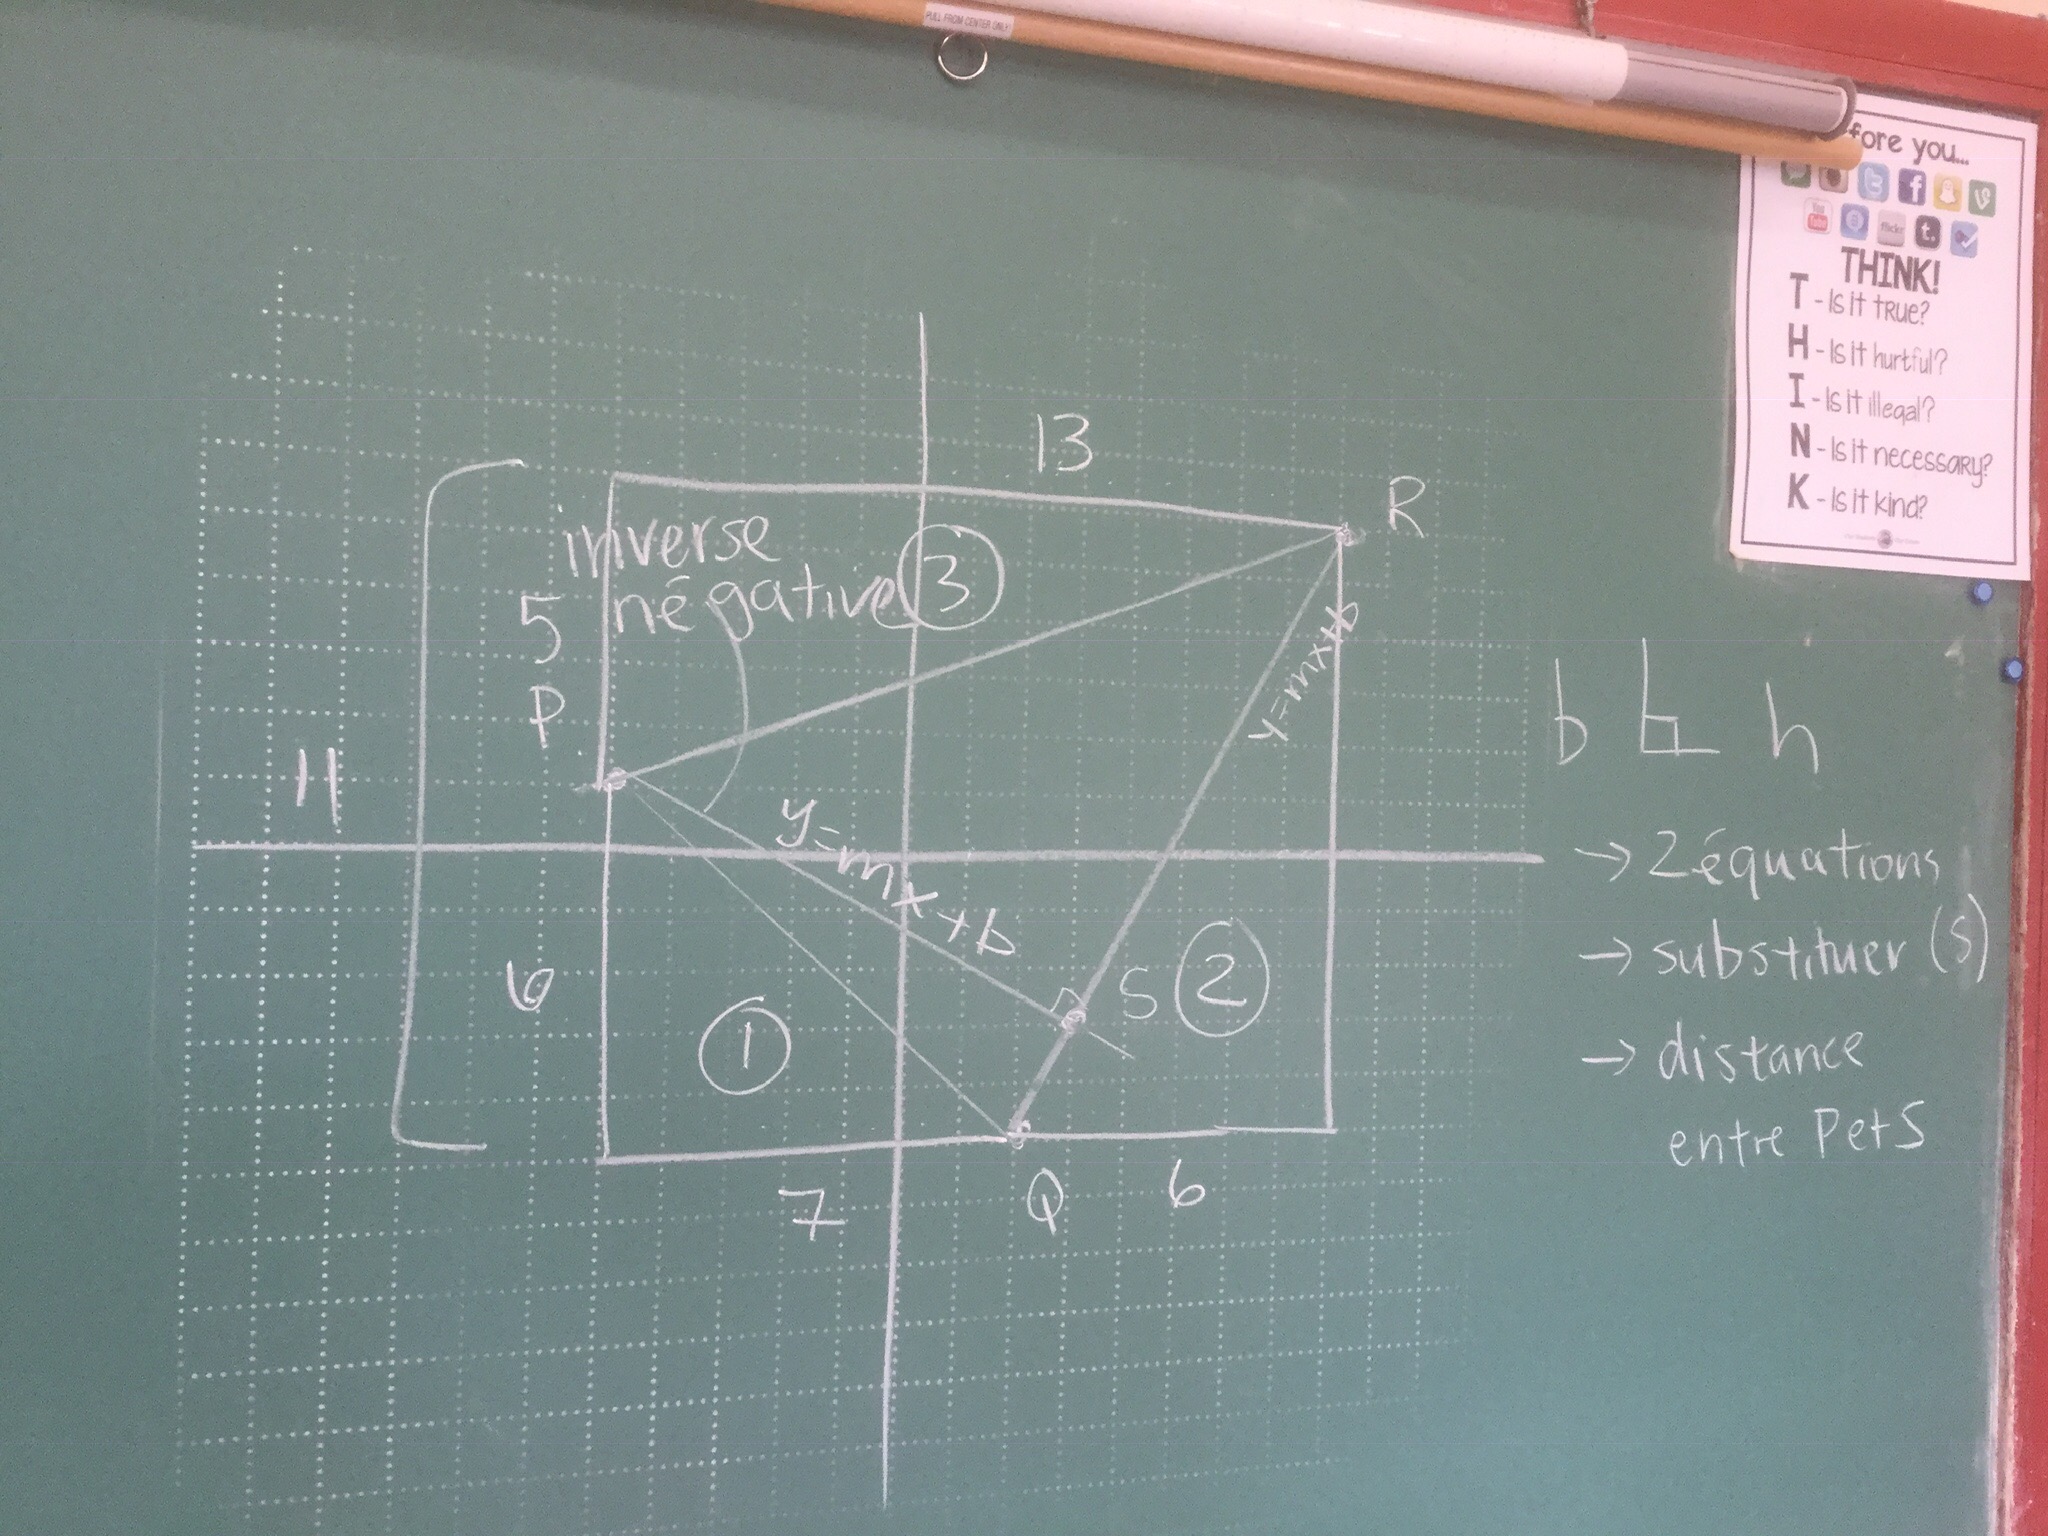
We can extend lines vertically and horizontally to create a rectangle enclosing the triangle. We can calculate the area of the rectangle, and then subtract the areas of the right angle triangles around our interior triangle. It’s so neat to see how these problems can be solved with many different approaches.
Growth rate of our beans
Today we looked at our beans’ growth. We have made scatter plots (and remade scatter plots). We are sure our axes are the right way around….we are sure that we have left space for weekends (even though we weren’t here to measure we know the beans still grew). We have looked at drawing lines of best fit, or curves of best fit. We have extrapolated and interpolated using these lines and curves.
Today’s new bean graph task was to determine the initial growth rate of the beans.
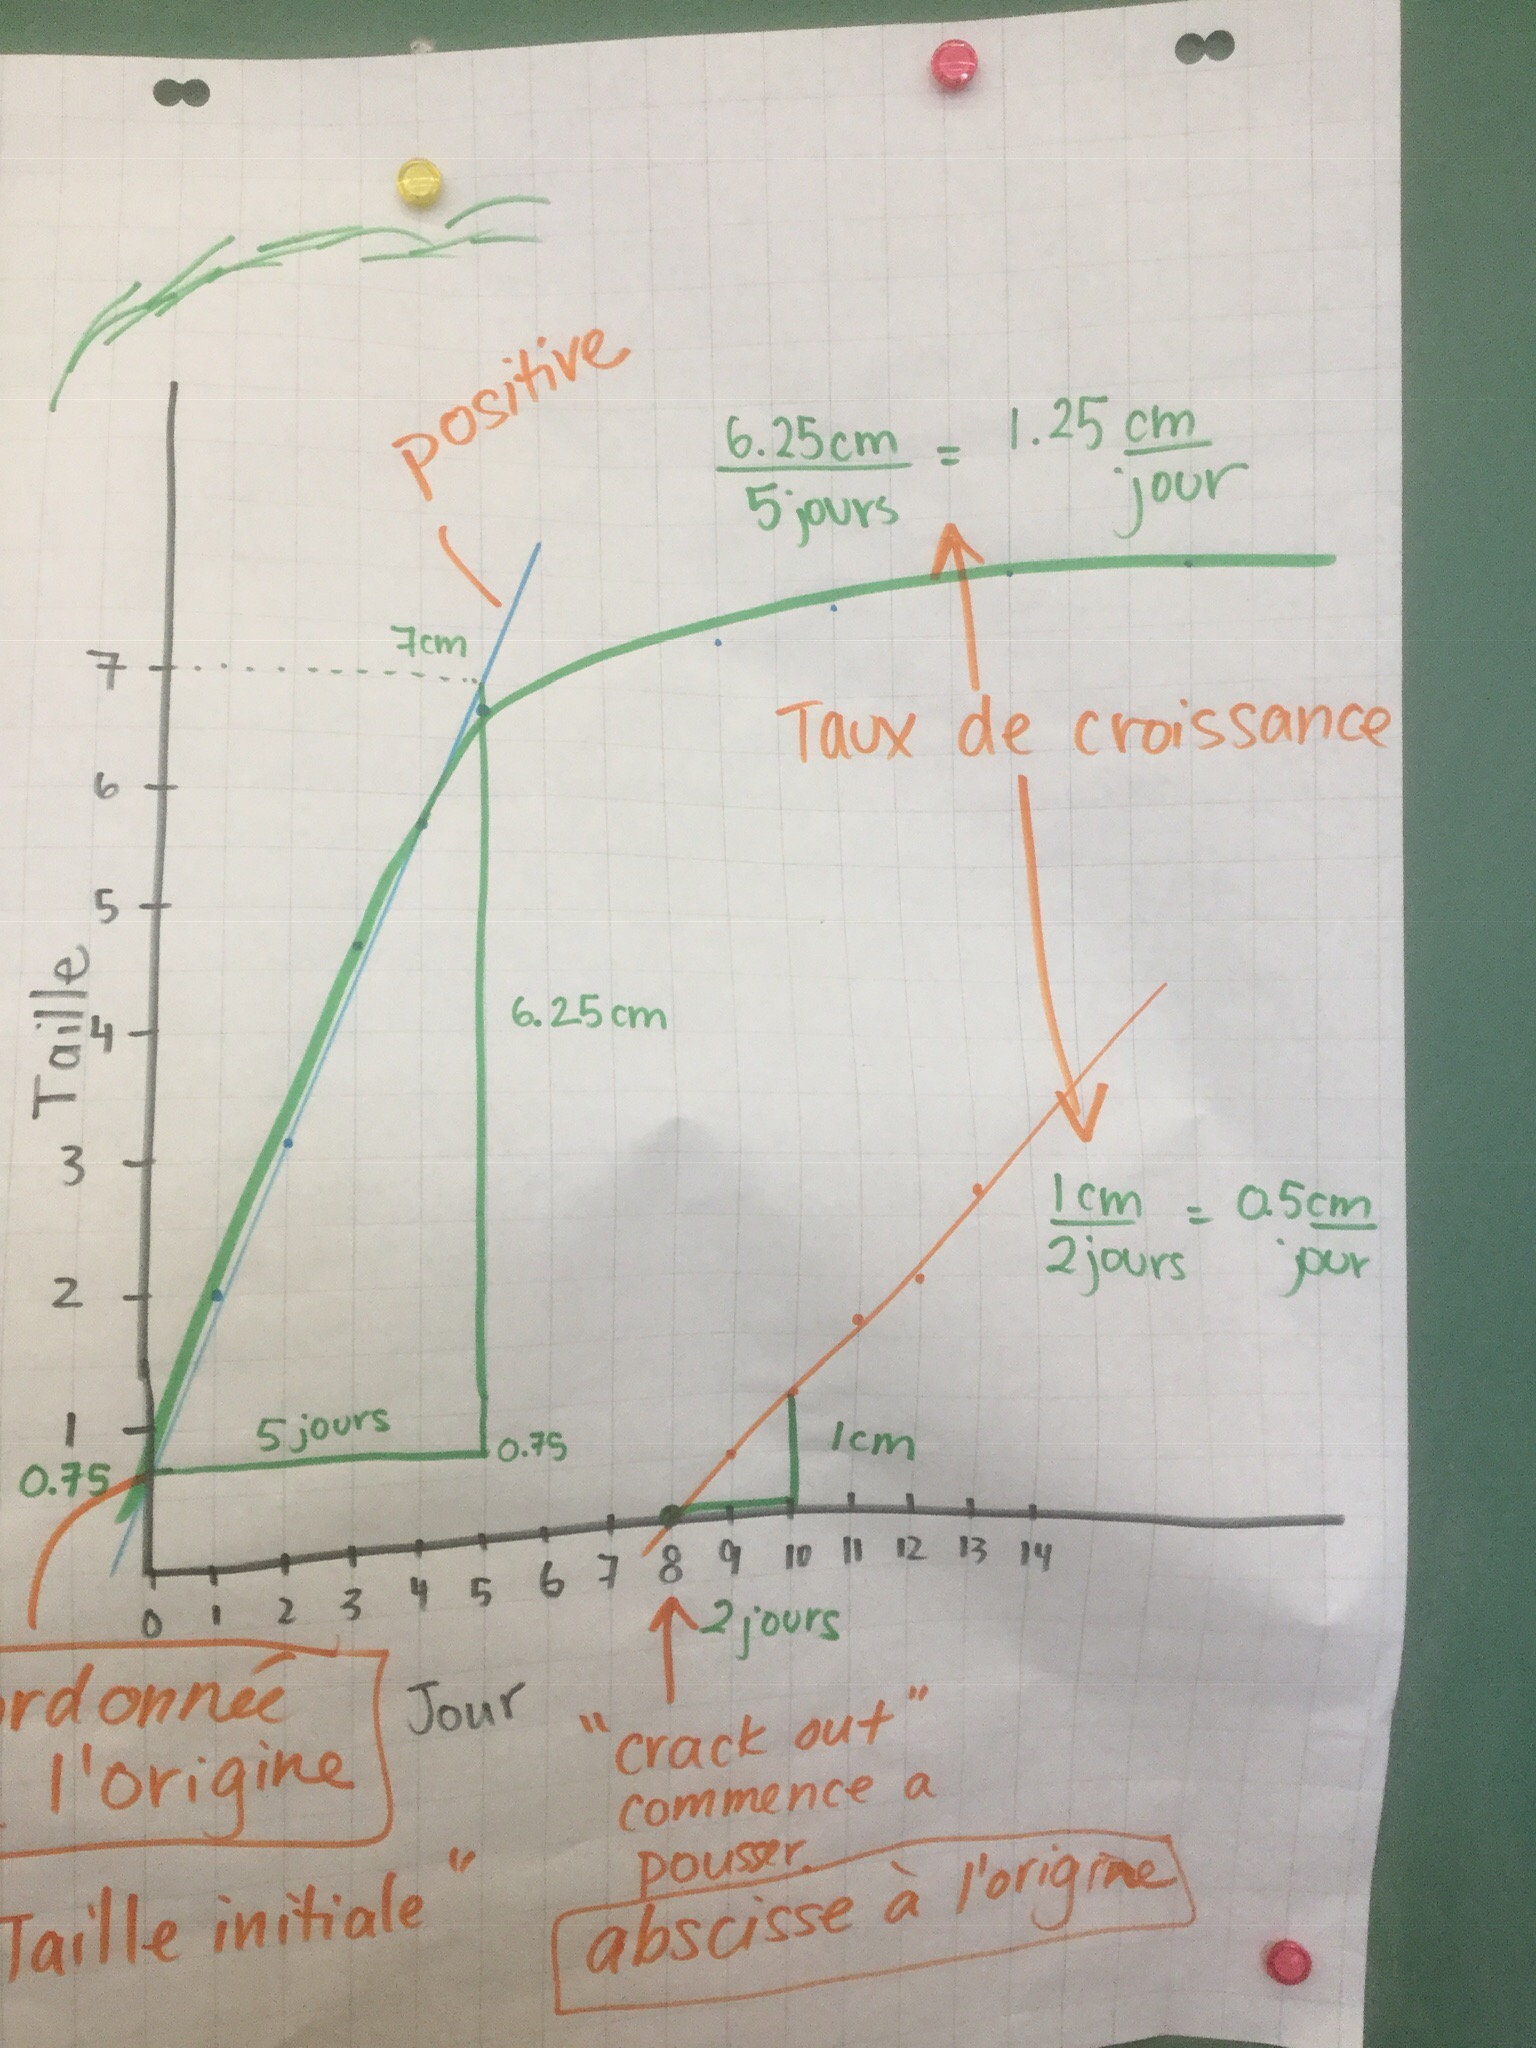
Here’s a graph we made to help us understand how to do that. We look at our line of best fit (or the best linear approximation of the curve at the start) and we pick 2 points on the line, and then make a right triangle. We look at the horizontal leg of the triangle to determine the number of days, and the vertical leg to determine the growth that happened. We make a fraction showing cm/day and then we divide the numerator by the denominator to determine the growth that happens in one day.
We also looked at steeper lines and saw that they have a higher growth rate, and less steel lines are growing, but not as fast.
We reviewed vocabulary for the intercepts. In this case the y intercept (l’ordonnée à l’origine) shows the initial height of the bean plant. In this case the x intercept (l’abscisse à l’origine) shows the first day that the bean cracks out of the soil and can be measured.
We have to be careful when we are using graphs that we read the numbers from the y axis, and not just count squares. Each square vertically on this graph represents 0.5cm.
