Technology in Grade 10
Today in grade 9 and 10 we were working with some new technology. Grade 10s were using the desmos geometry website to visualize some of our recent concepts like perpendicular bisector (médiatrice) and median (médiane). In French these words are so similar that they are often mixed up. We need a lot of practice and a good visual sense of what they are.
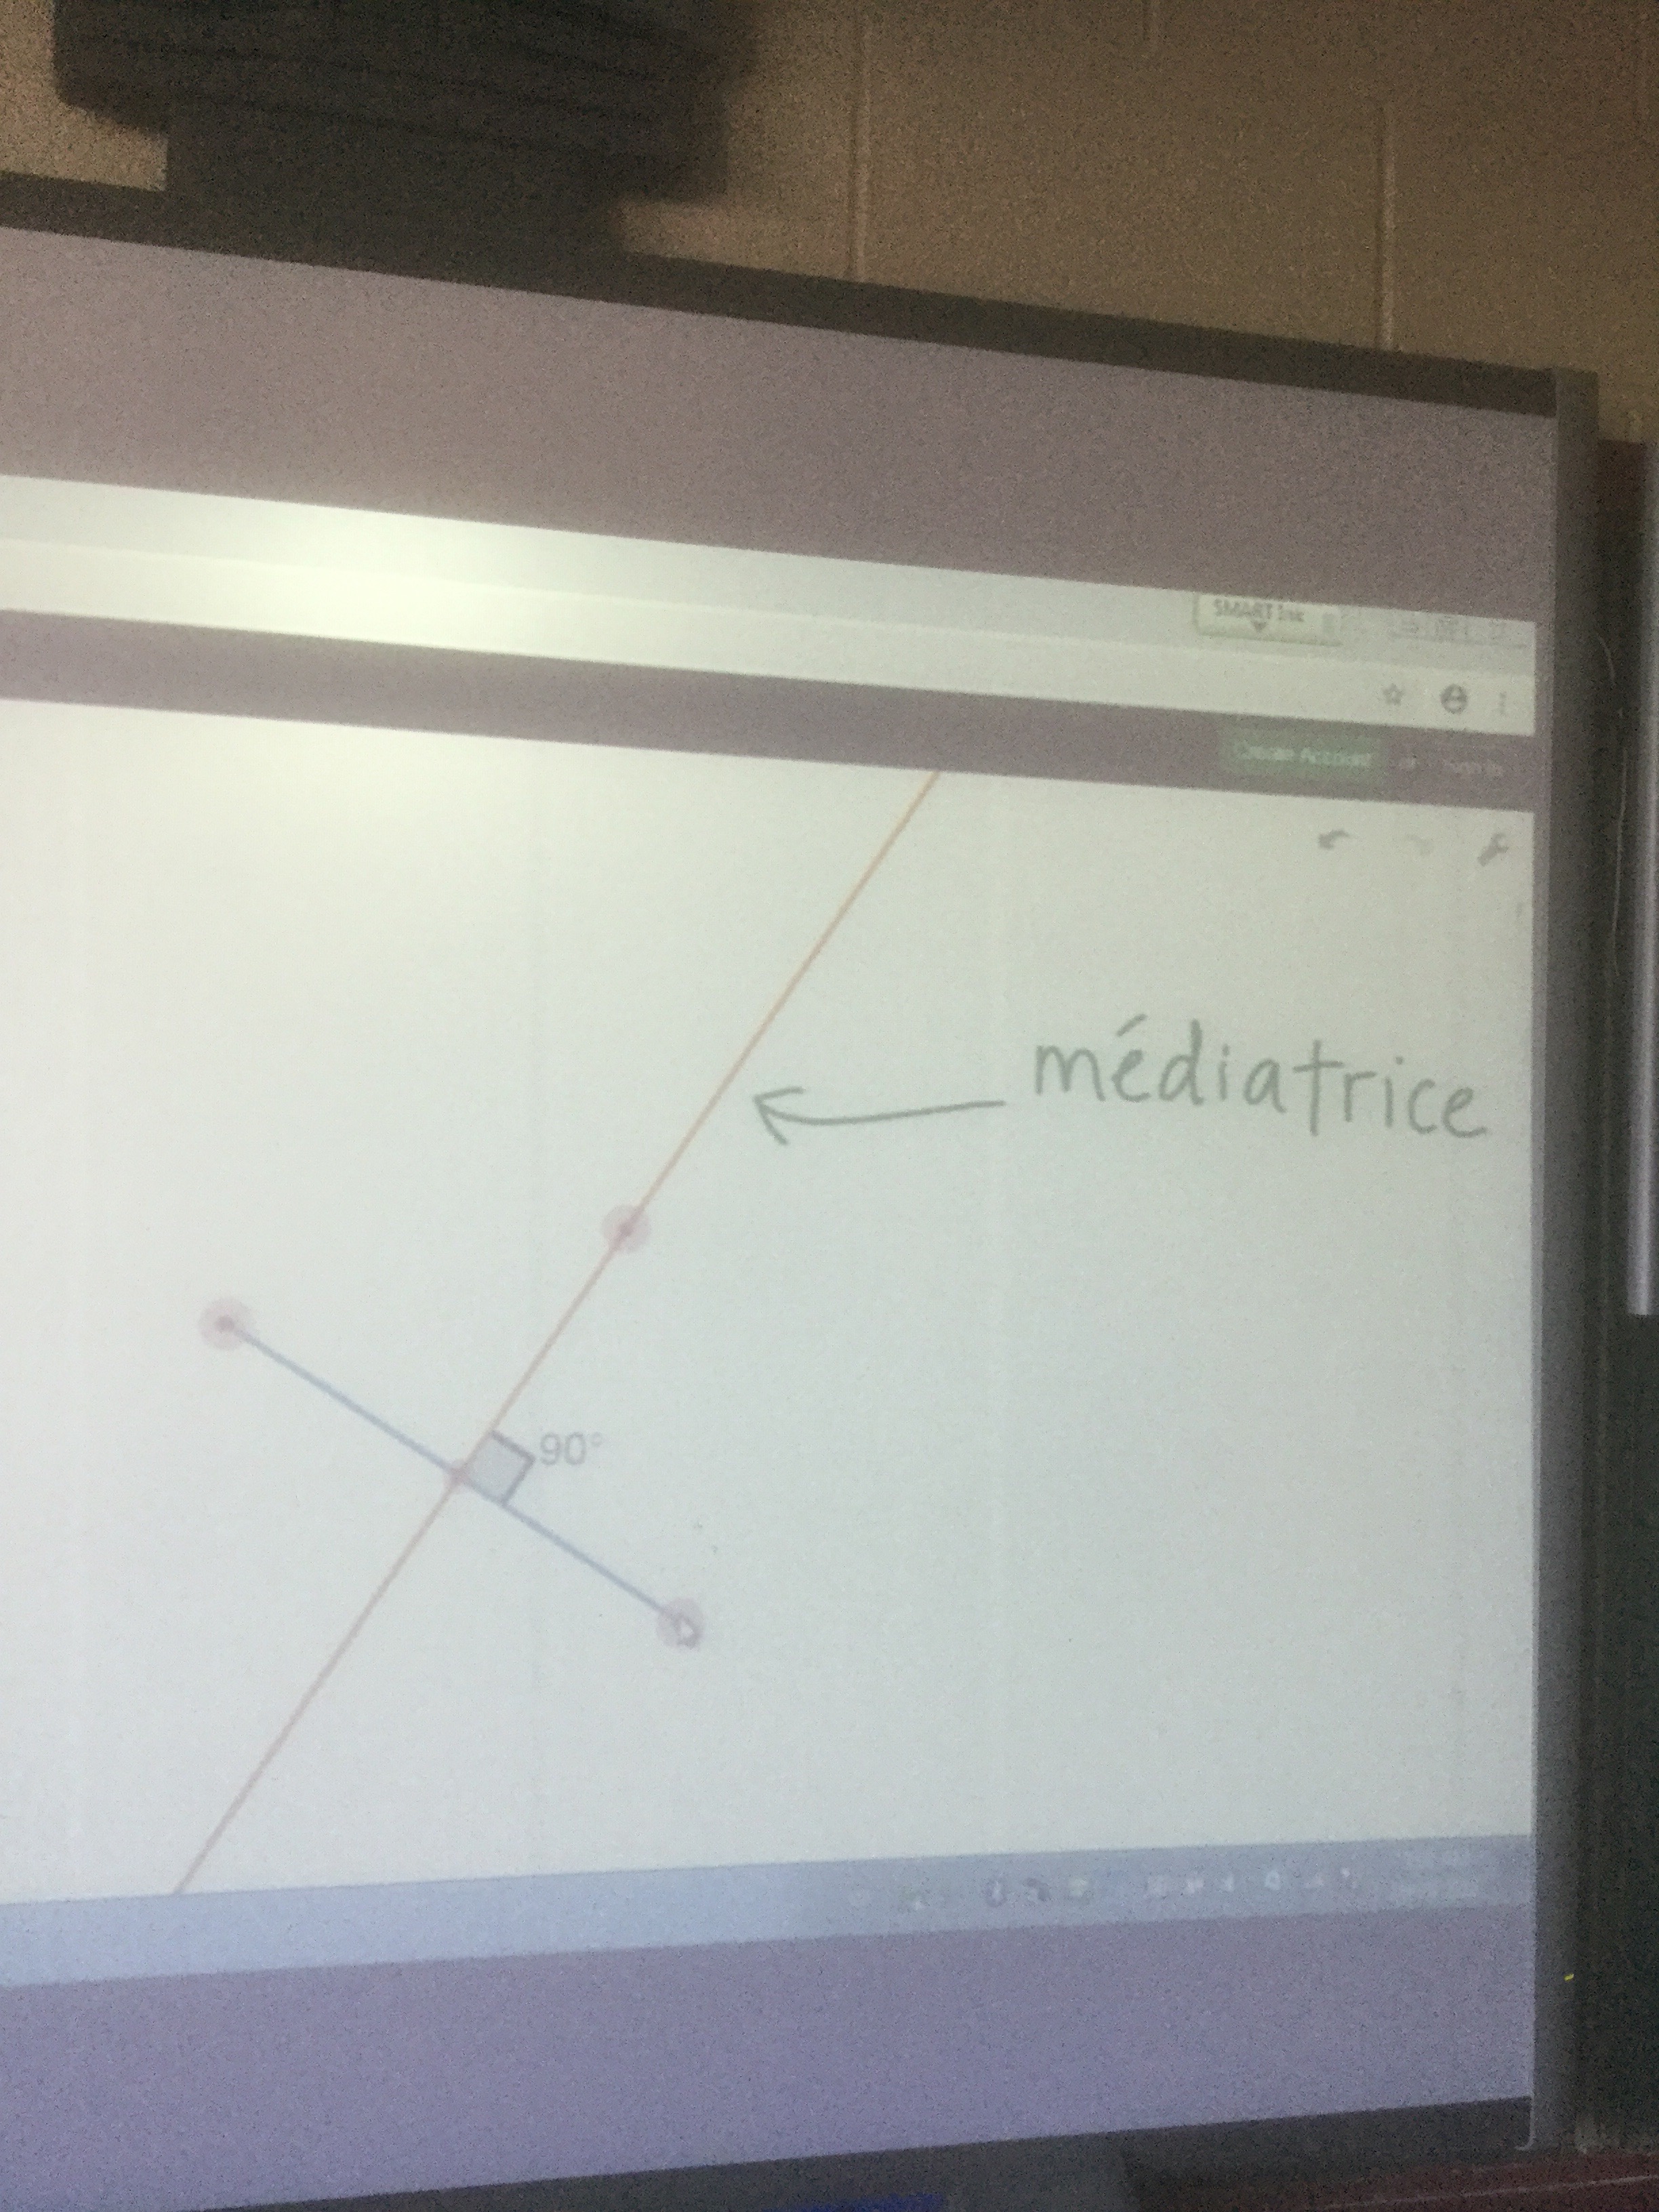
We could see that for isosceles triangles the “médiane” and “médiatrice” are the same for the non congruent side (it’s perpendicular to the side), and for an equilateral triangle all of the “médiane” and “médiatrice” are equal.

This program is great because you can construct something and then drag points around and see how the concepts are visually related.
Here’s a wordy question that we tried. “Show algebraically that the perpendicular bisectors of the legs of a right triangle intersect at the midpoint of the hypotenuse.”

We analysed what the words told us, and what pictures came to mind. We can show graphically that it is true.
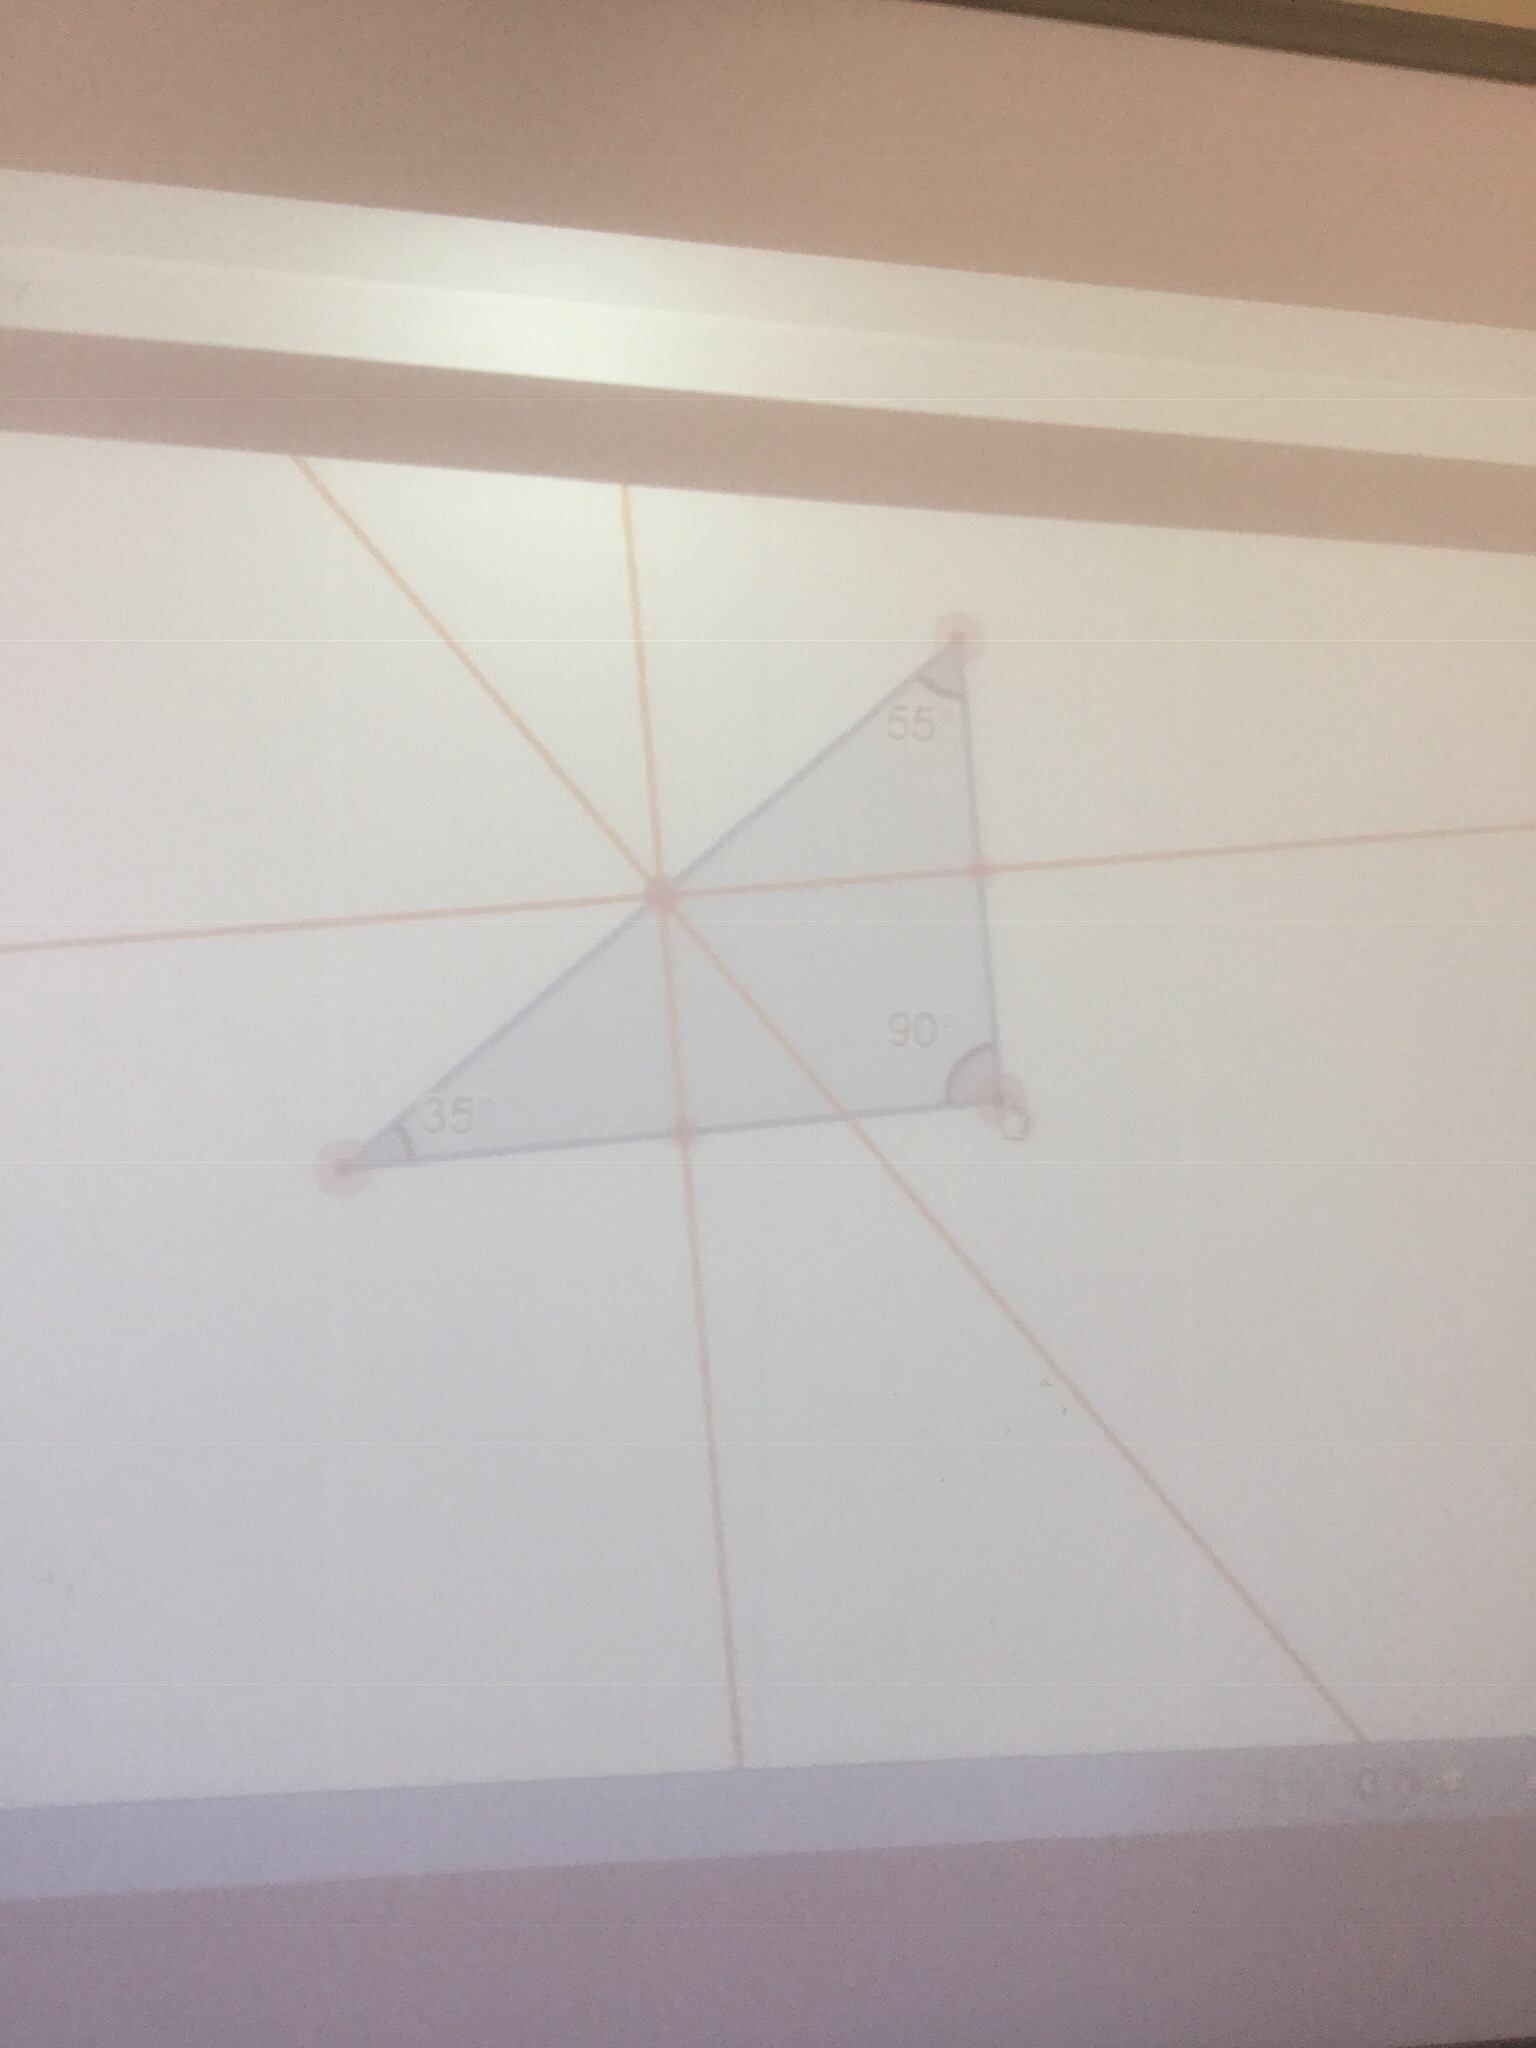
And with some strategic calculations we can also verify algebraically.

Math speed dating
We’ve done a lot of practice with visual patterns, graphs, and expressions. Today we added tables of values, and made our expressions into equations using c= in front of the expression we already know how to find. C in this case represented squares (carrés) or things (choses). 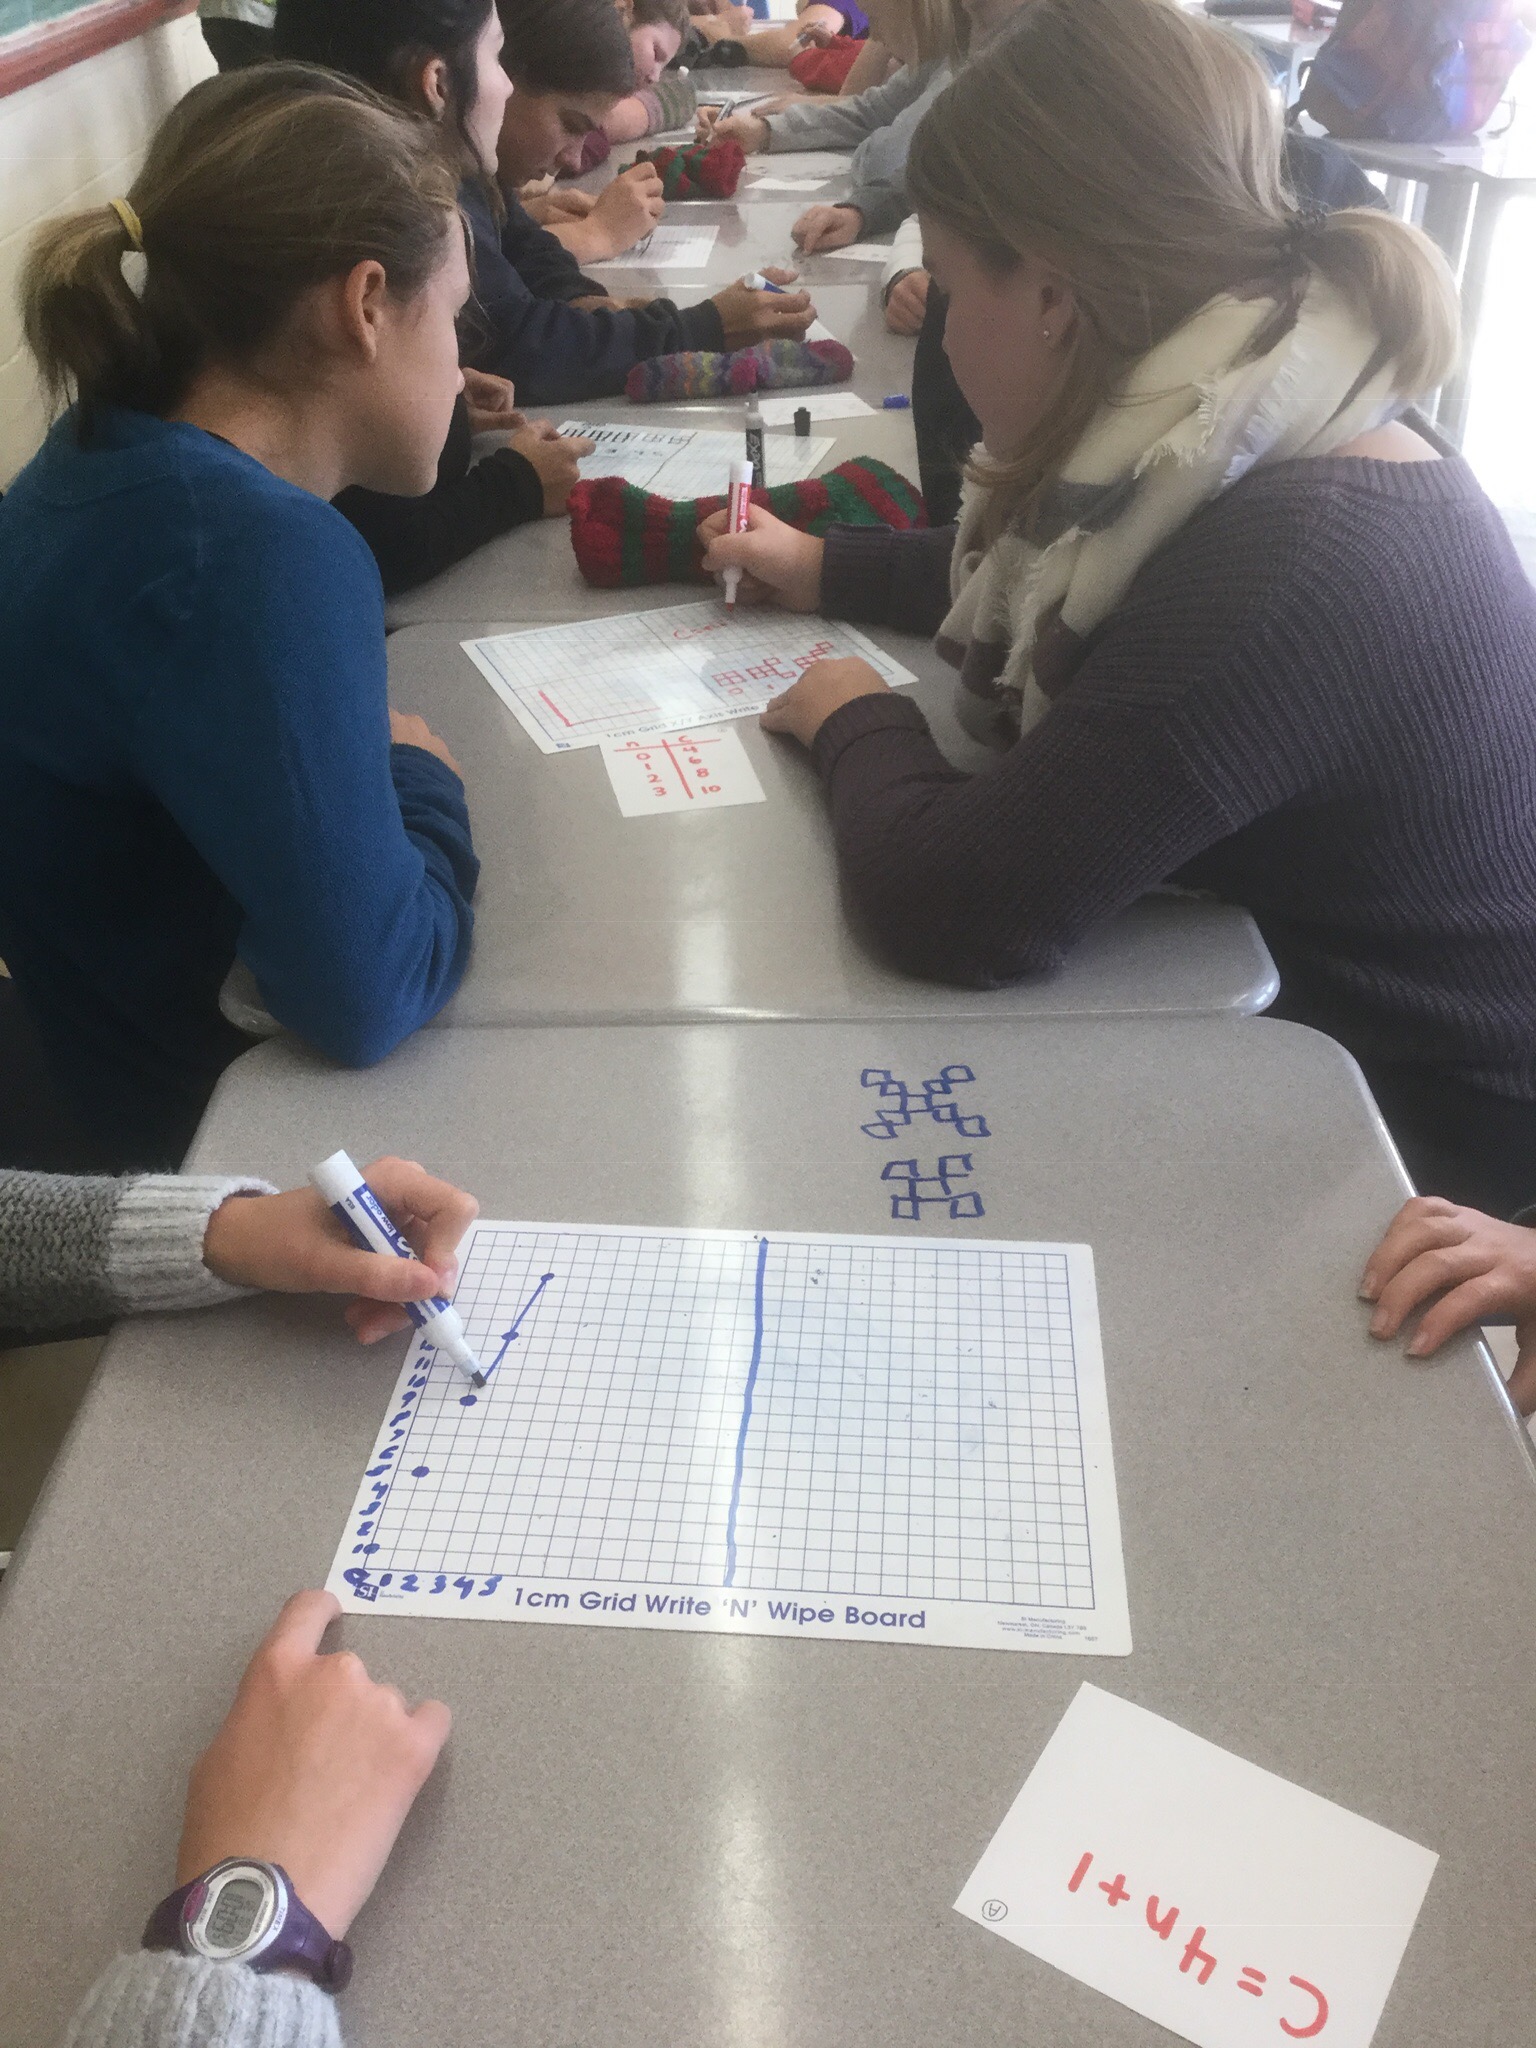
The activity is done in pairs, but the pairs change every 3 minutes. Desks are arranged in a long line, with chairs on opposite sides of each desk. Each pair (opposite each other) has a question card. Today they had one of our representations, and the task was to create the 3 missing representations. We had markers and tiles and white board out on the desks and many people wrote on the desks too. Fuzzy socks are our friends! (They make the best erasers).

In pairs both people make sure they understand each of the representations, and feel like an expert. This took about 5 minutes. After this point one row of students stand up and shift one position to their right (the displaced person circles back to fill the gap left at the start of the row). They are now going to solve the question in front of them with the help/prompting/guidance/quality control of the “expert” who did the question initially and didn’t change places yet. This step took about 3 minutes for these questions today. After the timer beeped, the previous expert row stands up and shifts to their right (forming a new pair)

We took pictures of our work for our portfolio task which is due this Friday.
We are getting good at showing our work, and connecting the various representations. We can identify the constant term, and how many groups of “n” we are adding or taking away.

A special note goes to period C who determined that in order to fit 15 desks (to accommodate our class of 30) we’d need to use the diagonal of the room. They used their knowledge of the pythagorean theorem! We measured first to be sure it’d work.
Good work today grade 9s. You are all getting to be experts!

Thinking outside the triangle
In grade 10 we’ve been working on classifying triangles using their coordinate points, and calculating perimeter and area. We worked on this one yesterday
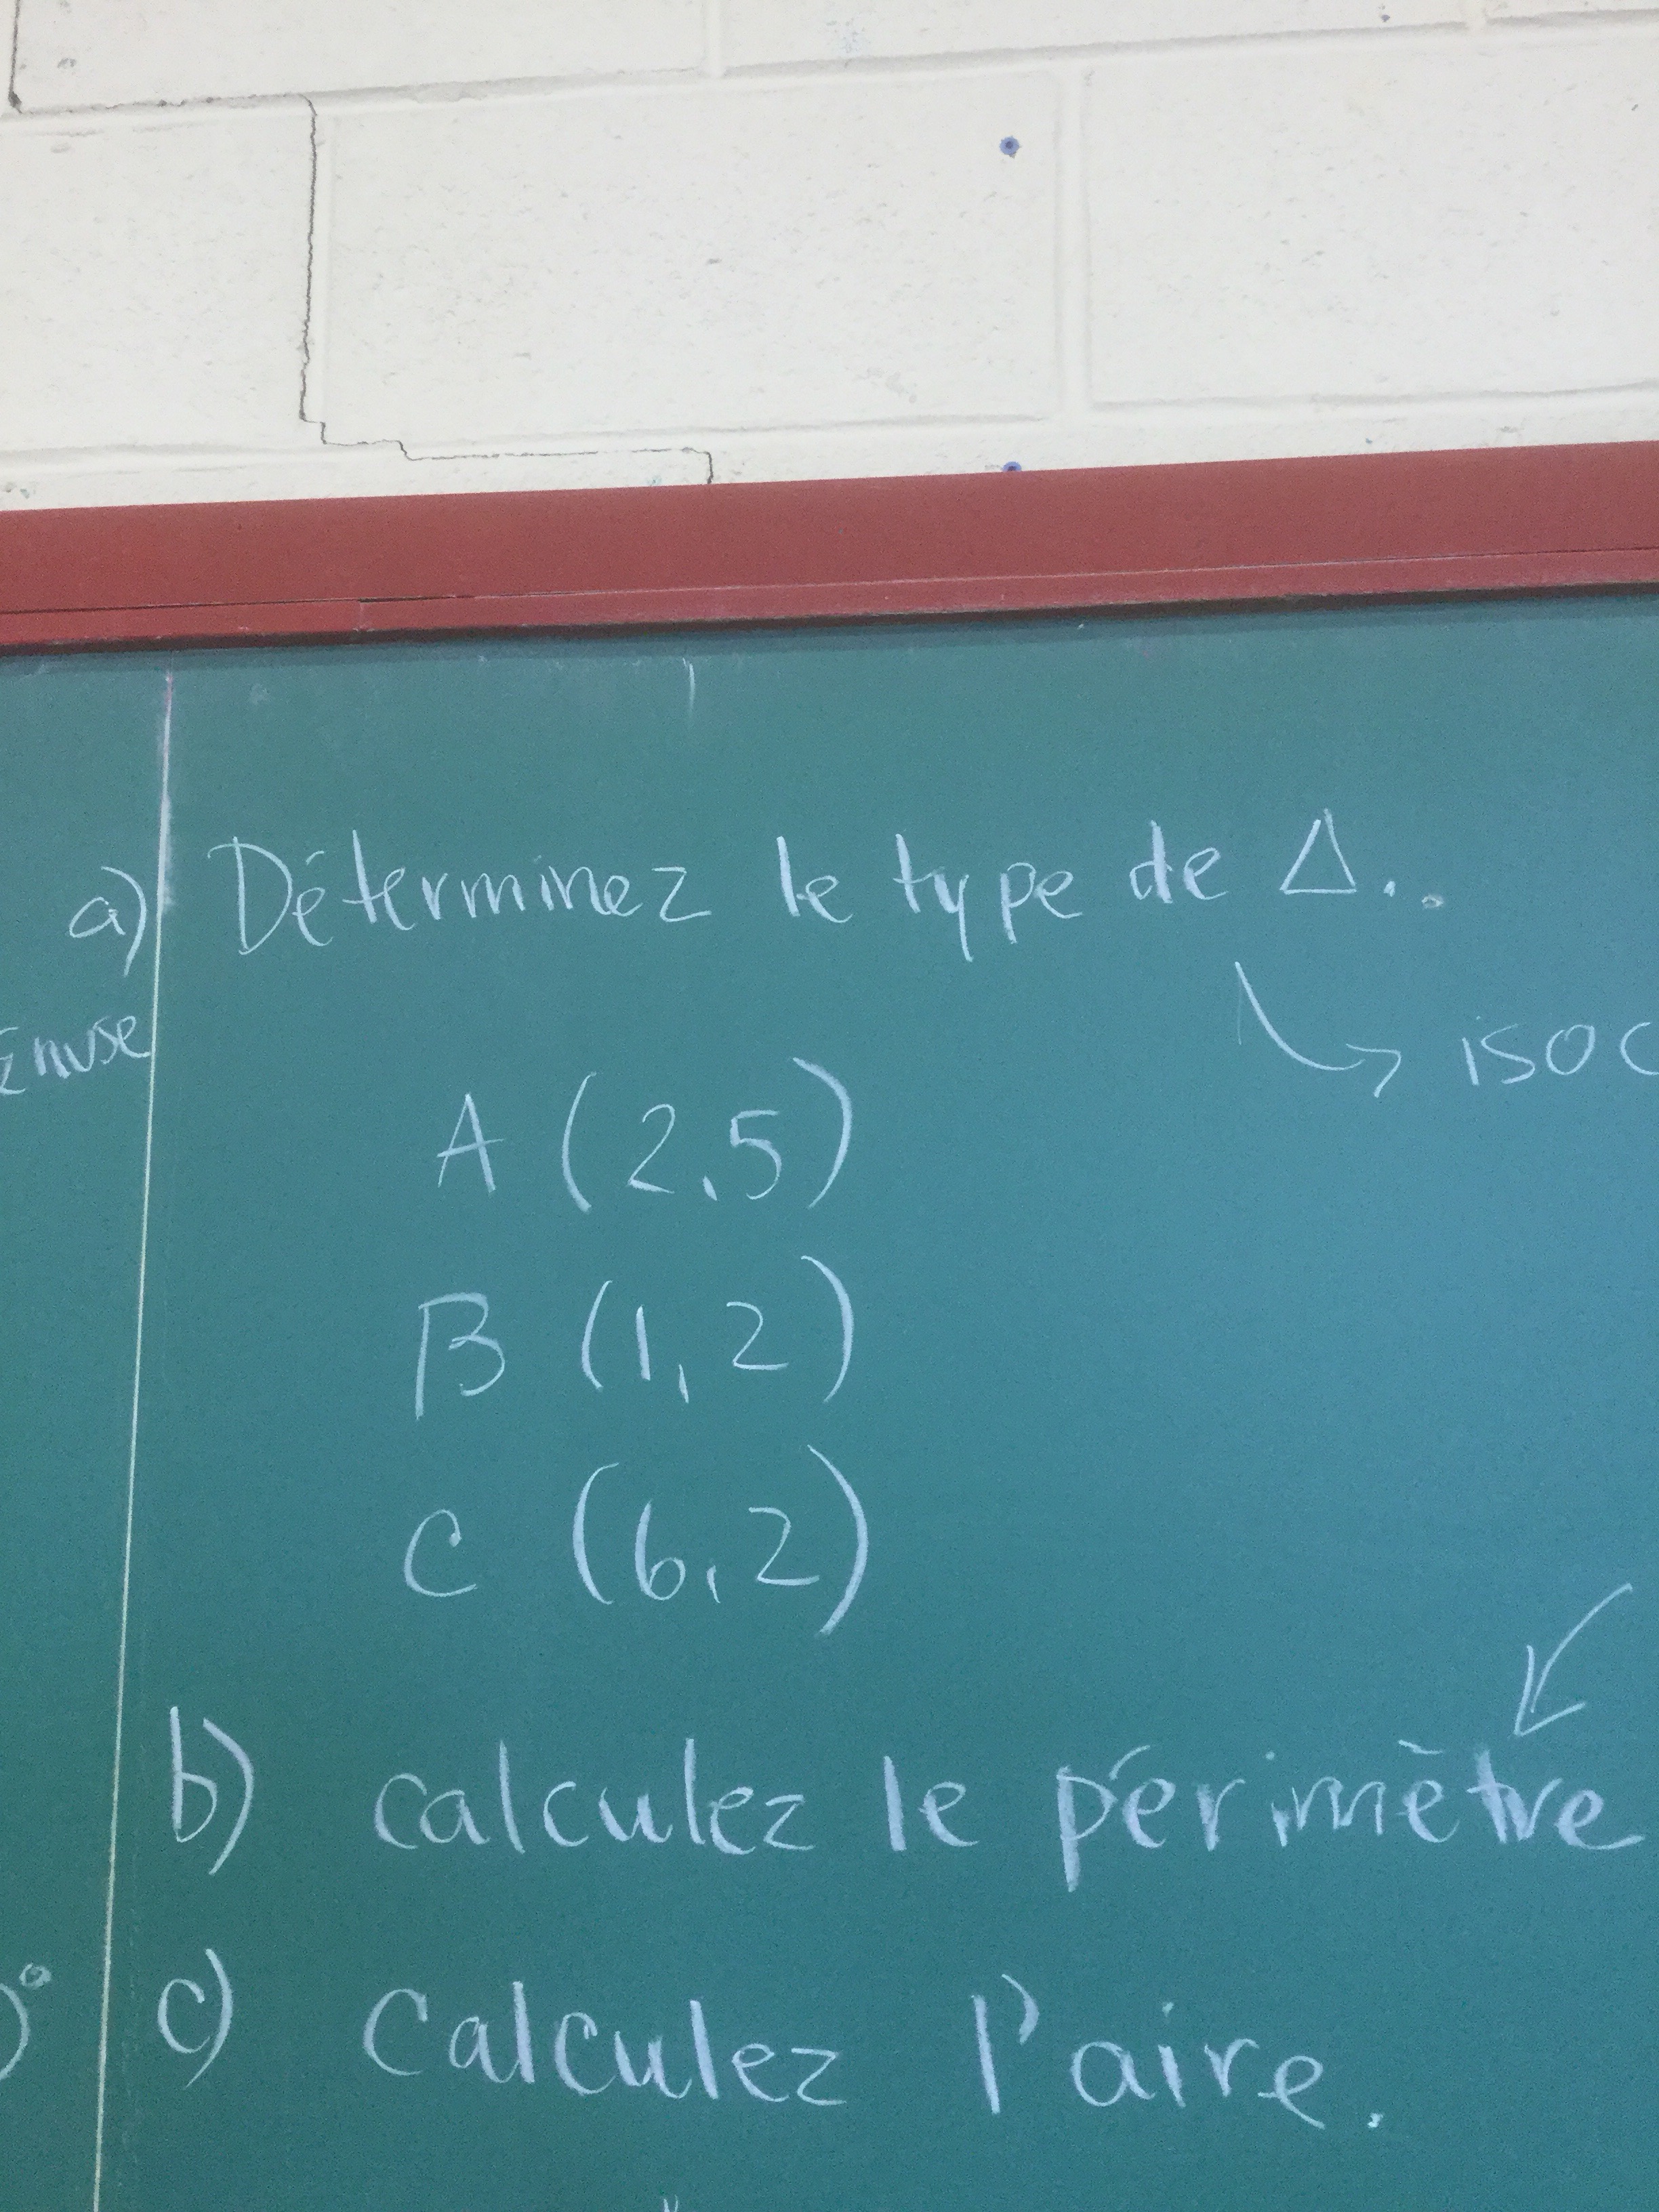
It was an isosceles triangle with a horizontal side, which made calculating the area pretty easy. We used distance formula to find the side lengths and then added them up to find the perimeter.
We then practiced finding the equation of the line containing the perpendicular bisector (médiatrice) of the non-congruent side…and compared the result to what we got when we calculated the equation of the median through C (the angle between the two congruent sides).
We had to review definitions, and make plans. A lot of this math is simple to calculate, but if you are not careful you can spend your time calculating unnecessary things.
Today we had 2 more triangles to work with
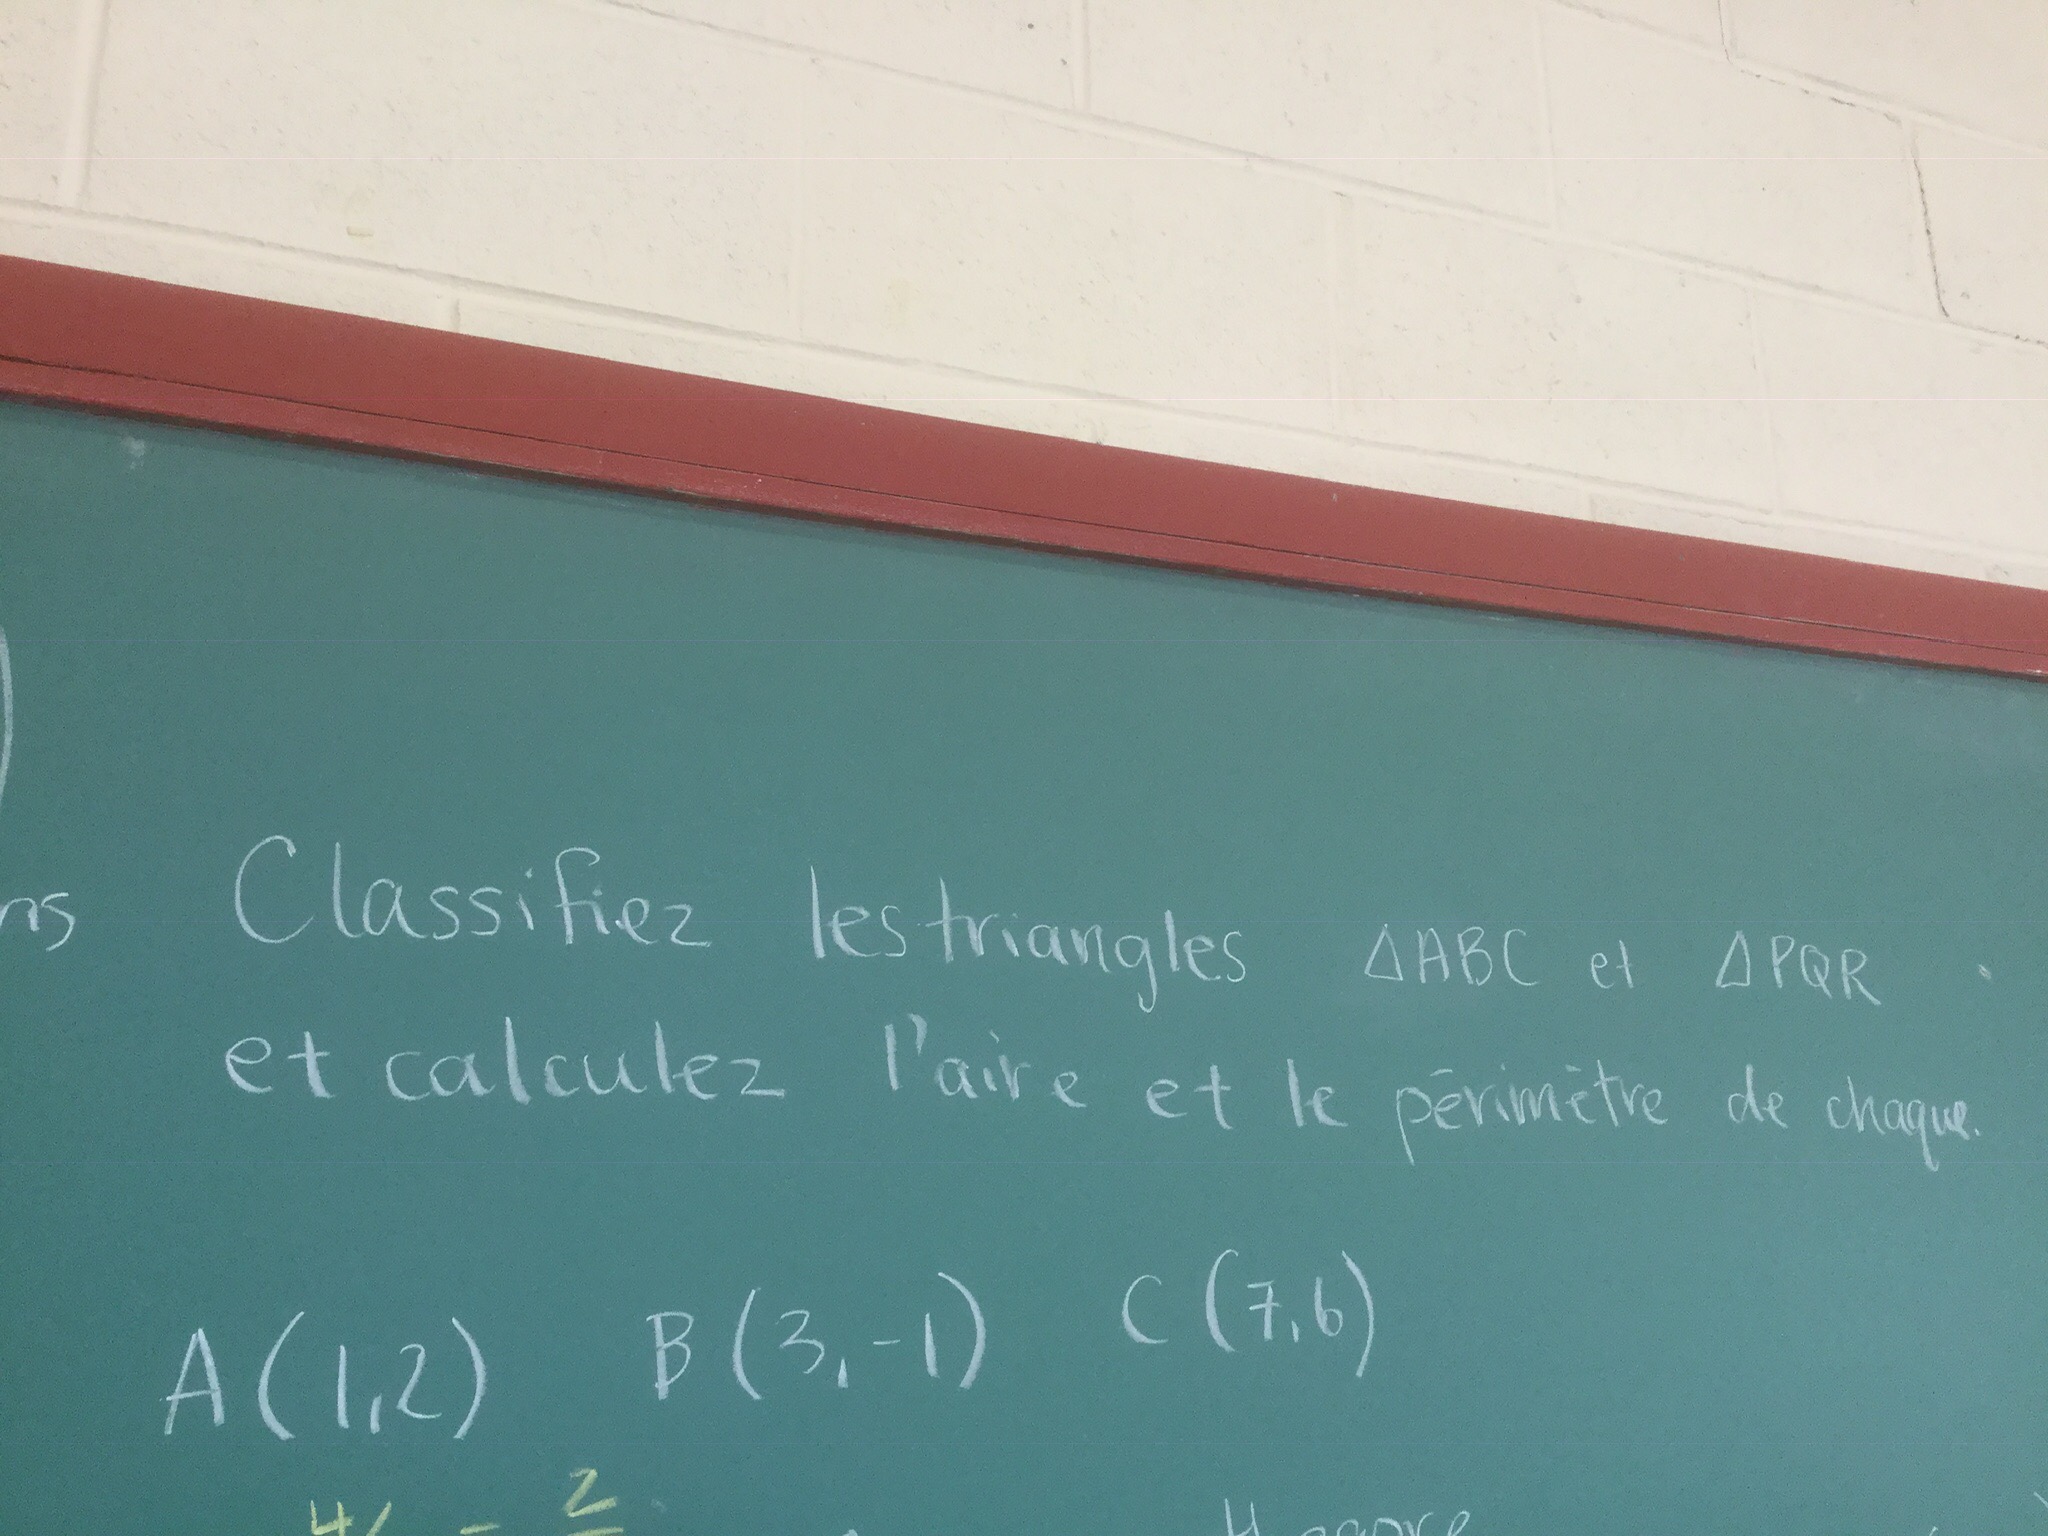
This was a right angle triangle that is also scalene. We proved it was a right triangle using slopes, and also using the pythagorean theorem. Once we know it is a right angle triangle we can use the perpendicular sides as base and height, and calculate the area.
The last triangle was not a right angle triangle.
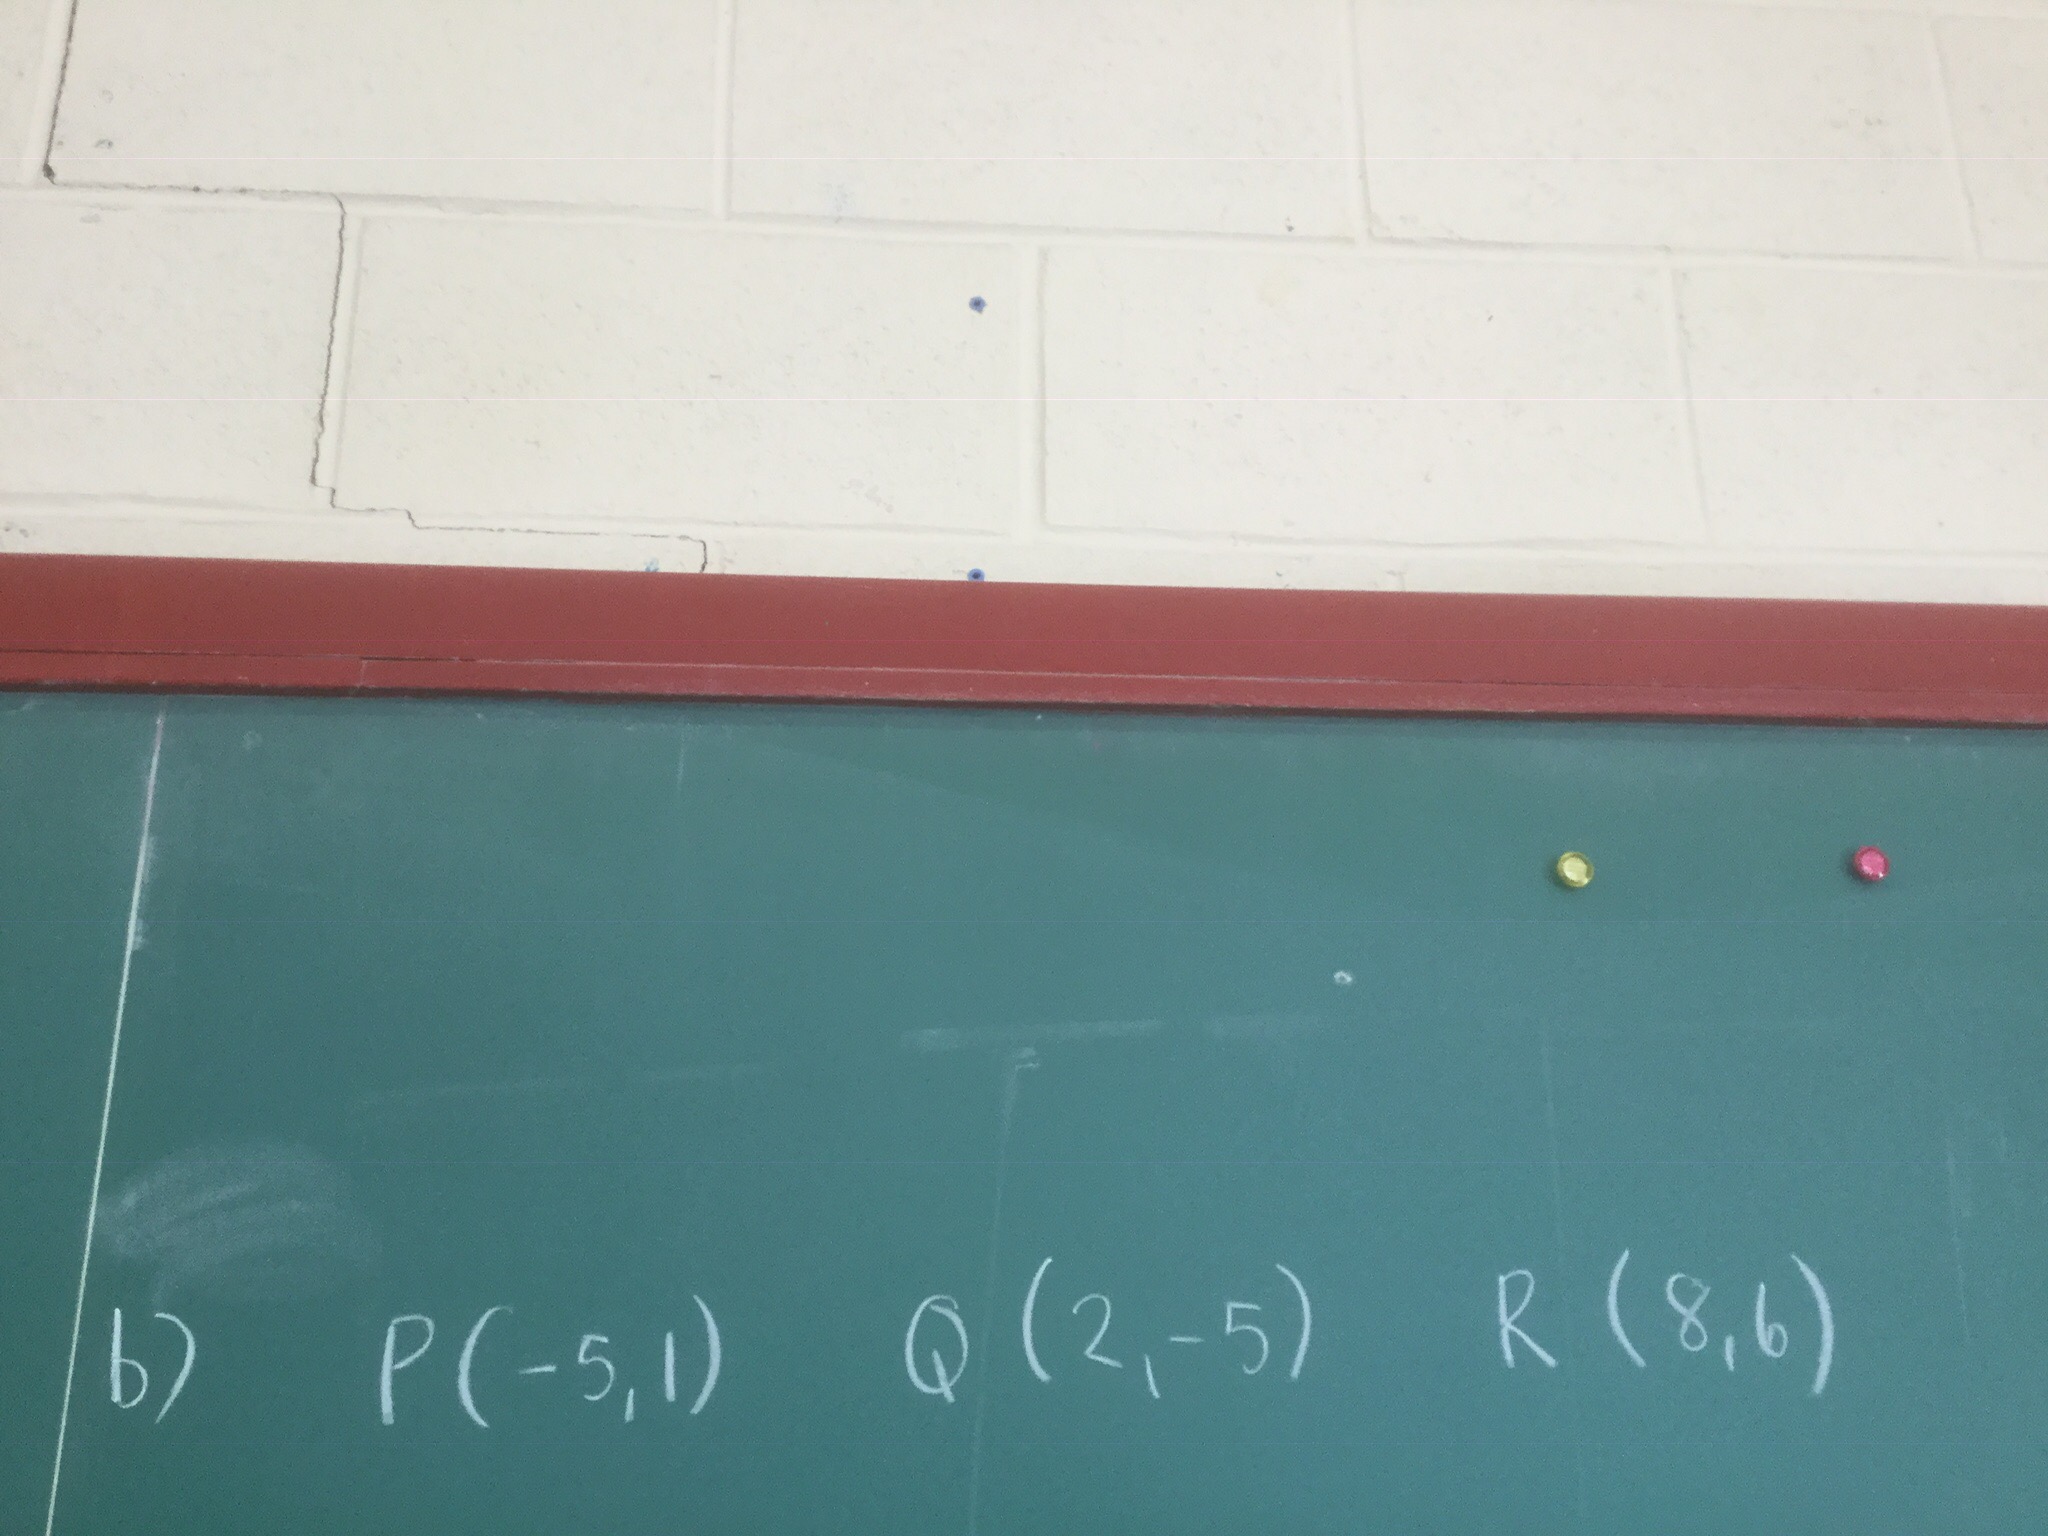
We needed to calculate the area. To do so we needed to calculate the height (altitude) of the triangle (the shortest distance between a point and the base). We created equations, substituted and solved. It took a long time to go through the process.
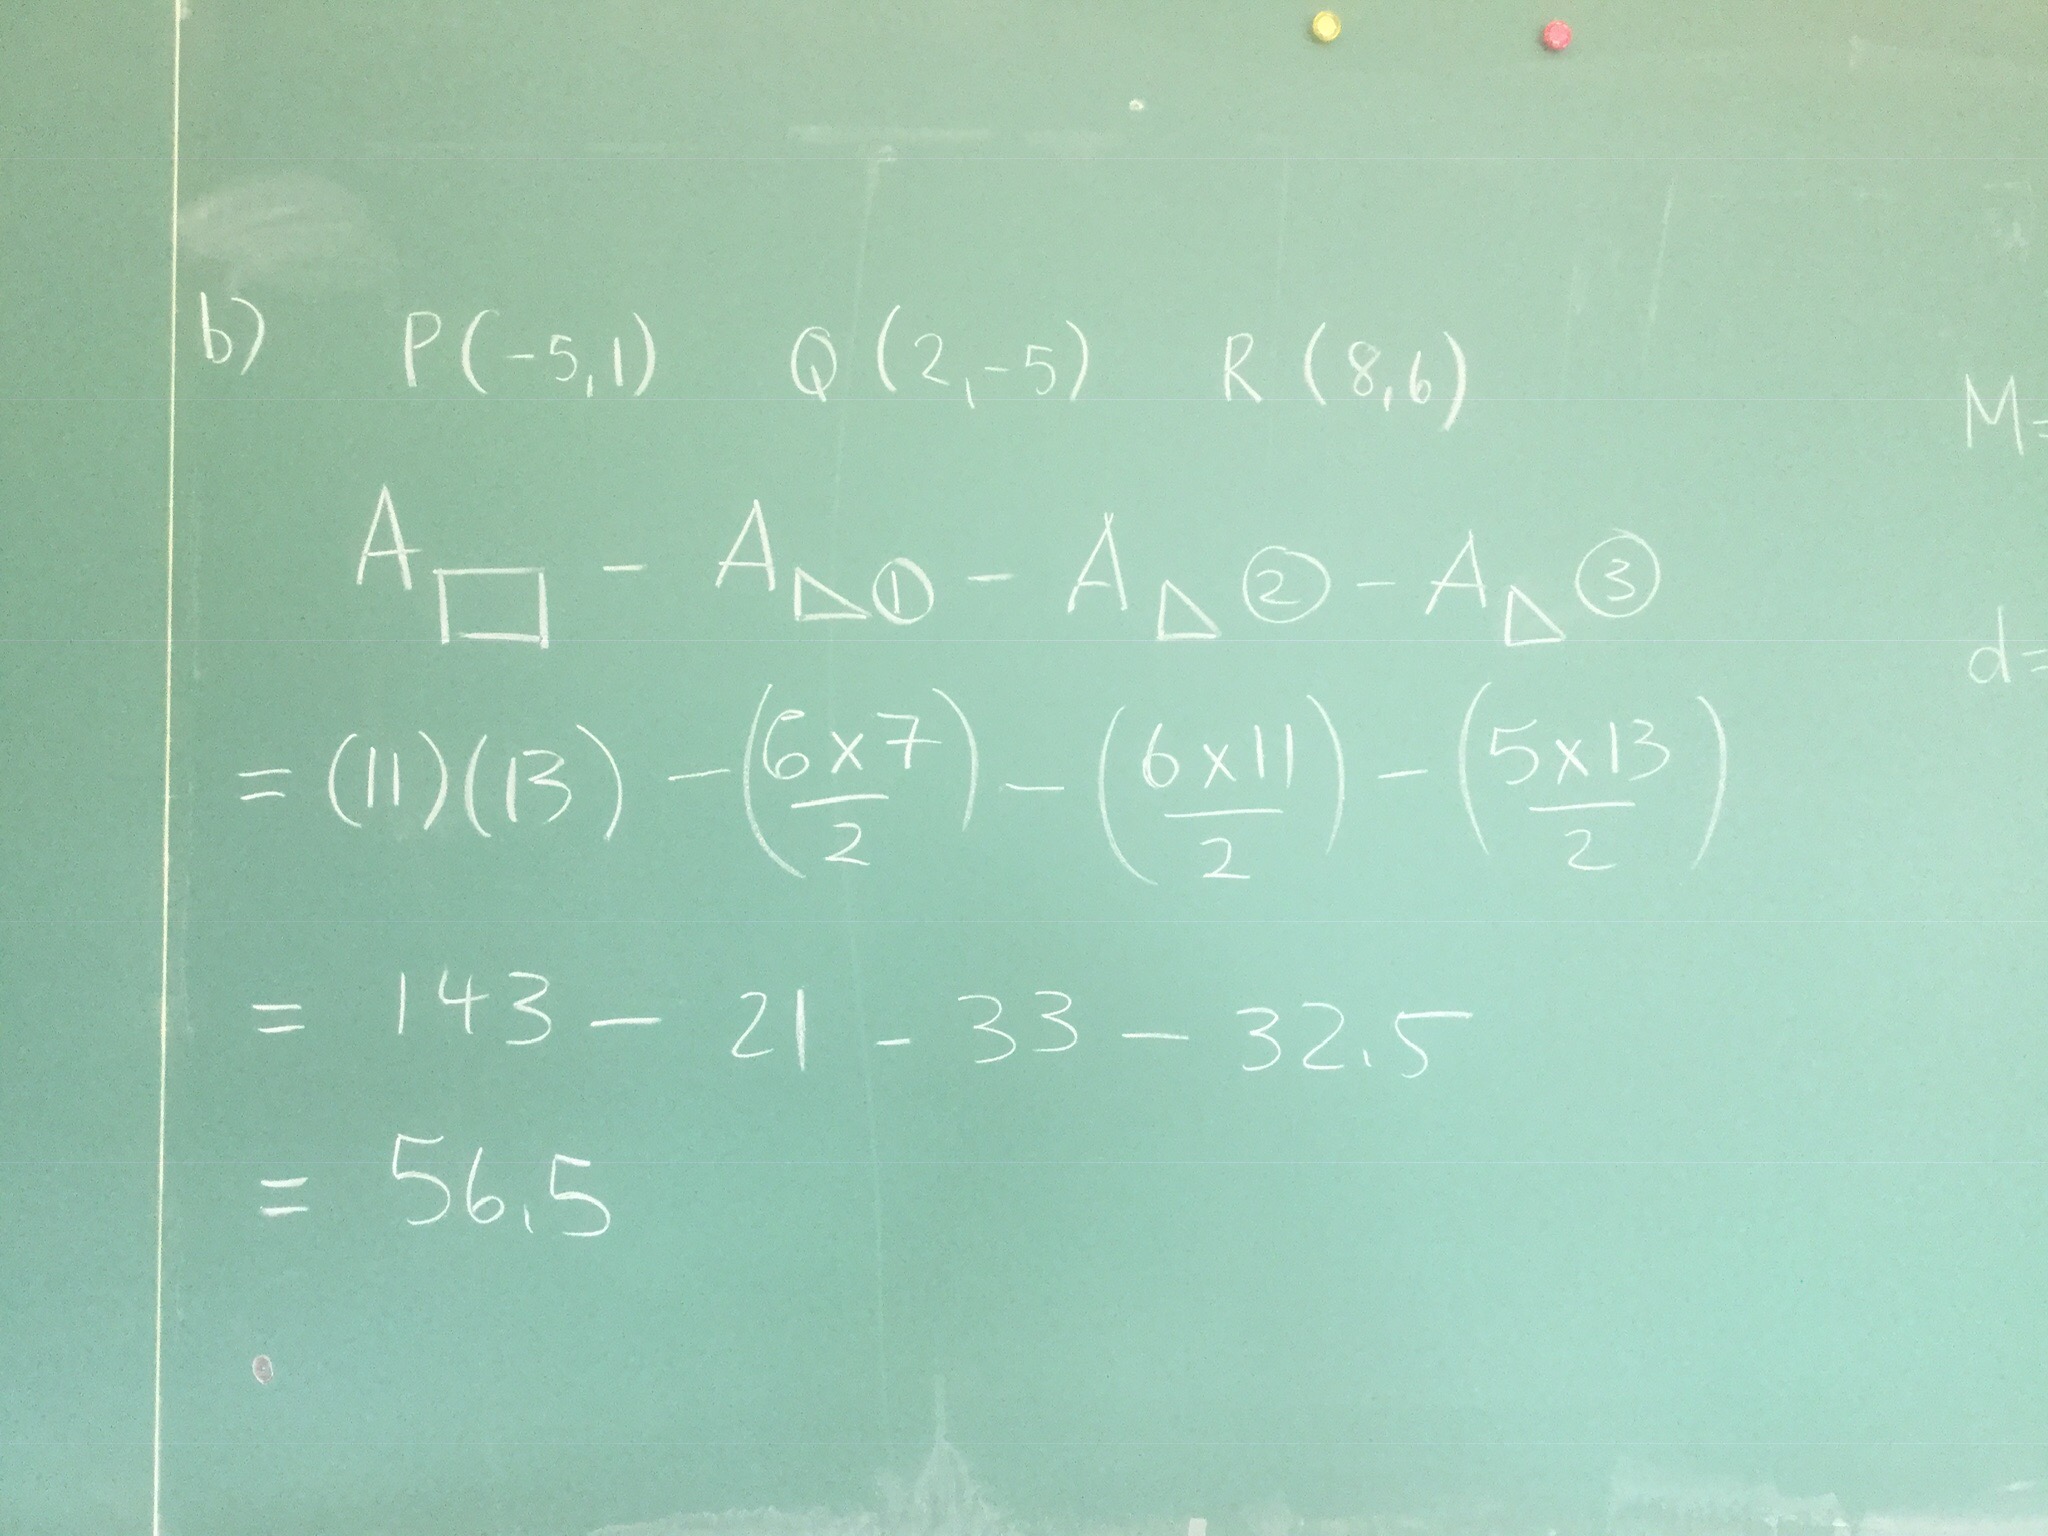
Afterwards we looked outside the triangle, and saw an elegant approach to finding the area.
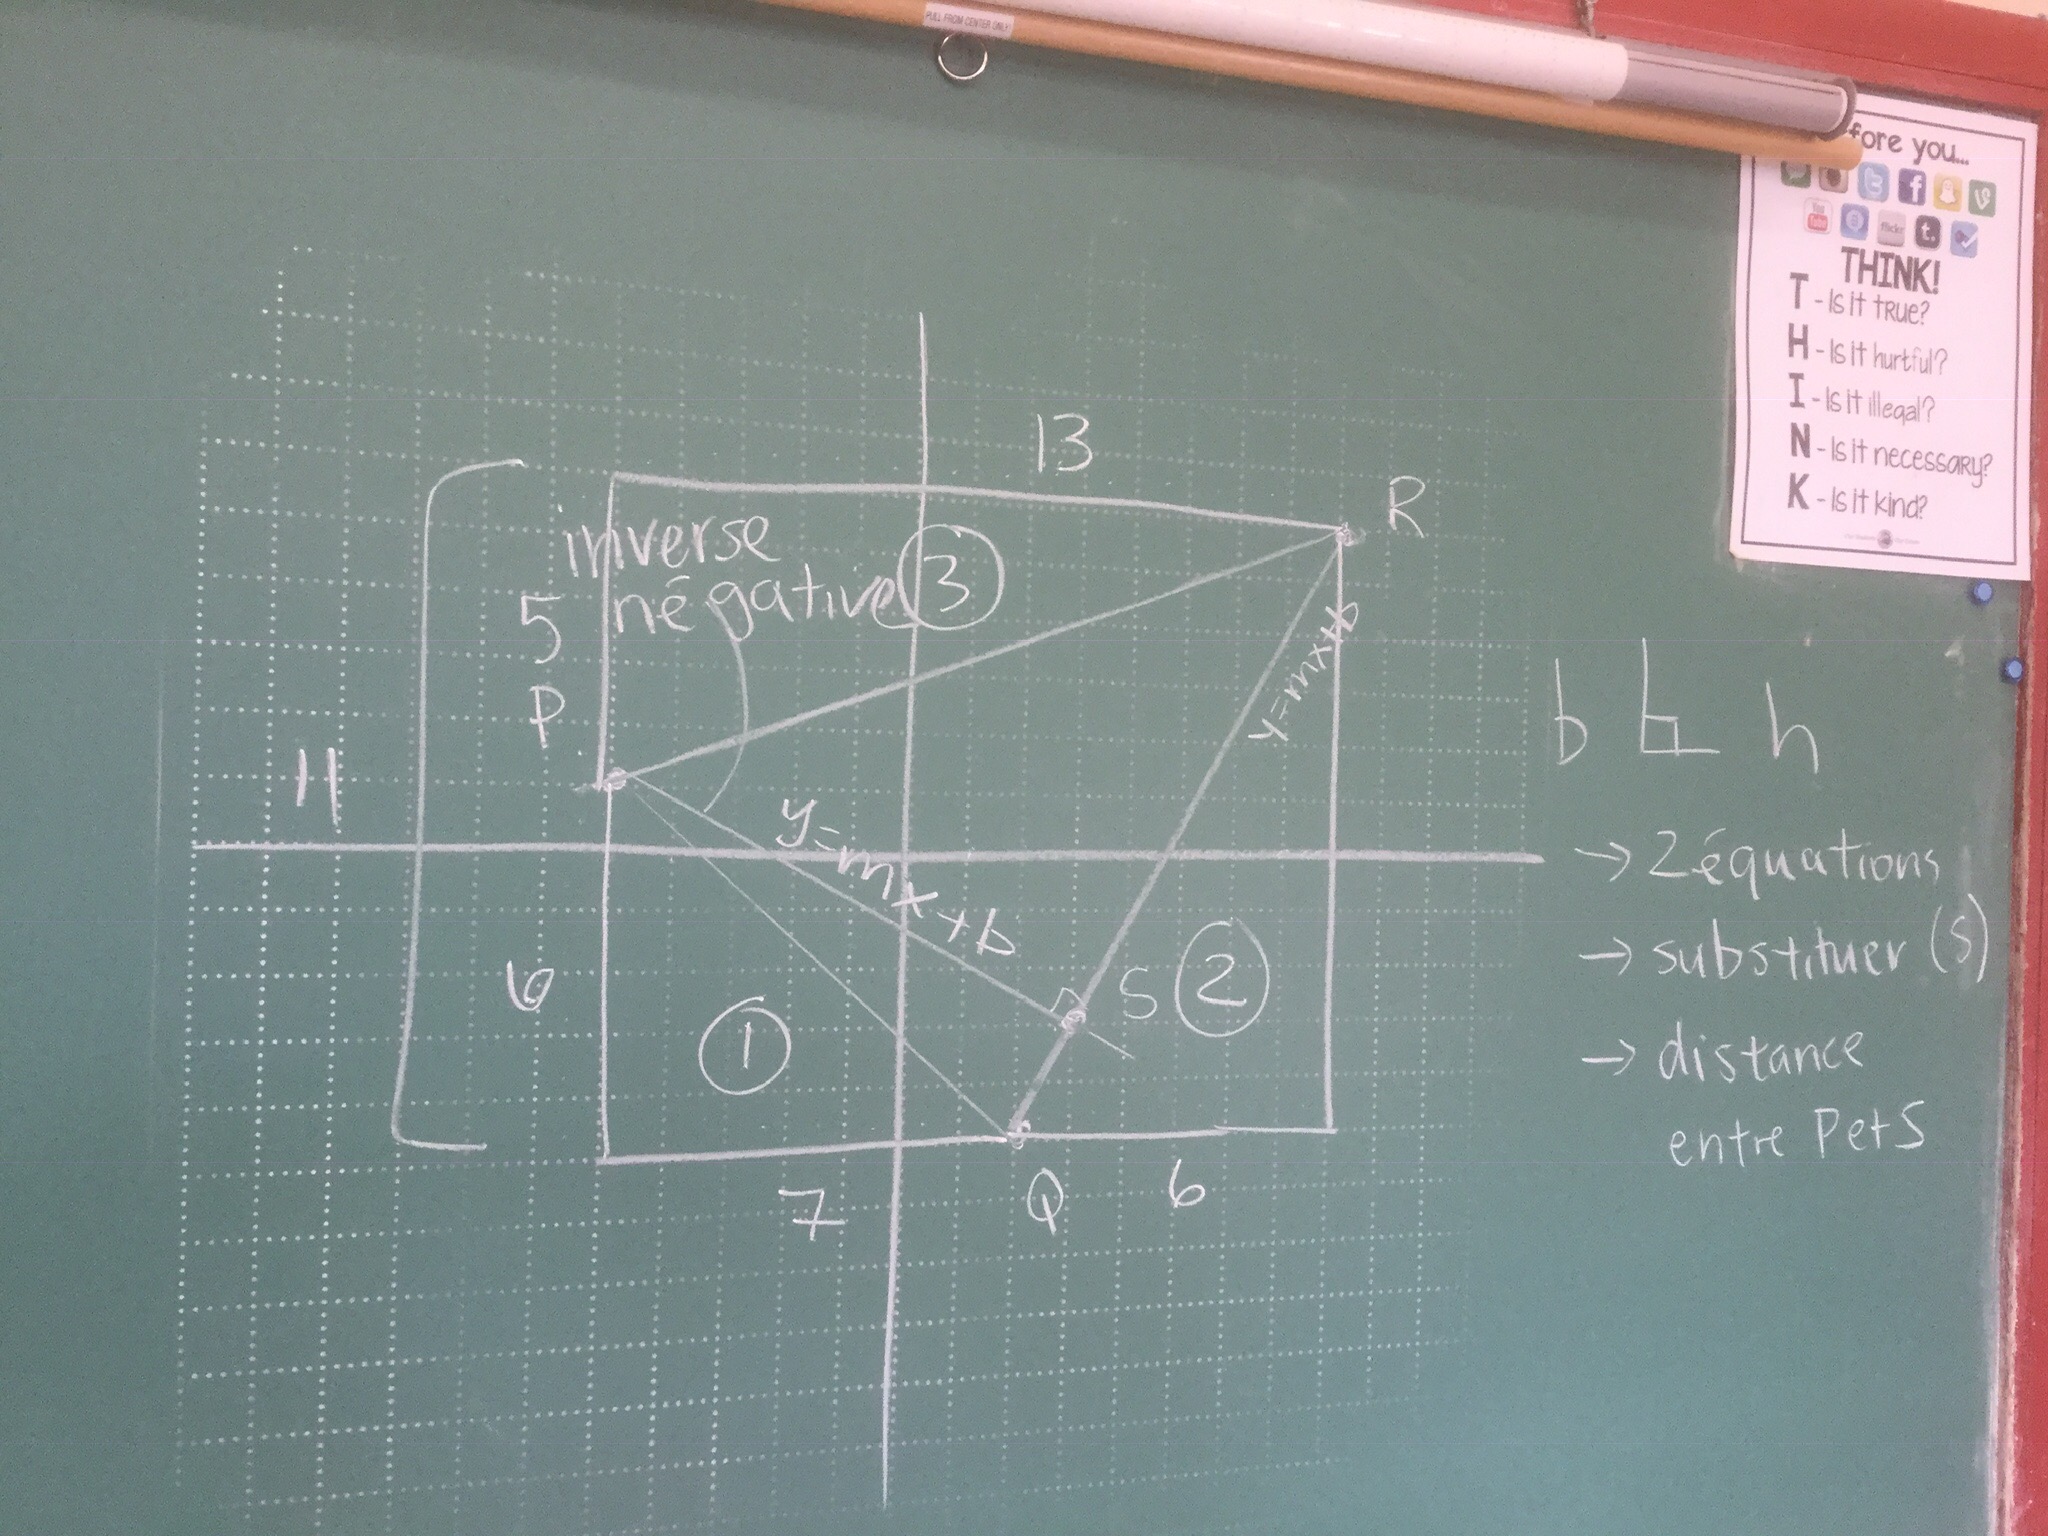
We can extend lines vertically and horizontally to create a rectangle enclosing the triangle. We can calculate the area of the rectangle, and then subtract the areas of the right angle triangles around our interior triangle. It’s so neat to see how these problems can be solved with many different approaches.
Growth rate of our beans
Today we looked at our beans’ growth. We have made scatter plots (and remade scatter plots). We are sure our axes are the right way around….we are sure that we have left space for weekends (even though we weren’t here to measure we know the beans still grew). We have looked at drawing lines of best fit, or curves of best fit. We have extrapolated and interpolated using these lines and curves.
Today’s new bean graph task was to determine the initial growth rate of the beans.
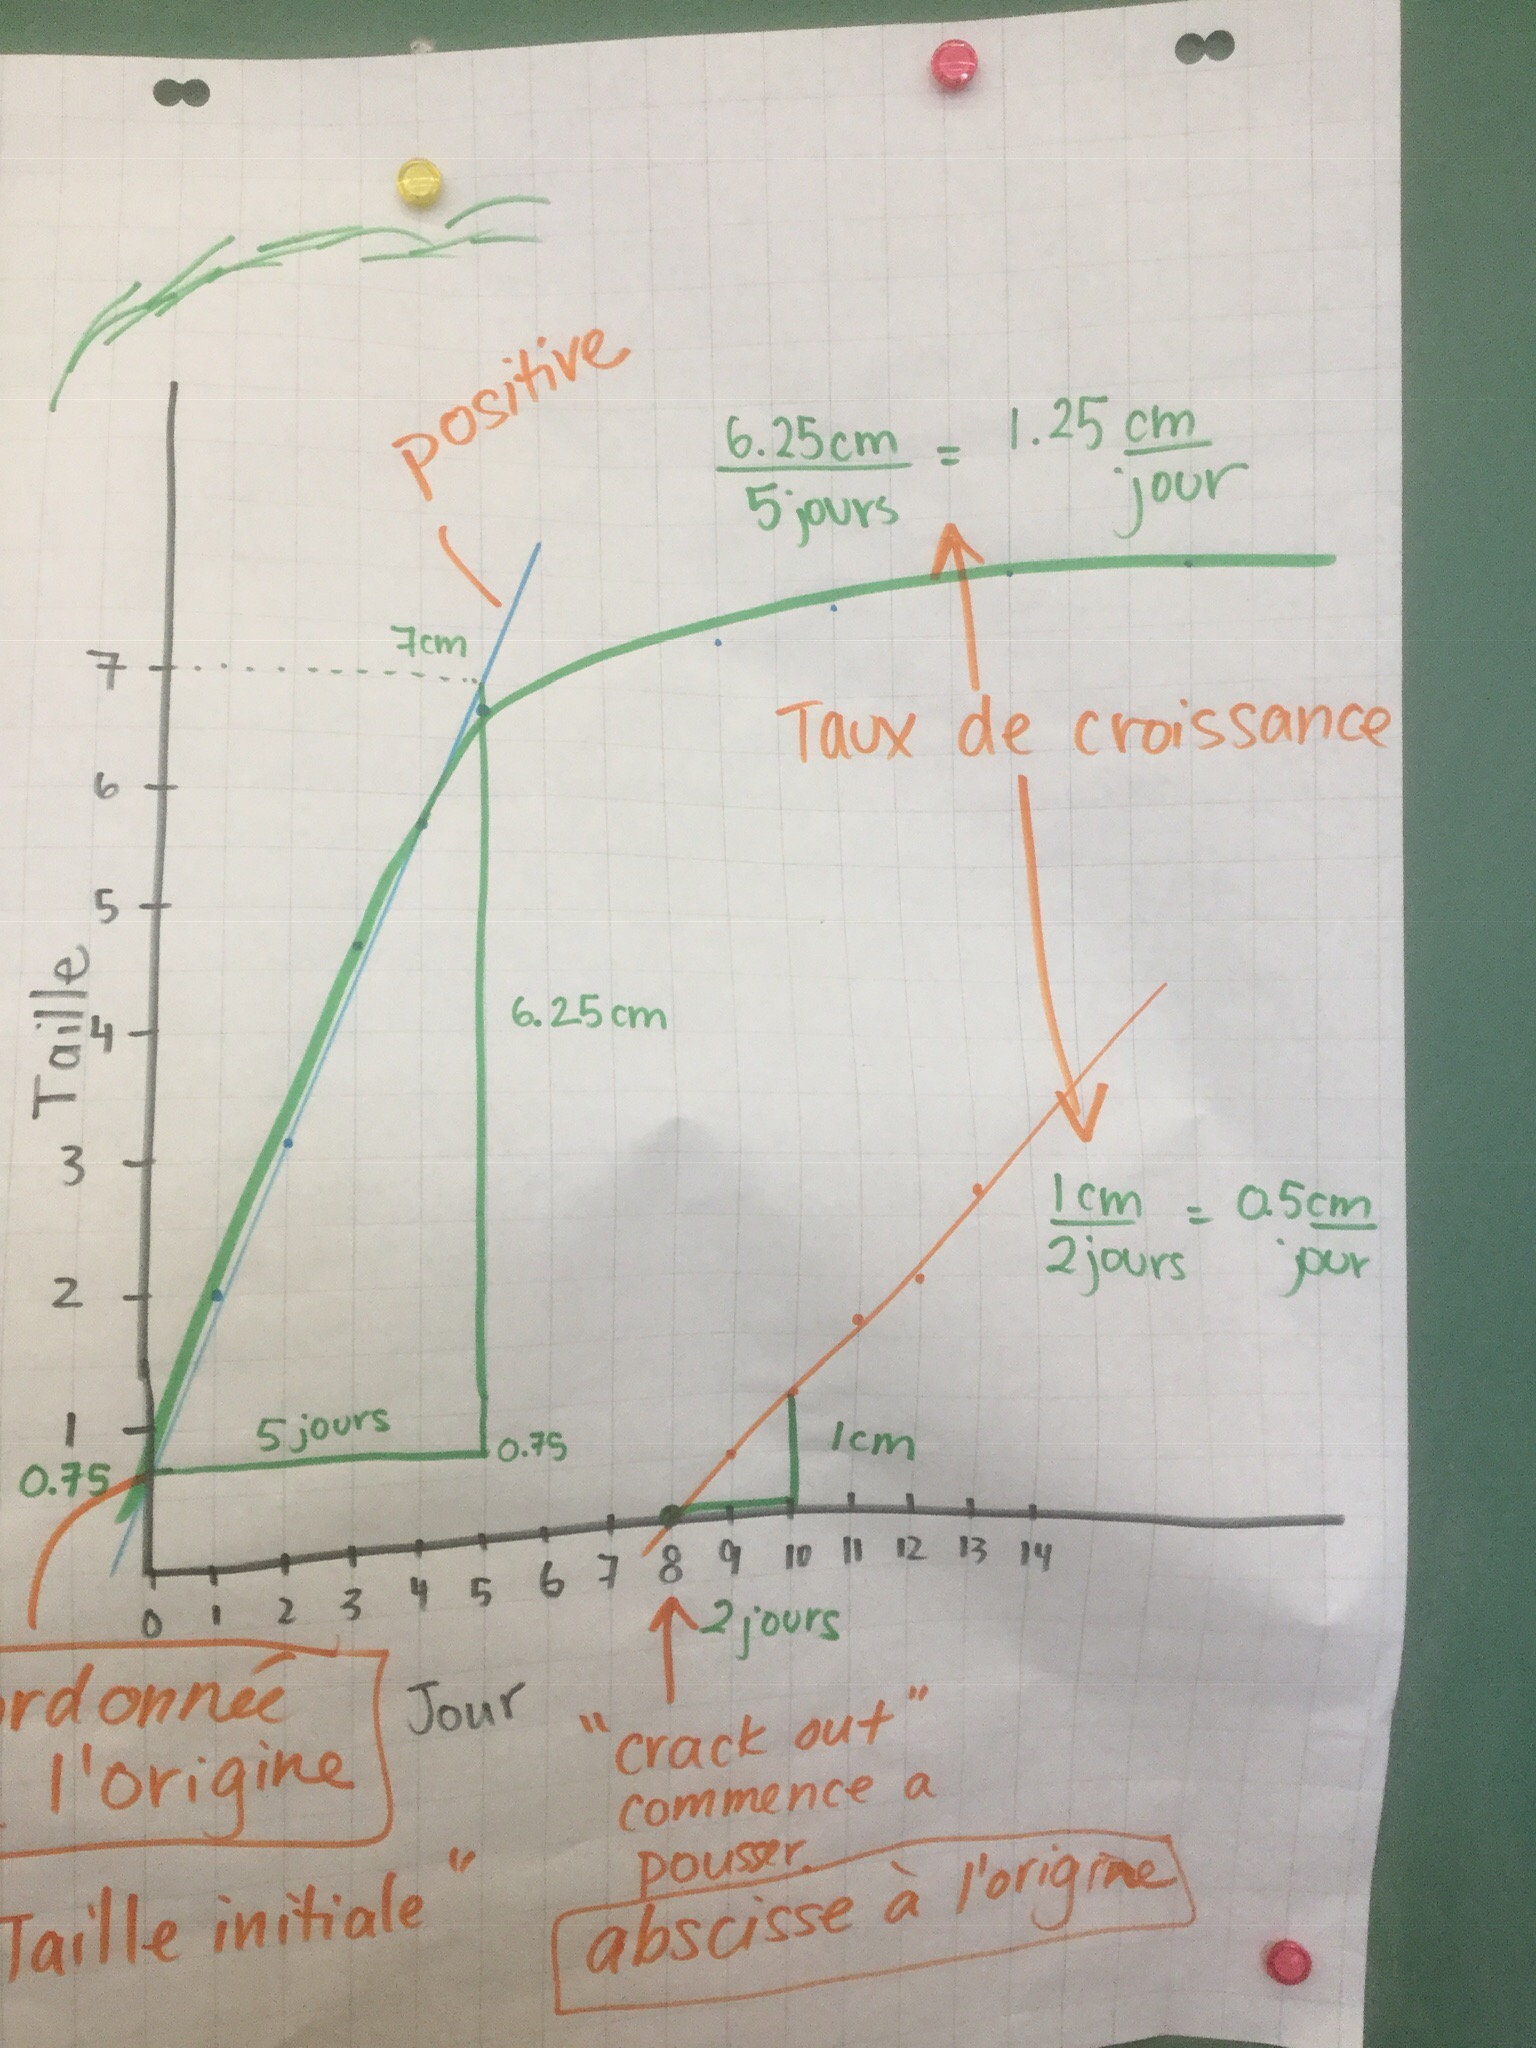
Here’s a graph we made to help us understand how to do that. We look at our line of best fit (or the best linear approximation of the curve at the start) and we pick 2 points on the line, and then make a right triangle. We look at the horizontal leg of the triangle to determine the number of days, and the vertical leg to determine the growth that happened. We make a fraction showing cm/day and then we divide the numerator by the denominator to determine the growth that happens in one day.
We also looked at steeper lines and saw that they have a higher growth rate, and less steel lines are growing, but not as fast.
We reviewed vocabulary for the intercepts. In this case the y intercept (l’ordonnée à l’origine) shows the initial height of the bean plant. In this case the x intercept (l’abscisse à l’origine) shows the first day that the bean cracks out of the soil and can be measured.
We have to be careful when we are using graphs that we read the numbers from the y axis, and not just count squares. Each square vertically on this graph represents 0.5cm.
Communication in Grade 9
Today’s focus is on communicating our math. We have been writing emails home each week, and writing responses to prompts every 2 weeks. Some areas of the responses are needing a bit of attention. Reading instructions seems to be a challenge!
In each response, we need to answer the questions and address all areas of the prompt. We need to show our understanding of the math concepts and vocabulary, and also we need to reflect on our learning.
To help make this more visible today we looked at some fictional responses and we marked the text using various colours. Yellow was for any part that was reflective, the other highlighter was for any part that showed evidence of understanding, and we circled in pencil anything that was a summary of our activities.
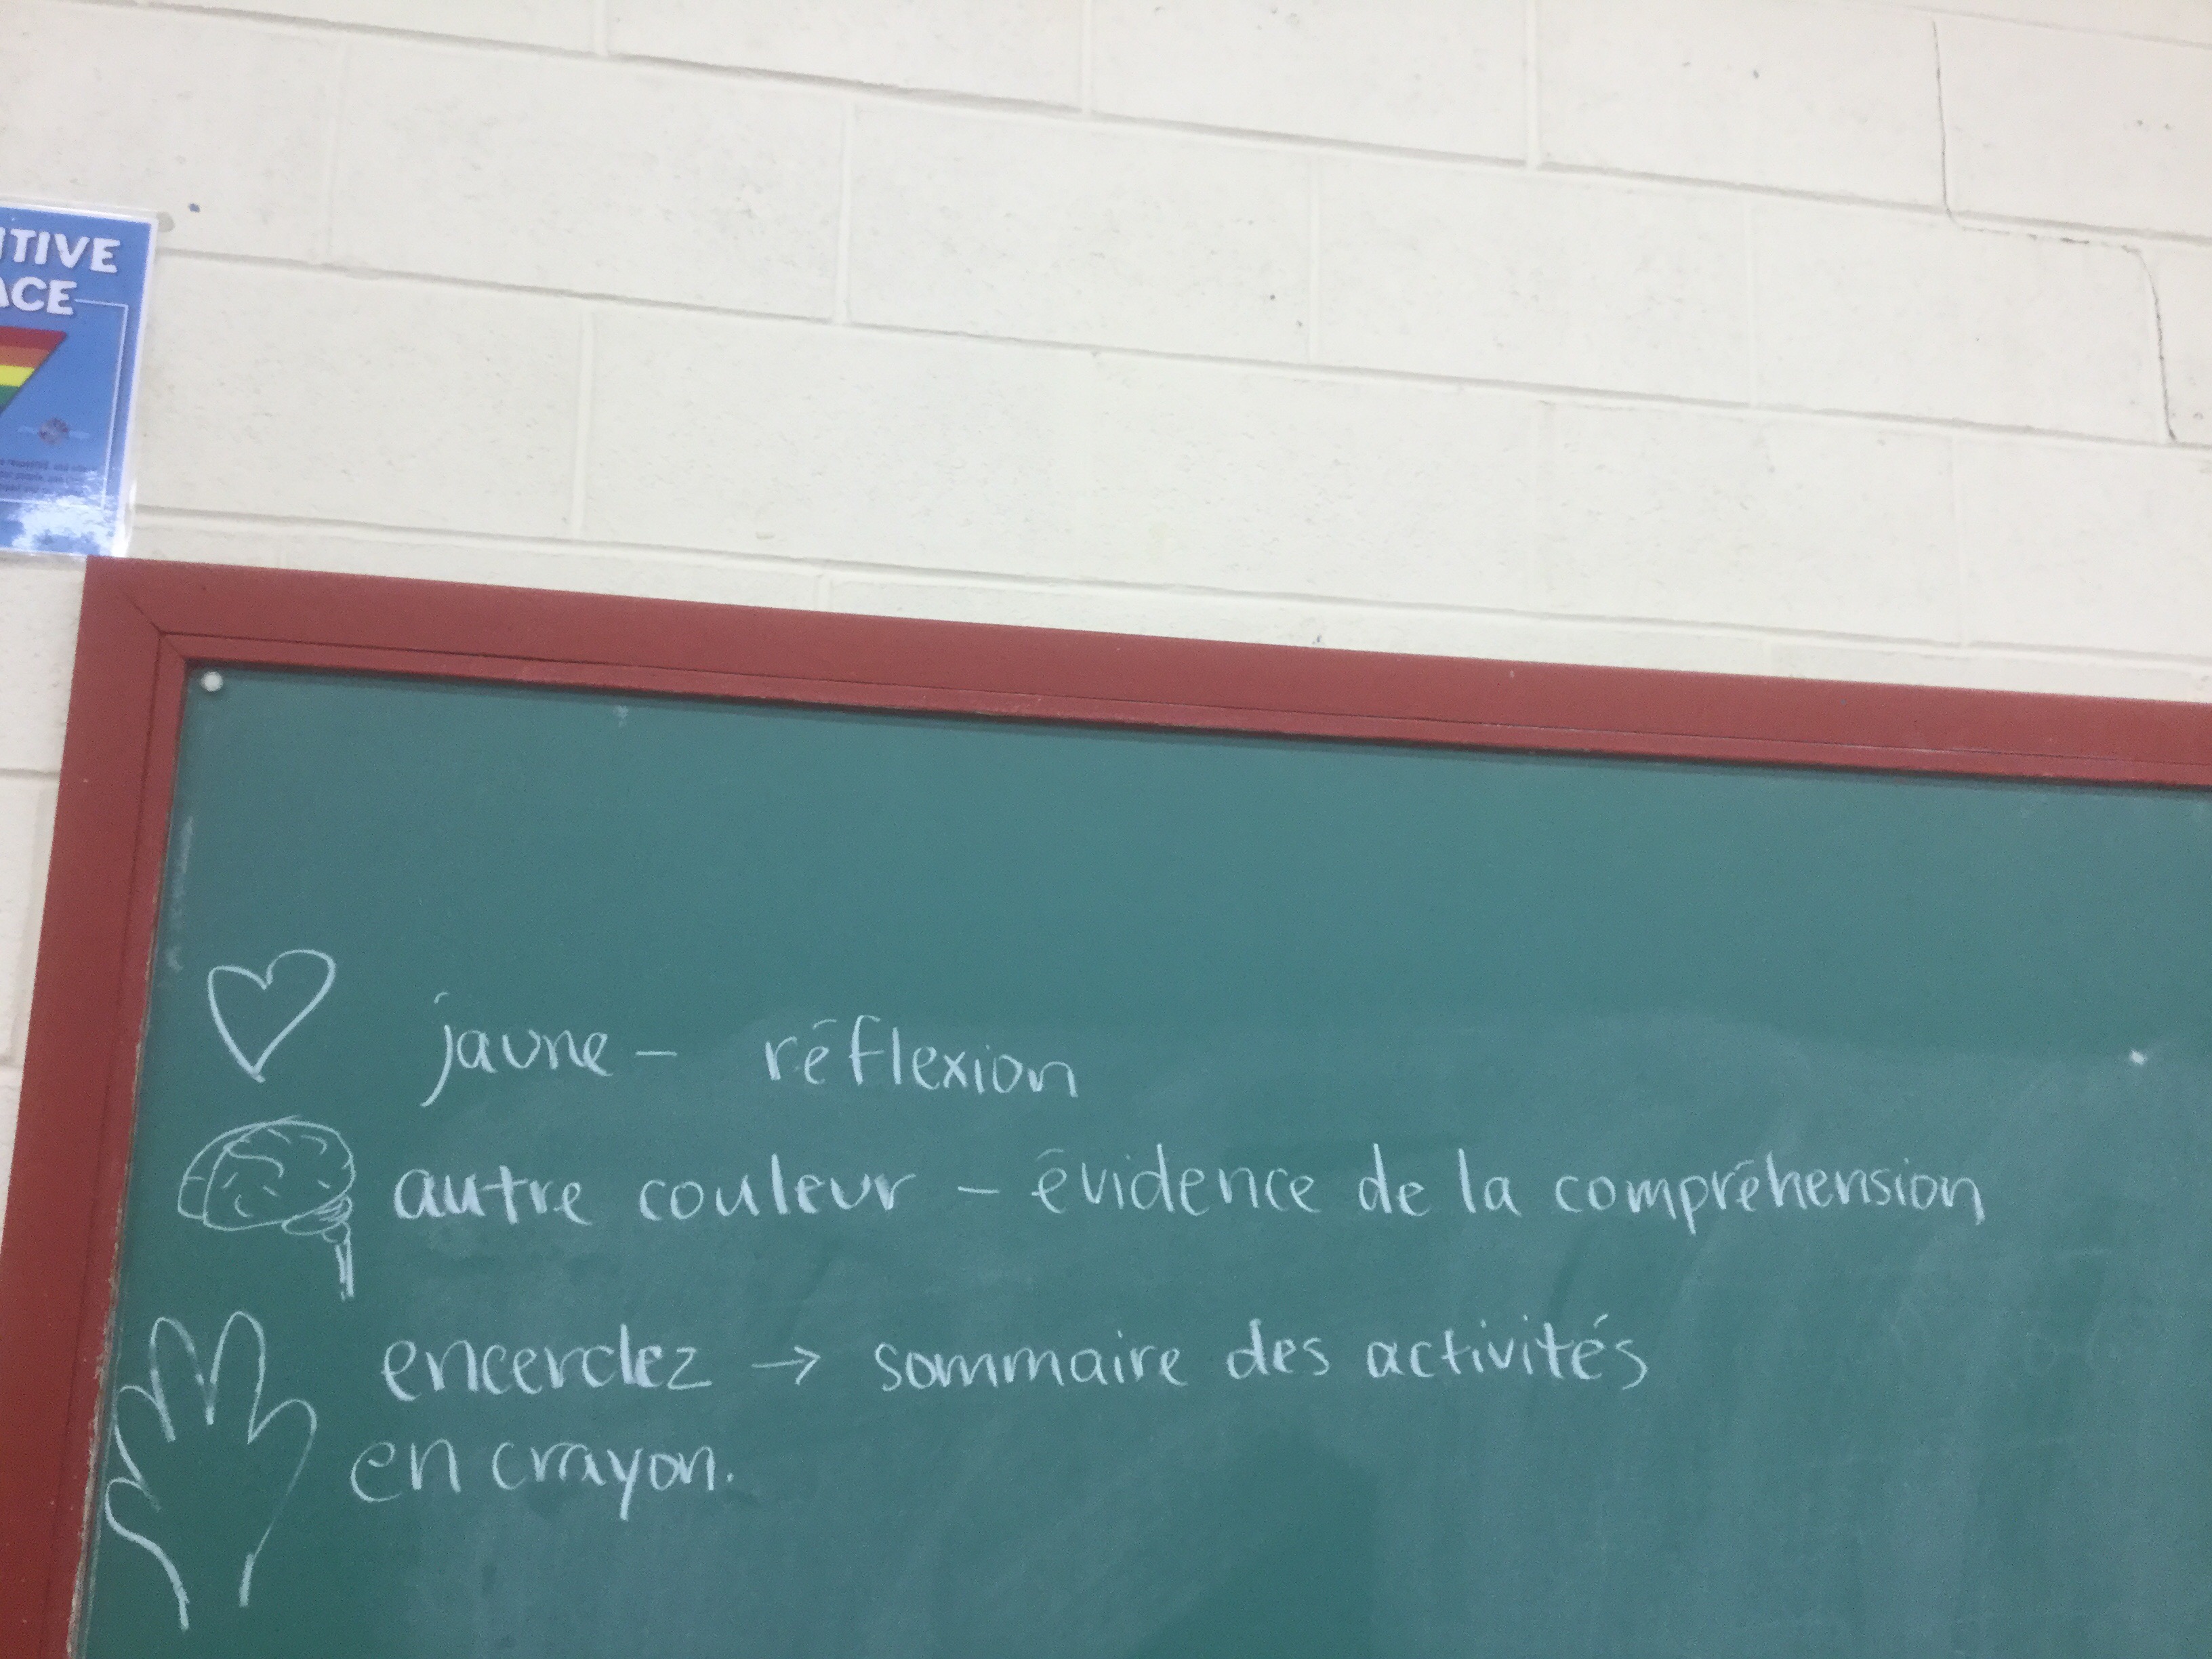
We worked on adding things to the text to make it more complete to bump it up.
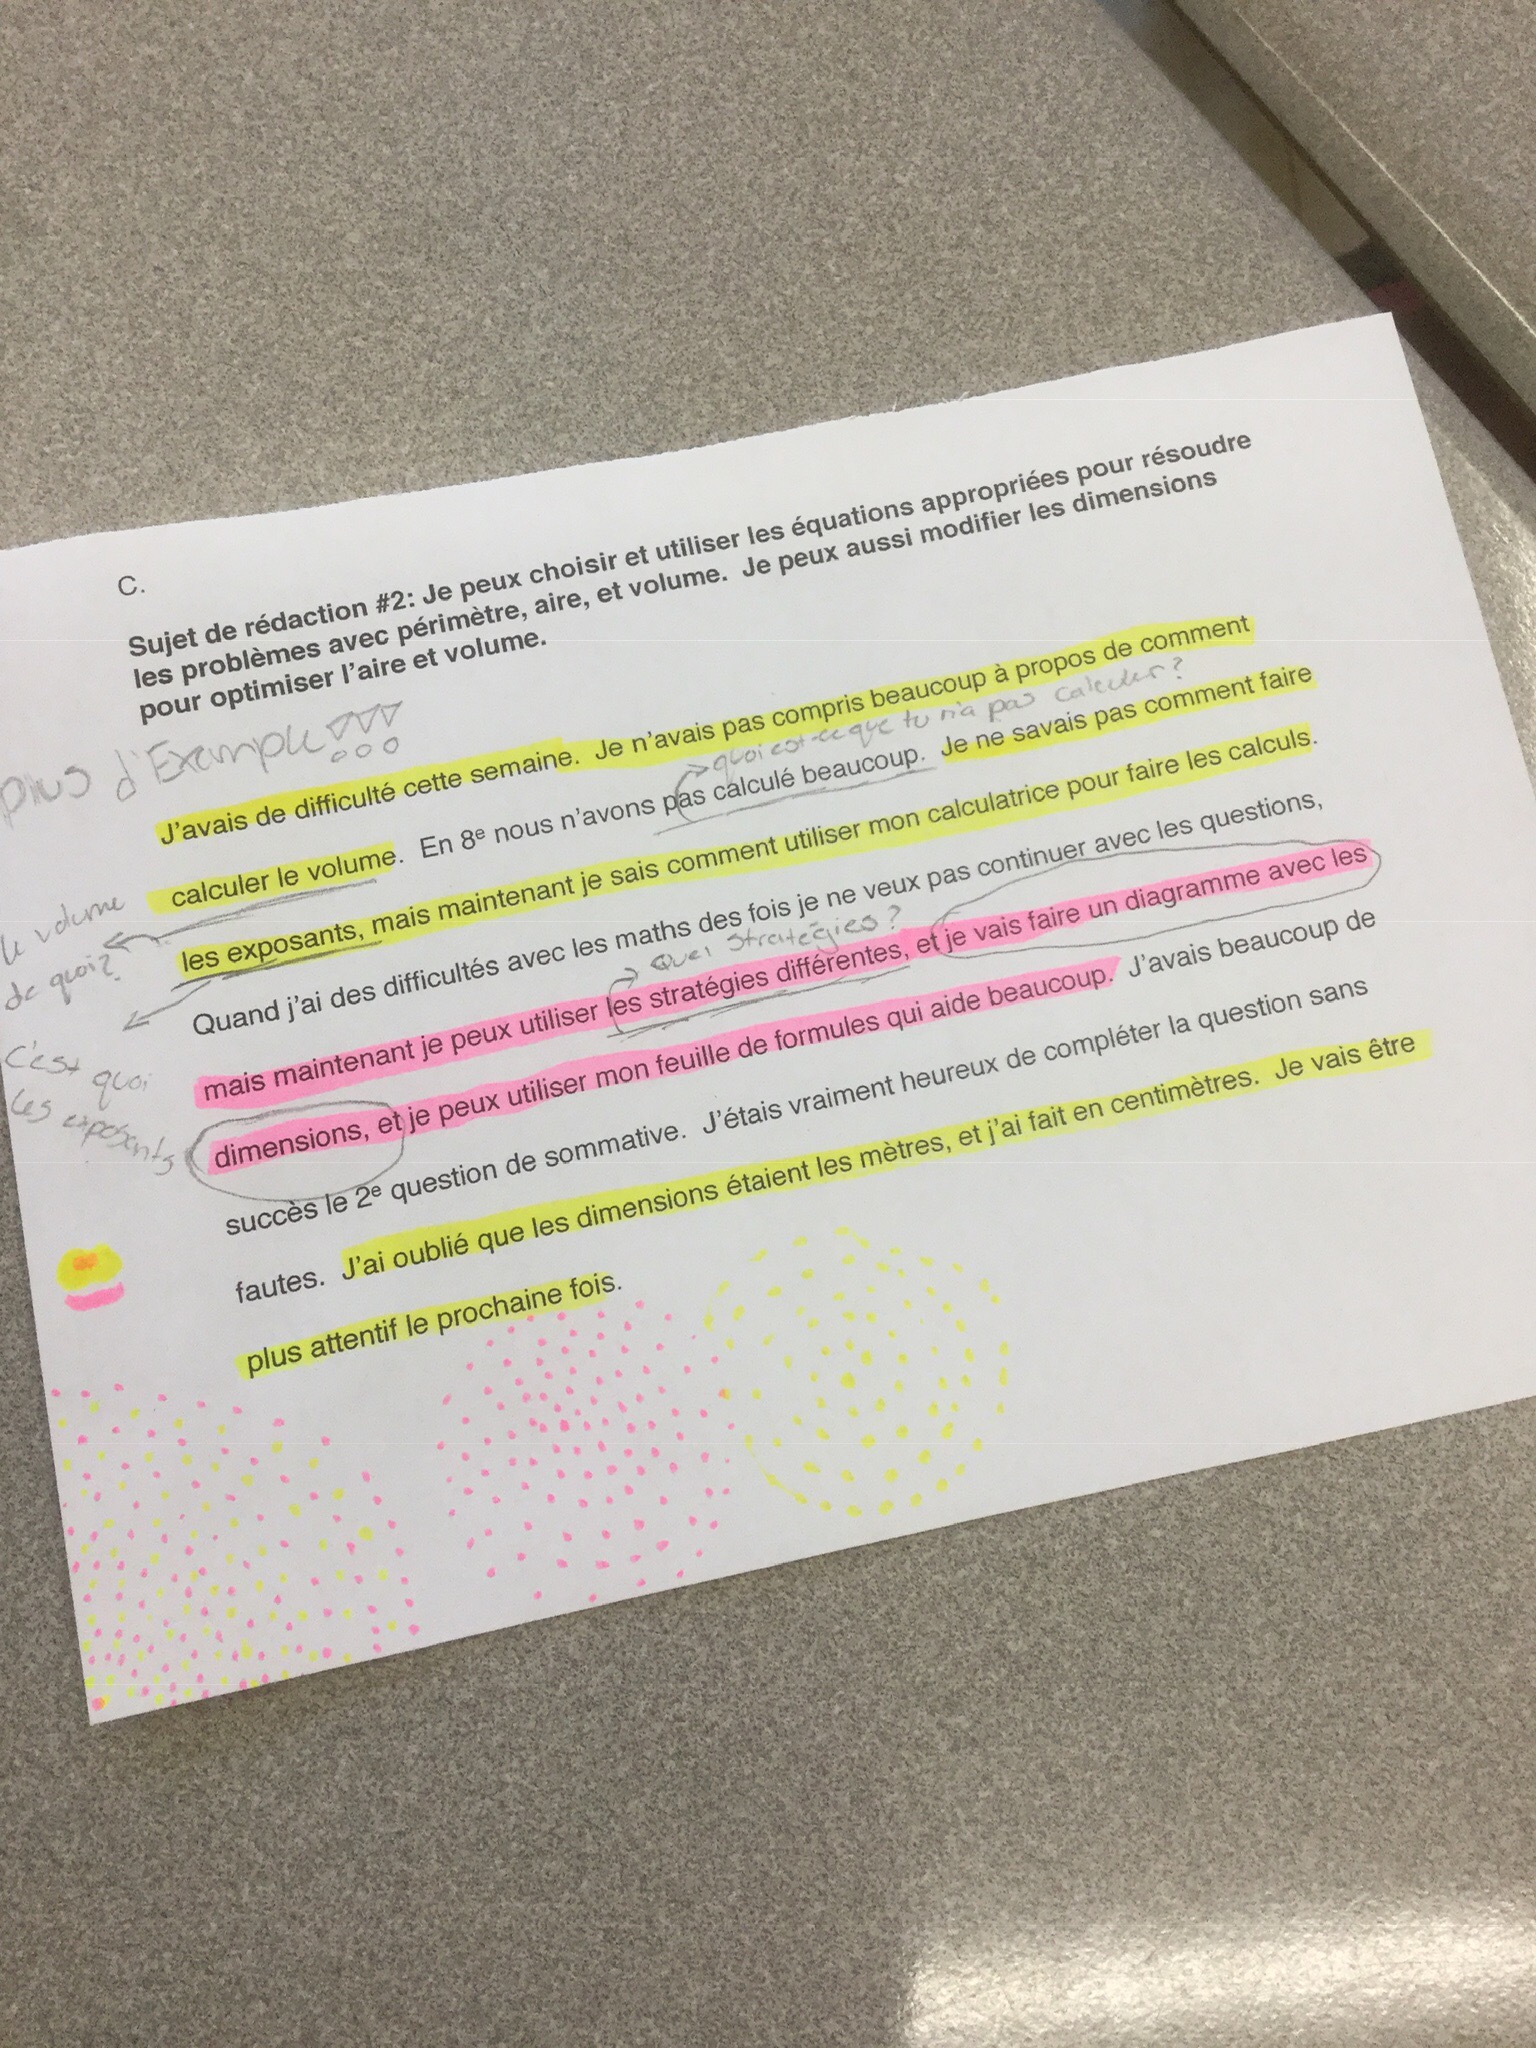
We are getting better at identifying evidence and reflections, and hopefully we will be able to compose more thorough responses as we move forward.

Communication is so important, and it’s not always easy. Good work today grade 9s.
Investigating in Grade 10
Que remarquez-vous? Que voulez vous savoir?
Grade 10s were investigating a sprinkler today. If the sprinkler can spray a maximum of 10 meters, and we want to make sure each point labelled on the grid gets wet, where should we put the sprinkler?

We listed things we know….like sprinklers can spray in a circle, and that the sprinkler should be in the middle somewhere…but which “middle”? How can we find a spot that is equidistant to all points?
We know we can draw the “médiatrice” (perpendicular bisector) and that will show us all the points that are equidistant to the segment’s endpoints. We drew a lot of them, and noticed that they intersect!
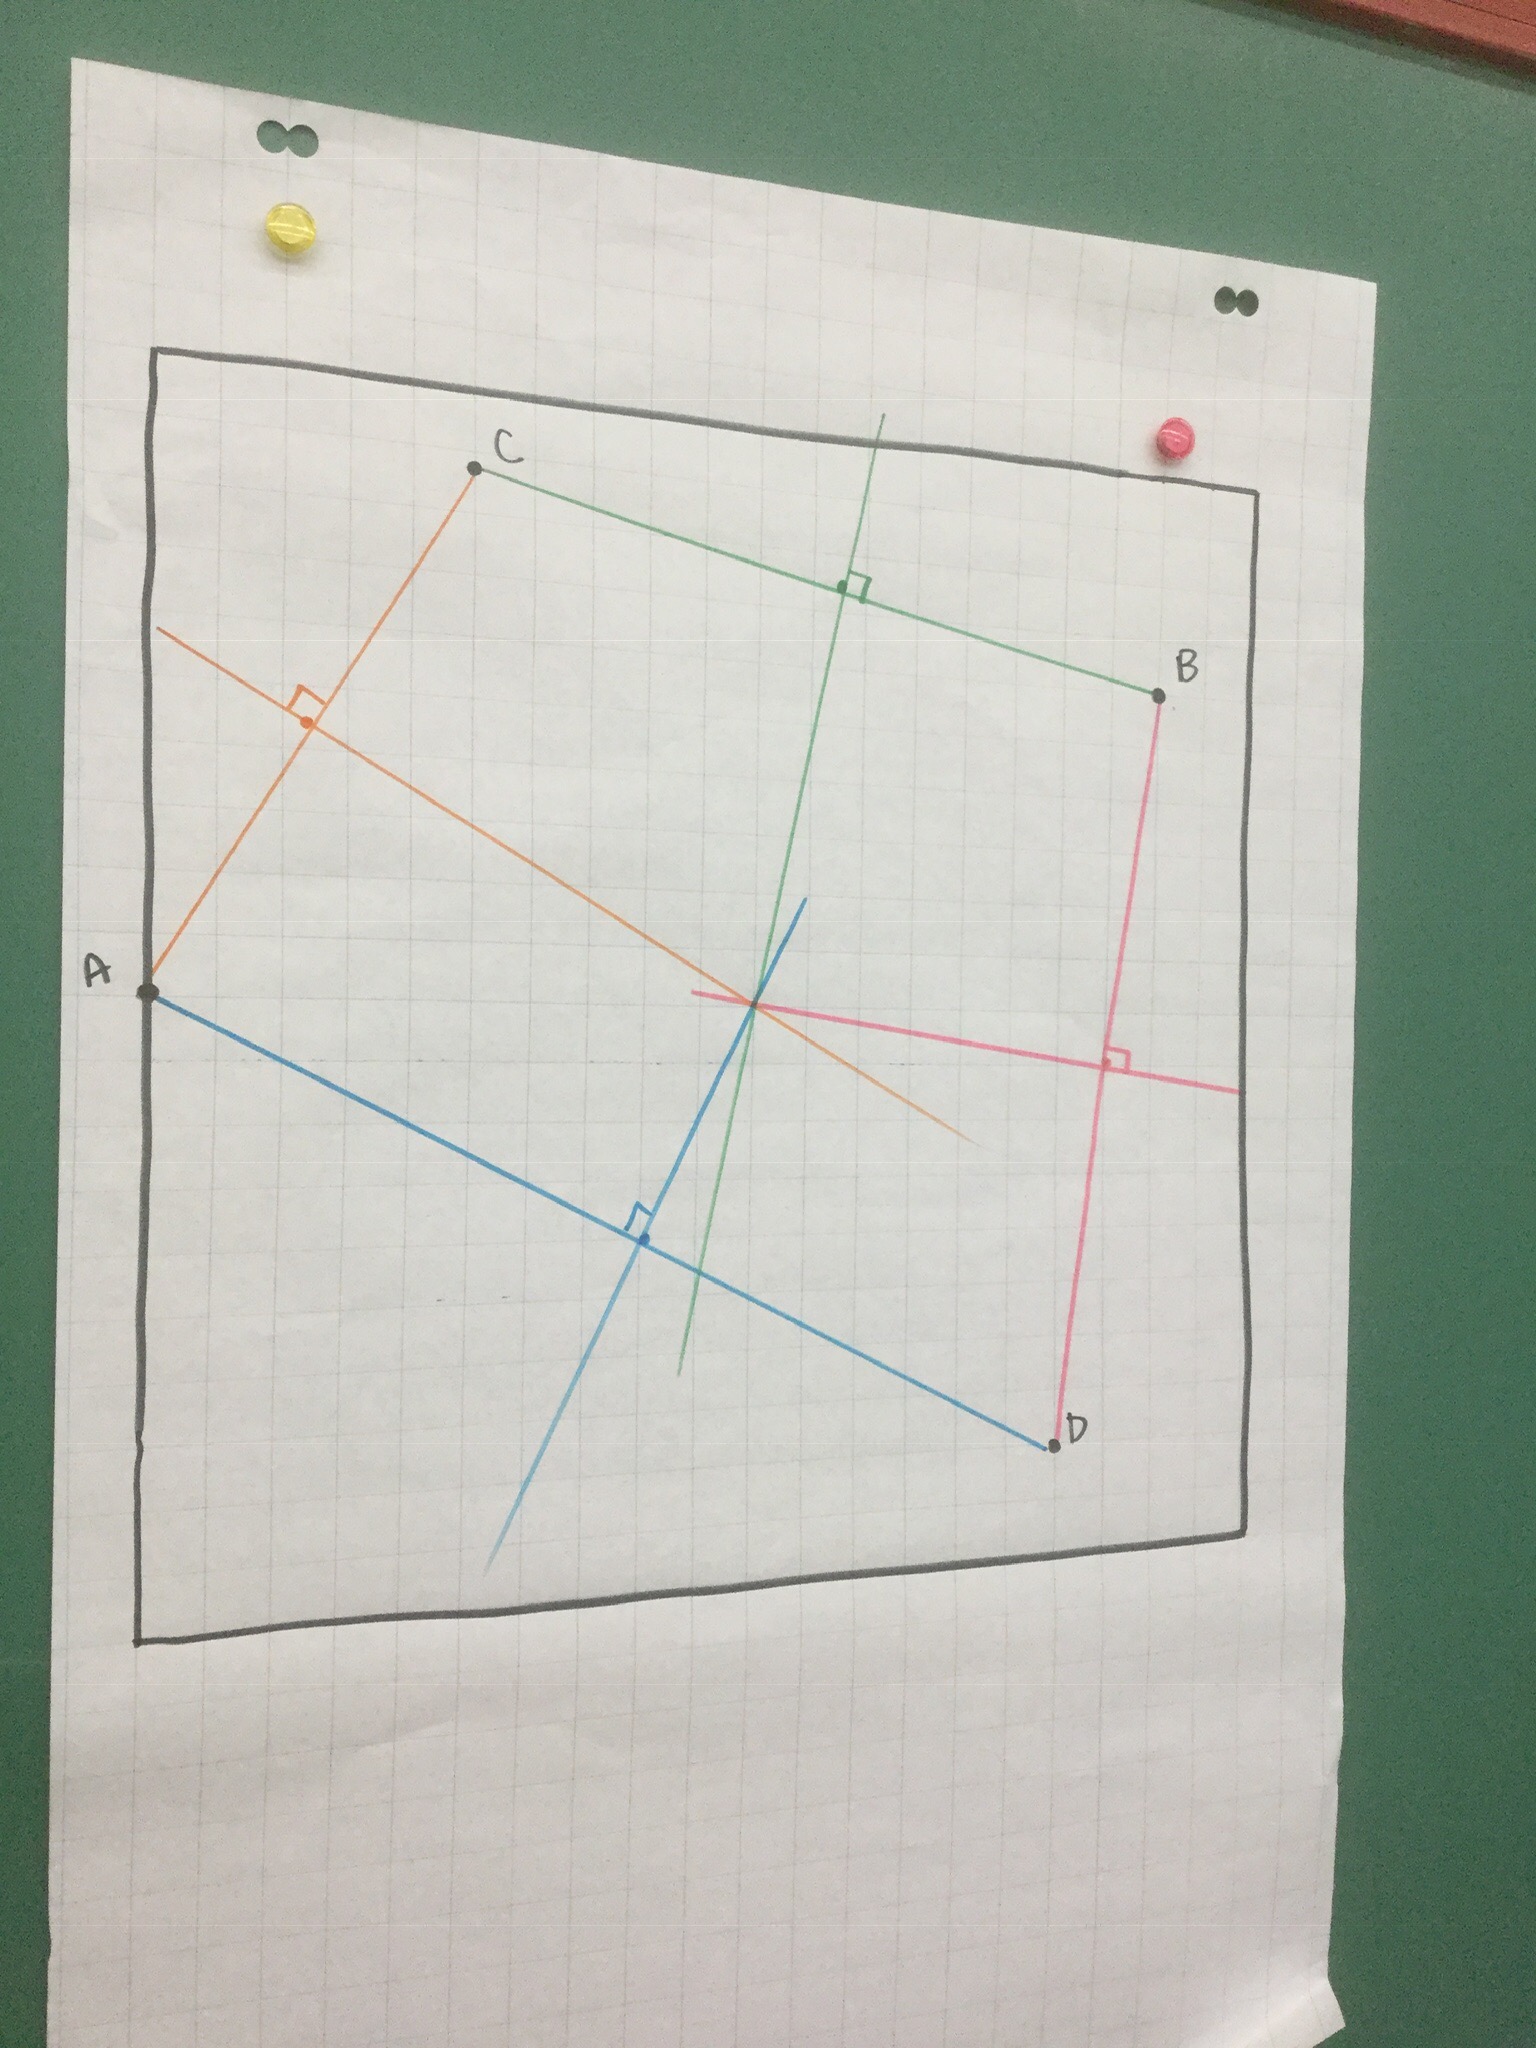
So we’d put the sprinkler there!
Next we looked at each point and made sure that it really was the same distance from the sprinkler. We used the pythagorean theorem or the distance formula. We called the sprinkler point (0,0)
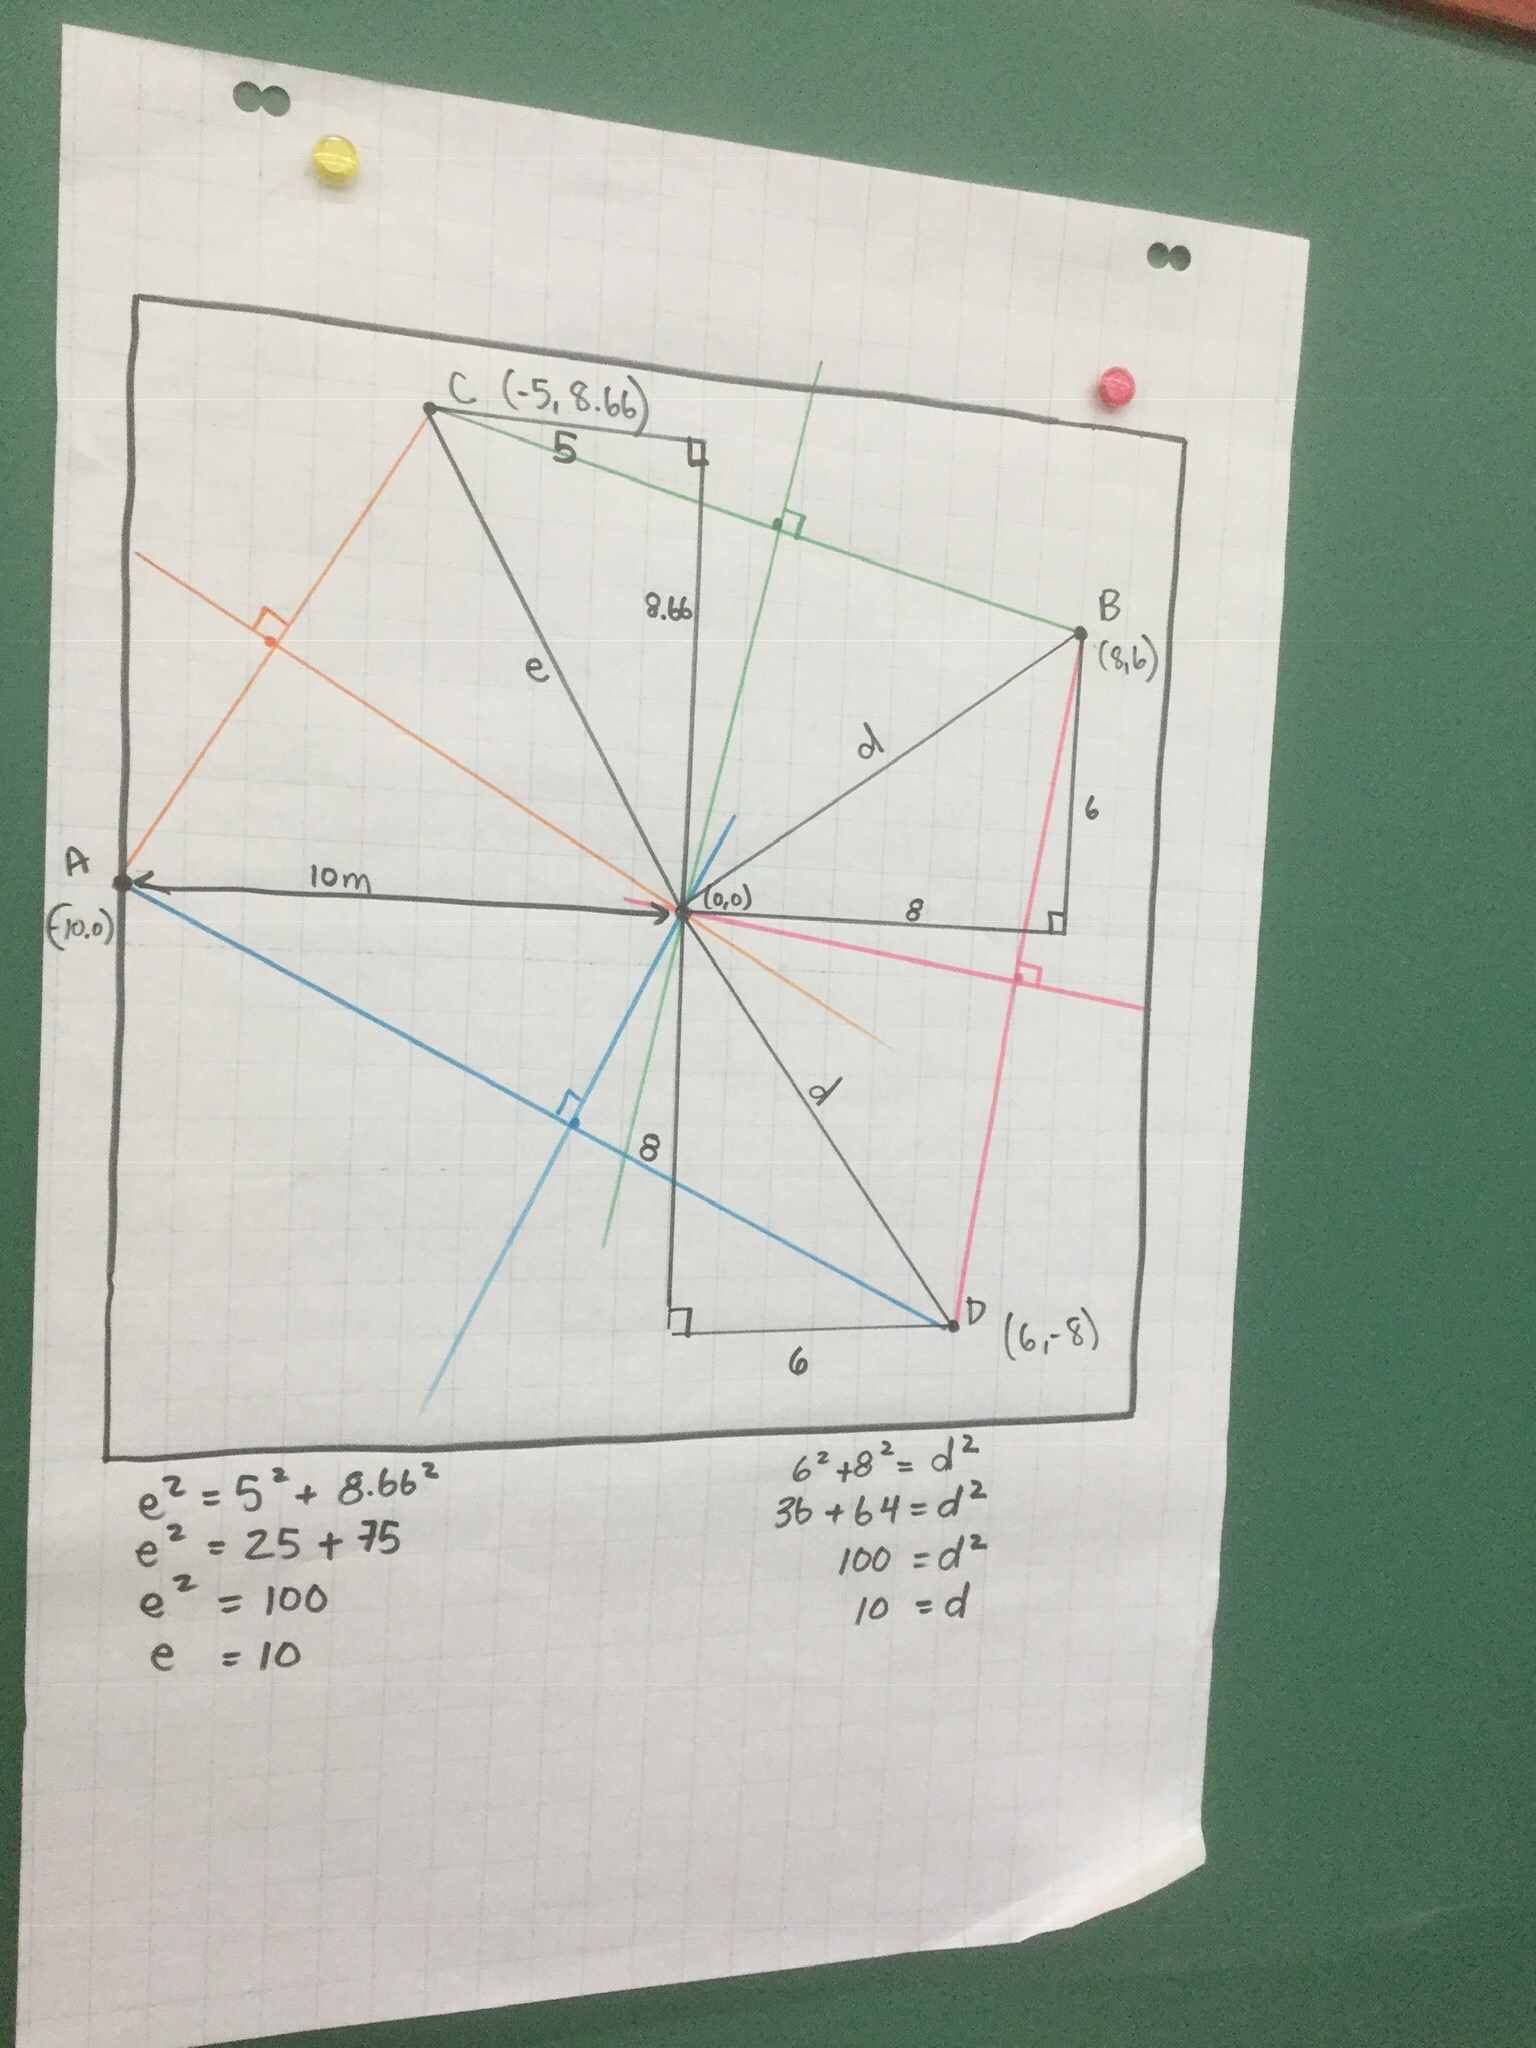
Next we looked for more points that are also on the circle. We know that (10,0) (0,10) (-10,0) (0,-10) are all 10 units from the center, as are all the variations with 6 and 8.
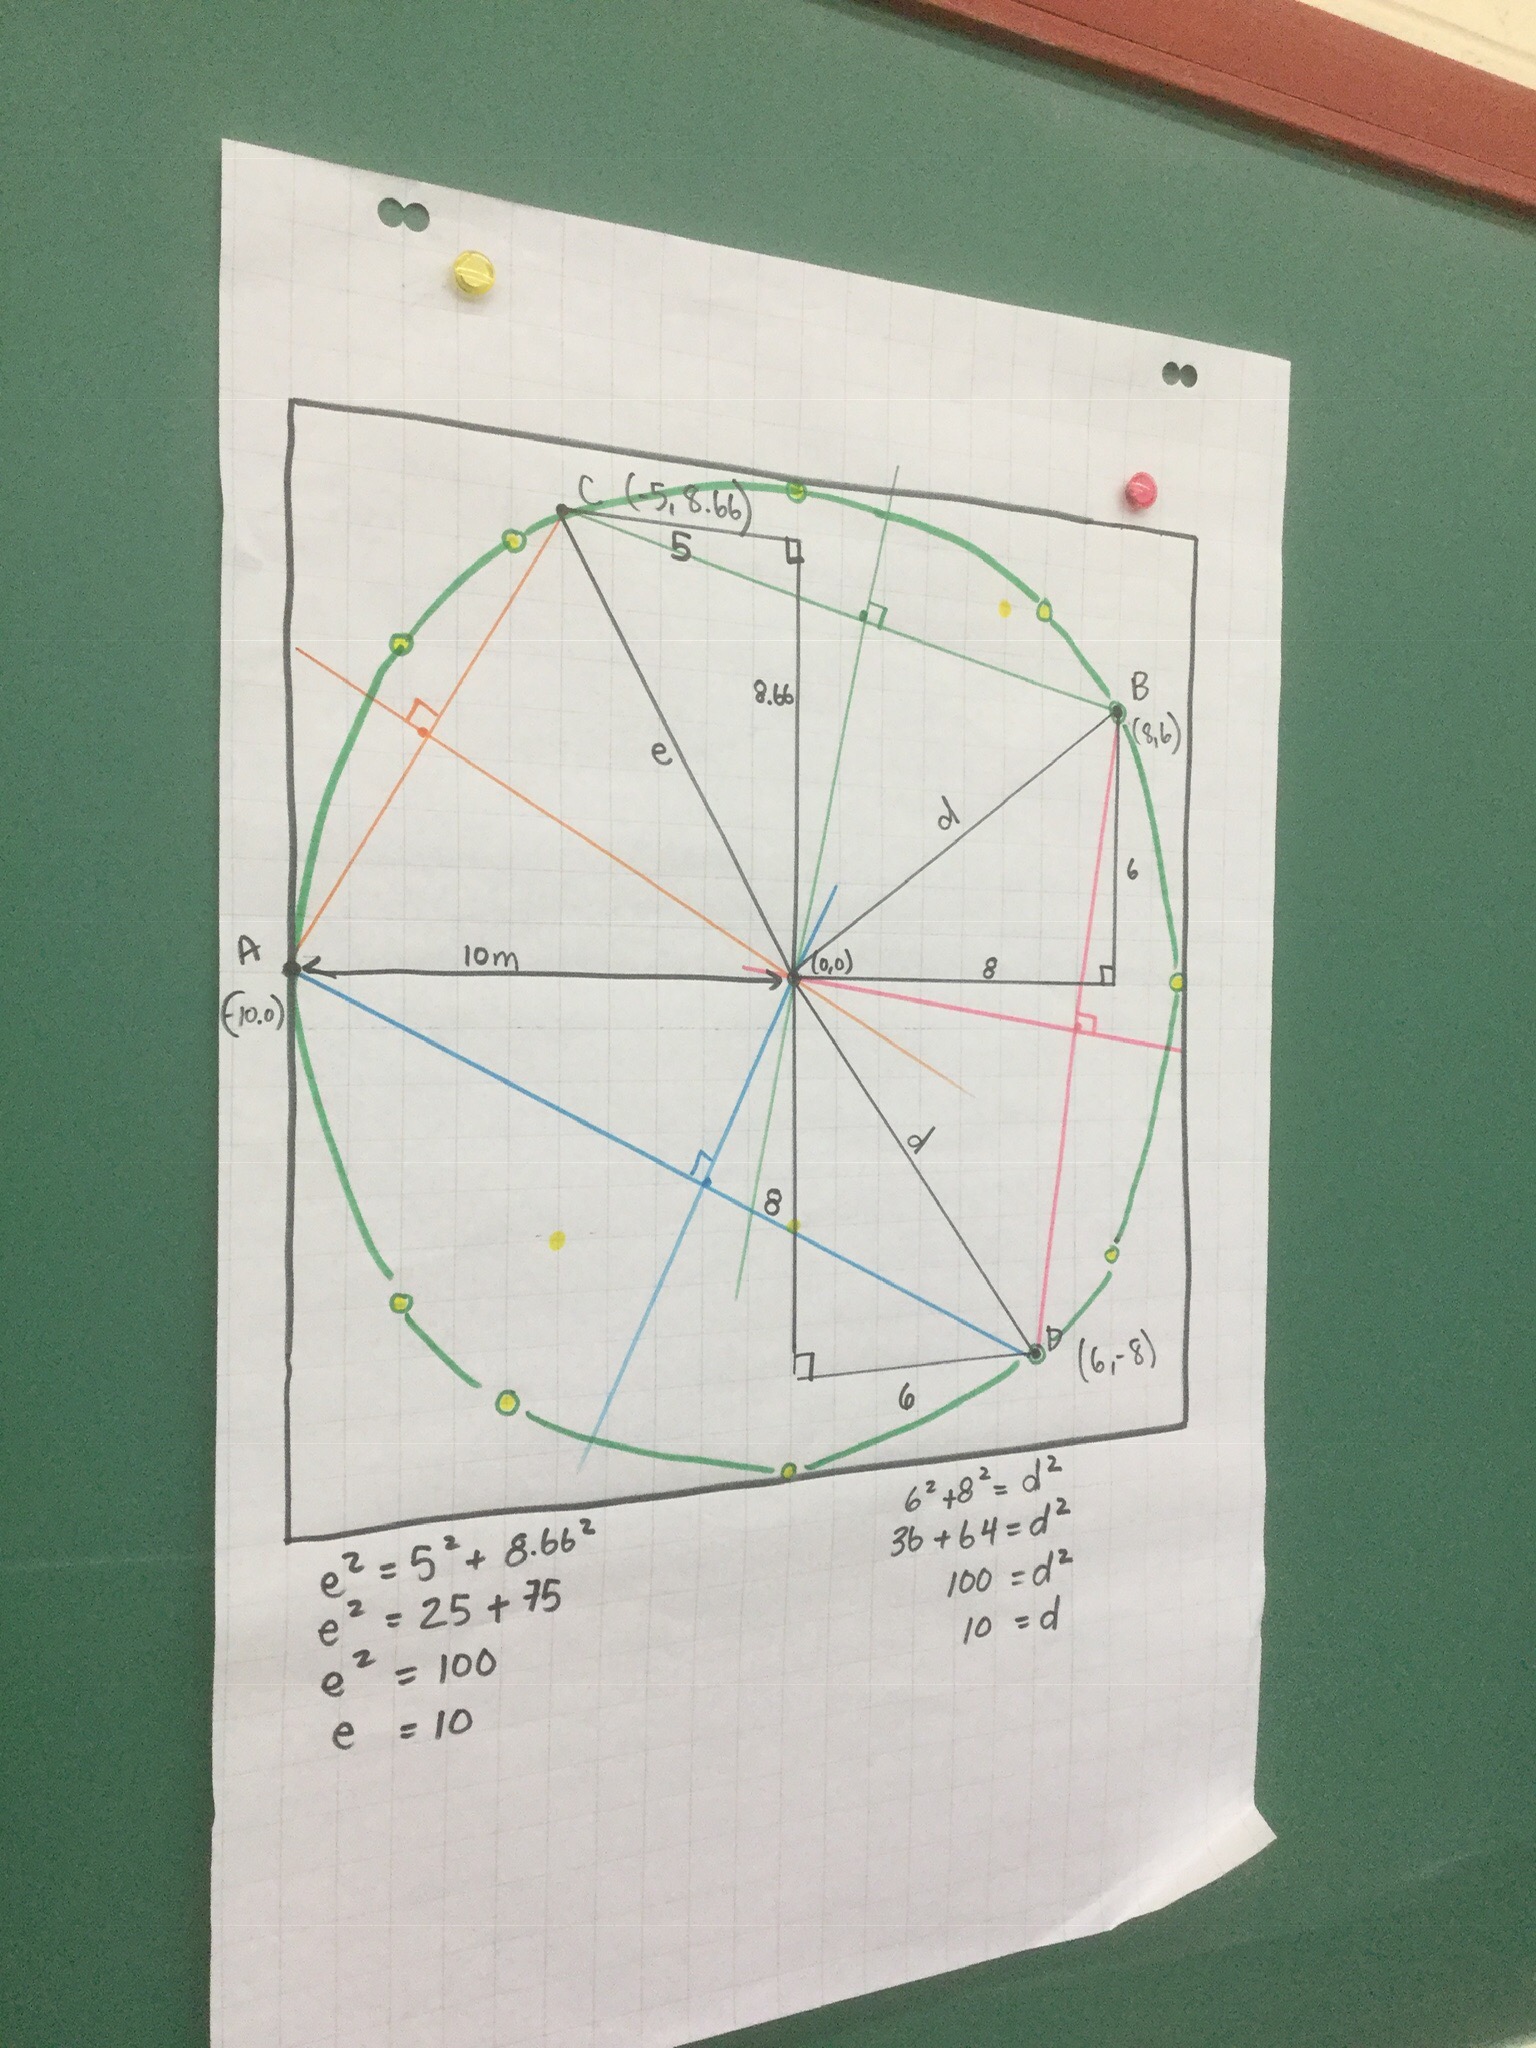
Finally we can say that any point in the circle will be wet, and any point outside the circle will remain dry.
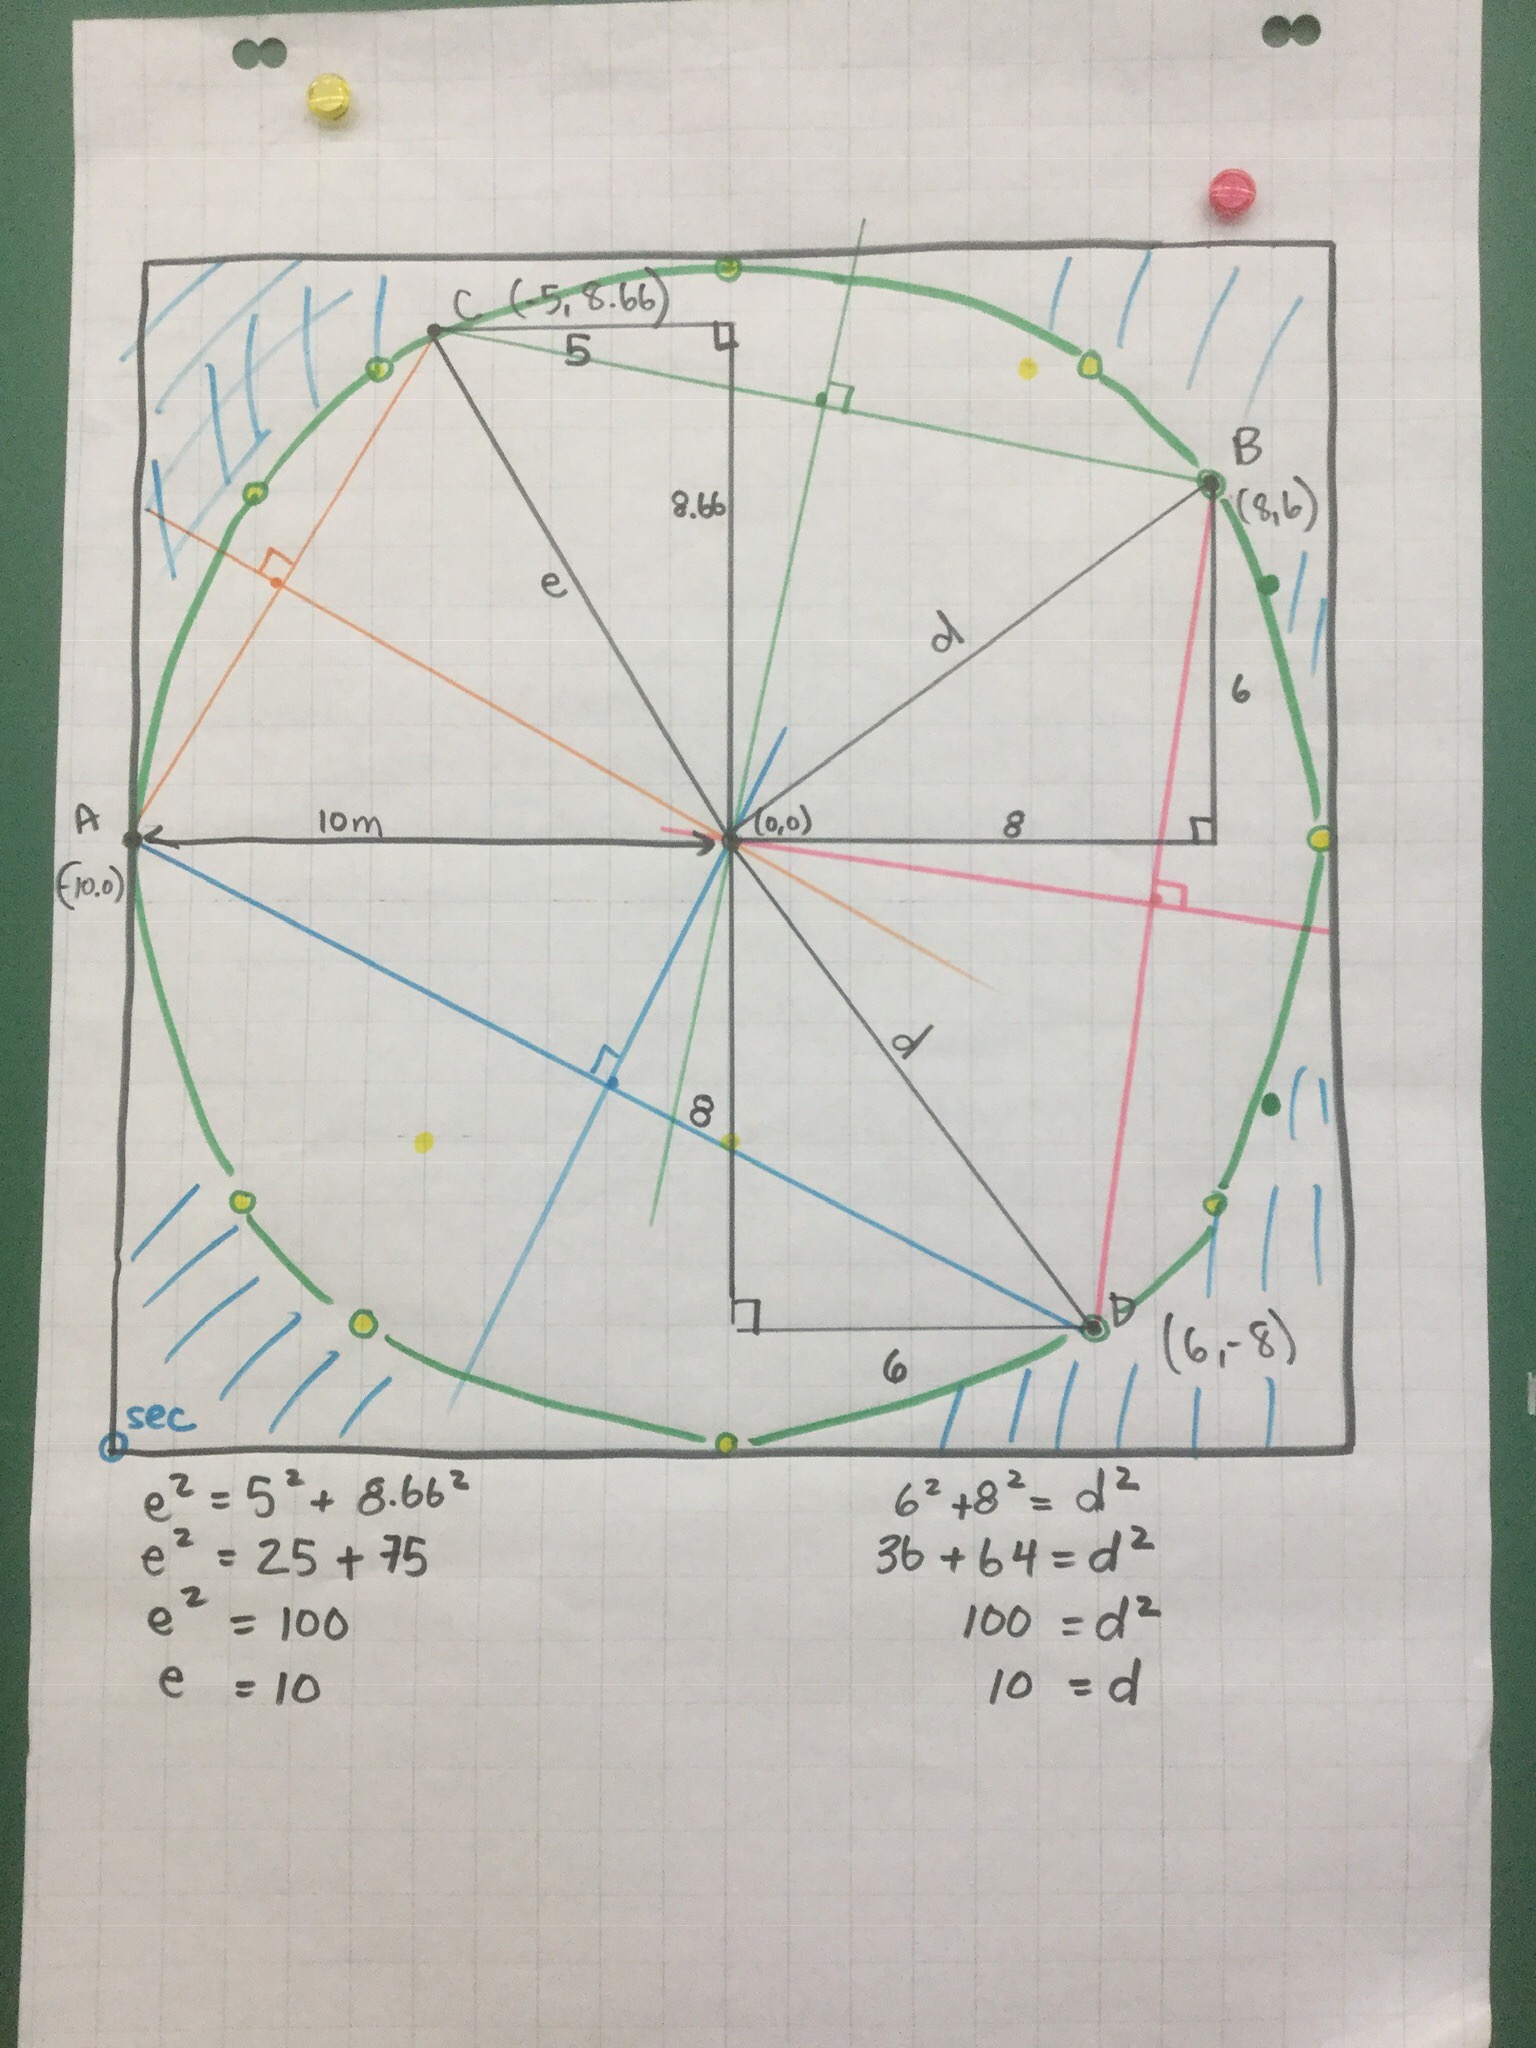
we made a general equation for the circle, centered at (0,0) using the distance formula.

And then we used the formula to help us calculate the y value for a point that has an x value of 9.
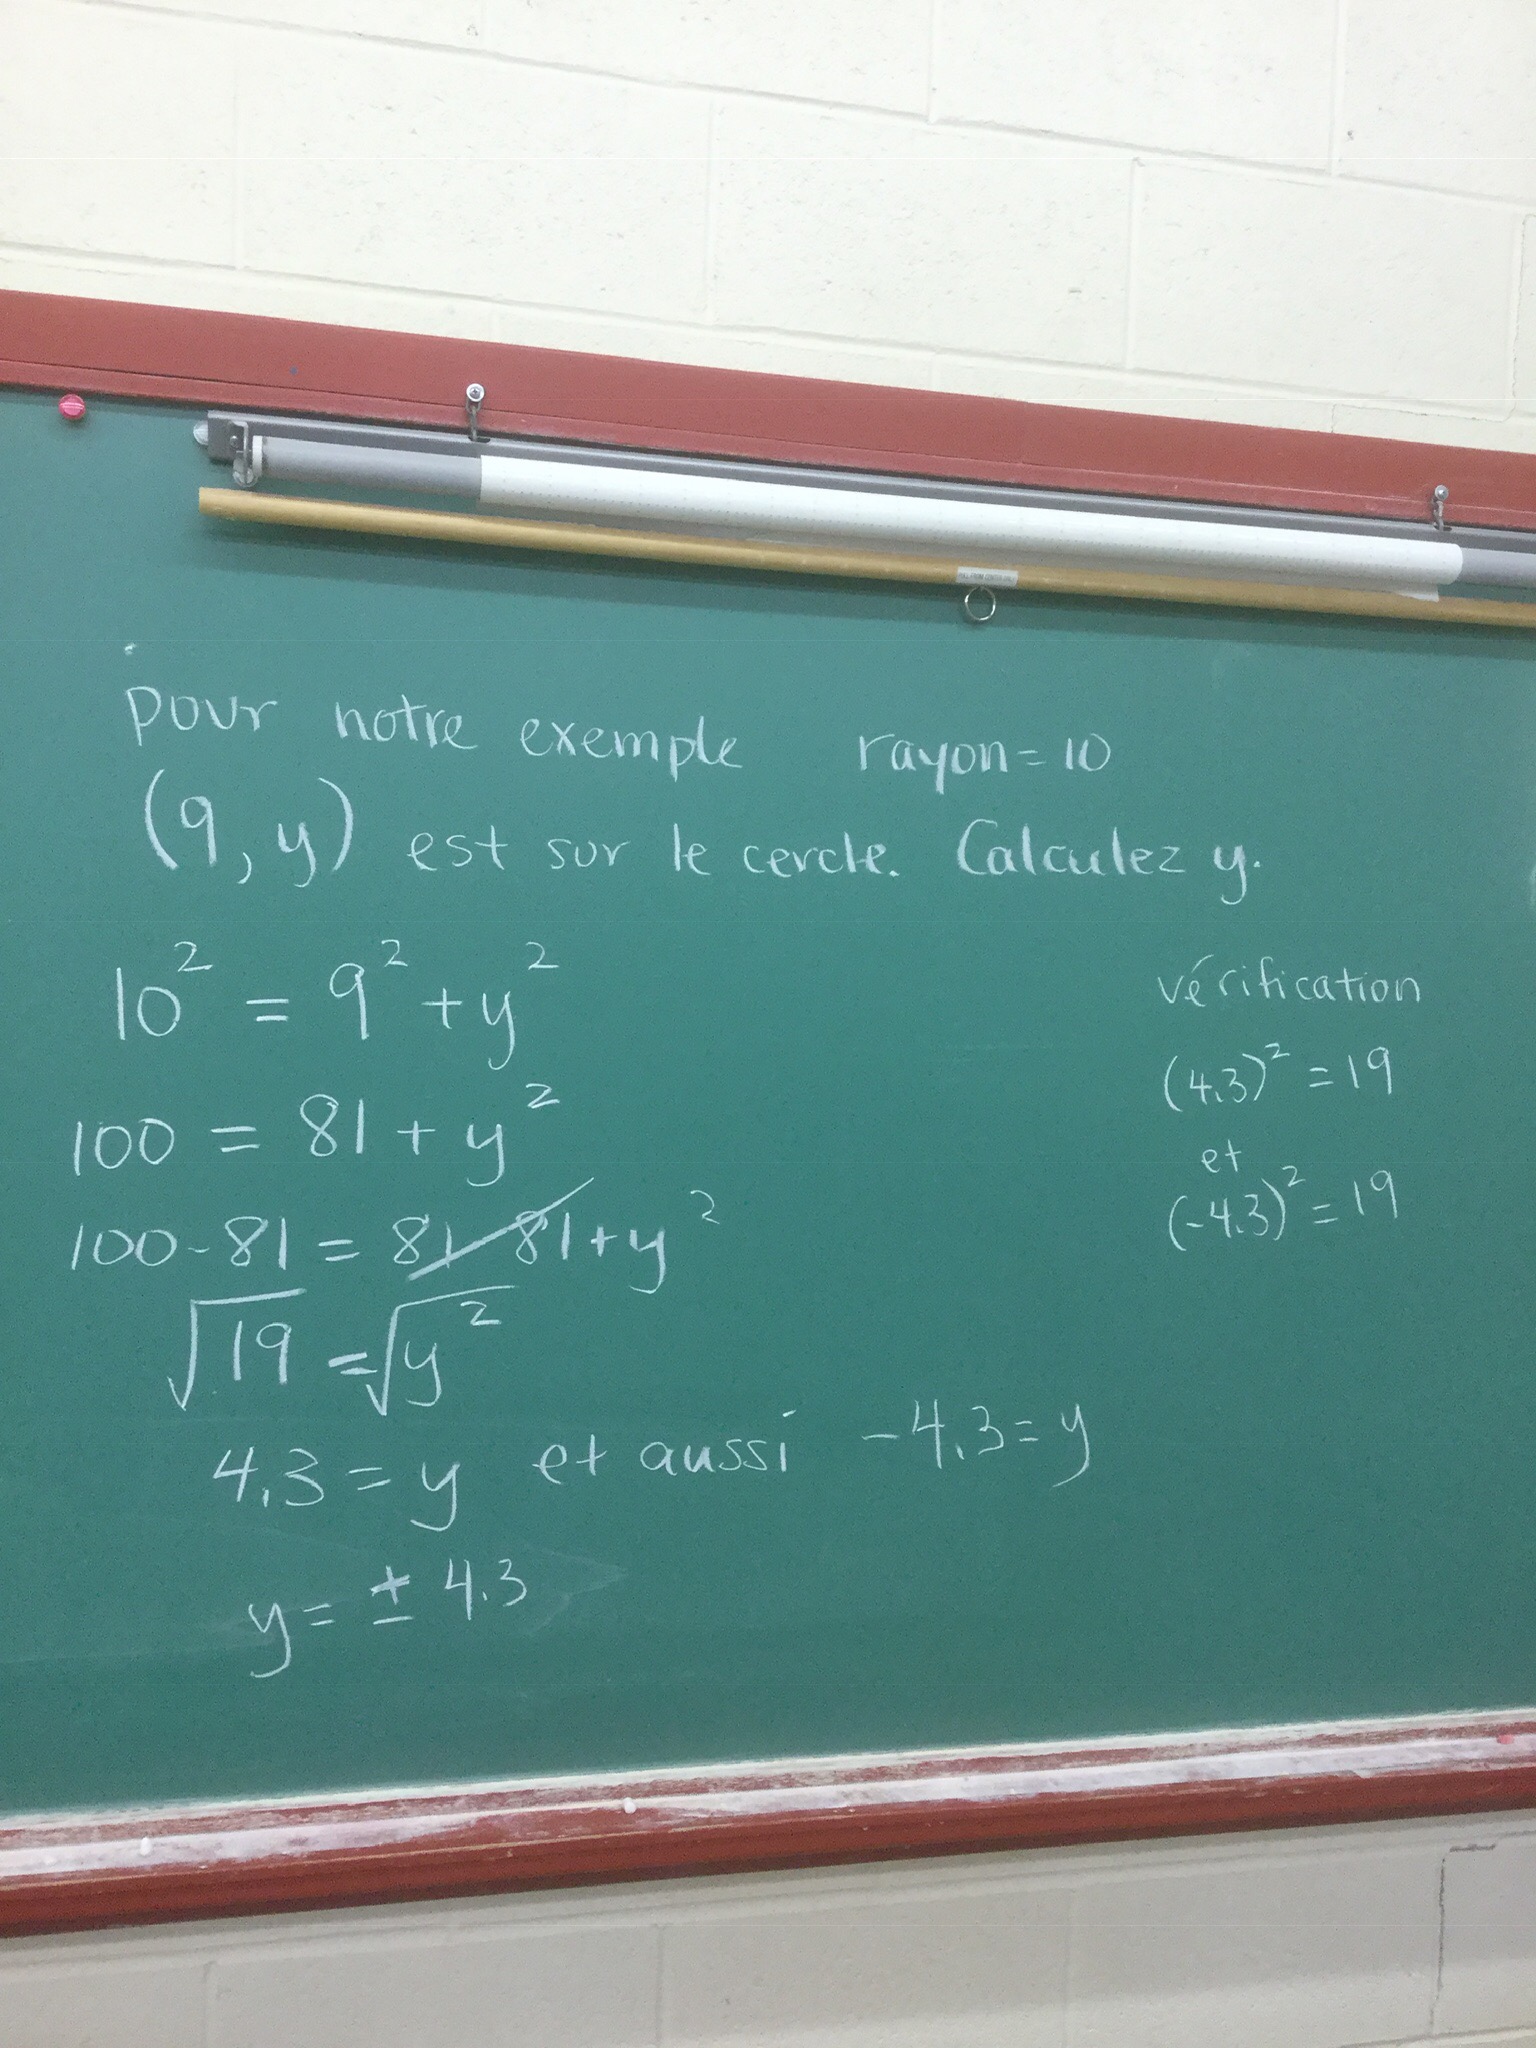
We ended up with 2 options, one is positive and one is negative, which makes sense when you look at the picture of the circle.
How about those beans?
Remember waaaaaay back about a month ago when we planted beans? Well, they are growing now! 
Each day we’ve been measuring their height, and today’s the day to graph the results.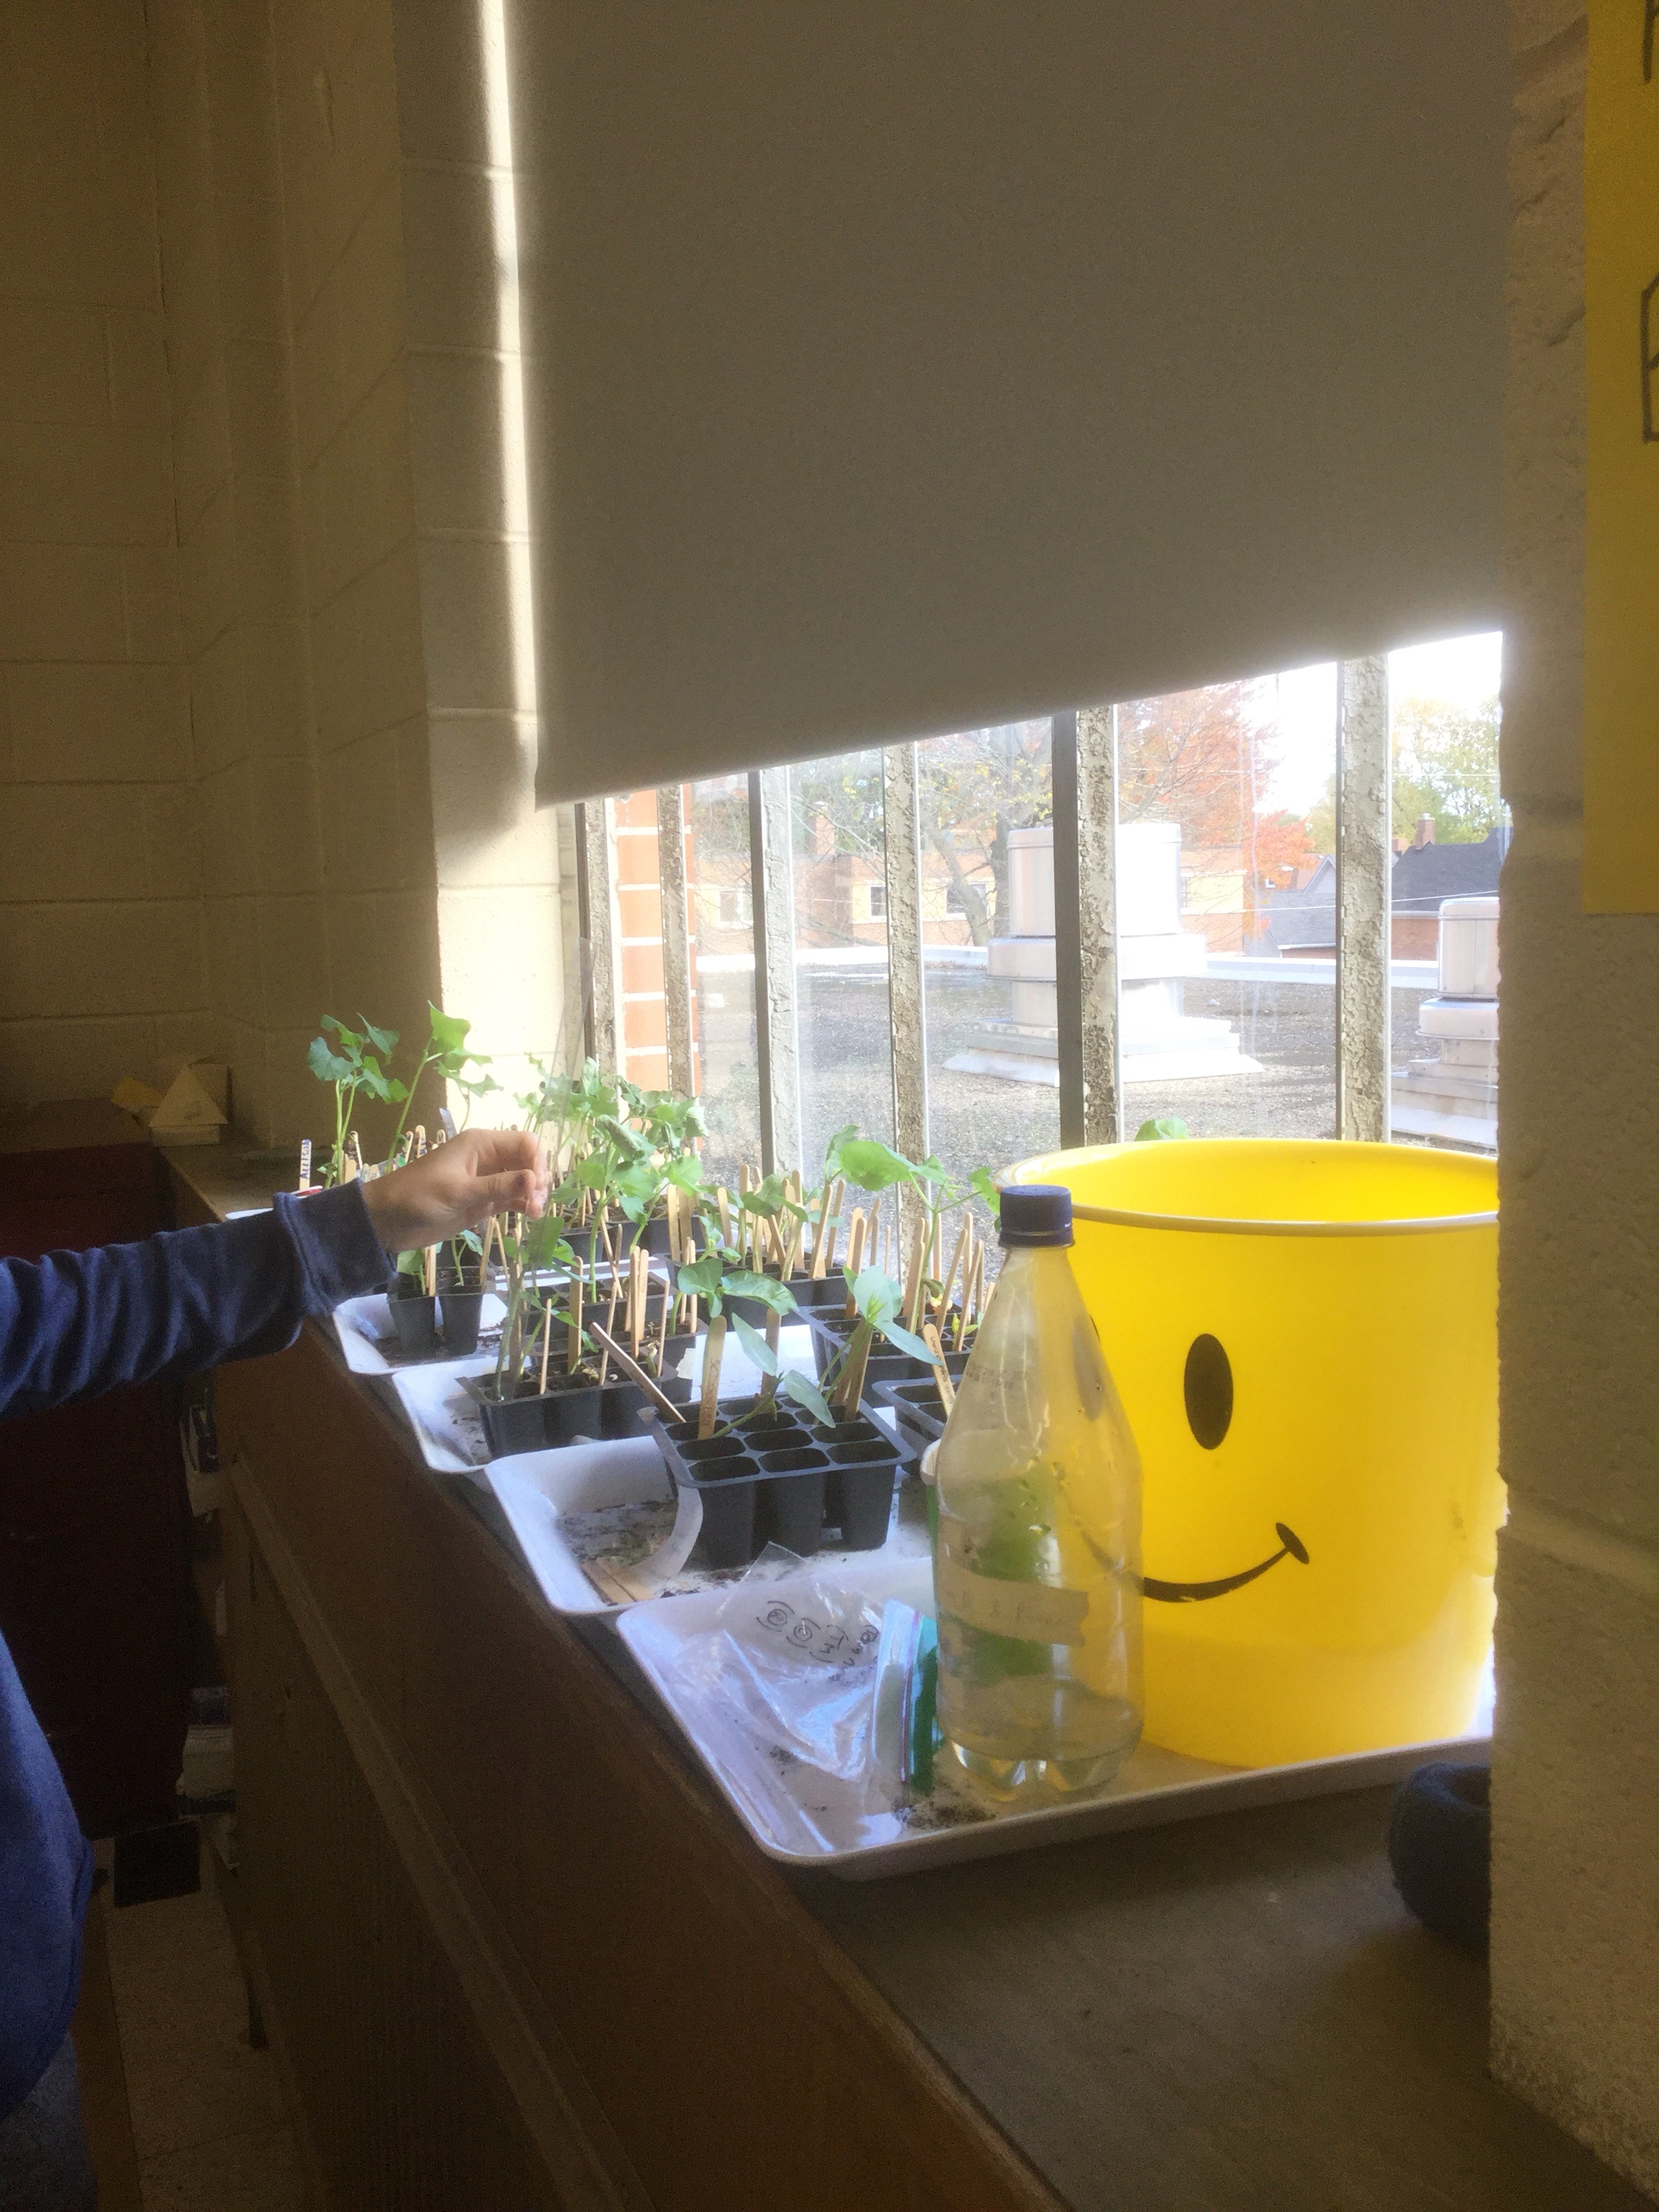
We are now pretty much experts with making scatter plots. We know the height of the bean is dependent on the day (otherwise, if i cut the bean smaller I’d go back in time….which would be a great short story, but for math class we assume that isn’t the case). We know hat our axes need consistent scales. We know that for scatter plots we don’t join up all the points, ut we show trends with lines and curves of best fit.
We now have choices about how to represent our data. We can graph each bean in a different colour, and have a different line/curve of best for for each.
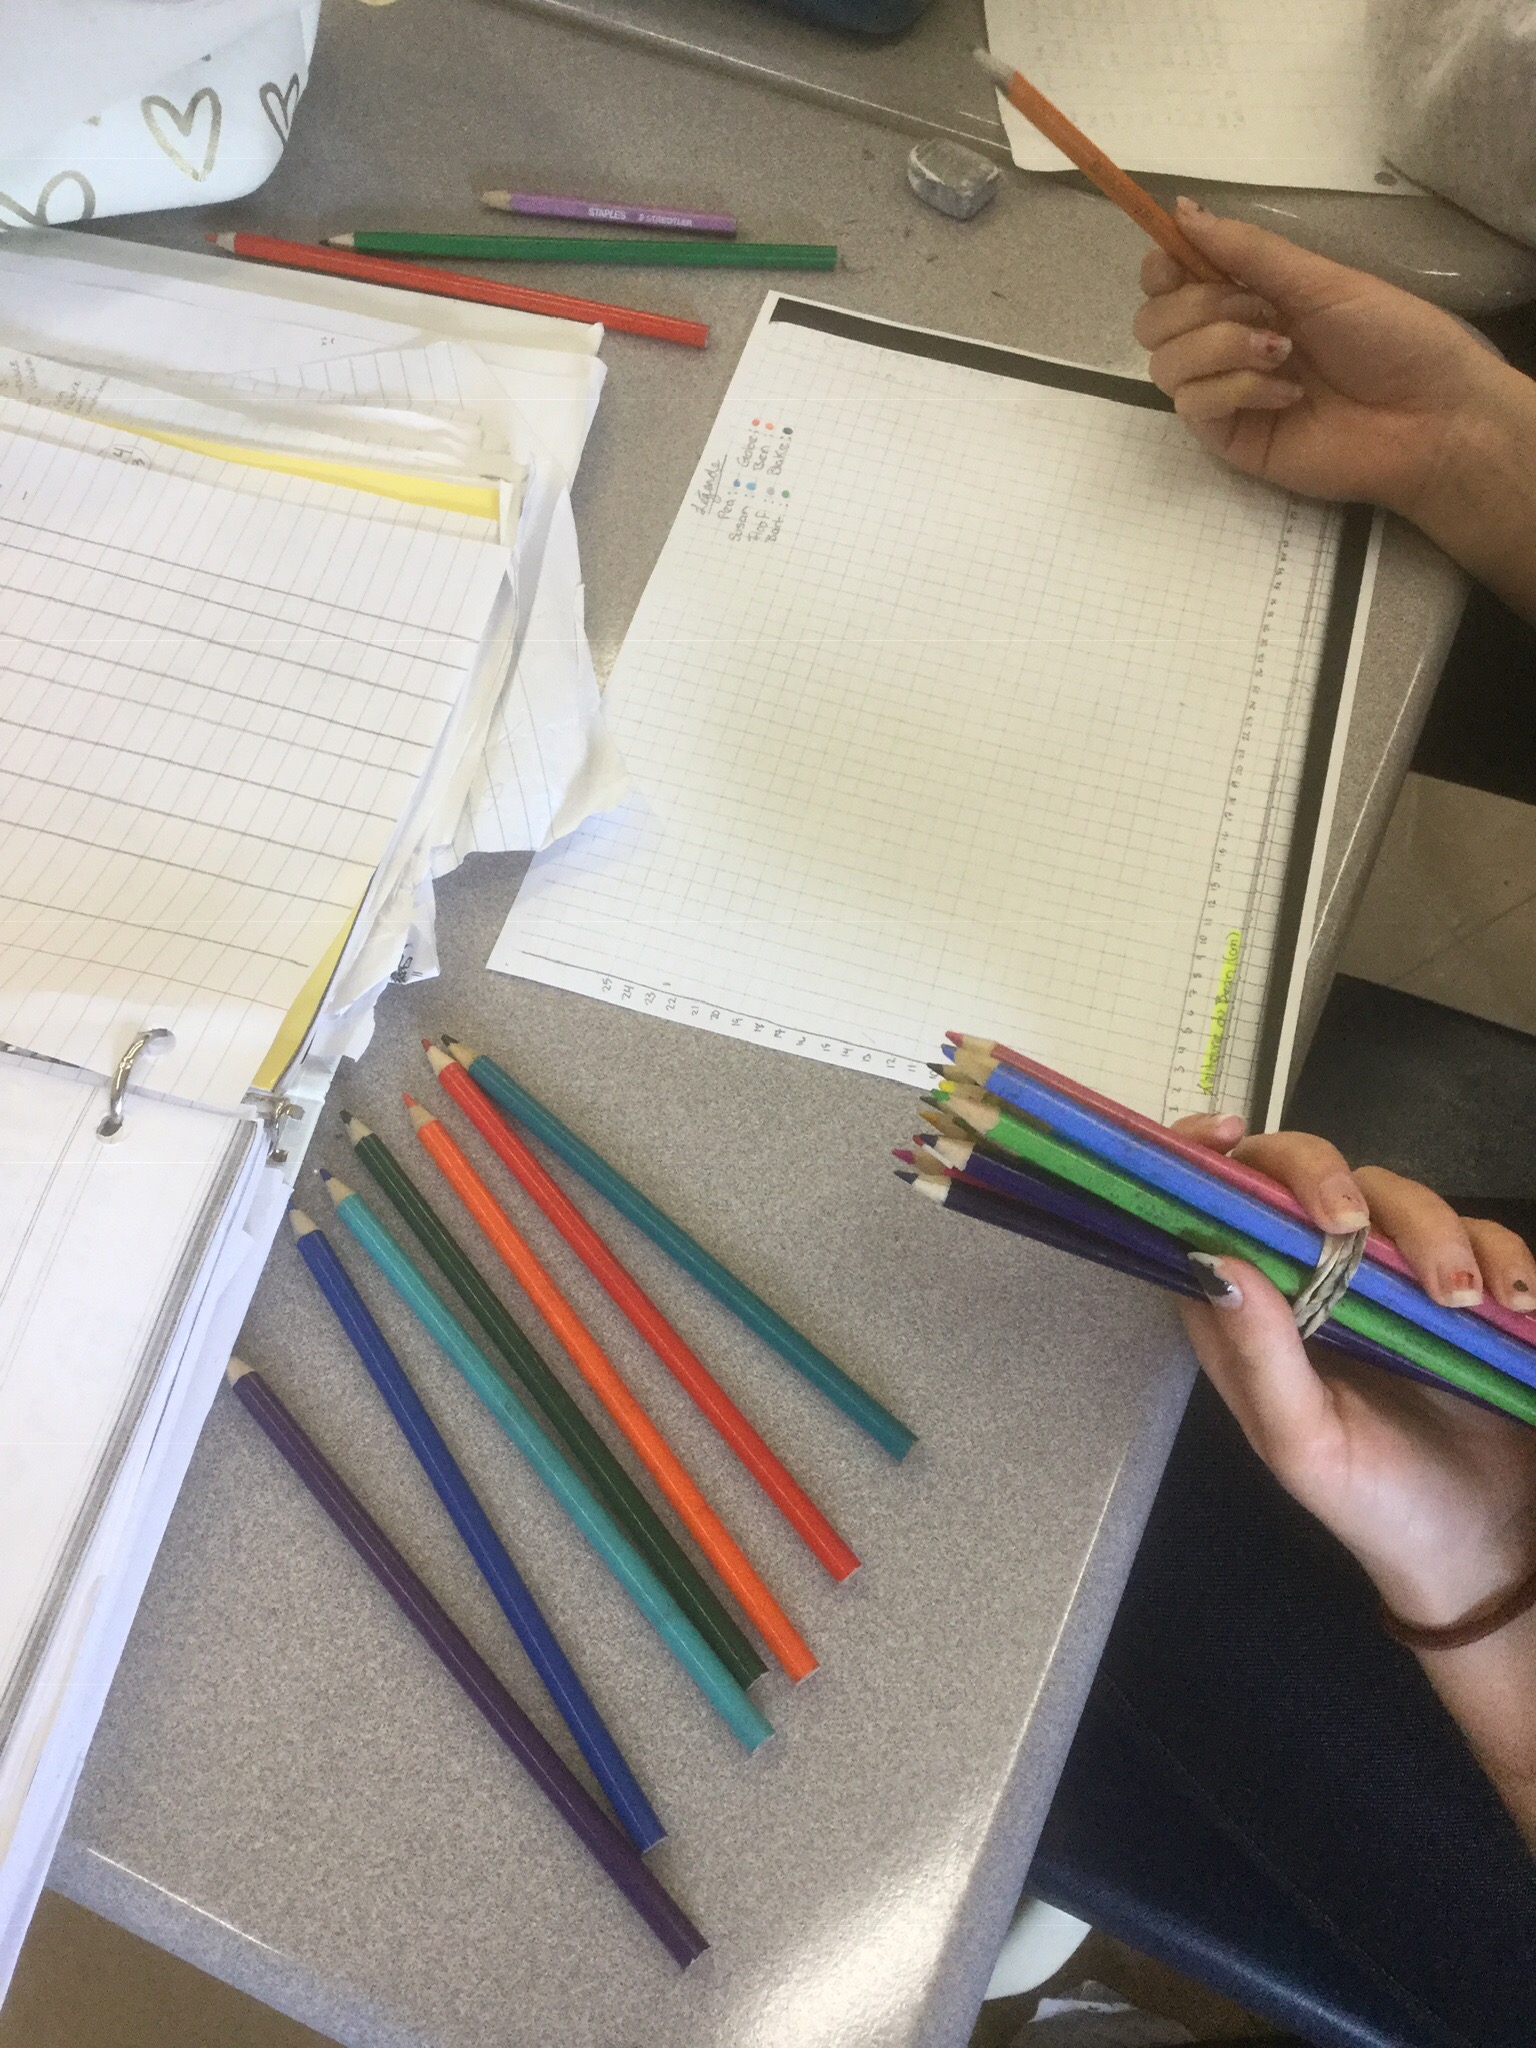
We can also decide to graph each type of bean (avid readers will remember that we planted kidney beans and black eyed peas) and we can compare one type to another.
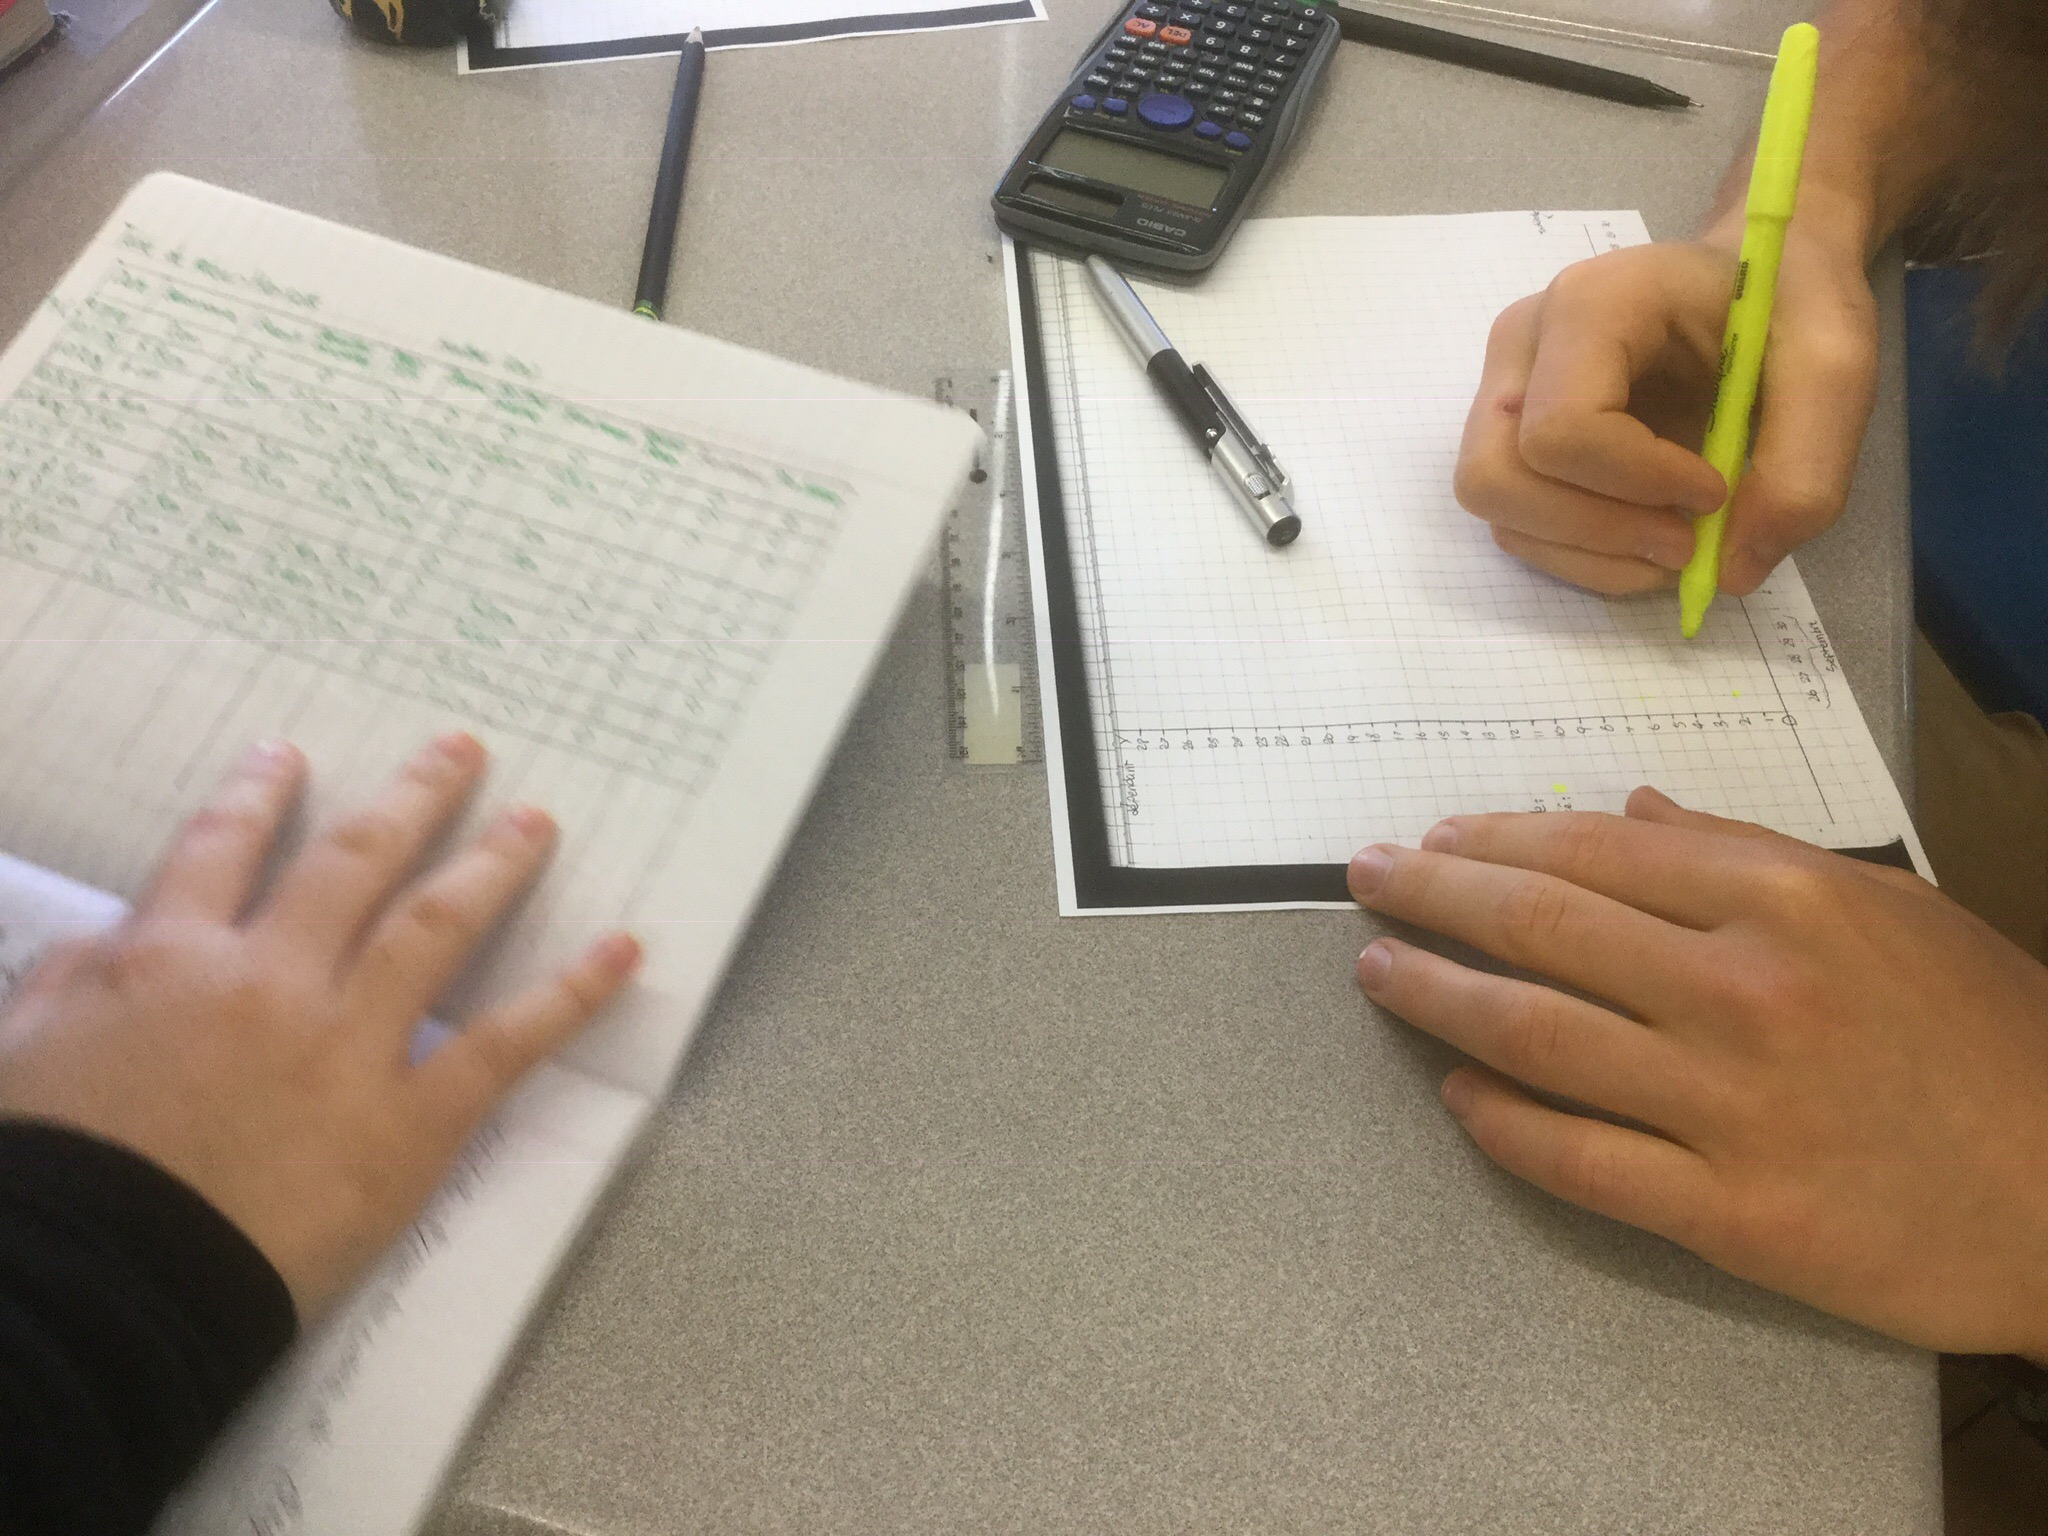
With whatever method, we have a job to do. We need to predict what out bean plant’s height will be 2 weeks from now (oct 25). We also have to estimate how tall they were on Monday (Thanksgiving) when we were not here to measure them.
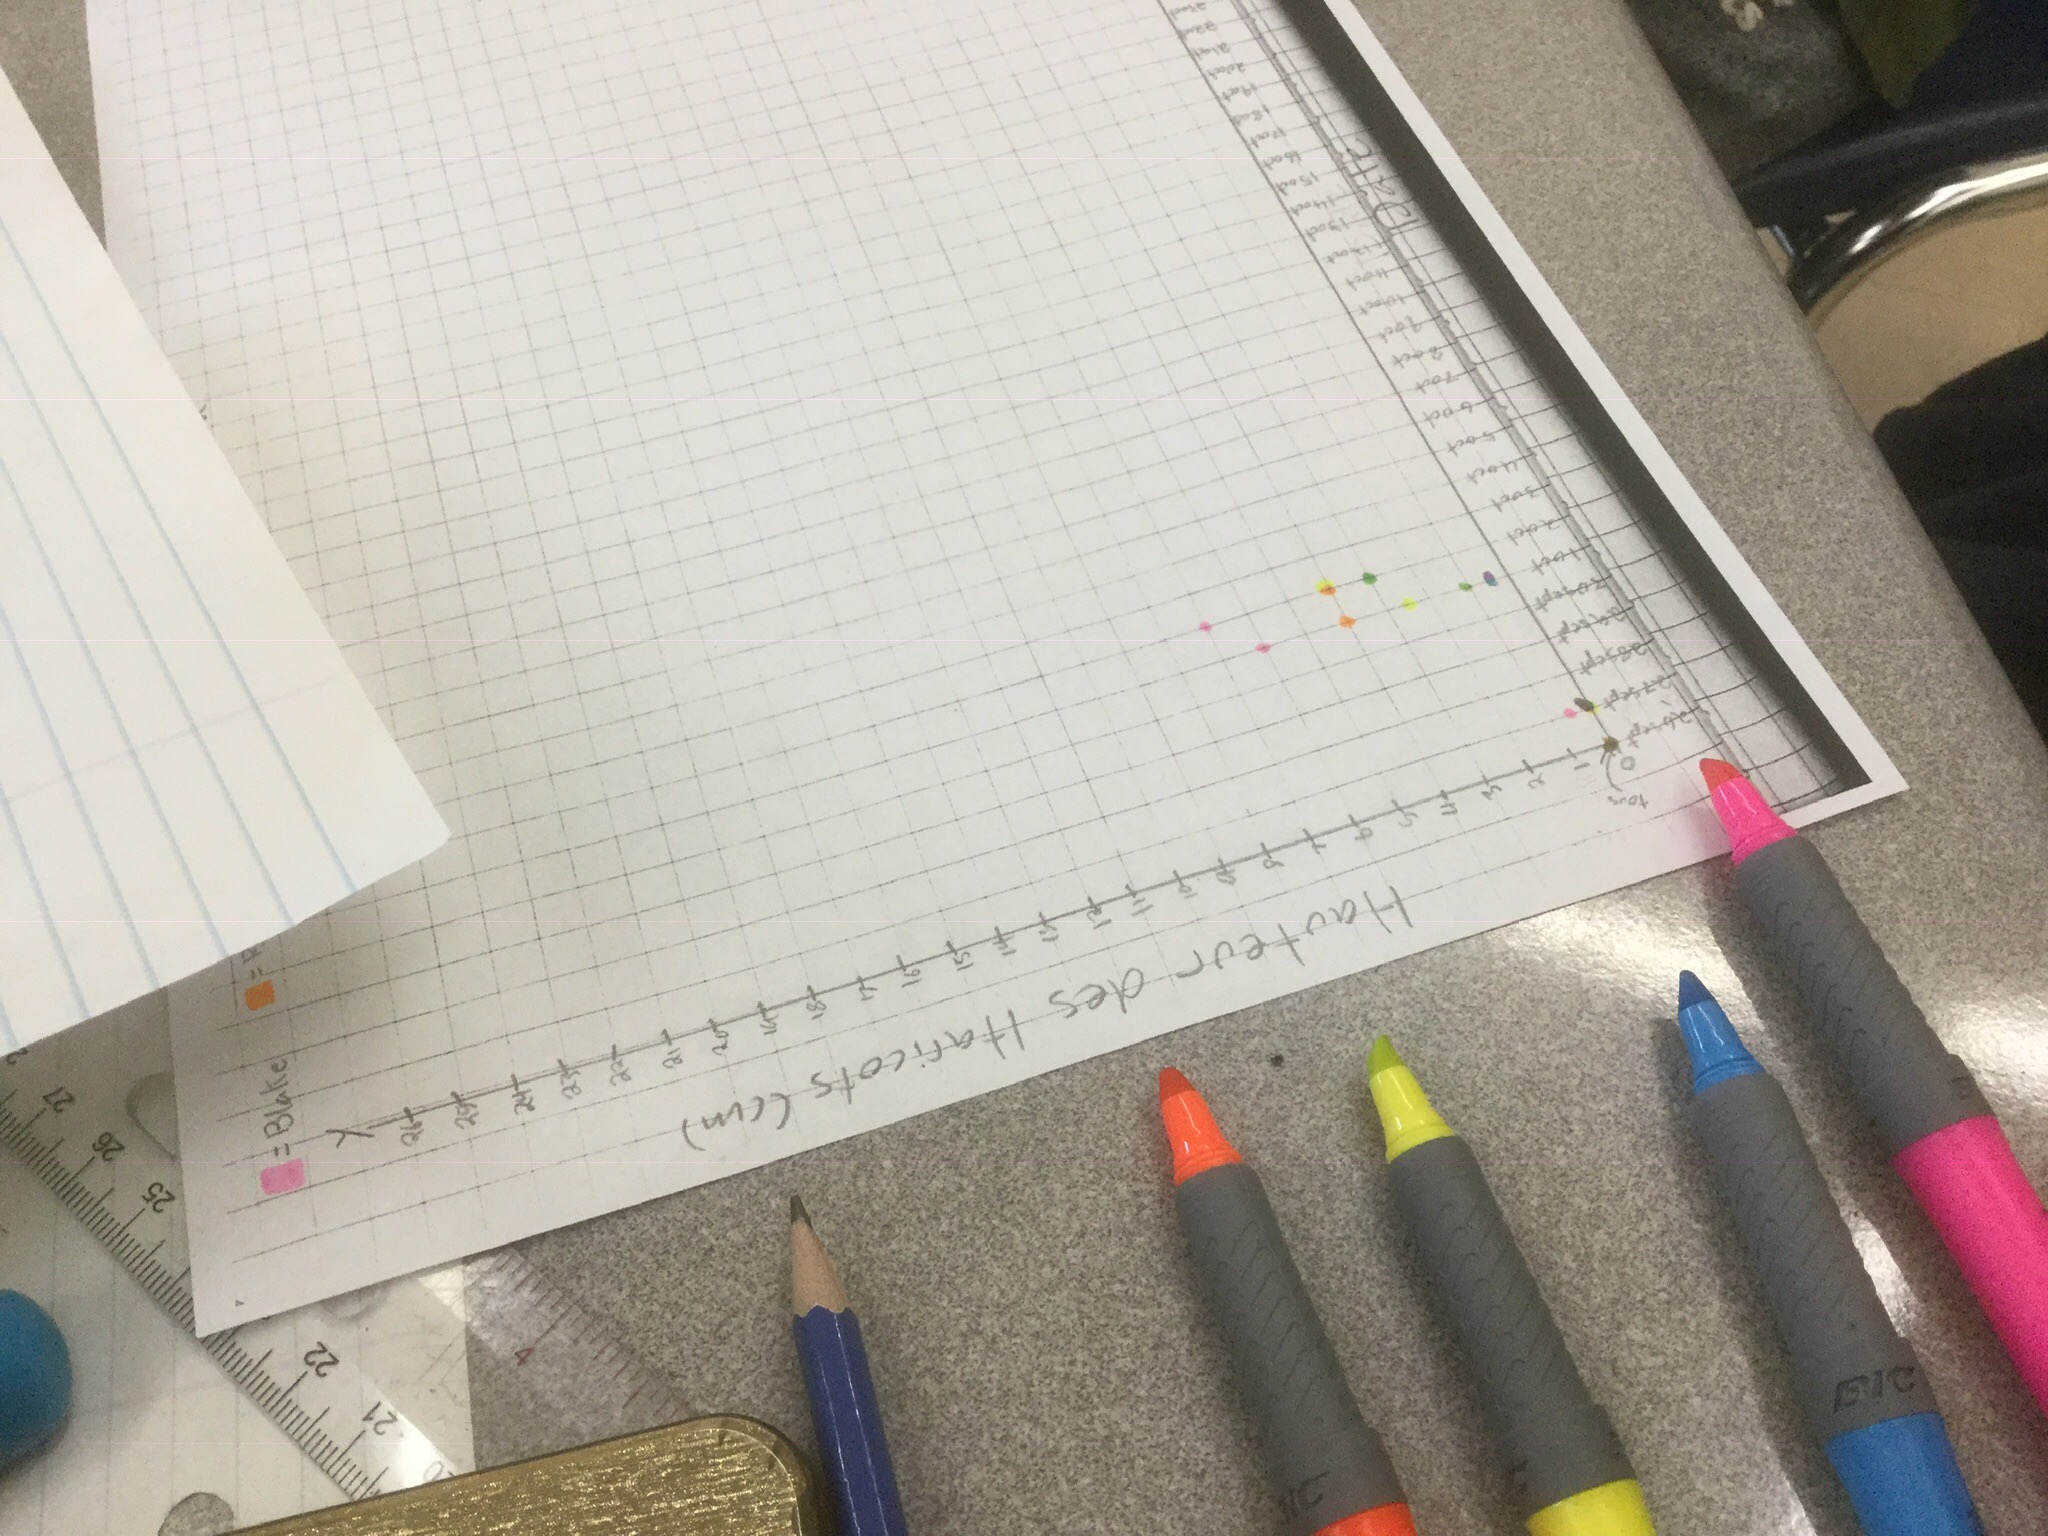
Homework this weekend is this graph, the error analysis from summative 1, and an email home about the first summative, early reports, visual patterns and beans(optional).
On a sad note…some of the beans (who grew so fast in the dark) exhausted their energy stores and have started to die, or their stalks have broken when we’ve measured them….so for a few of the plants, today marked the end of their experiment.

Shortest distance between a point and a line
Grade 10s experienced some productive struggle today as we attempted to determine the shortest distance between a point (4,5) and a line (y=2/5x-6). Many could guess approximately where the shortest distance would be…. and a few lightbulb moments happened when we realized it would be perpendicular to the line….and we know perpendicular lines have slopes that are negative reciprocals (inverse négative)…so we made an equation for the perpendicular line….and then we needed to solve for the intersection of the original line, and the new line. We substituted, and solved….and then….and only then….could we use the distance formula.
It was not easy to wrestle with this at first. Most groups got half way there, and then we looked at the process as a class to be sure we are all on the same page.
From Visual Patterns to Graphs
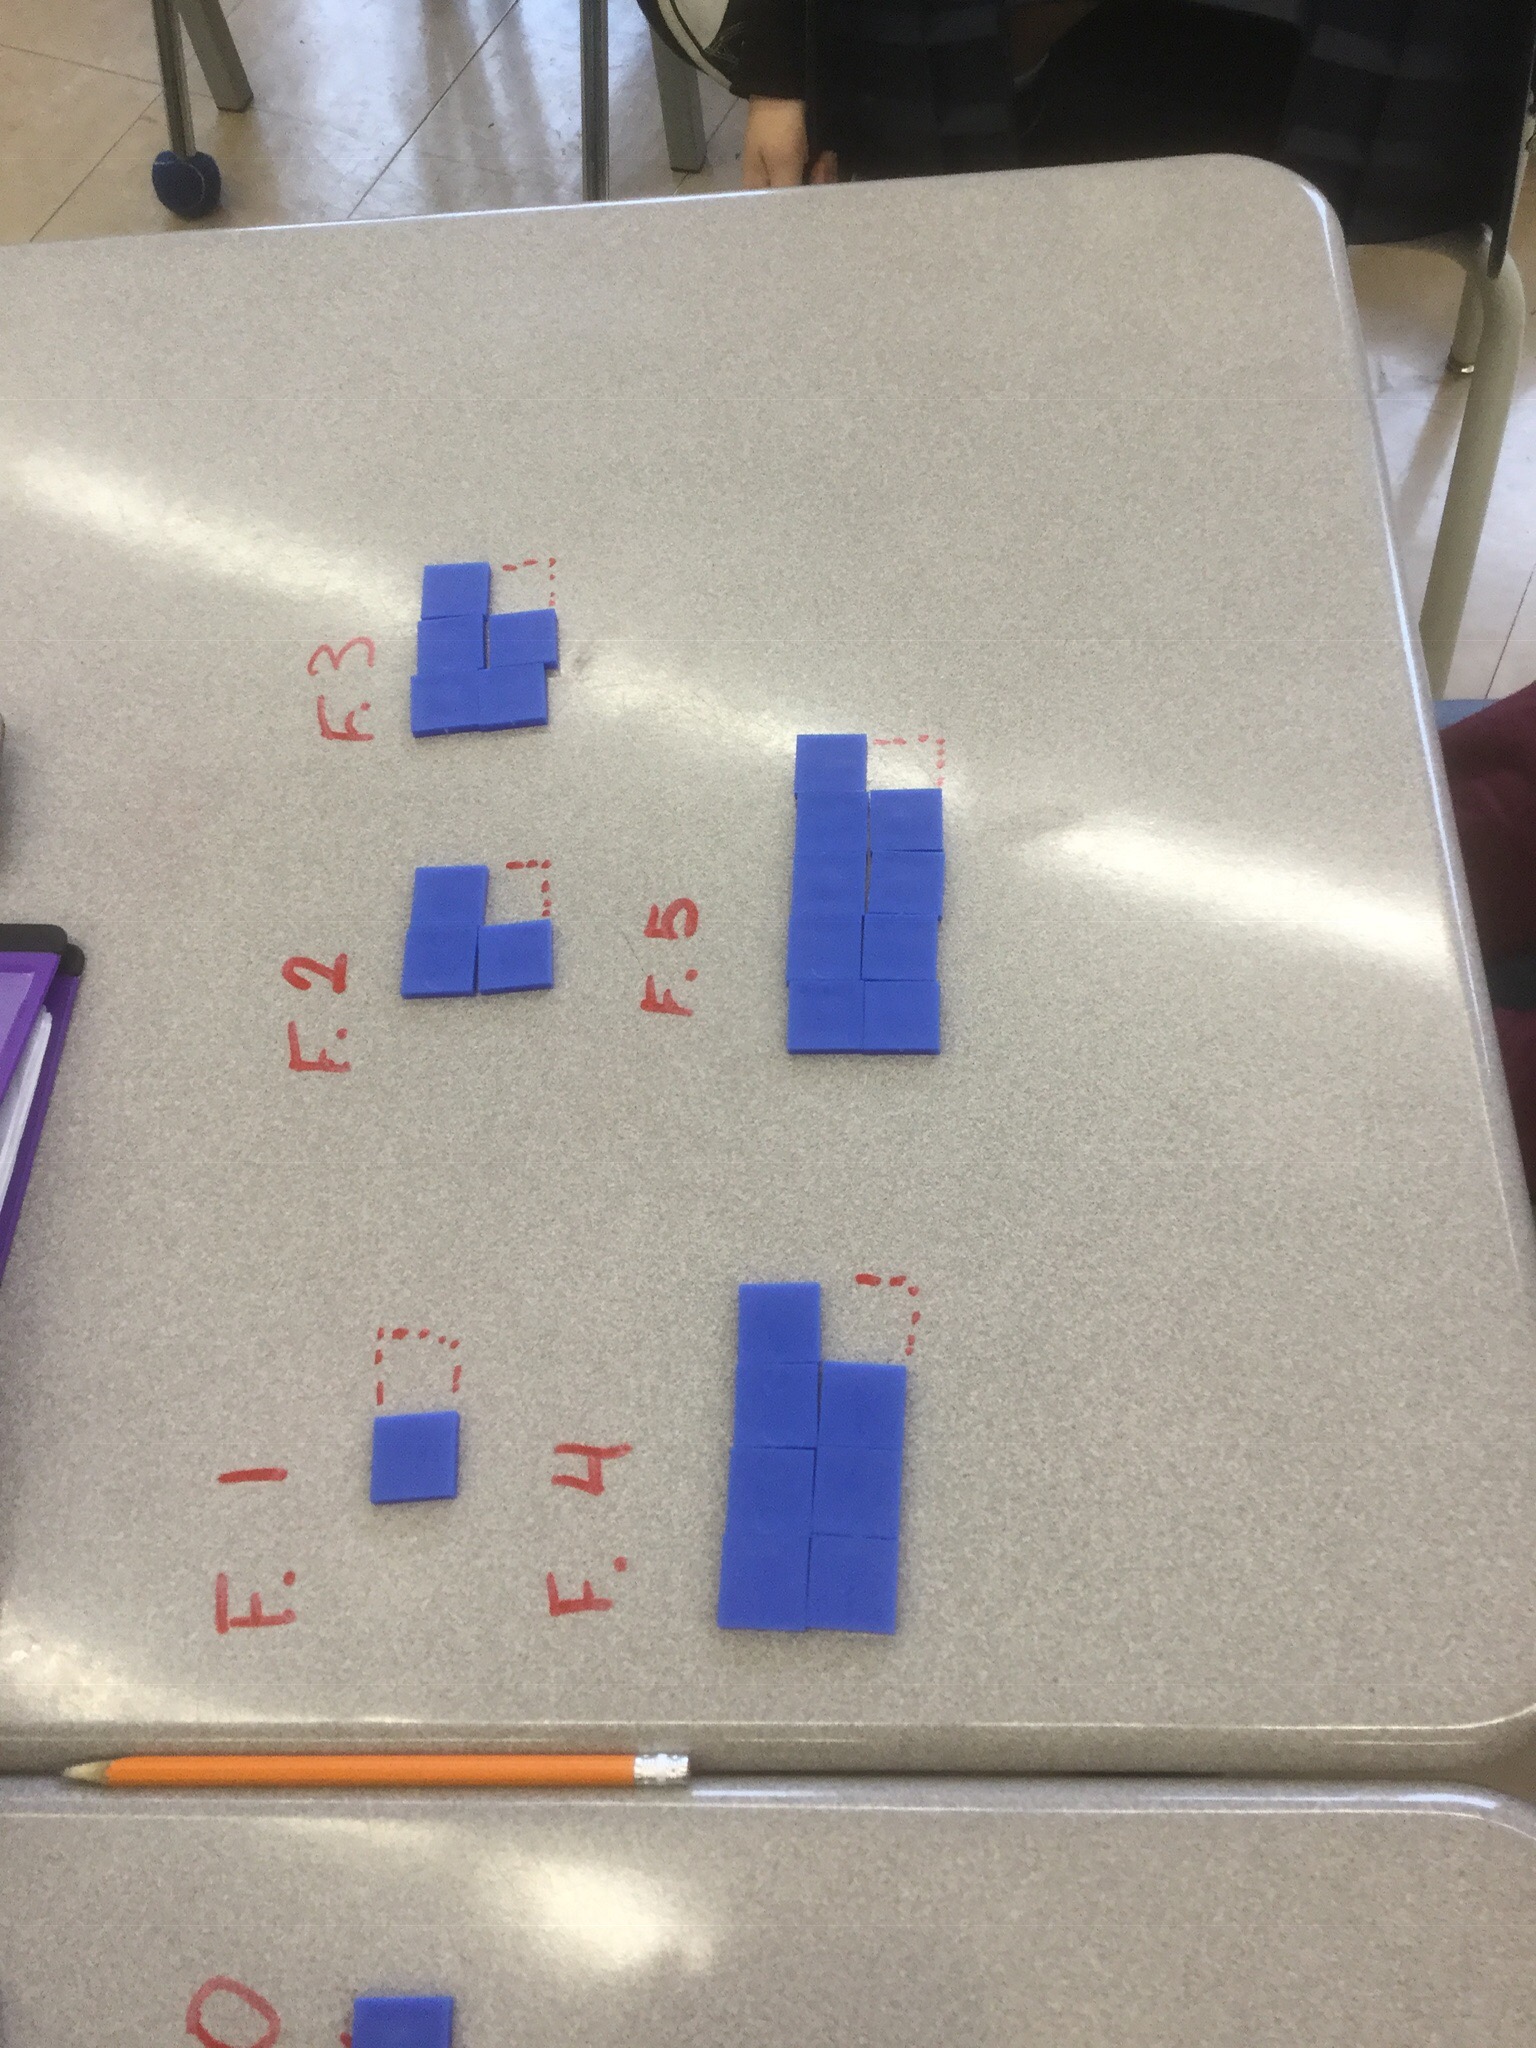
Today we made some visual patterns using our square tiles.
Here’s an example of 2n+1. We see the 1 is a constant term, always there (the yellow square). We are looking for groups of n when we look at the blue. See them? Horizontally we have 2 groups of n (when n is 1 we have 2 rows of 1, when n is 3 we have 2 rows of 3). We are using n to represent the figure number.
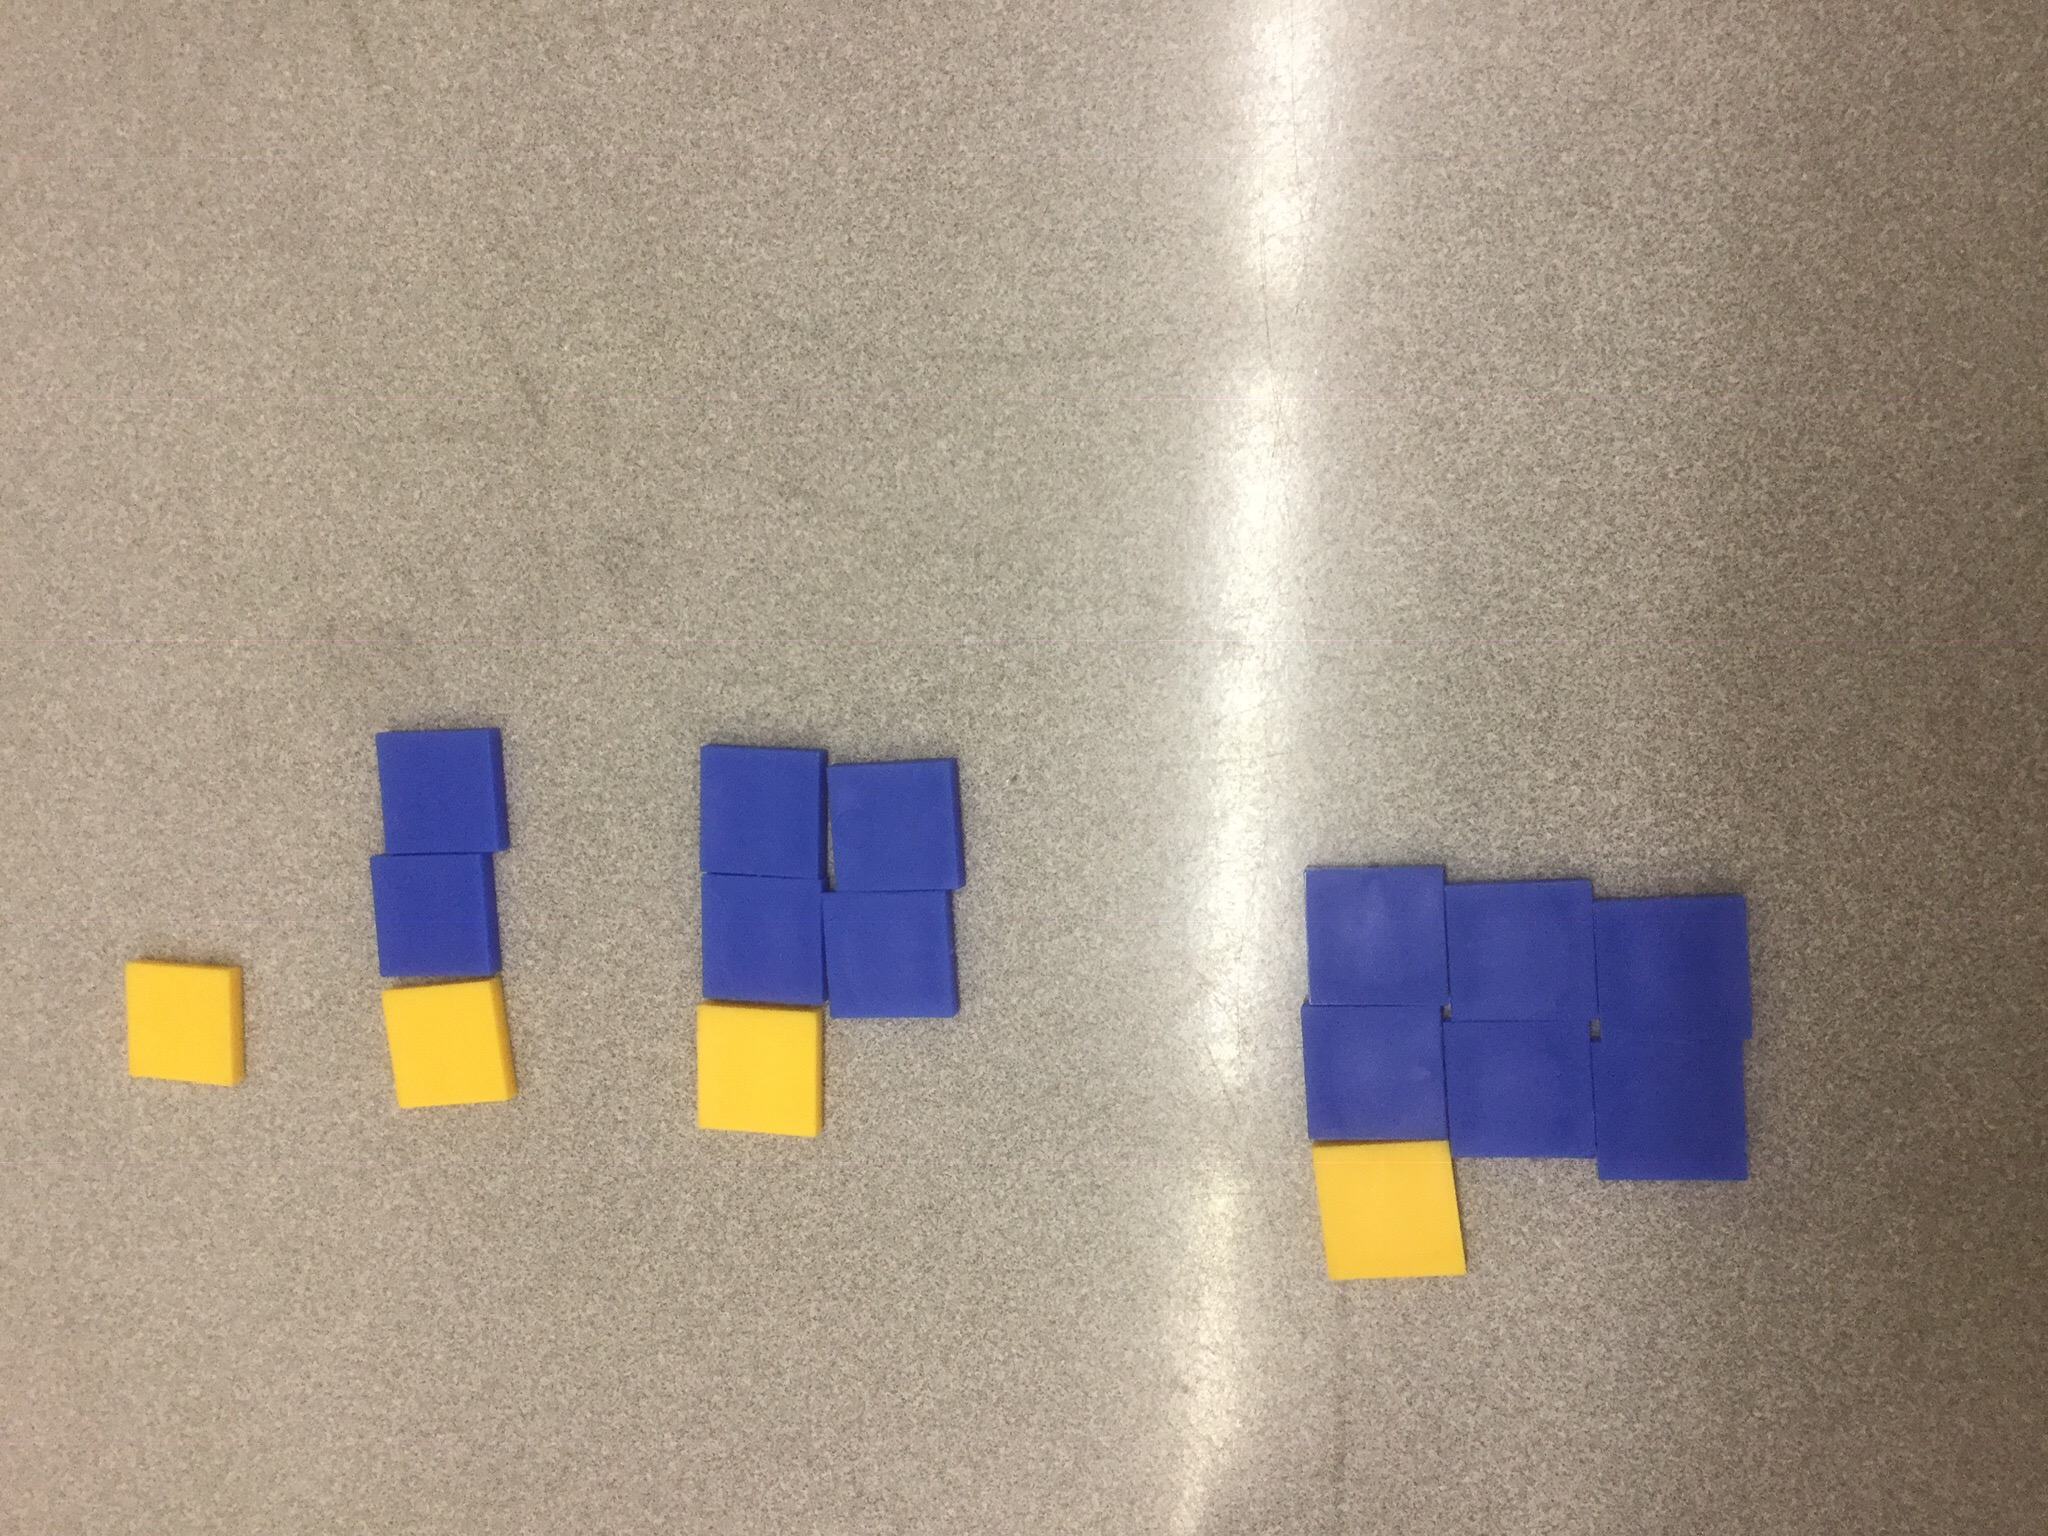
We experimented with what to do if the constant term is negative….how we can show that.
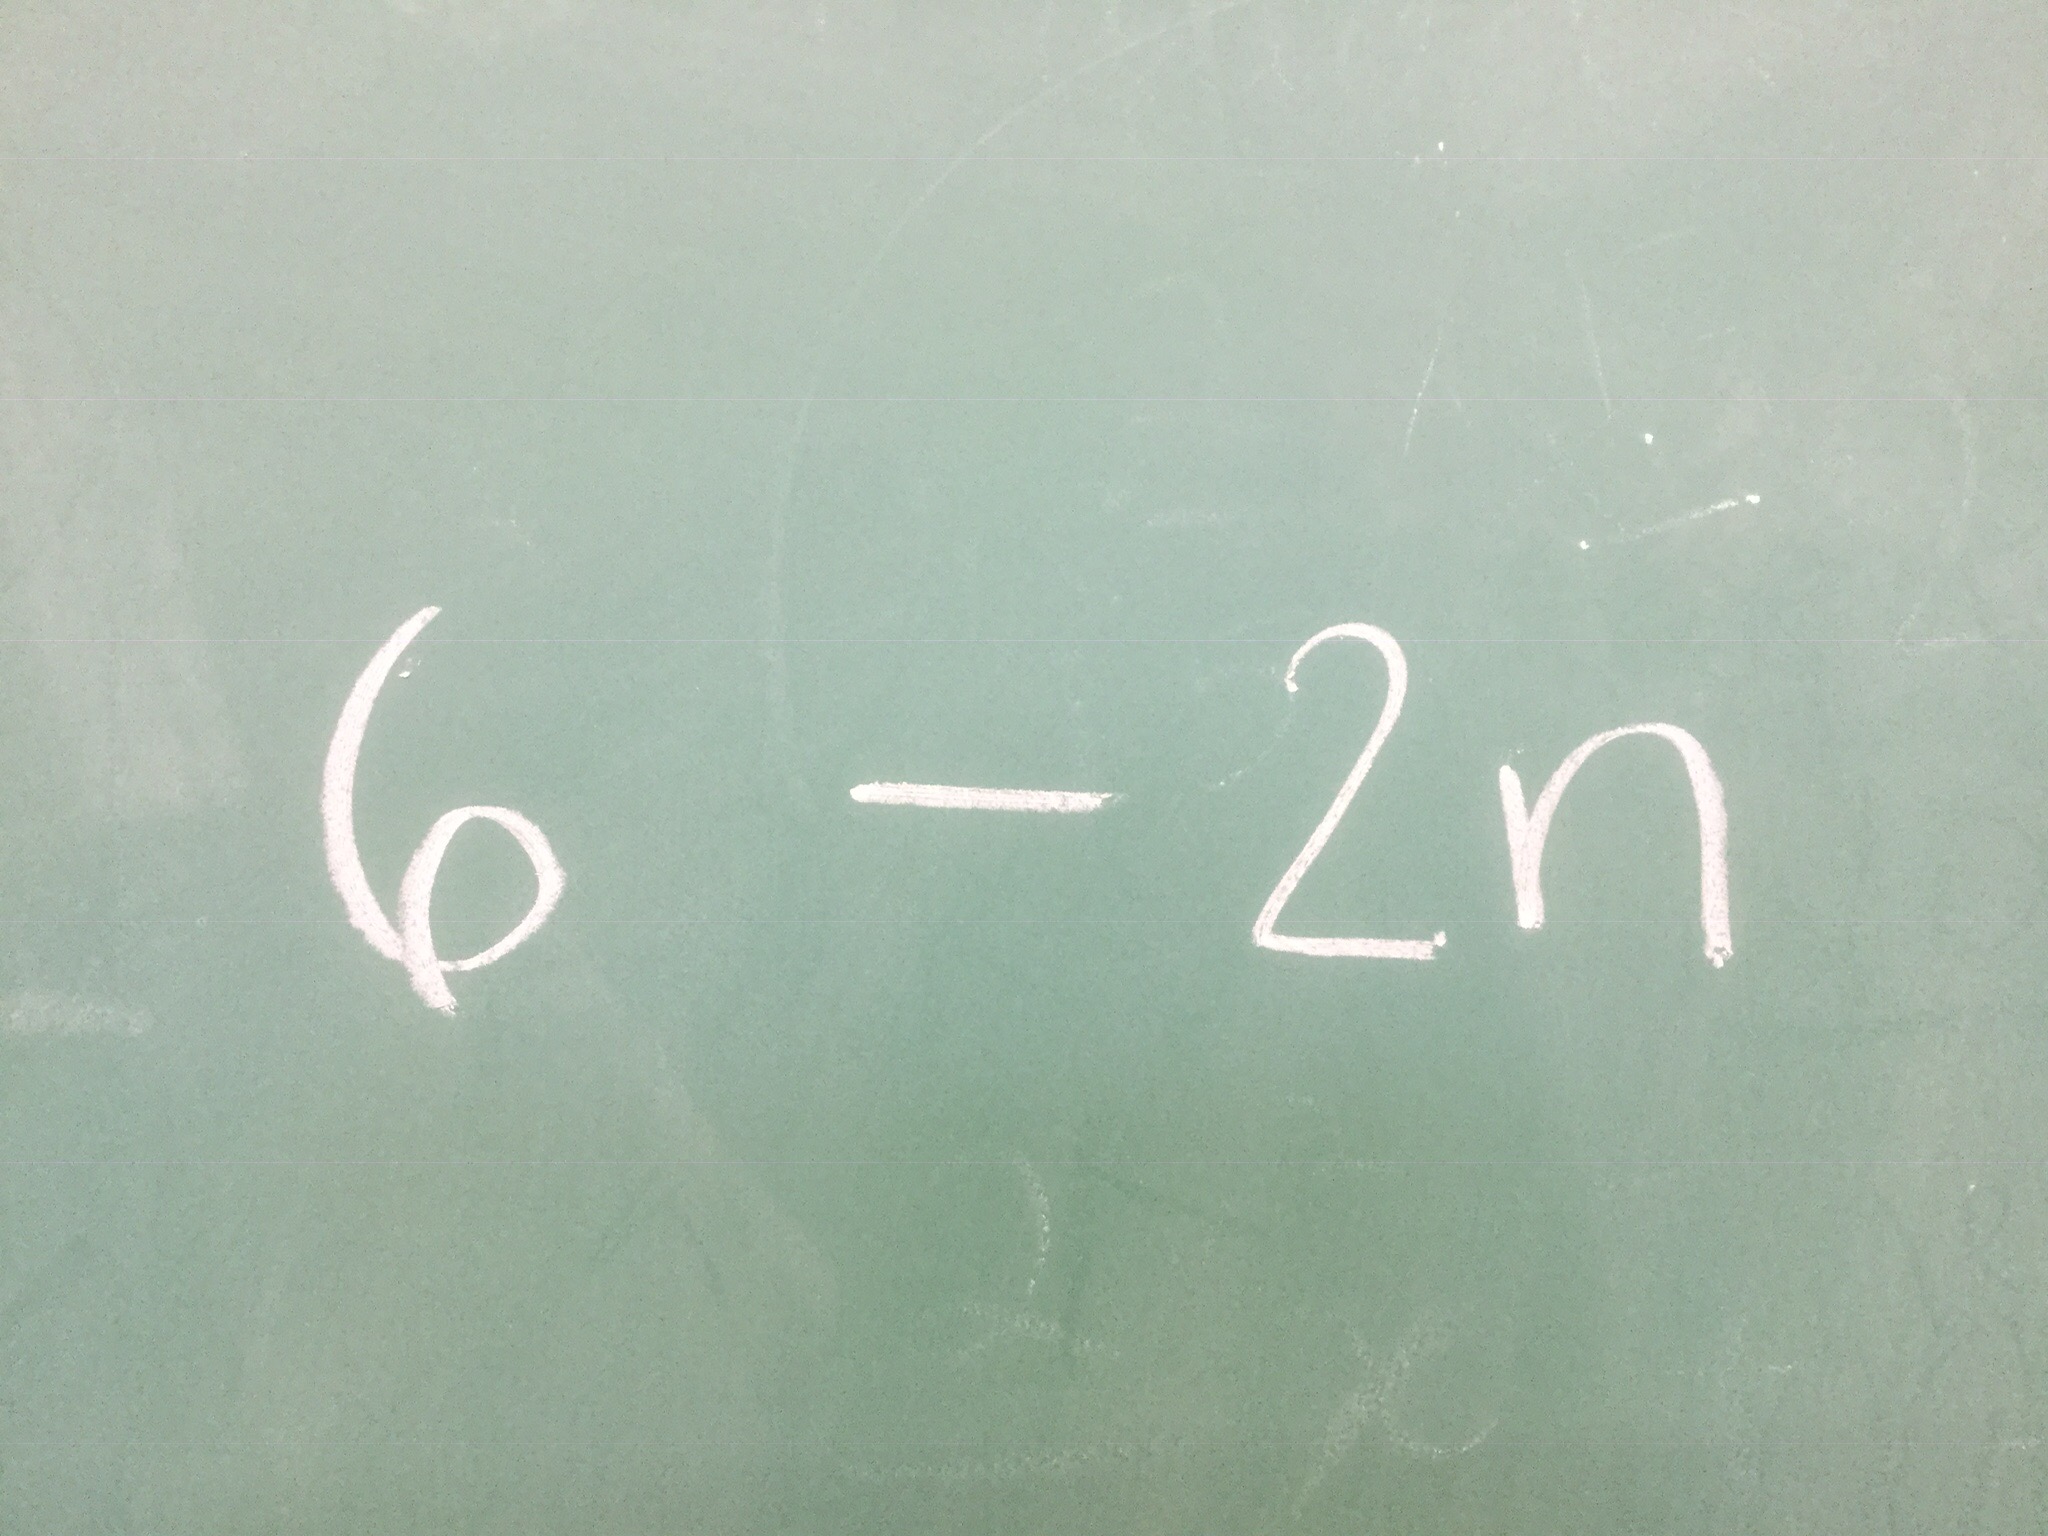
Our expression is 6-2n. We know that the constant is the number that isn’t beside the n. It is not dependent on n. It does not change…it is CONSTANT. In this image blue is representing positive, red represents negative and a sandwich of red on top of blue is equivalent to zero. We start with a constant of 6 blue tiles. And each figure number will have 2 groups of n that are negative (red) placed on the existing blue tiles. Figure 1 then is equivalent to 4, figure 2 is equivalent to 2 and figure 3 is 0 and figure 4 is negative 2.
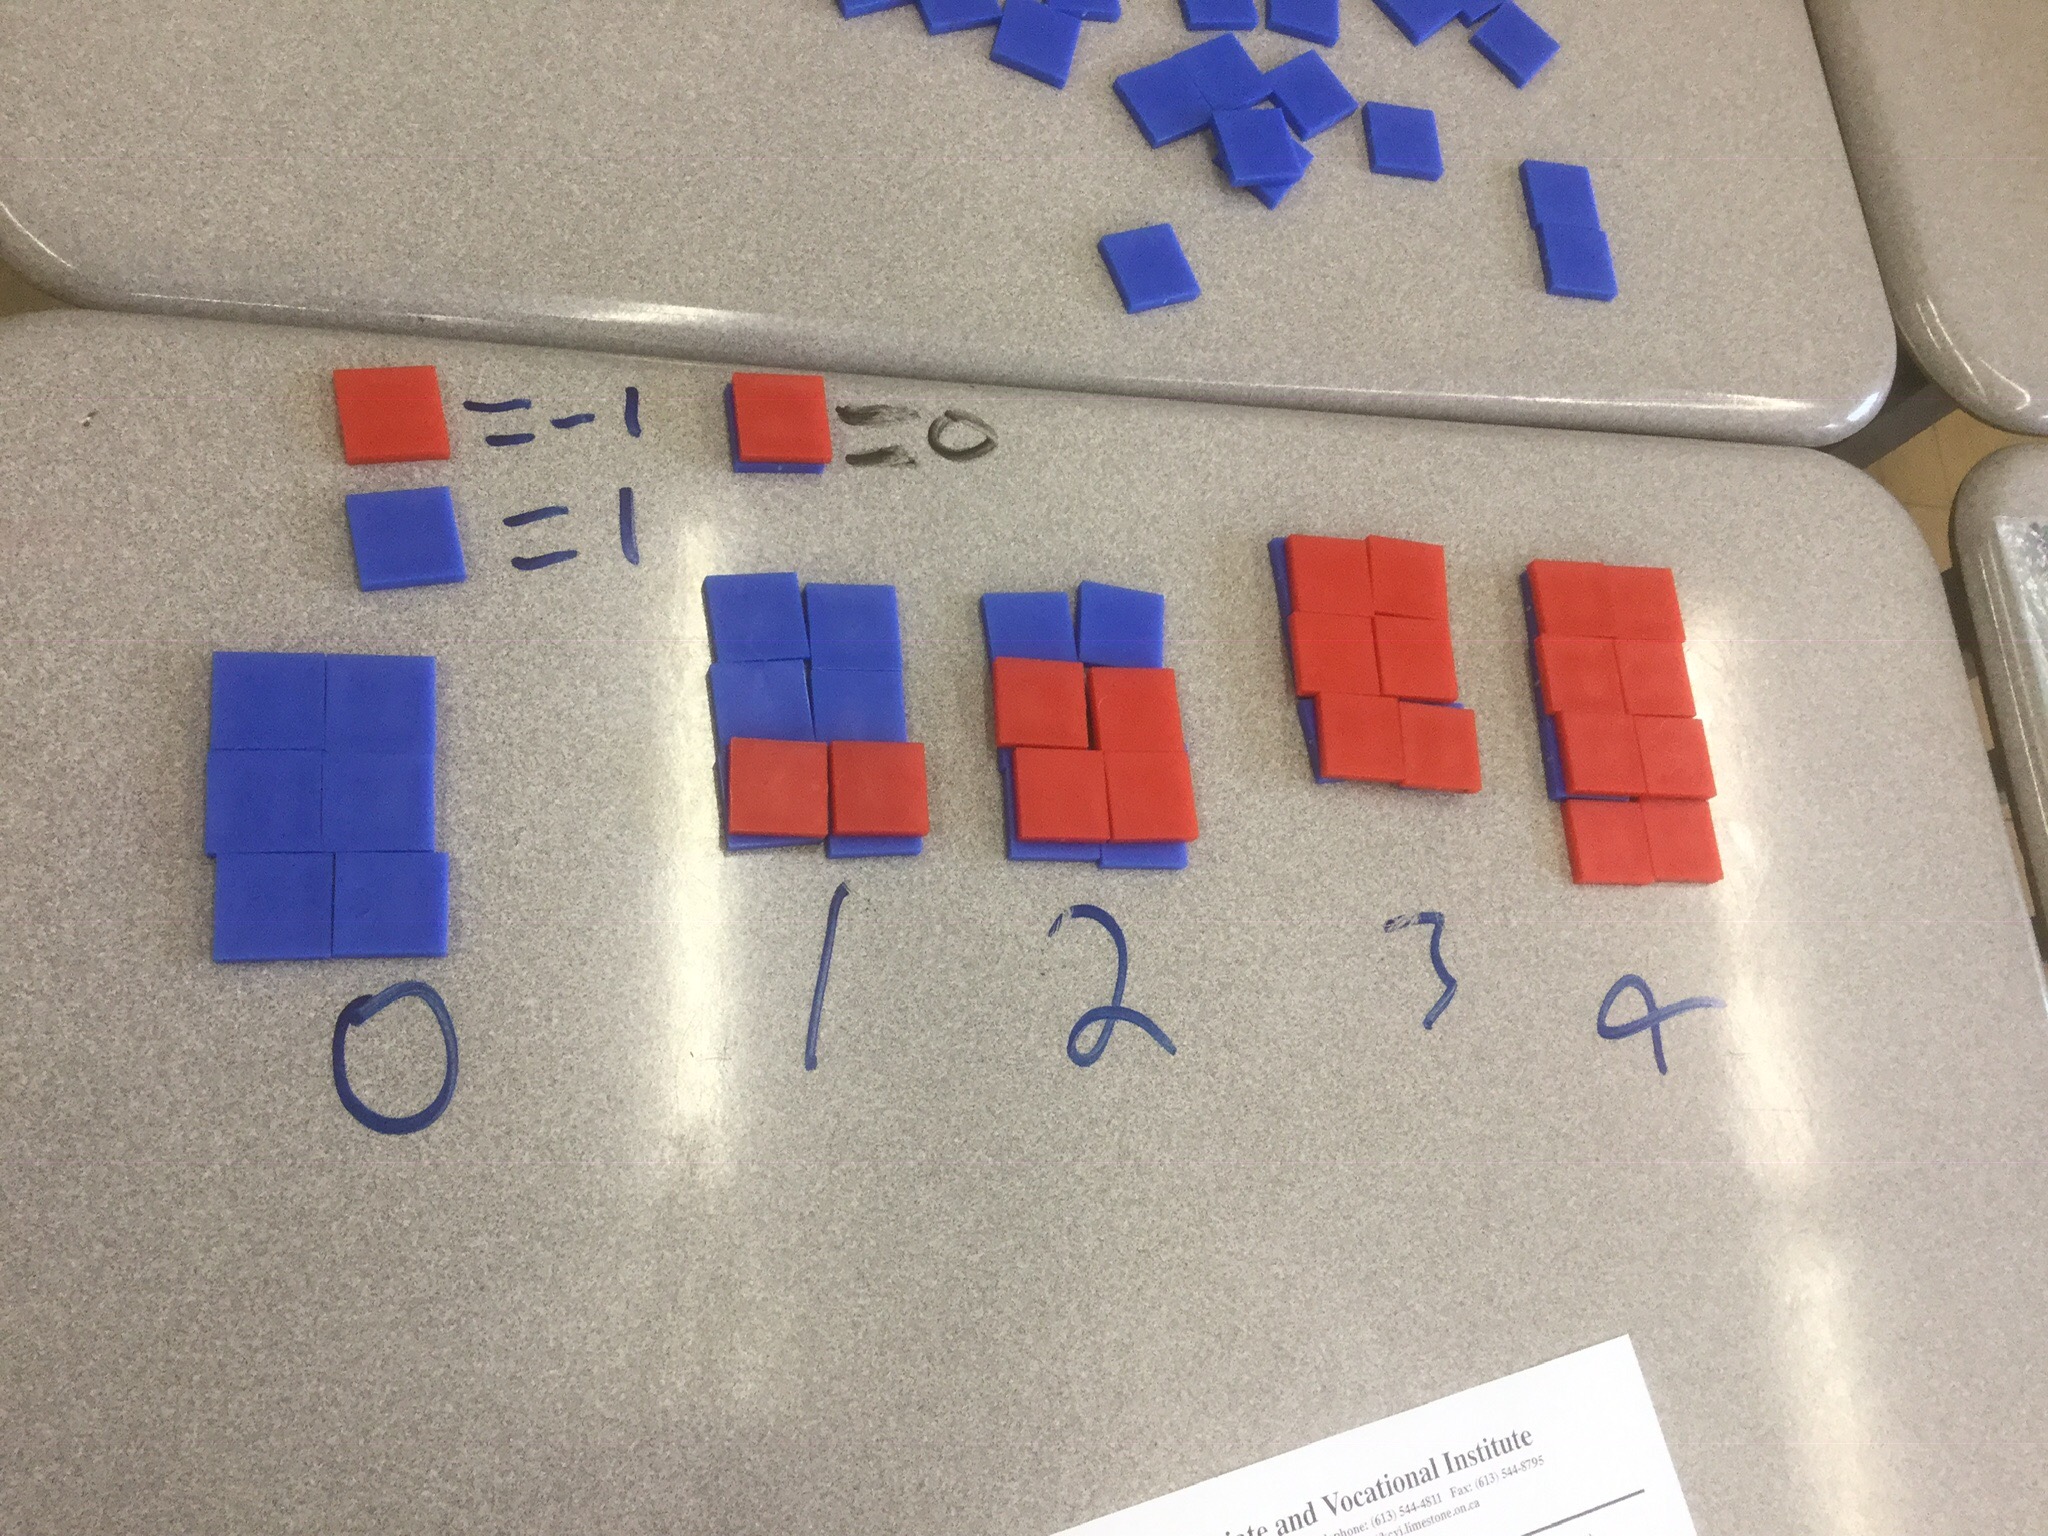
This is not the only way to see this…here’s another way to show negatives.
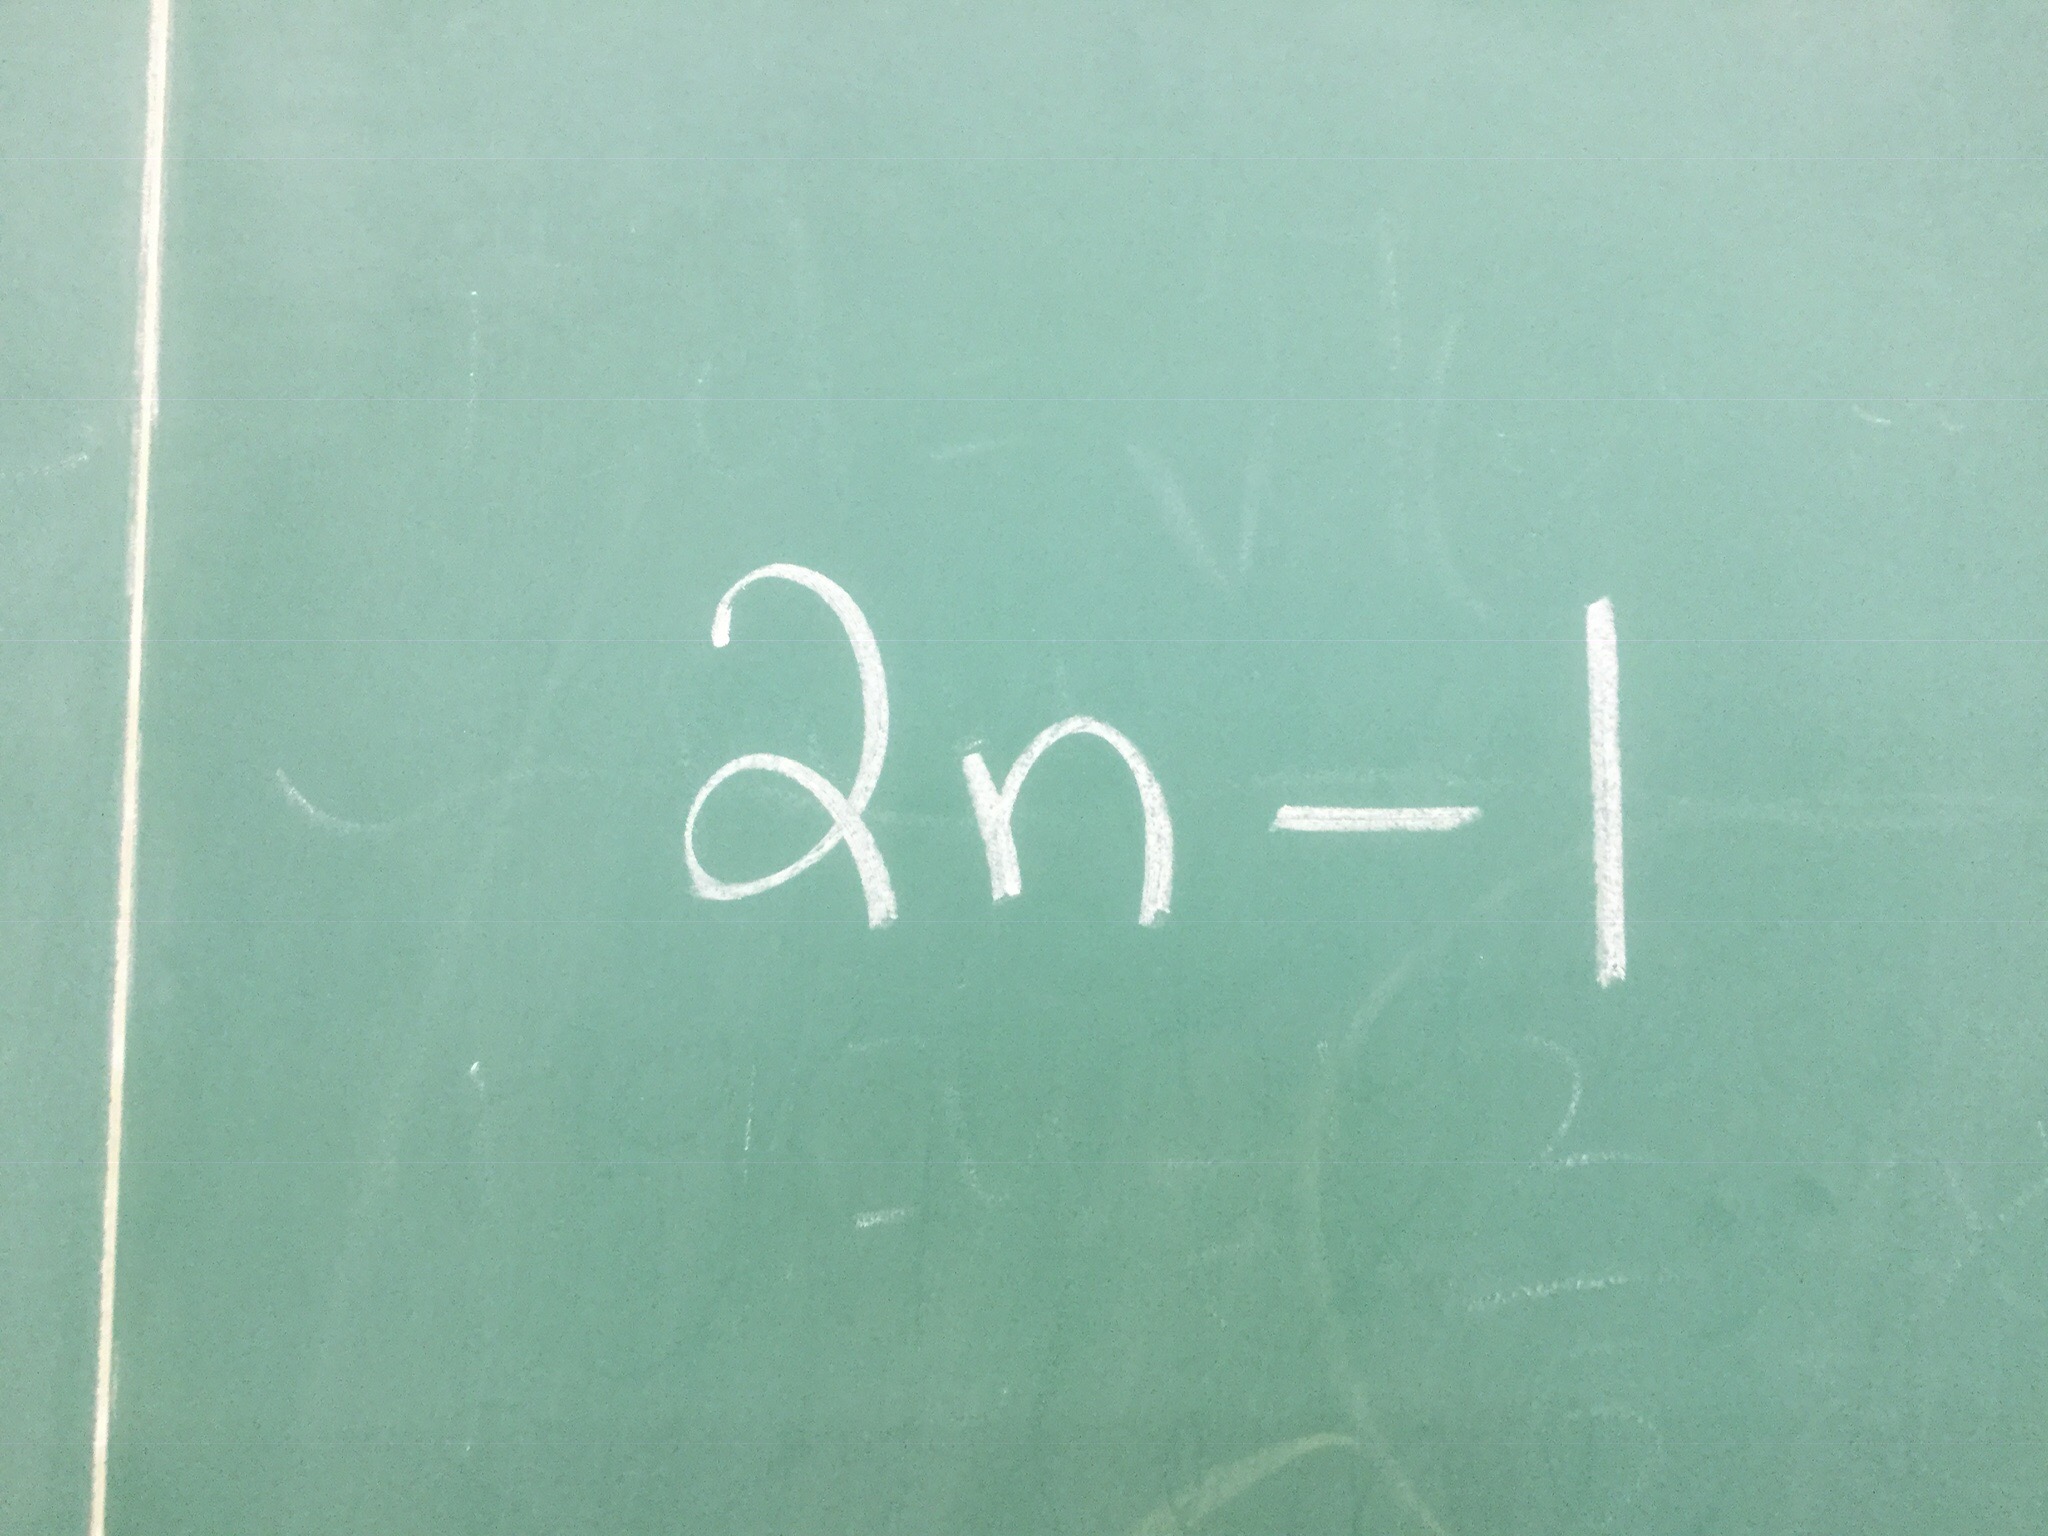
In this example the constant is -1 which can be interpreted as taking 1 away each time. This group shows 2 groups of n with one removed (dotted lines)
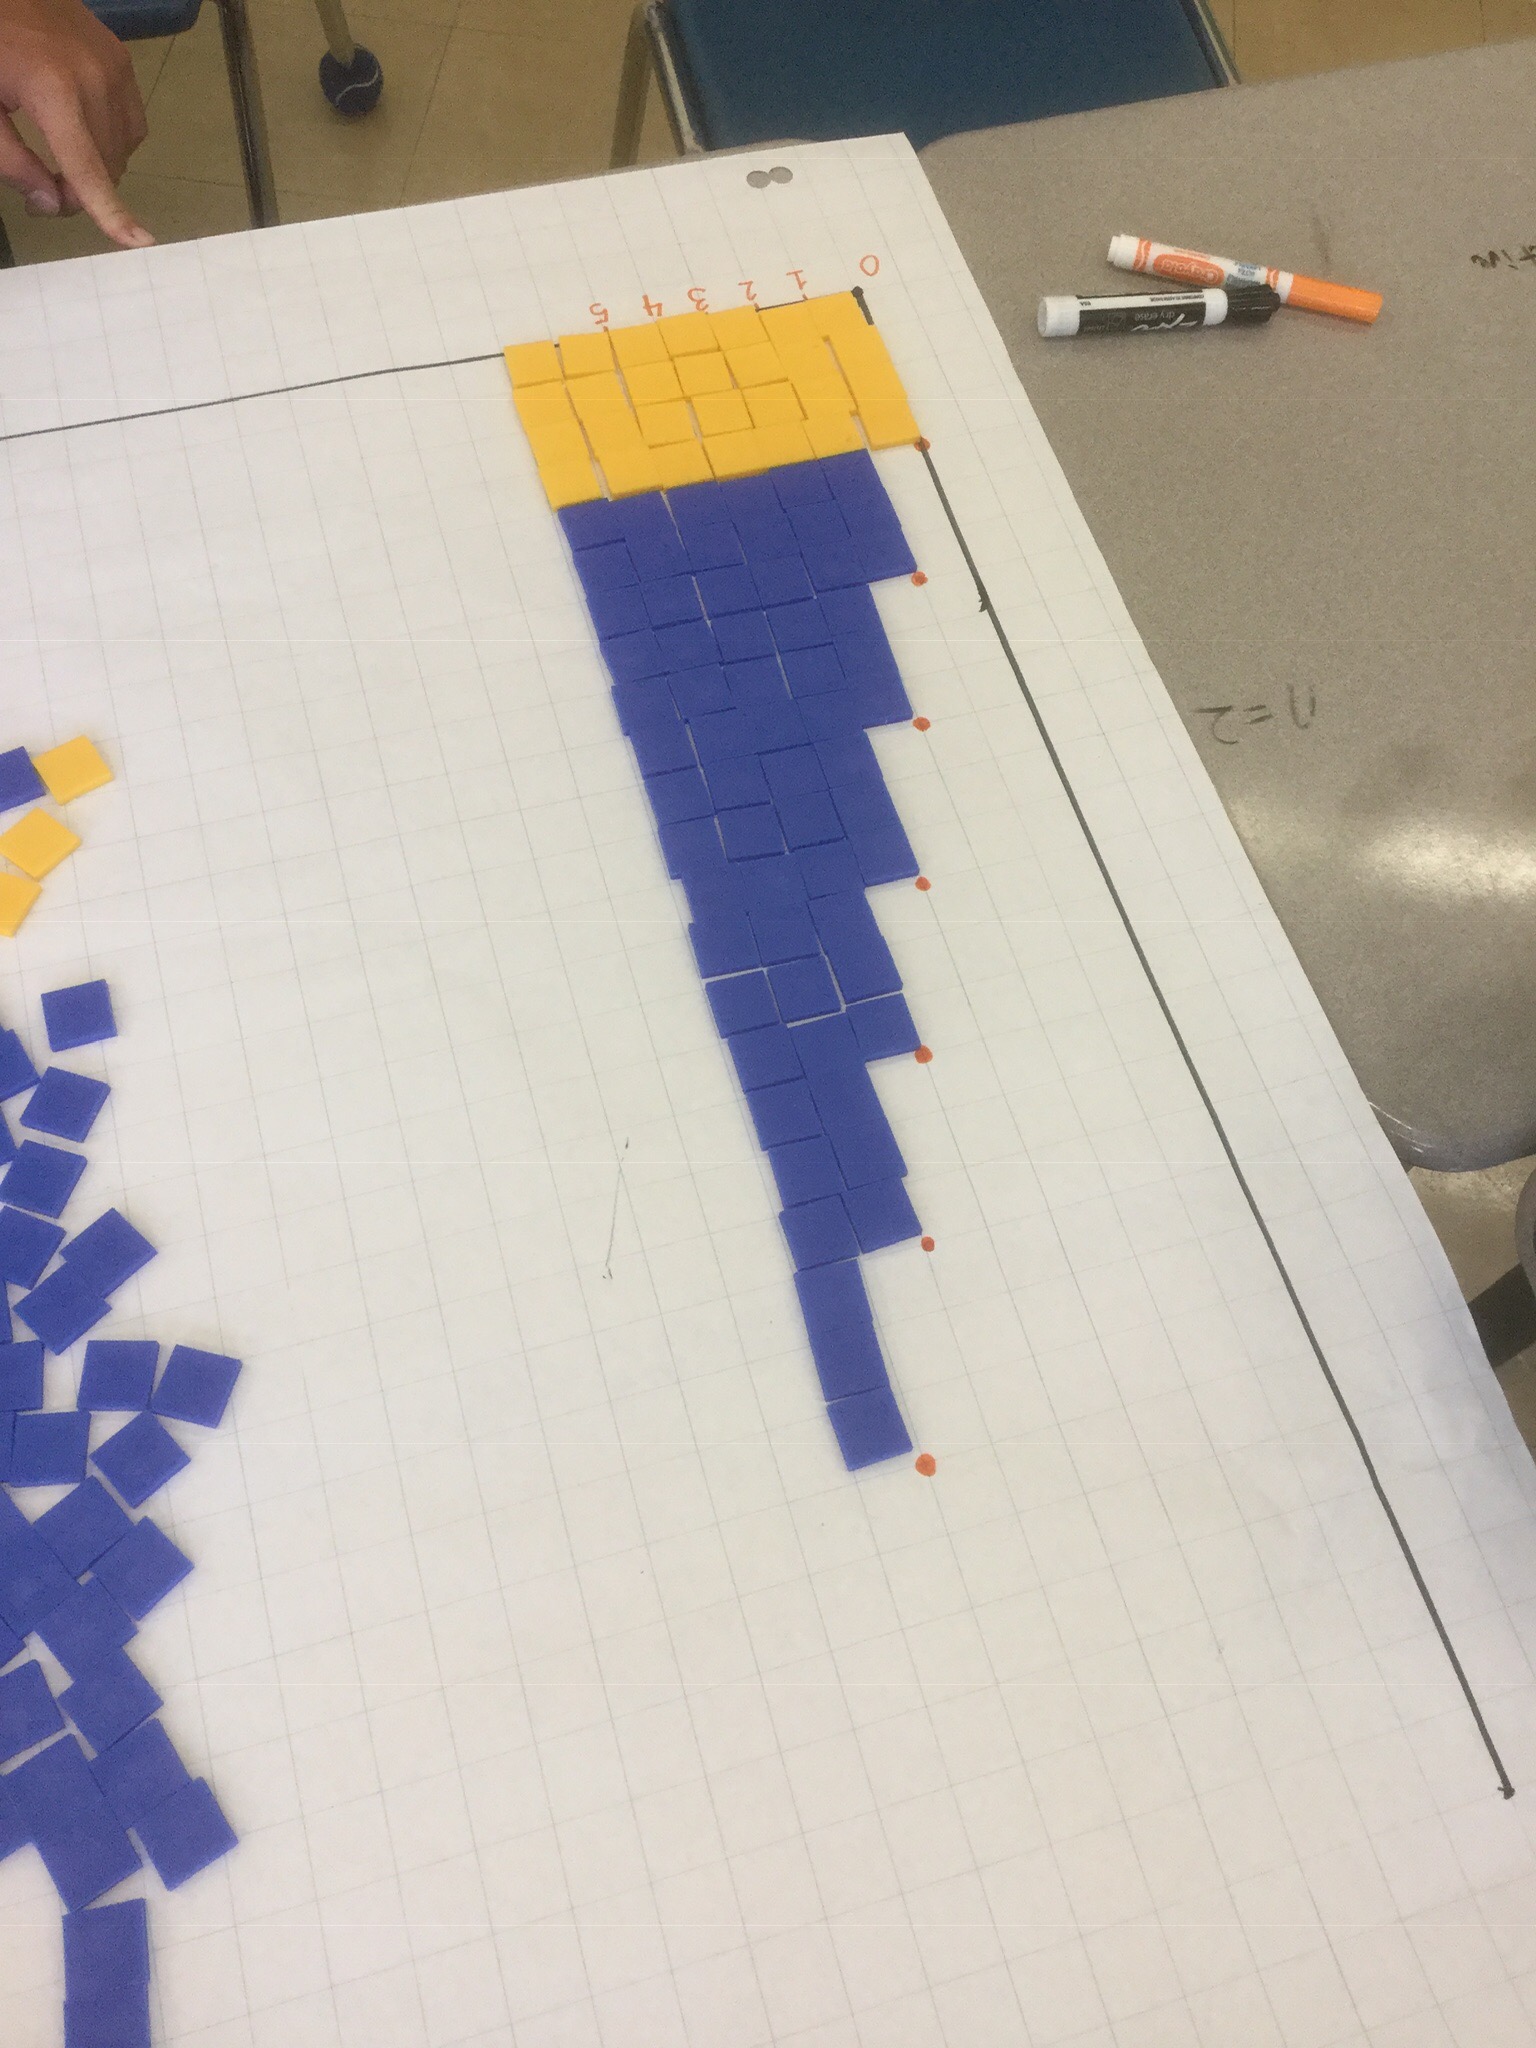
Each group was given 2 different expressions to build on their graph. We used the big chart paper because our tiles are the same as the squares. We lined up all the tiles from each figure vertically, and put a dot with marker on the top left corner of each column.
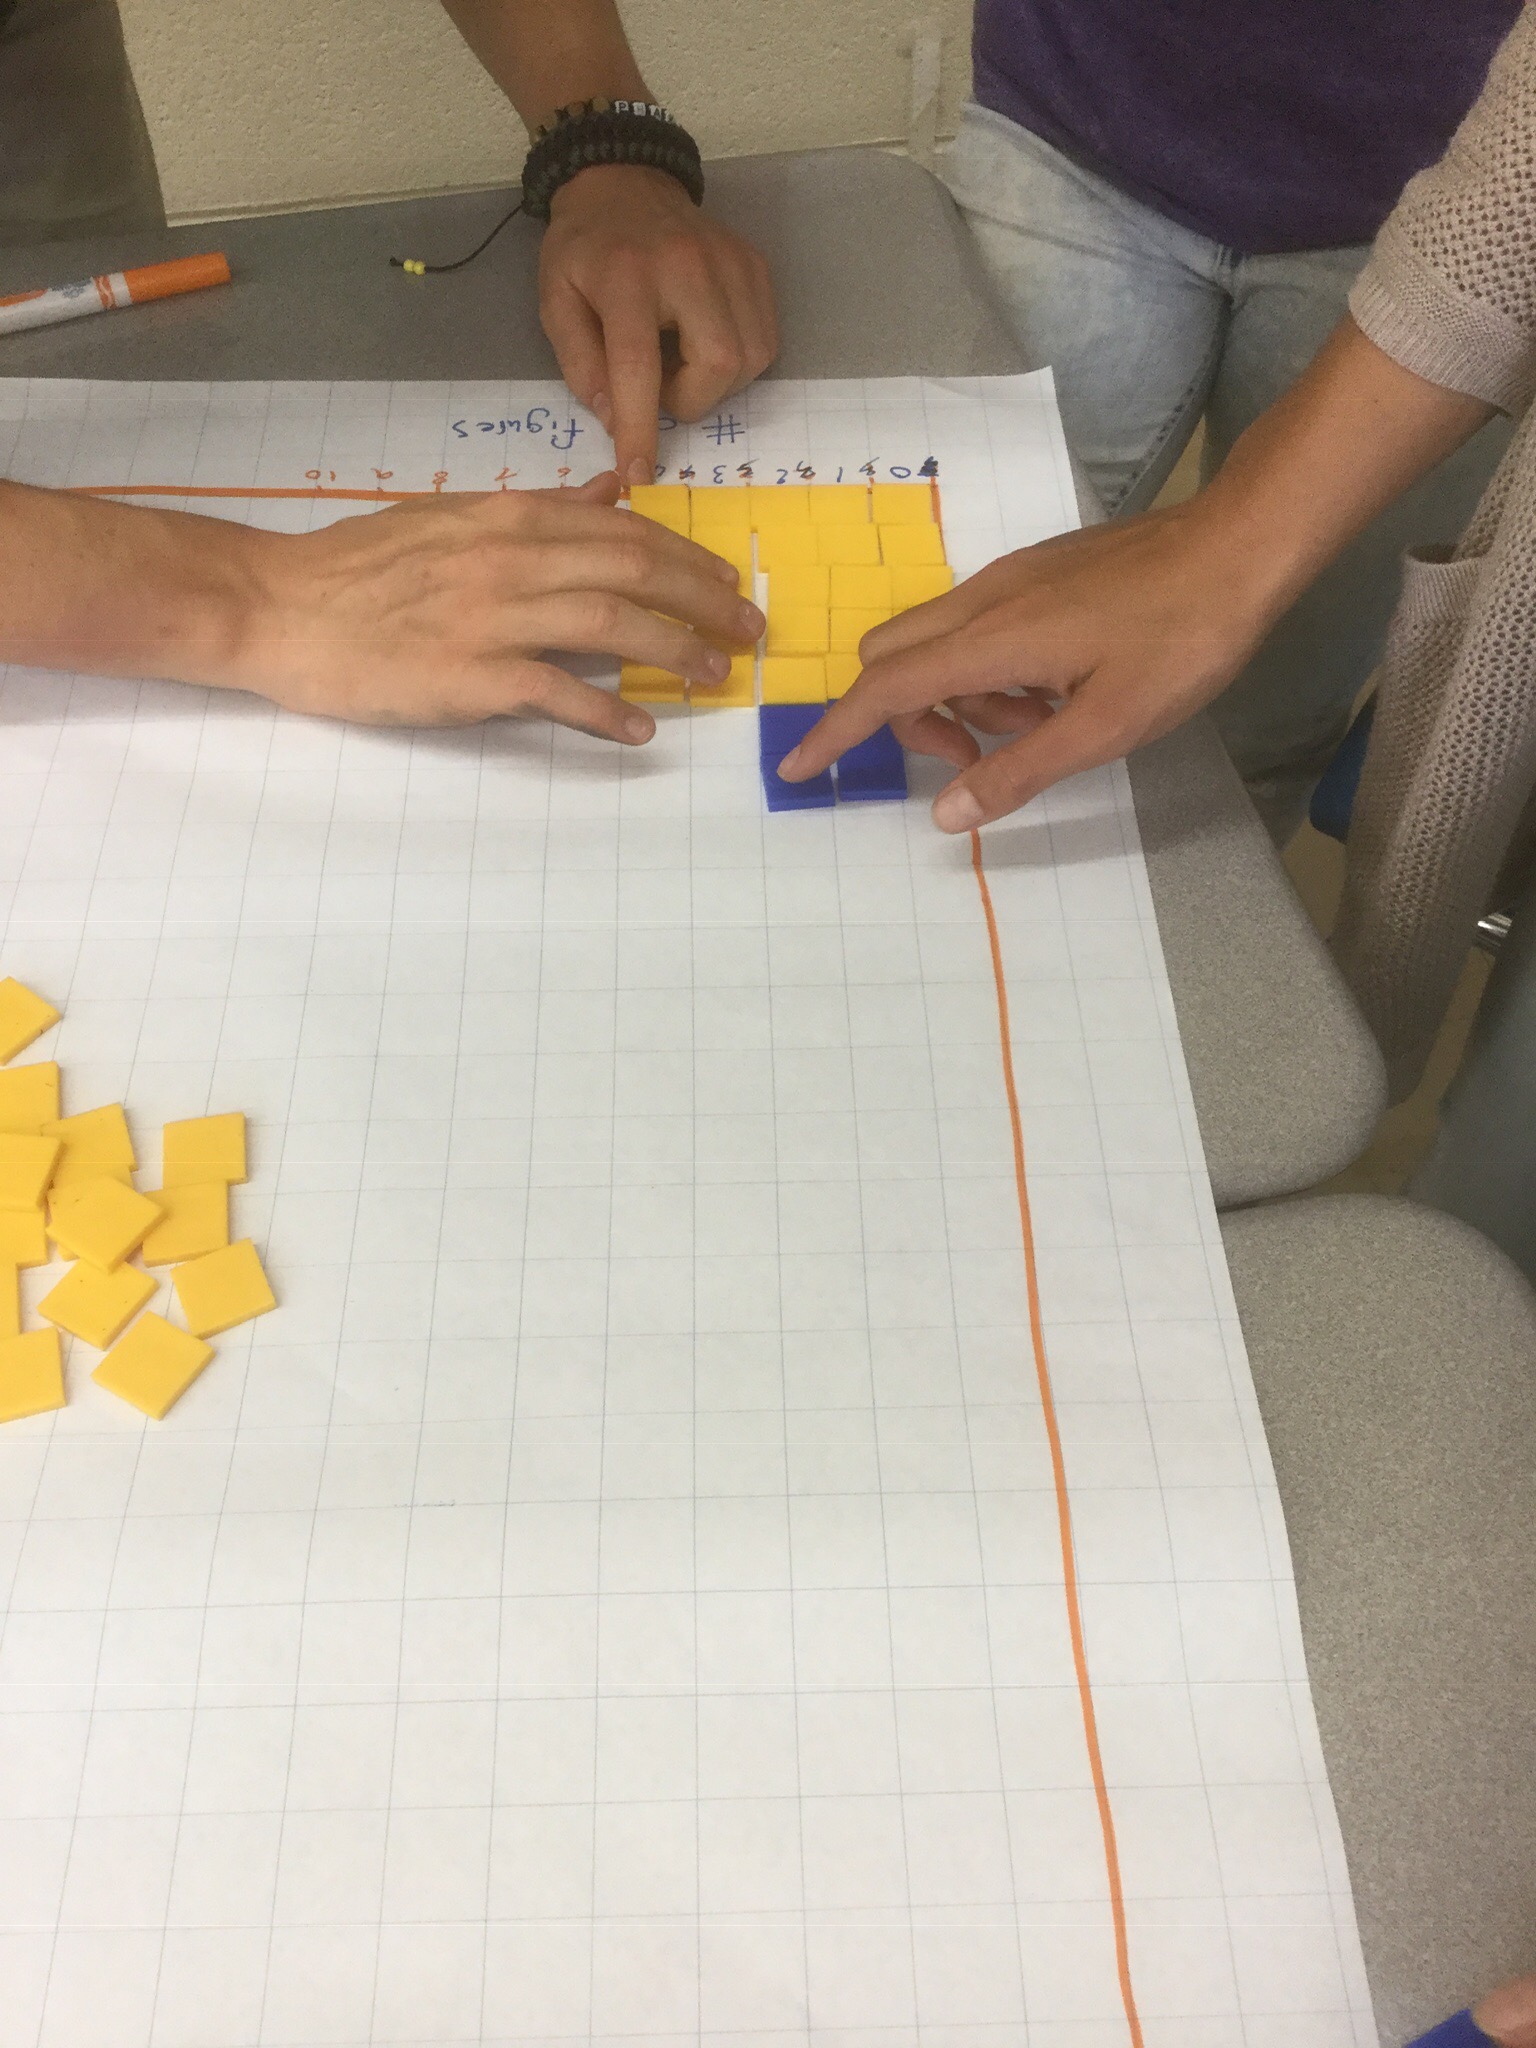
These dots (when the squares are removed) show the linear trend described in the expression. In this case it is 3n+4. The colours are being used to show the constant (yellow) and the growth. We are seeing 3 groups of n each time. We also noticed that the pattern looks like stairs, going up by 3 each time.
We posted all of our work up to admire and examine. We are really good at naming the trends we see in the graphs. We continued to use our new word “ordonnée à l’origine” (y intercept) and we connected that to the constant in the expression and the pattern. That is the same as figure zero.
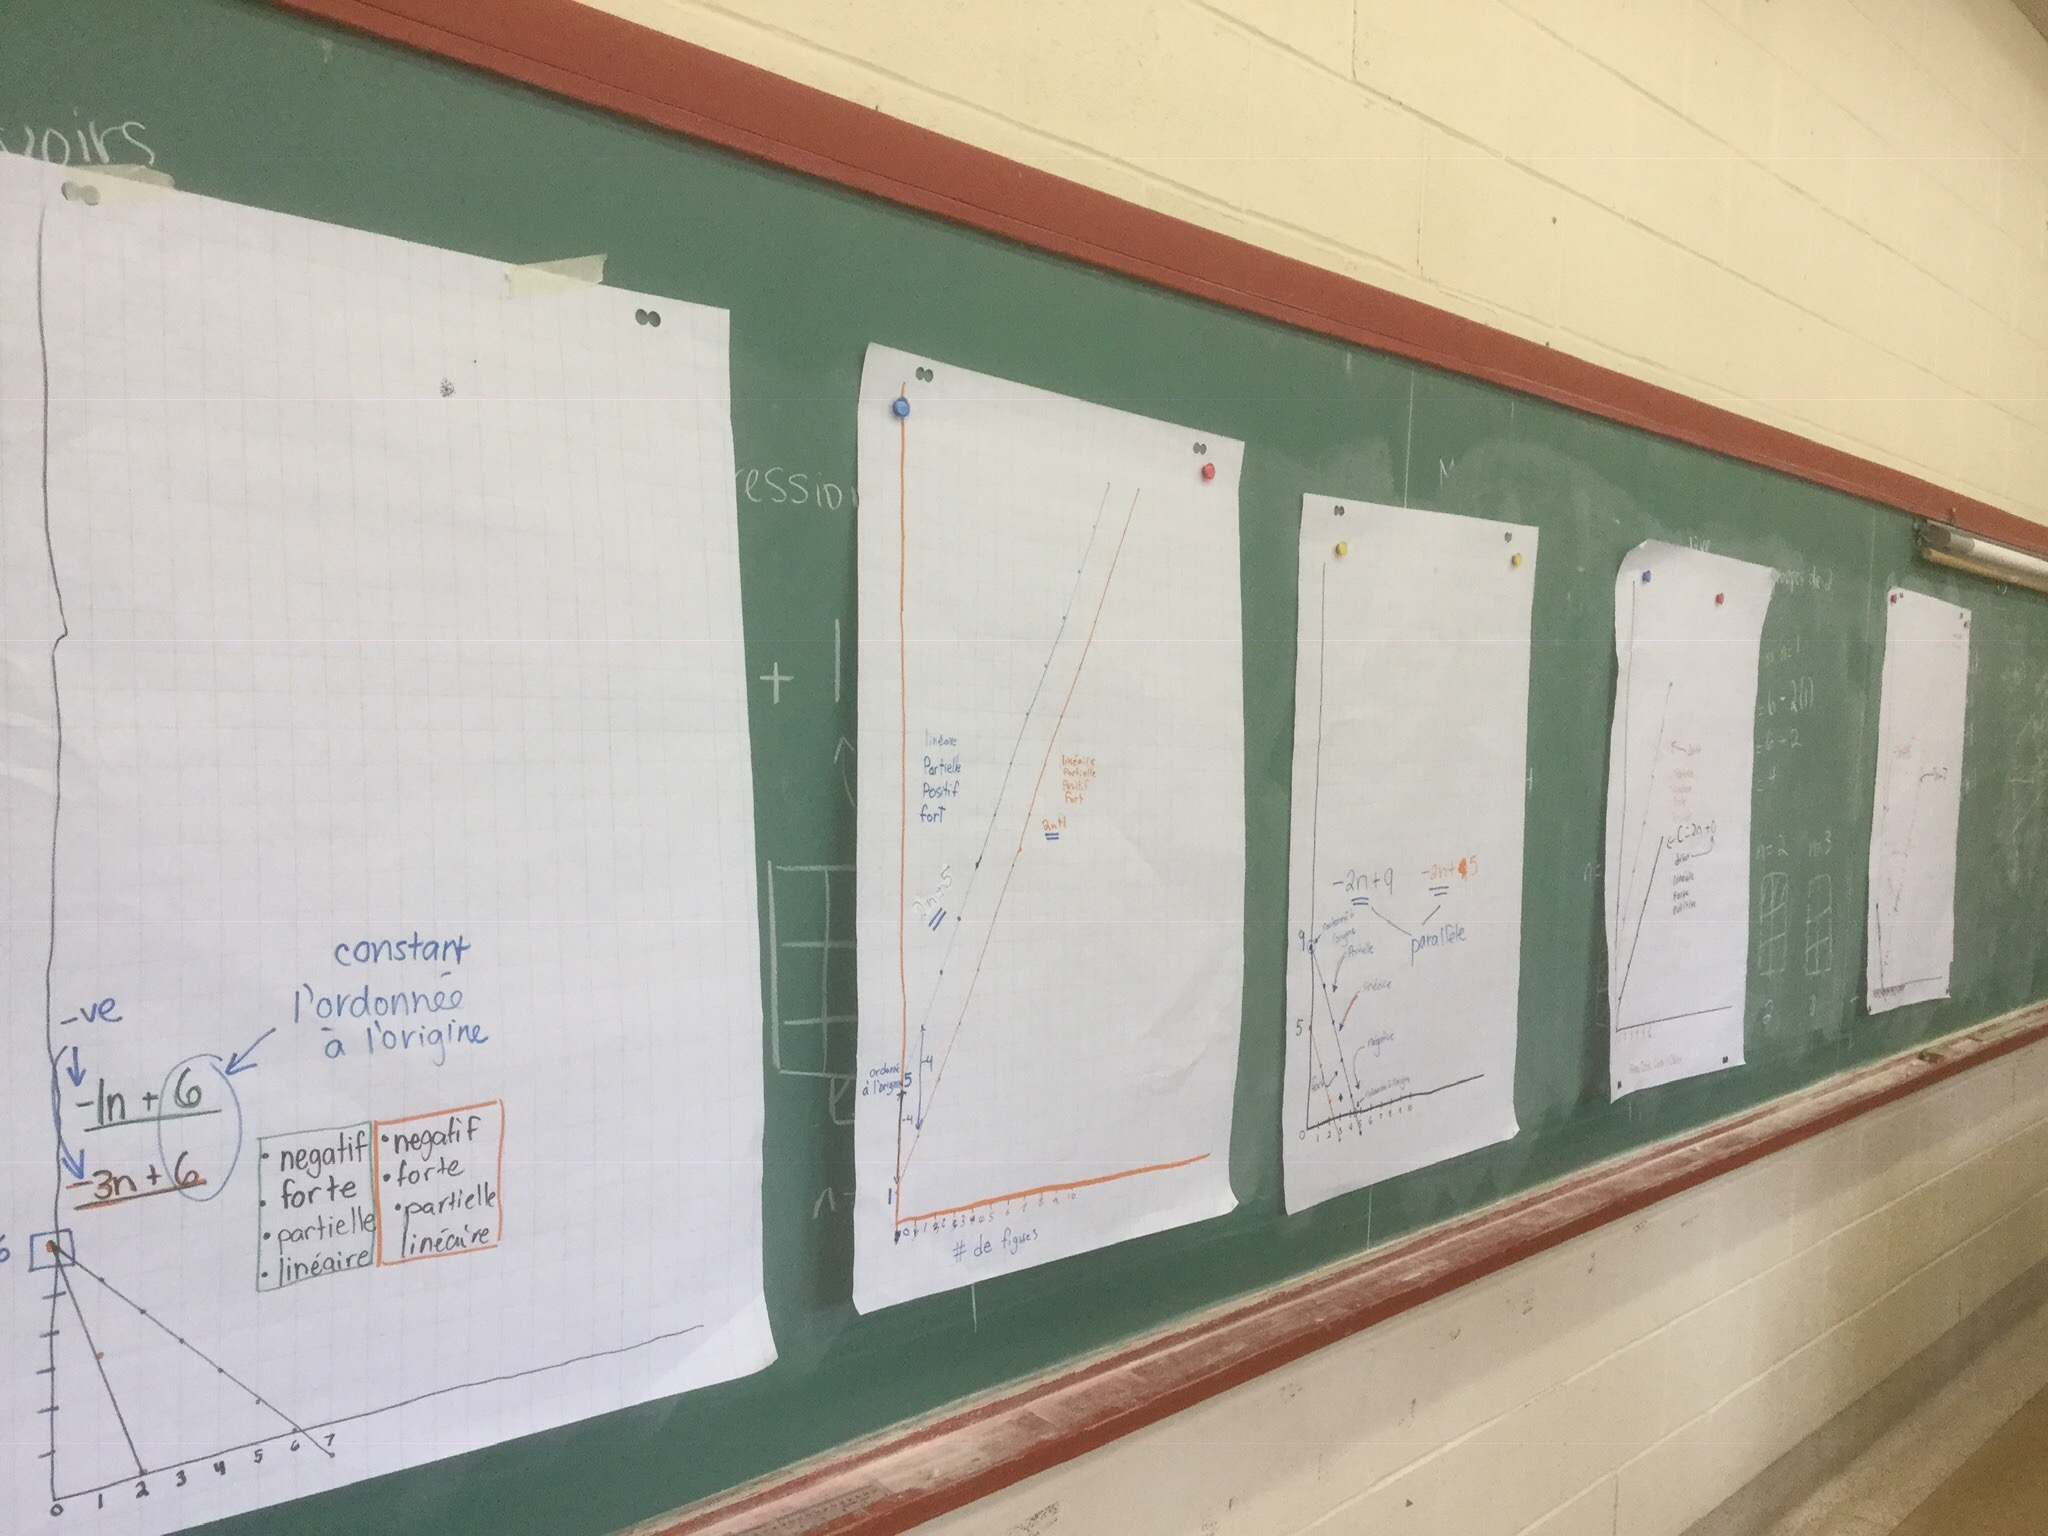
We looked at positive and negative trends, we looked at parallel lines…those have the same coefficient in the expression….the word we use for that is “taux” (rate)
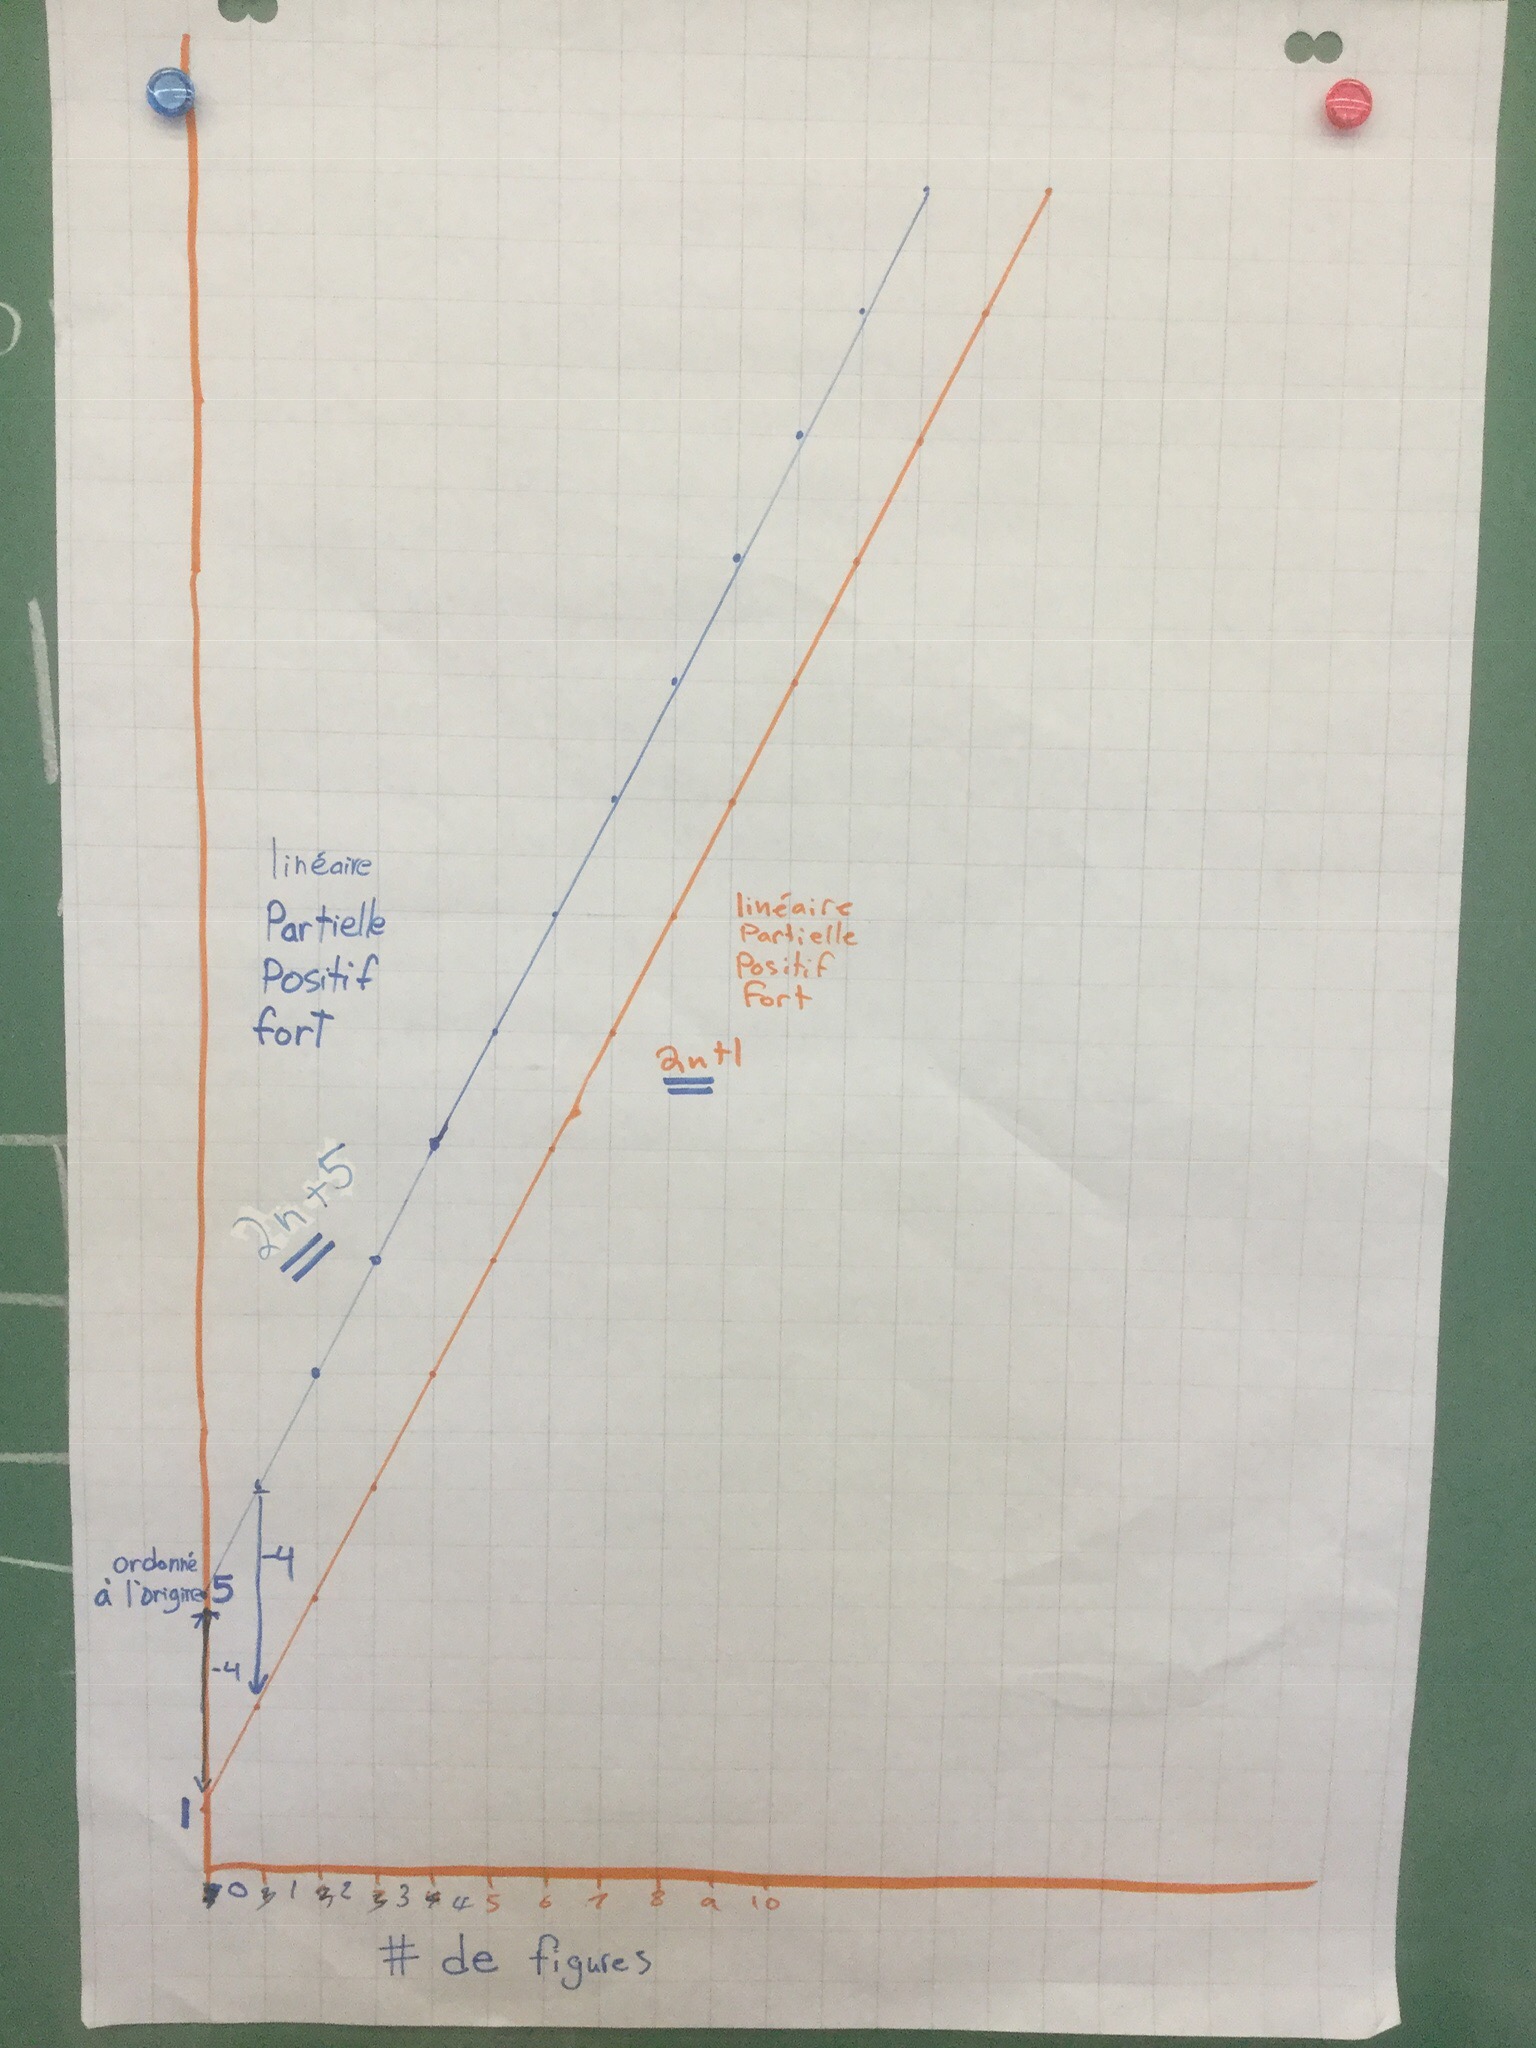
We also noticed that the bigger the rate, the steeper the line, because the stairs are each higher.

We are now pretty comfortable working with visual patterns and extending our patterning to a graph. We’ll get to show what we know tomorrow on a quiz.
The Power of YET!
If you missed class today please give this video 11 minutes of your time. The message is worth hearing, maybe a few times!!
We are working on developing a growth mindset.
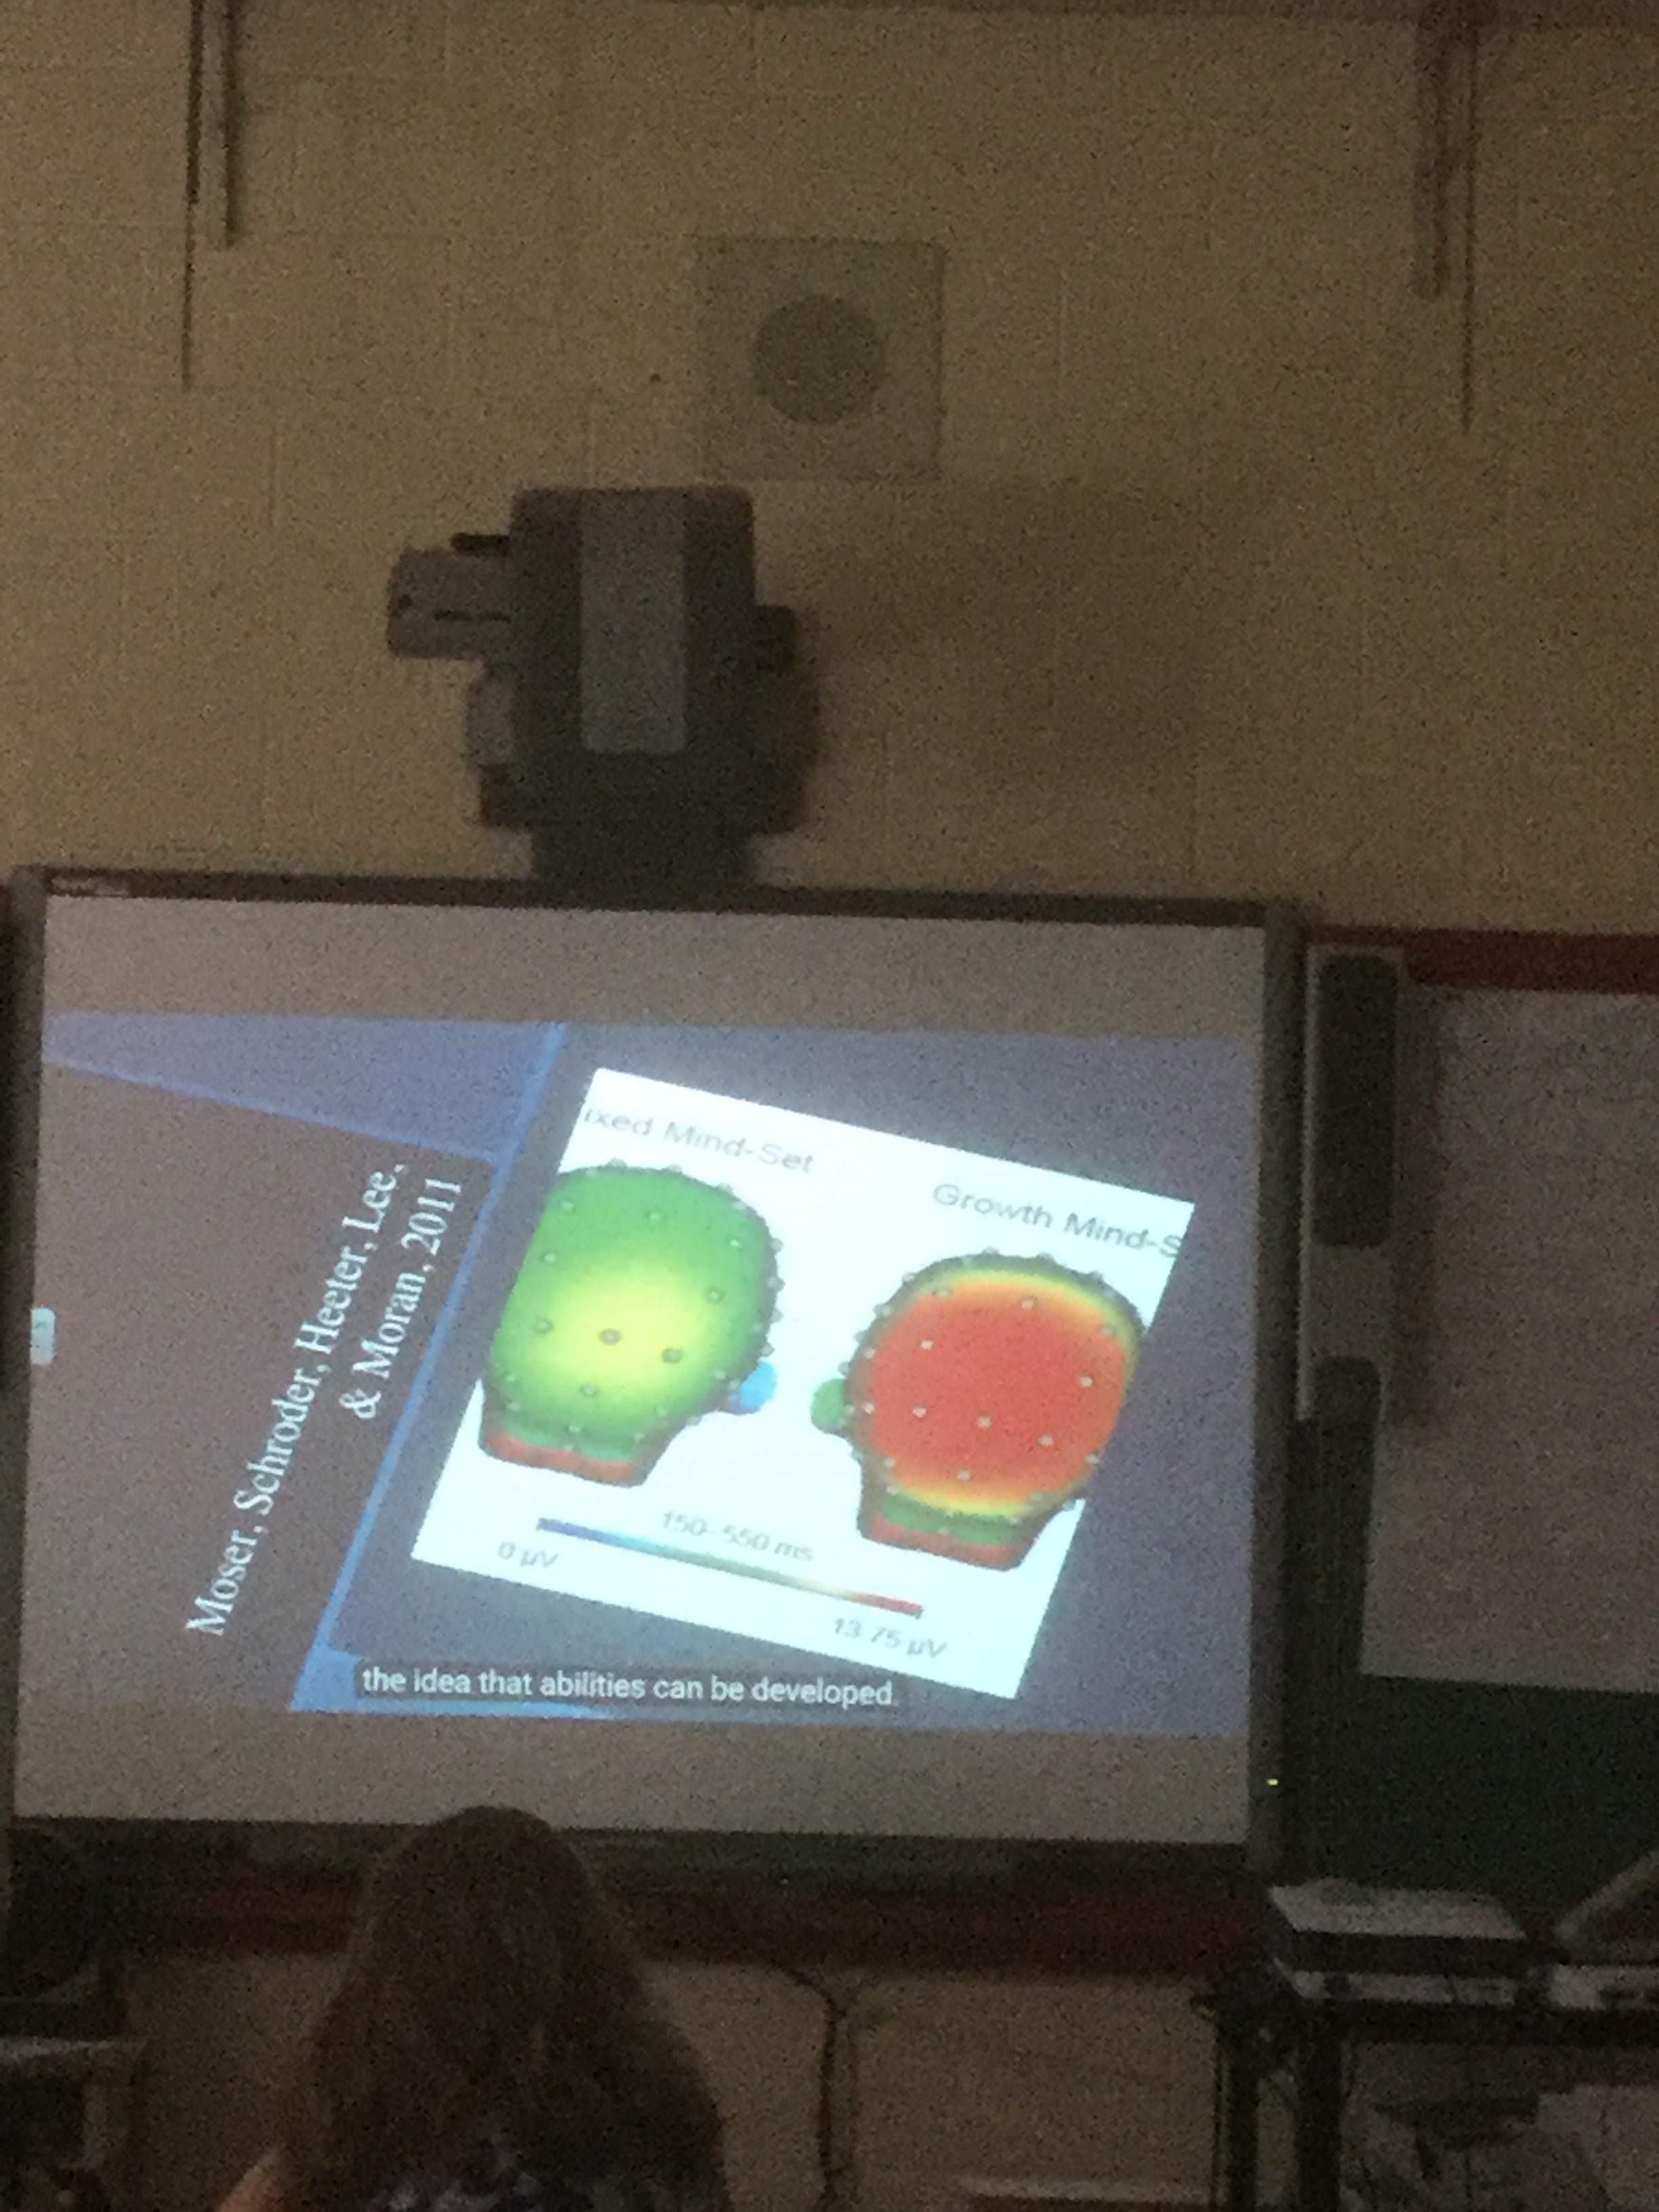 Today we got our first summative back in grade 9. We are working on error analysis sheets now to dive into our errors, and get to the bottom of things. We will classify the errors that we make as “inattention”–the “oops” kind of errors where you just don’t think. “Calculation” where you went wrong with integers, order of operations, or exponents etc. “Precision” where you don’t communicate things clearly, miss phrases/headings/units, or things are a general mess, and “Problem Solving” which would be errors like not having a plan, not knowing where to start, getting stuck and not having a strategy.
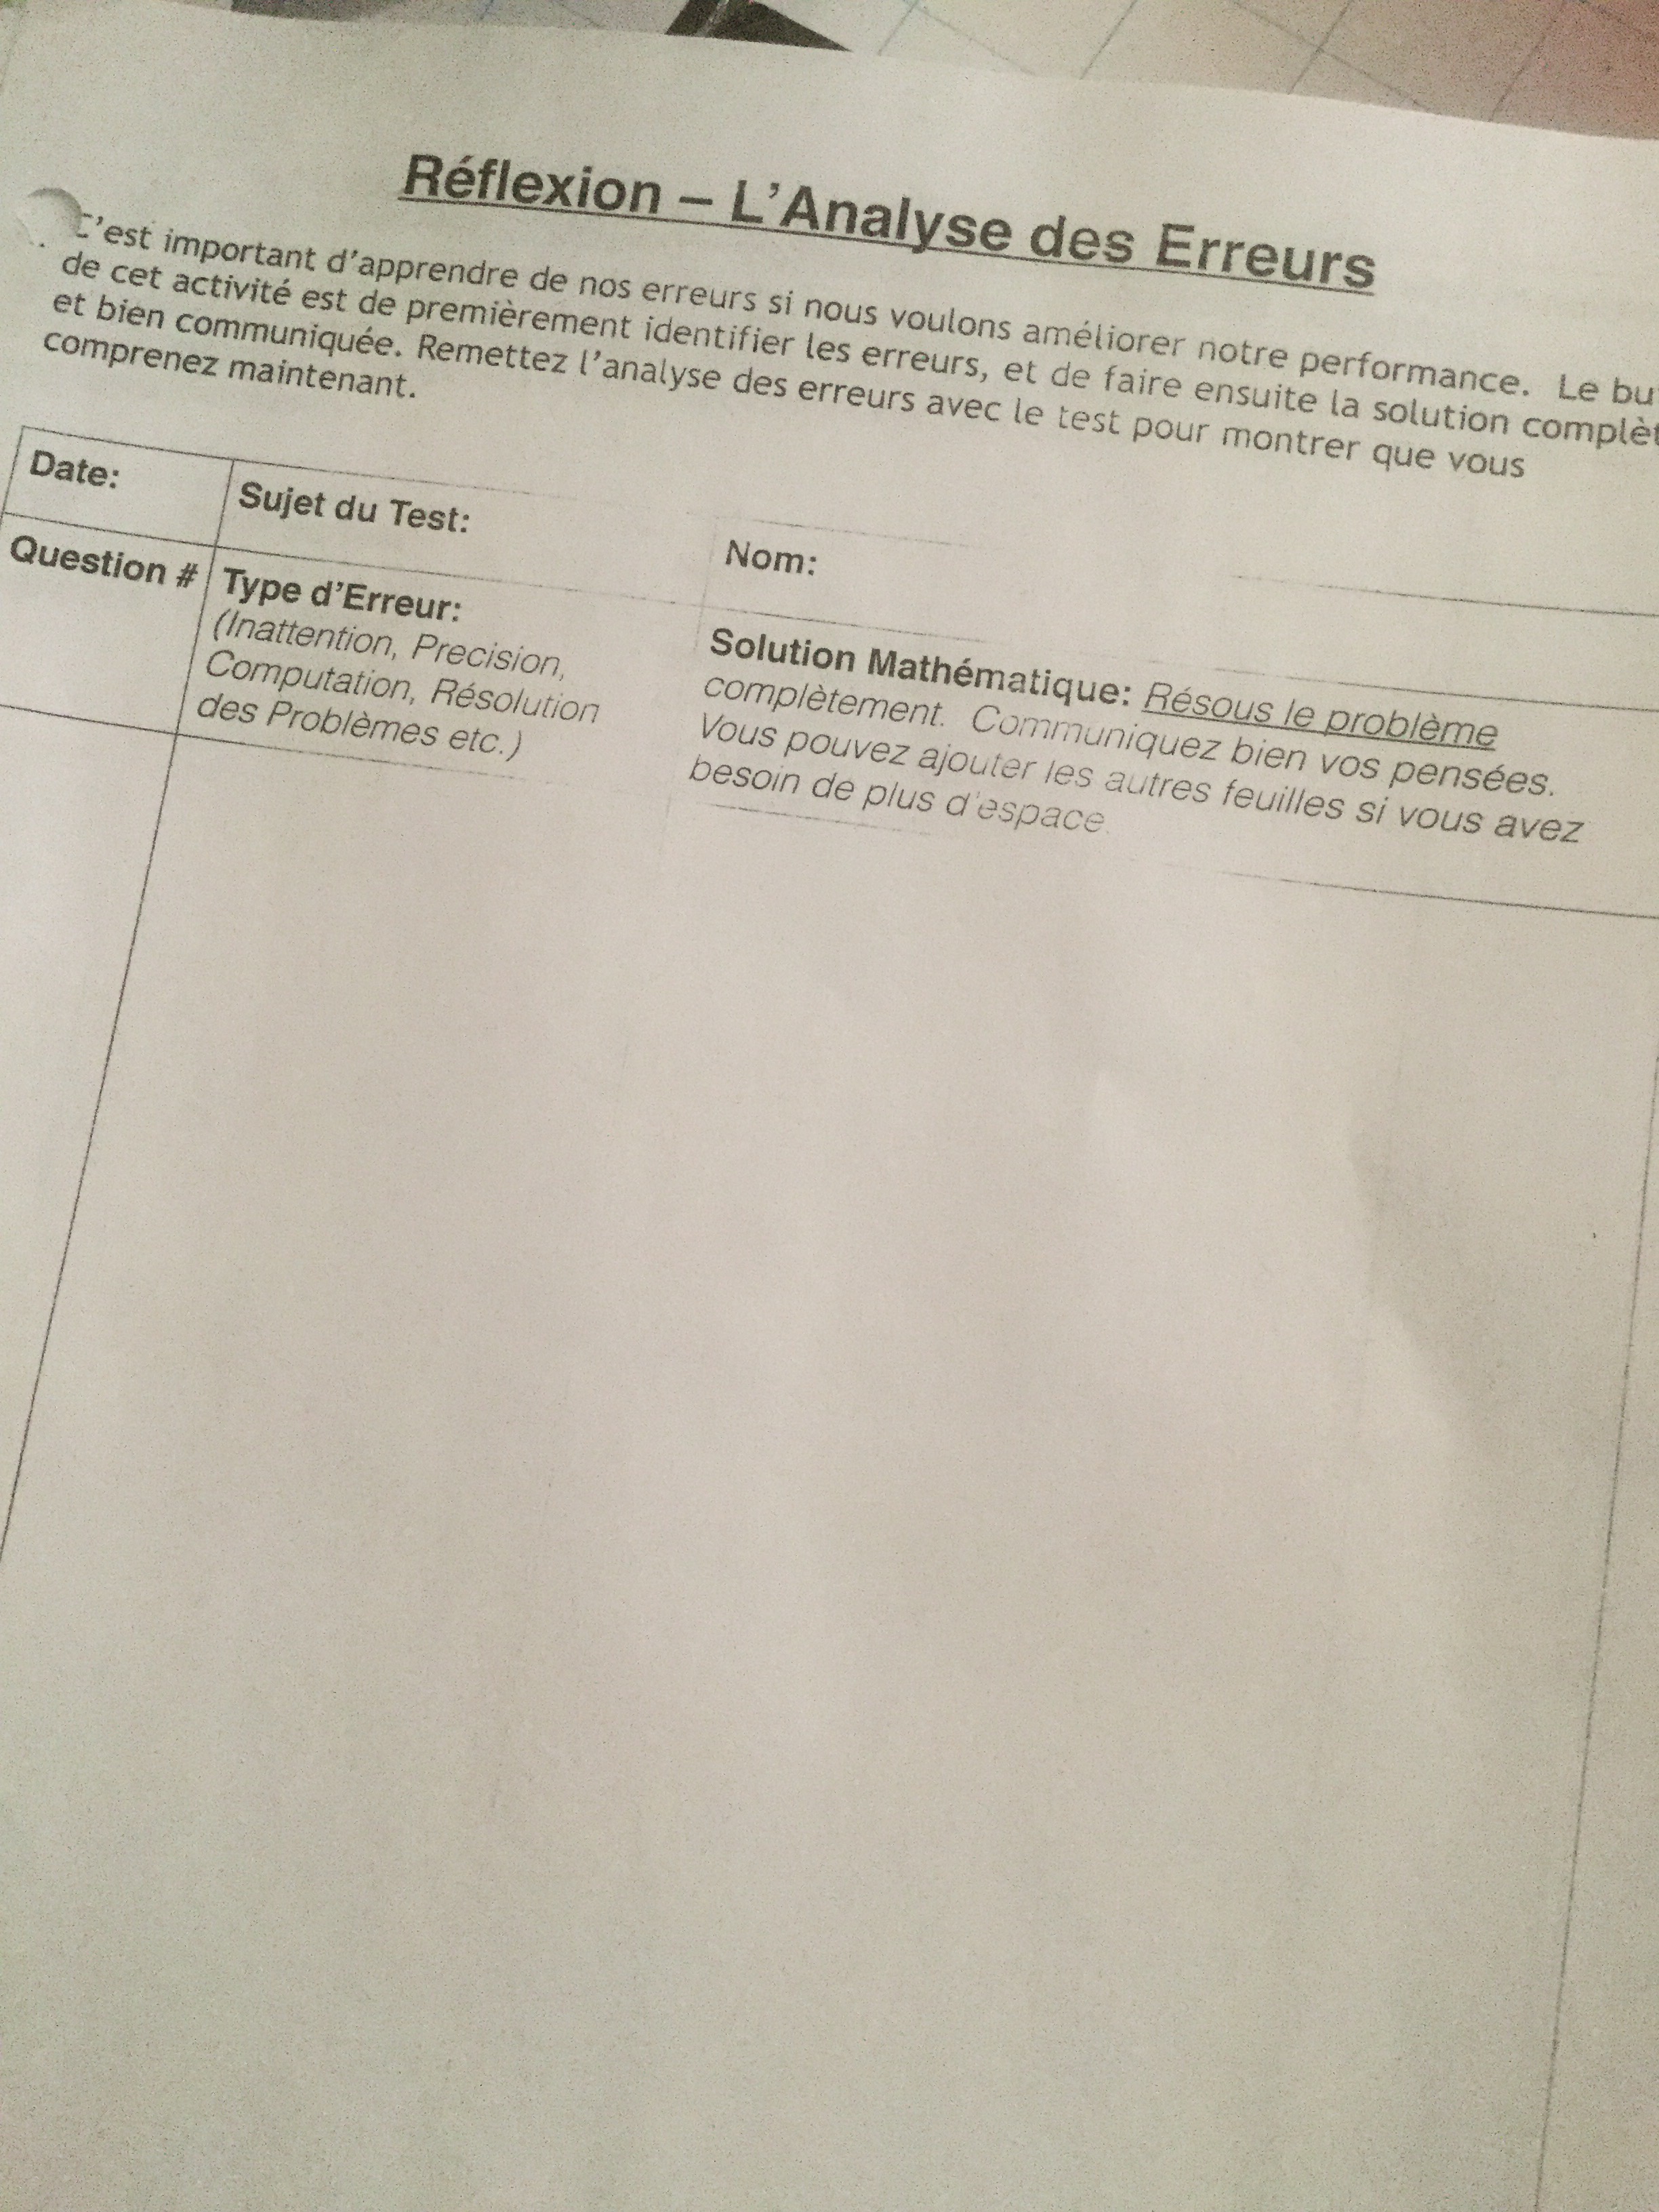
We also noticed that some of us had trouble with other test taking skills like time management, or knowing that there was a backside to the page! We have called these errors “strategy errors” and we’re making note of things like–“I didn’t have a plan and got stuck on a question and couldn’t move on…” or “I wrote WAAAAAY too much for one question and gave maybe more than was needed and ran out of time”… or…. “I didn’t read the question and I calculated area instead of volume, and then I realized and I had to do it all over again”…. or “I used trial and error and it took me forever to do one question…so I ran out of time”
There’s also a column to write the correct solution to the problem. It’s important to face our errors, and learn from them. They help us see what things we overlook, or what things we don’t know well enough….YET.

